MABTON GREEN PROJECTS - · PDF fileSludge Dewatering Reed Ben, Pine River, Minnesota ......
41
MABTON GREEN PROJECTS Water & Energy Efficiency Alternatives Study C C i i t t y y o o f f M M a a b b t t o o n n , , W W a a s s h h i i n n g g t t o o n n Prepared For: THE CITY OF MABTON 305 MAIN STREET MABTON, WA 98935 AUGUST 2011 Prepared By:
-
Upload
nguyenlien -
Category
Documents
-
view
217 -
download
1
Transcript of MABTON GREEN PROJECTS - · PDF fileSludge Dewatering Reed Ben, Pine River, Minnesota ......
MABTON GREEN PROJECTS Water & Energy Efficiency Alternatives Study
CCCiiitttyyy ooofff MMMaaabbbtttooonnn,,, WWWaaassshhhiiinnngggtttooonnn
Prepared For:
THE CITY OF MABTON 305 MAIN STREET
MABTON, WA 98935
AUGUST 2011
Prepared By:
Mabton Green Projects Water and Energy Efficiency Alternatives
August 2011
2020 ENGINEERING, Inc. i
Table of Contents
Part 1: Water Efficiency ............................................................................................... 2
1. Assumptions ................................................................................................................. 2
2. Environmental Factors ................................................................................................. 2
a. Climate ........................................................................................................................... 3
b. Soils ............................................................................................................................... 3
c. Ground and Surface Water ............................................................................................. 4
B. Methodology ................................................................................................................. 5
C. Water Conservation ...................................................................................................... 5
1. WW1- LOW FLOW (FIXTURE RETROFIT) .................................................................... 7
D. Water Reuse and Decentralized Wastewater Treatment ...........................................10
2. WW6- LOW FLOW/ LIGHT GREYWATER IRRIGATION ..............................................11
3. WW8- LOW FLOW/GREYWATER FLUSH/ LIGHT GREYWATER IRRIGATION ..........13
4. WW10- DECENTRALIZED TREATMENT AND WATER REUSE ..................................15
E. Summary (Part 1: Water Efficiency) ...........................................................................17
Part 2: Energy Efficiency (Natural Wastewater Treatment Alternatives) ............... 20
A. Introduction .................................................................................................................20
B. Natural Treatment Systems (Overview) .....................................................................20
1. Lagoon Options .............................................................................................................20
2. Wetland Options ............................................................................................................22
C. Wastewater Description and Discharge Standards ..................................................24
D. Low Energy Wastewater Treatment Alternatives ..........................................................27
1. Facultative Lagoon and Surface Flow Wetland ..............................................................27
2. Aerated Lagoon and Surface Flow Wetland ..................................................................27
3. Aerated Gravel Bed: Third Stage Polishing/Ammonia Removal .....................................27
4. Zero Discharge and/or Controlled Batch Discharge .......................................................28
5. Nitrogen Removal ..........................................................................................................29
6. Phosphorous Removal ..................................................................................................29
7. Sludge Management .....................................................................................................29
8. Temperature and Dissolved Oxygen .............................................................................30
9. Disinfection ....................................................................................................................30
10. Costs ...........................................................................................................................31
E. Summary (Part 2: Energy Efficiency) .........................................................................32
F. References (Part 2) ......................................................................................................37
Mabton Green Projects Water and Energy Efficiency Alternatives
August 2011
2020 ENGINEERING, Inc. ii
List of Figures
Figure 1 Site Map. ........................................................................................................................................................ 1
Figure 2. Wastewater Treatment Facility Site. .......................................................................................................... 1
Figure 3. USDA Web Soil Survey Area of Interest Boundary .................................................................................. 4
Figure 4. WW1-Low Flow (Fixture Retrofit) Flow Diagram. ..................................................................................... 7
Figure 5. WW1 Estimated Cost of Ownership............................................................................................................ 9
Figure 6. WW6-Low Flow/Light Greywater Irrigation Diagram. .............................................................................. 11
Figure 7. WW8-Low Flow/Greywater Toilet Flush/ Light Greywater Irrigation Diagram. .................................... 13
Figure 8. WW10 Decentralized Wastewater Treatment Diagram. .......................................................................... 15
Figure 9. ...................................................................................................................................................................... 17
Figure 10. Projected Flow Comparison for Various Sustainable Water Efficiency Strategies. .......................... 19
Figure 11. Typical Facultative Lagoon ..................................................................................................................... 21
Figure 12. Surface Flow Wetland Adjacent to Venice, Italy ................................................................................... 23
Figure 13. Sludge Dewatering Reed Ben, Pine River, Minnesota ......................................................................... 23
Figure 14. City of Mabton 2010 Average Monthly Temperatures .......................................................................... 25
Figure 15. City of Mabton Net Water Gain/Loss by Month ..................................................................................... 26
Figure 16. Alternative A-2 Process Diagram ........................................................................................................... 34
Figure 17. Alternative A-2 Site Plan ......................................................................................................................... 35
Figure 18. Alternative A-2 Process Diagram ............................................................................................................ 36
List of Tables
Table 1. Housing Assumptions .................................................................................................................................. 2
Table 2. Mabton School Population Estimates. ......................................................................................................... 2
Table 3. Monthly Climate Summary ........................................................................................................................... 3
Table 4. Sustainable Water Efficiency Strategy Summary. ..................................................................................... 6
Table 5. WW1- Low Flow (Fixture Retrofit) Estimate ................................................................................................ 7
Table 6. WW1 Cost Estimate ...................................................................................................................................... 8
Table 7. Chapter 246-274 WAC Greywater Reuse for Subsurface Irrigation. ....................................................... 10
Table 8. Flow Estimates Using Light Greywater for Irrigation .............................................................................. 11
Table 9. WW6 Cost Estimate. ................................................................................................................................... 12
Table 10. Using Light Greywater Produced from Low Flow Fixtures for Toilet Flush and Irrigation. ................ 13
Table 11. WW8 Cost Estimate .................................................................................................................................. 14
Table 12. Neighborhood Scale Treatment System Flow Estimate ........................................................................ 15
Table 13. WW10 Cost Estimate ................................................................................................................................ 16
Table 14. Projected Population and Flows for Various Sustainable Water Efficiency Strategies. ..................... 19
Table 15. 2031 City of Mabton Design Criteria........................................................................................................ 24
Table 16. City of Mabton Projected NPDES Permit Effluent Limits (Next Permit Cycle) ..................................... 24
Table 17. Sludge Management- Pump and Land Apply ......................................................................................... 29
Table 18. Low Energy Treatment Alternative Summary ........................................................................................ 31
Table 19. Selected Low Energy Treatment Alternatives ........................................................................................ 33
Mabton Green Projects Water and Energy Efficiency Alternatives
August 2011
2020 ENGINEERING, Inc. iii
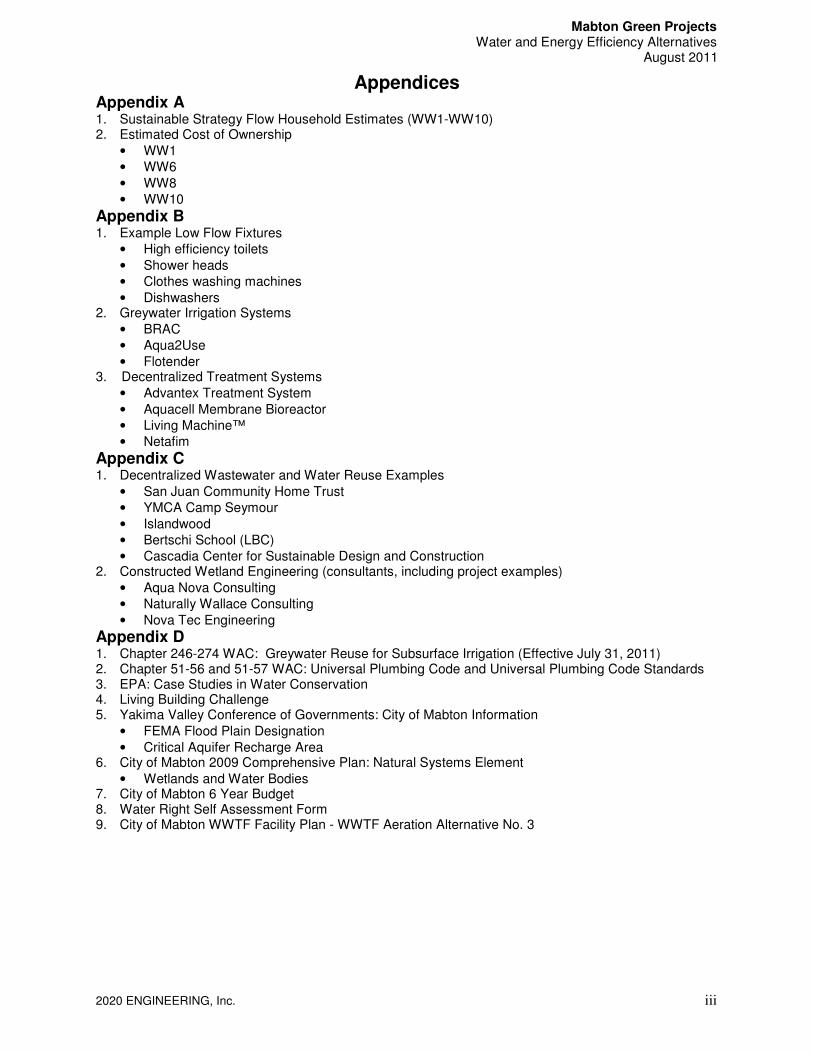
Appendices Appendix A 1. Sustainable Strategy Flow Household Estimates (WW1-WW10) 2. Estimated Cost of Ownership
• WW1
• WW6
• WW8 • WW10
Appendix B 1. Example Low Flow Fixtures
• High efficiency toilets
• Shower heads
• Clothes washing machines
• Dishwashers 2. Greywater Irrigation Systems
• BRAC
• Aqua2Use
• Flotender 3. Decentralized Treatment Systems
• Advantex Treatment System
• Aquacell Membrane Bioreactor
• Living Machine™
• Netafim
Appendix C 1. Decentralized Wastewater and Water Reuse Examples
• San Juan Community Home Trust
• YMCA Camp Seymour
• Islandwood
• Bertschi School (LBC)
• Cascadia Center for Sustainable Design and Construction 2. Constructed Wetland Engineering (consultants, including project examples)
• Aqua Nova Consulting
• Naturally Wallace Consulting
• Nova Tec Engineering
Appendix D 1. Chapter 246-274 WAC: Greywater Reuse for Subsurface Irrigation (Effective July 31, 2011) 2. Chapter 51-56 and 51-57 WAC: Universal Plumbing Code and Universal Plumbing Code Standards 3. EPA: Case Studies in Water Conservation 4. Living Building Challenge 5. Yakima Valley Conference of Governments: City of Mabton Information
• FEMA Flood Plain Designation
• Critical Aquifer Recharge Area 6. City of Mabton 2009 Comprehensive Plan: Natural Systems Element
• Wetlands and Water Bodies 7. City of Mabton 6 Year Budget 8. Water Right Self Assessment Form 9. City of Mabton WWTF Facility Plan - WWTF Aeration Alternative No. 3
Mabton Green Projects Water and Energy Efficiency Alternatives
August 2011
2020 ENGINEERING, Inc. 1
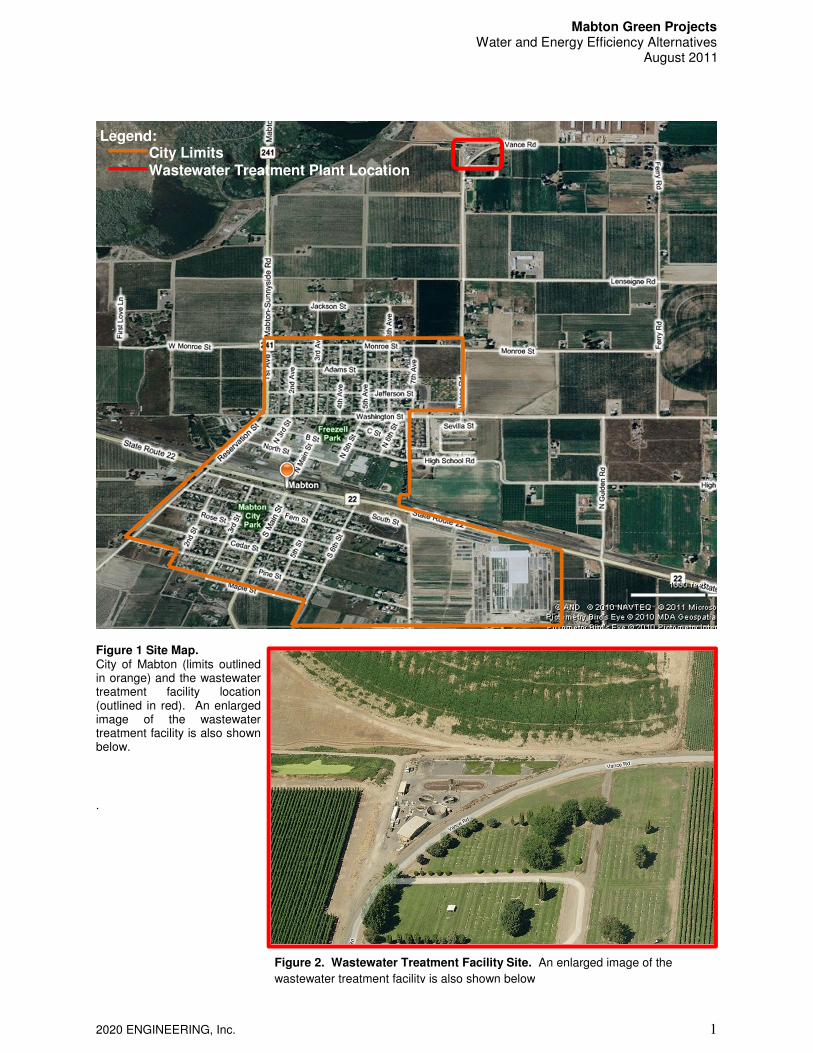
Figure 1 Site Map. City of Mabton (limits outlined in orange) and the wastewater treatment facility location (outlined in red). An enlarged image of the wastewater treatment facility is also shown below.
.
Legend: City Limits Wastewater Treatment Plant Location
Figure 2. Wastewater Treatment Facility Site. An enlarged image of the
wastewater treatment facility is also shown below

Mabton Green Projects Water and Energy Efficiency Alternatives
August 2011
2020 ENGINEERING, Inc. 2
Year Population
Single Family
Housing Units
Multifamily
Units
Manufactured Homes &
Other Housing Total
2008 2,085 337 83 98 518
2010 2,165 345 85 100 531
Housing Type
Elementary School 514
Middle School 159
High School 264
Teachers and Other Faculty 171
Total 1108
2010 Mabton School Population
Part 1: Water Efficiency
A. Introduction
Water conservation is an integral part to preserving and prolonging our precious natural resources as well as our ecosystem as a whole. Water is life. The Clean Water Act has gone a long way in bringing attention to water quality and quantity issues in our country and around the world in the past 40 years. Many municipalities, water and wastewater purveyors, environmentalists, economists, engineers, and green building standards have recognized the energy, environmental, and economic benefits of water conservation. In many ways initiatives from conservationists and the green building industry (i.e., BuiltGreen, LEED and Living Building Challenge) have set high goals for water and wastewater purveyors to look more closely at how they use, reuse and/or treat the water before releasing it back to the environment. Some of these goals have now become standards, and are recognized as minimum efficiencies as demonstrated by the reduction in maximum flush volumes for toilet fixtures nearly 20 years ago. Great strides have been made, and must continue to be made in order to help sustain our environment. Some of the leading cities who have recognized the benefits of water conservation and its effects on energy, the environment, and the economy include Ashland, Oregon; Goleta, California; Houston, Texas; New York City, New York; Santa Monica, California; Tampa, Florida; and Barrie, Ontario (See Appendix D for EPA report). A number of Pacific Northwest cities, such as Lacey, Olympia and Tacoma, have emphasized the importance of water conservation through fixture rebates and other incentive programs. All of these cities implemented plumbing fixture retrofits. The Seattle Saving Water Partnership has also offered toilet rebates for new construction. Each city has experienced substantial water demand reductions, and in turn wastewater flow reductions. These reductions reduce the operations and maintenance efforts, energy demands, aquifer depletion, and stress on existing infrastructure. With our ever growing population, together with industry that demand water resources, cost-effective conservation efforts are paramount in order to help sustain our communities.
1. Assumptions
The City of Mabton (City) is located in Yakima County, Washington, United States, bordering the eastern edge of the Yakama Indian Reservation. Figure 1 provides an area map with City boundaries (orange outline); Figure 2 specifies the wastewater treatment plan location. The City population in 2010 was 2,165. We have determined that the Cities major dischargers of wastewater are the approximately 531 housing units, projected from the City of Mabton Comprehensive Plan (2009), and 3 schools. Summary table of each contributor are shown below. Table 1. Housing Assumptions. Estimates the total 2010 housing units based on the 2008 ratio of various
housing units to population.
Table 2. Mabton School Population Estimates.
Mabton Green Projects Water and Energy Efficiency Alternatives
August 2011
2020 ENGINEERING, Inc. 3
2. Environmental Factors
Various natural features of the service area are discussed below, such as climate, geology, soils, flood plains, and surface and groundwater resources.
a. Climate
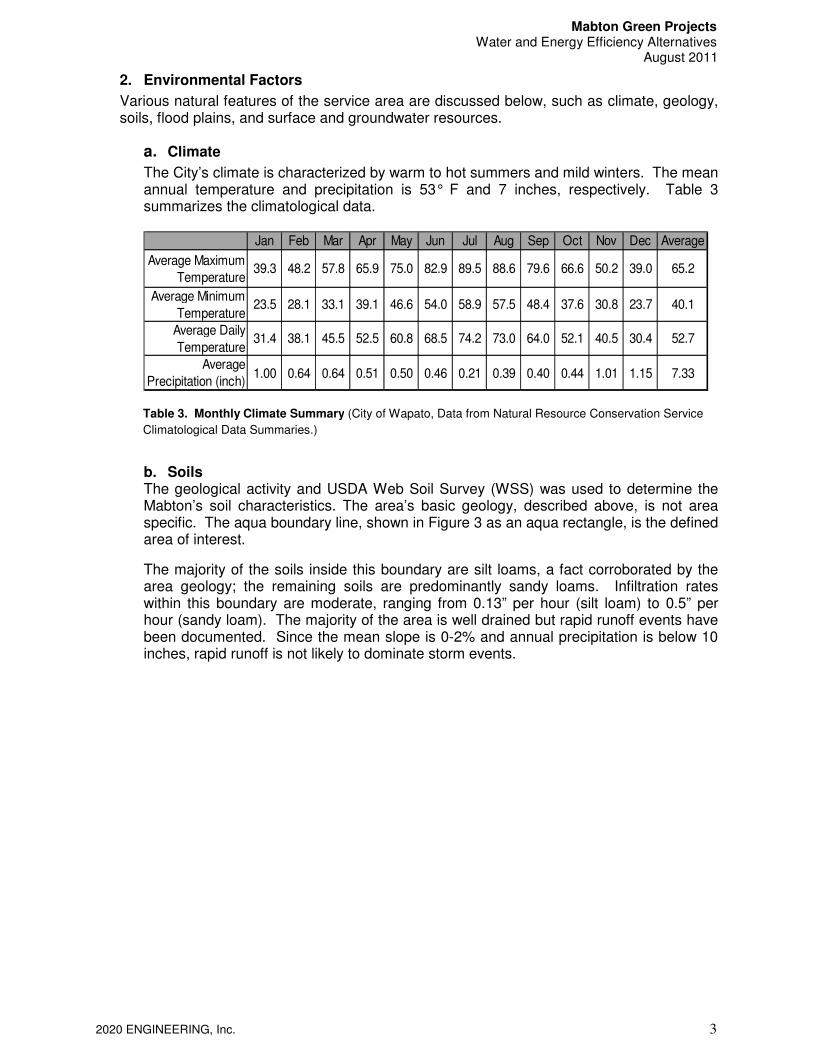
The City’s climate is characterized by warm to hot summers and mild winters. The mean annual temperature and precipitation is 53° F and 7 inches, respectively. Table 3 summarizes the climatological data.
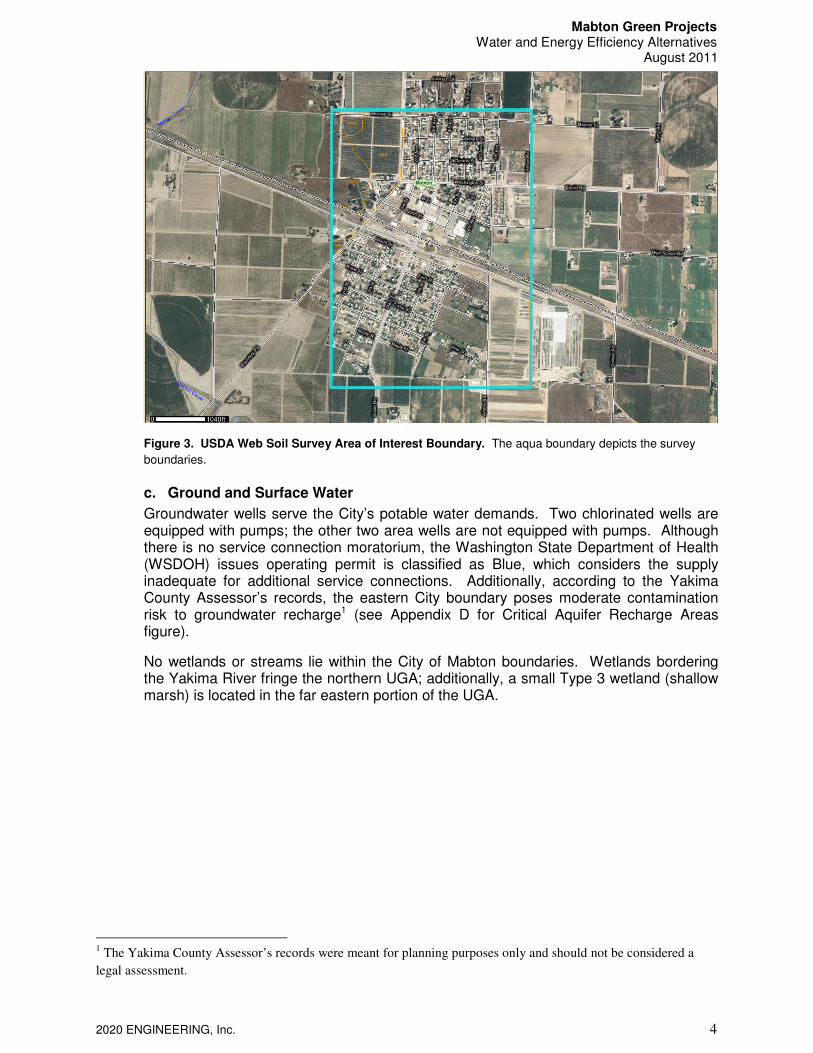
b. Soils The geological activity and USDA Web Soil Survey (WSS) was used to determine the Mabton’s soil characteristics. The area’s basic geology, described above, is not area specific. The aqua boundary line, shown in Figure 3 as an aqua rectangle, is the defined area of interest.
The majority of the soils inside this boundary are silt loams, a fact corroborated by the area geology; the remaining soils are predominantly sandy loams. Infiltration rates within this boundary are moderate, ranging from 0.13” per hour (silt loam) to 0.5” per hour (sandy loam). The majority of the area is well drained but rapid runoff events have been documented. Since the mean slope is 0-2% and annual precipitation is below 10 inches, rapid runoff is not likely to dominate storm events.
Jan Feb Mar Apr May Jun Jul Aug Sep Oct Nov Dec Average
Average Maximum
Temperature39.3 48.2 57.8 65.9 75.0 82.9 89.5 88.6 79.6 66.6 50.2 39.0 65.2
Average Minimum
Temperature23.5 28.1 33.1 39.1 46.6 54.0 58.9 57.5 48.4 37.6 30.8 23.7 40.1
Average Daily
Temperature31.4 38.1 45.5 52.5 60.8 68.5 74.2 73.0 64.0 52.1 40.5 30.4 52.7
Average
Precipitation (inch)1.00 0.64 0.64 0.51 0.50 0.46 0.21 0.39 0.40 0.44 1.01 1.15 7.33
Table 3. Monthly Climate Summary (City of Wapato, Data from Natural Resource Conservation Service
Climatological Data Summaries.)
Mabton Green Projects Water and Energy Efficiency Alternatives
August 2011
2020 ENGINEERING, Inc. 4
Figure 3. USDA Web Soil Survey Area of Interest Boundary. The aqua boundary depicts the survey
boundaries.
c. Ground and Surface Water
Groundwater wells serve the City’s potable water demands. Two chlorinated wells are equipped with pumps; the other two area wells are not equipped with pumps. Although there is no service connection moratorium, the Washington State Department of Health (WSDOH) issues operating permit is classified as Blue, which considers the supply inadequate for additional service connections. Additionally, according to the Yakima County Assessor’s records, the eastern City boundary poses moderate contamination risk to groundwater recharge1 (see Appendix D for Critical Aquifer Recharge Areas figure).
No wetlands or streams lie within the City of Mabton boundaries. Wetlands bordering the Yakima River fringe the northern UGA; additionally, a small Type 3 wetland (shallow marsh) is located in the far eastern portion of the UGA.
1 The Yakima County Assessor’s records were meant for planning purposes only and should not be considered a
legal assessment.
Mabton Green Projects Water and Energy Efficiency Alternatives
August 2011
2020 ENGINEERING, Inc. 5
B. Methodology
According to City of Mabton Wastewater Facility Plan (Gray & Osborne, Inc, 2011), the daily wastewater treatment plant flows are an estimated 173,000 gallons per day or 80 gallons/day-capita (GPCD). Some of this total is attributed to infiltration and inflow (I&I). For the purpose of this study, the estimated I&I is 6% of the daily treatment plant flows. The result is a decrease in per capita wastewater production to 75 GPD. Flow and usage rates provided by the AWWA Research Foundation’s Residential End Water Uses were applied to estimate the City’s daily flows for kitchen sinks, bathroom sinks, showers, a dishwasher, a clothes washer and toilets. Some usage rates were adjusted to match the 75 GPCD flow rate.
The goal of estimating realistic per capita usage rates was to ensure comparable results between conventional and sustainable strategies. Once these rates were assumed, they were applied throughout the sustainable strategies. All of the sustainable strategy flow estimates employed these comparable usage assumptions.
Water conservation does not negate the need for additional wastewater treatment capacity. User activities remain the same, resulting in similar daily loading (i.e. Ib. BOD/day). Conservation does reduce potable water treatment and conveyance energy requirement; wastewater conveyance costs (primarily in the treatment facility) can also be reduced. Users (households) could also benefit from decrease energy costs that are often associated with many of the fixtures identified in the following pages. Conservation has additional benefits not quantified in this study. Well water quality can be affected by water conservation. High demands sometimes require water to travel from greater distances in the aquifer, which increases the chance of land use practices contaminating the groundwater. The Critical Aquifer Recharge Areas map in Appendix C identifies the Mabton’s aquifer contamination susceptibility. Aquatic health also benefits from water conservation efforts. Fewer dams and reservoirs regulating the natural flow of rivers and streams would be required to control water sources. River and lake surface water withdrawals would decrease. Although Mabton currently does not use dams, reservoirs, or surface water withdrawals to serve potable water demands, conservation efforts could reduce any future needs.
C. Water Conservation
Plumbing Fixtures Retrofits:
Older, conventional fixtures typically consume greater volumes of water than newer (post 1992), low flow fixtures. Replacing fixtures can significantly reduce overall potable water demand.
• Shower heads – Typical non-conserving showerheads use as much as 5 gallons per minute (gpm) while a low flow shower head can use as little as 0.5 gpm. Using a shower head with a flow rate of 0.5 gpm for a typical 8 minute shower can reduce the showers water use from as high as 40 gallons to as little as 4 gallons.
• Bathroom faucets – Typical bathroom faucets use 2.5 gpm or more per minute while a low flow faucet will use as little as 0.5 gpm.
• Kitchen sink faucets - Flow rates can be reduced from an average of 2.5 gpm to as little as 1.5 gpm.
• Dishwashers – Flow rates can be reduced from an average of 10 gallons per load to as little as 1.5 gallons per load.
• Clothes washers – Flow rates can be reduced from an average of 40 gal/load to as little as 11 gal/load.
• Toilets – Old conventional toilets can use as much as 5 gallons per flush. Newer High Efficency Toilets (HET’s) use 1.28 gallons per flush while dual flush HET’s average as little as 0.9 gallons per flush. (A dual flush high efficiency toilet (HET) has two flush modes. A regular flush of 1.28 gallons for solid waste and as little as 0.8 gallons for liquids.)
Table 4 lists the estimated wastewater flows of all the sustainable strategies initially identified in this study. Each sustainable strategy maintains identical usage demands but fixtures or the source water changes (i.e. low flow fixtures or non-potable greywater for toilet flush), which

Mabton Green Projects Water and Energy Efficiency Alternatives
August 2011
2020 ENGINEERING, Inc. 6
modifies potable water volume demands and the resulting wastewater production. Itemized estimated demands for all 10 sustainable strategies are available in Appendix A.
Sustainable Water Efficiency Strategy Gallon/Day
-Capita (GPDC)
Percent Reduction
CURRENT MABTON AVERAGE DAILY FLOW (BASELINE) 75 -
WW1 LOW FLOW (FIXTURE RETROFIT) 41 45%
WW2 GREYWATER FLUSH 62 17%
WW3 LOW FLOW/ GREYWATER FLUSH 36 52%
WW4 LIGHT GREYWATER IRRIGATION 53 29%
WW5 ALL GREYWATER IRRIGATION 44 41%
WW6 LOW FLOW/ LIGHT GREYWATER IRRIGATION 28 62%
WW7 LOW FLOW/ ALL GREYWATER IRRIGATION 23 70%
WW8 LOW FLOW/ GREYWATER FLUSH/ LIGHT GREYWATER IRRIGATION 26 65%
WW9 LOW FLOW/ GREYWATER FLUSH/ ALL GREYWATER IRRIGATION 20 73%
WW10 DECENTRALIZED TREATMENT AND WATER REUSE 0 100%
Table 4.Sustainable Water Efficiency Strategy Summary. Lists the per capita daily estimated wastewater flow to
the Mabton wastewater treatment facility (WWTF) and the associated percent flow reduction yielded from the various
scenarios.
Mabton Green Projects Water and Energy Efficiency Alternatives
August 2011
2020 ENGINEERING, Inc. 7
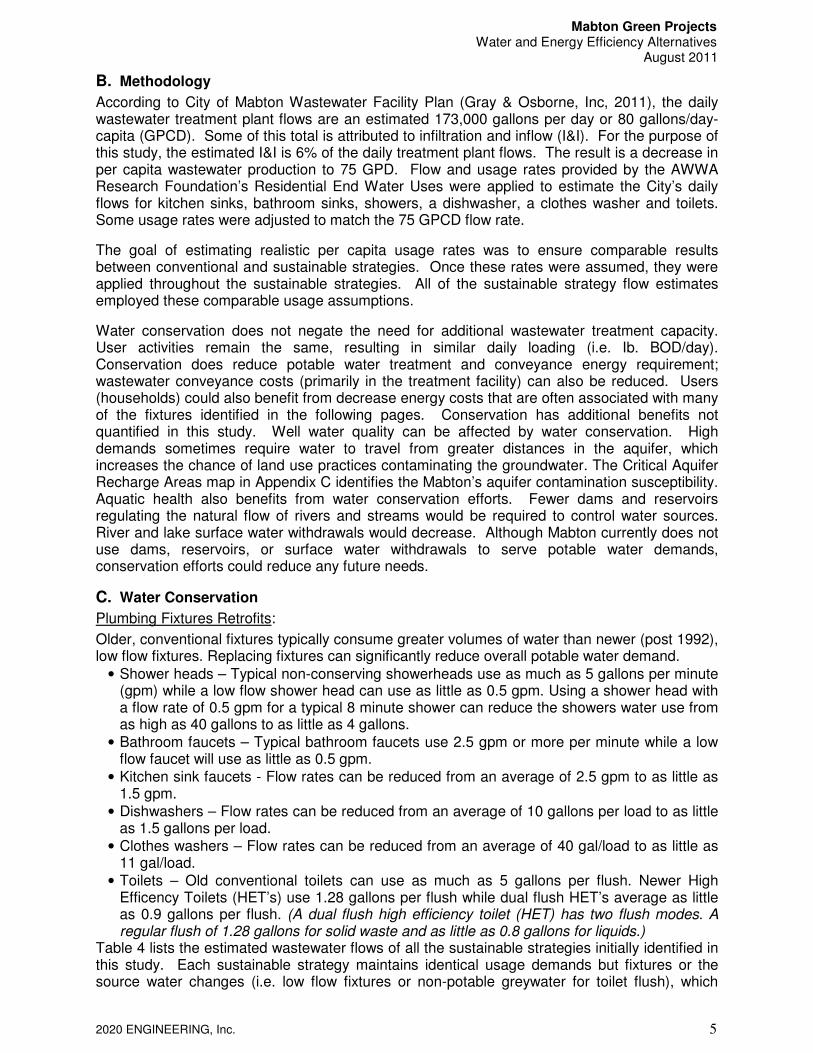
1. WW1- LOW FLOW (FIXTURE RETROFIT)
Flow Reduction:
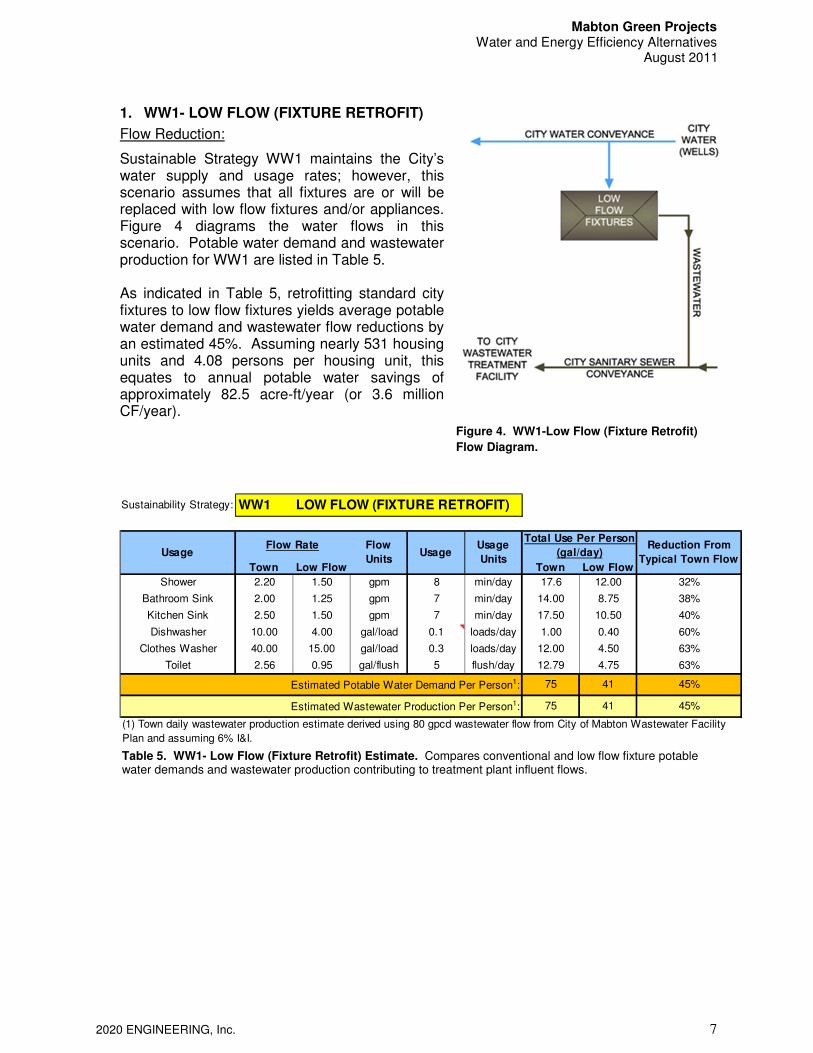
Sustainable Strategy WW1 maintains the City’s water supply and usage rates; however, this scenario assumes that all fixtures are or will be replaced with low flow fixtures and/or appliances. Figure 4 diagrams the water flows in this scenario. Potable water demand and wastewater production for WW1 are listed in Table 5. As indicated in Table 5, retrofitting standard city fixtures to low flow fixtures yields average potable water demand and wastewater flow reductions by an estimated 45%. Assuming nearly 531 housing units and 4.08 persons per housing unit, this equates to annual potable water savings of approximately 82.5 acre-ft/year (or 3.6 million CF/year).
Sustainability Strategy: WW1 LOW FLOW (FIXTURE RETROFIT)
Town Low Flow Town Low Flow
Shower 2.20 1.50 gpm 8 min/day 17.6 12.00 32%
Bathroom Sink 2.00 1.25 gpm 7 min/day 14.00 8.75 38%
Kitchen Sink 2.50 1.50 gpm 7 min/day 17.50 10.50 40%
Dishwasher 10.00 4.00 gal/load 0.1 loads/day 1.00 0.40 60%
Clothes Washer 40.00 15.00 gal/load 0.3 loads/day 12.00 4.50 63%
Toilet 2.56 0.95 gal/flush 5 flush/day 12.79 4.75 63%
75 41 45%
75 41 45%
(1) Town daily wastewater production estimate derived using 80 gpcd wastewater flow from City of Mabton Wastewater Facility
Plan and assuming 6% I&I.
Usage
UnitsUsage
Flow Rate Flow
UnitsUsage
Estimated Wastewater Production Per Person1:
Estimated Potable Water Demand Per Person1:
Reduction From
Typical Town Flow
Total Use Per Person
(gal/day)
Figure 4. WW1-Low Flow (Fixture Retrofit)
Flow Diagram.
Table 5. WW1- Low Flow (Fixture Retrofit) Estimate. Compares conventional and low flow fixture potable water demands and wastewater production contributing to treatment plant influent flows.
Mabton Green Projects Water and Energy Efficiency Alternatives
August 2011
2020 ENGINEERING, Inc. 8
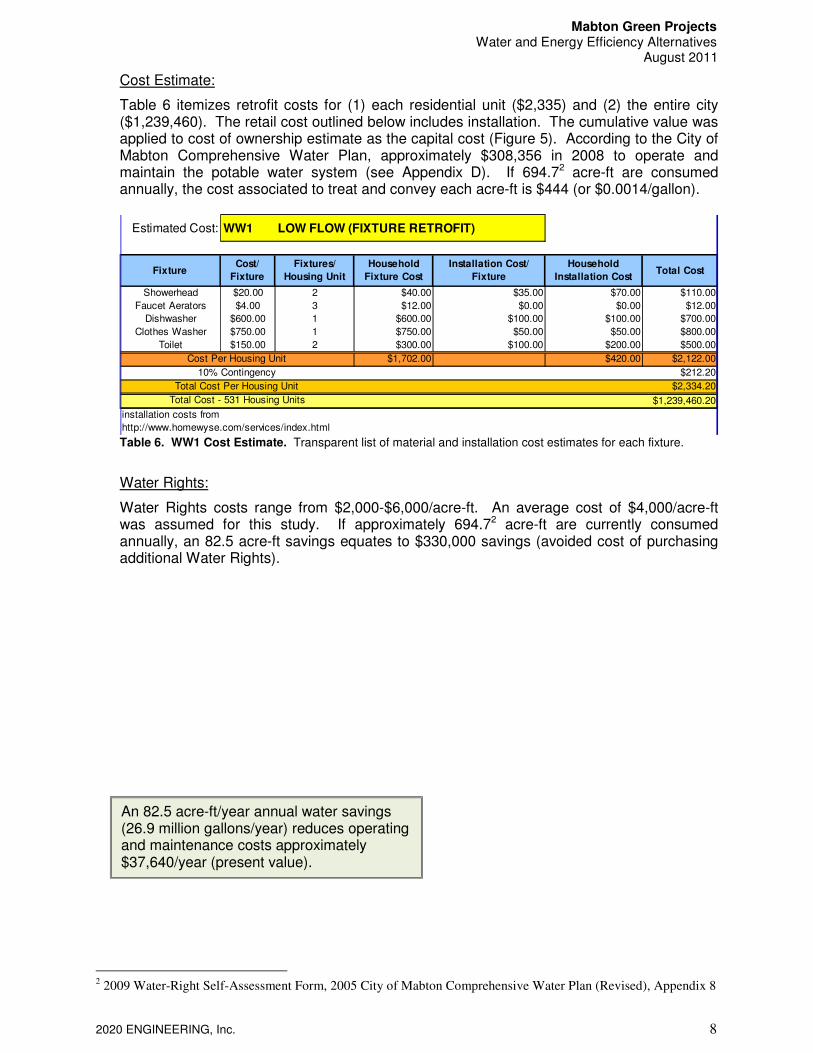
Cost Estimate:
Table 6 itemizes retrofit costs for (1) each residential unit ($2,335) and (2) the entire city ($1,239,460). The retail cost outlined below includes installation. The cumulative value was applied to cost of ownership estimate as the capital cost (Figure 5). According to the City of Mabton Comprehensive Water Plan, approximately $308,356 in 2008 to operate and maintain the potable water system (see Appendix D). If 694.72 acre-ft are consumed annually, the cost associated to treat and convey each acre-ft is $444 (or $0.0014/gallon).
Table 6. WW1 Cost Estimate. Transparent list of material and installation cost estimates for each fixture.
Water Rights:
Water Rights costs range from $2,000-$6,000/acre-ft. An average cost of $4,000/acre-ft was assumed for this study. If approximately 694.72 acre-ft are currently consumed annually, an 82.5 acre-ft savings equates to $330,000 savings (avoided cost of purchasing additional Water Rights).
2 2009 Water-Right Self-Assessment Form, 2005 City of Mabton Comprehensive Water Plan (Revised), Appendix 8
Estimated Cost: WW1 LOW FLOW (FIXTURE RETROFIT)
FixtureCost/
Fixture
Fixtures/
Housing Unit
Household
Fixture Cost
Installation Cost/
Fixture
Household
Installation CostTotal Cost
Showerhead $20.00 2 $40.00 $35.00 $70.00 $110.00
Faucet Aerators $4.00 3 $12.00 $0.00 $0.00 $12.00
Dishwasher $600.00 1 $600.00 $100.00 $100.00 $700.00
Clothes Washer $750.00 1 $750.00 $50.00 $50.00 $800.00
Toilet $150.00 2 $300.00 $100.00 $200.00 $500.00
$1,702.00 $420.00 $2,122.00
$212.20
$2,334.20
$1,239,460.20
installation costs from
http://www.homewyse.com/services/index.html
Cost Per Housing Unit
Total Cost - 531 Housing Units
10% Contingency
Total Cost Per Housing Unit
An 82.5 acre-ft/year annual water savings (26.9 million gallons/year) reduces operating and maintenance costs approximately $37,640/year (present value).
Mabton Green Projects Water and Energy Efficiency Alternatives
August 2011
2020 ENGINEERING, Inc. 9
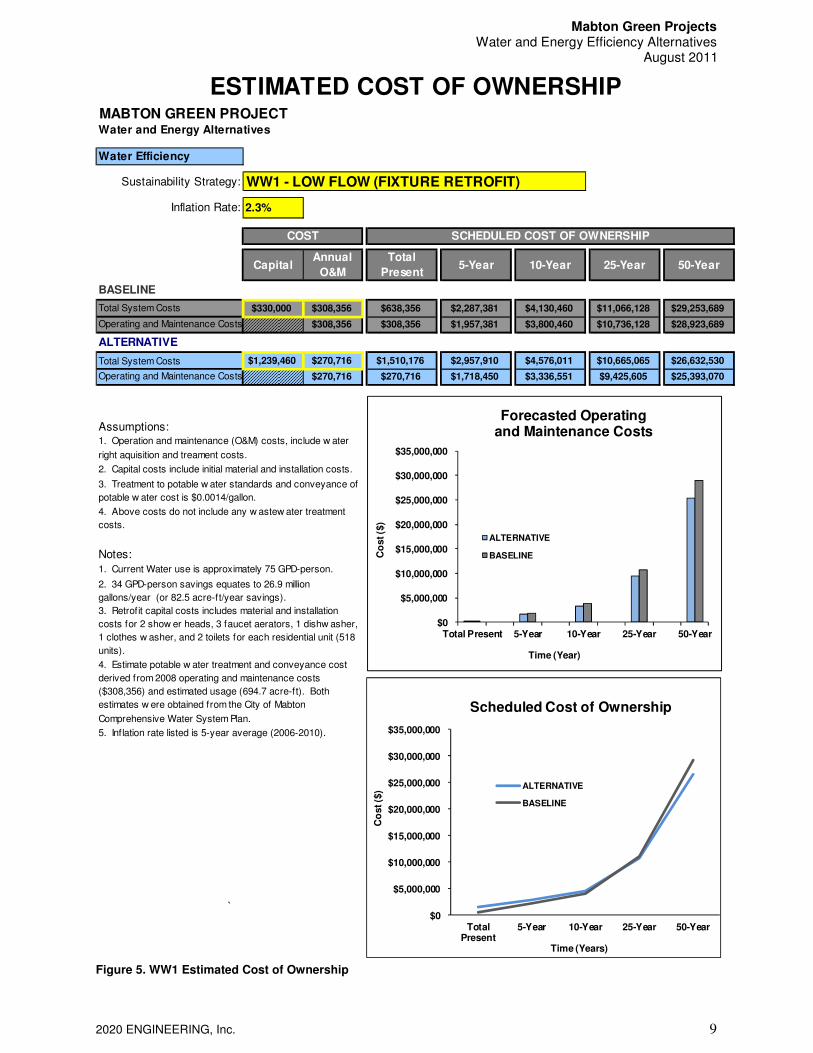
Figure 5. WW1 Estimated Cost of Ownership
Water and Energy Alternatives
Water Efficiency
Sustainability Strategy: WW1 - LOW FLOW (FIXTURE RETROFIT)
Inflation Rate: 2.3%
CapitalAnnual
O&M
Total
Present5-Year 10-Year 25-Year 50-Year
BASELINE
Total System Costs $330,000 $308,356 $638,356 $2,287,381 $4,130,460 $11,066,128 $29,253,689
Operating and Maintenance Costs $308,356 $308,356 $1,957,381 $3,800,460 $10,736,128 $28,923,689
ALTERNATIVE
Total System Costs $1,239,460 $270,716 $1,510,176 $2,957,910 $4,576,011 $10,665,065 $26,632,530
Operating and Maintenance Costs $270,716 $270,716 $1,718,450 $3,336,551 $9,425,605 $25,393,070
Assumptions:
0
10
25
50
Notes:
Total Present 5-Year10-Year 25-Year50-Year
$638,356 $4,130,460 $29,253,689
$1,510,176 $4,576,011 $26,632,530
ESTIMATED COST OF OWNERSHIP
`
MABTON GREEN PROJECT
5. Inflation rate listed is 5-year average (2006-2010).
4. Estimate potable w ater treatment and conveyance cost
derived from 2008 operating and maintenance costs
($308,356) and estimated usage (694.7 acre-ft). Both
estimates w ere obtained from the City of Mabton
Comprehensive Water System Plan.
1. Current Water use is approximately 75 GPD-person.
4. Above costs do not include any w astew ater treatment
costs.
COST SCHEDULED COST OF OWNERSHIP
2. 34 GPD-person savings equates to 26.9 million
gallons/year (or 82.5 acre-ft/year savings).
1. Operation and maintenance (O&M) costs, include w ater
right aquisition and treament costs.
3. Treatment to potable w ater standards and conveyance of
potable w ater cost is $0.0014/gallon.
2. Capital costs include initial material and installation costs.
3. Retrofit capital costs includes material and installation
costs for 2 show er heads, 3 faucet aerators, 1 dishw asher,
1 clothes w asher, and 2 toilets for each residential unit (518
units).
$0
$5,000,000
$10,000,000
$15,000,000
$20,000,000
$25,000,000
$30,000,000
$35,000,000
Total Present 5-Year 10-Year 25-Year 50-Year
Co
st ($
)
Time (Year)
Forecasted Operating and Maintenance Costs
ALTERNATIVE
BASELINE
$0
$5,000,000
$10,000,000
$15,000,000
$20,000,000
$25,000,000
$30,000,000
$35,000,000
TotalPresent
5-Year 10-Year 25-Year 50-Year
Co
st
($)
Time (Years)
Scheduled Cost of Ownership
ALTERNATIVE
BASELINE
Mabton Green Projects Water and Energy Efficiency Alternatives
August 2011
2020 ENGINEERING, Inc. 10
D. Water Reuse and Decentralized Wastewater Treatment
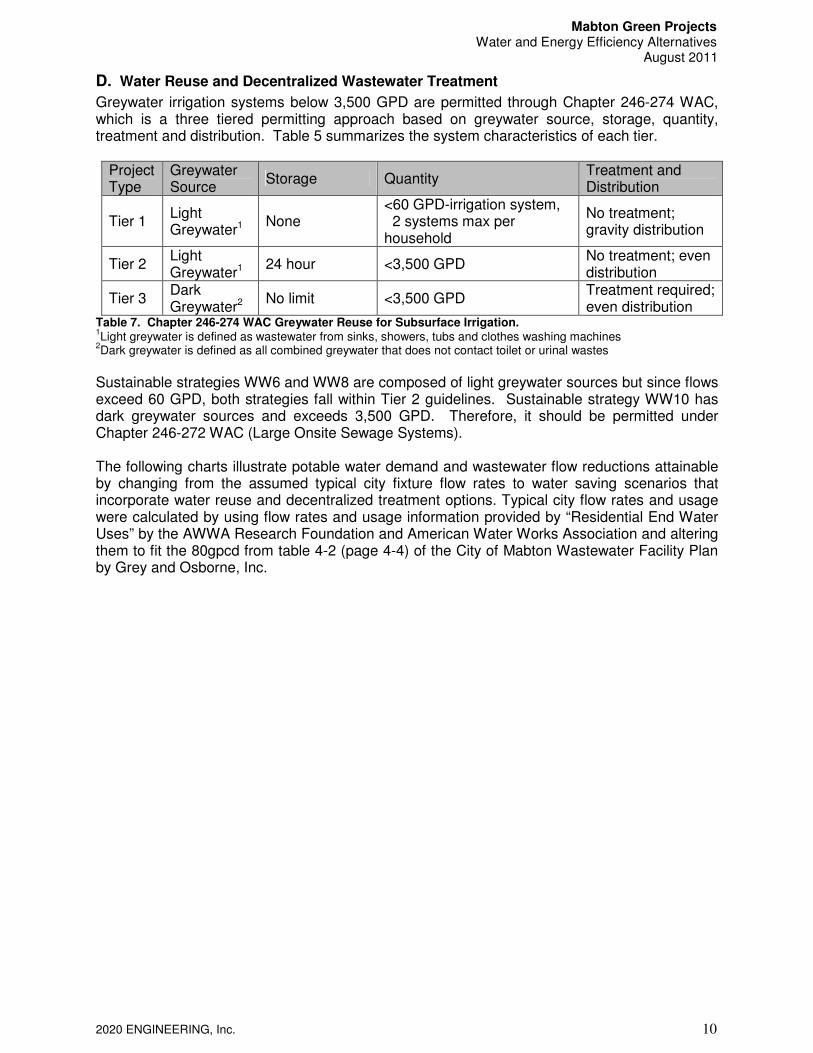
Greywater irrigation systems below 3,500 GPD are permitted through Chapter 246-274 WAC, which is a three tiered permitting approach based on greywater source, storage, quantity, treatment and distribution. Table 5 summarizes the system characteristics of each tier.
Project Type
Greywater Source
Storage Quantity Treatment and Distribution
Tier 1 Light Greywater1
None <60 GPD-irrigation system, 2 systems max per household
No treatment; gravity distribution
Tier 2 Light Greywater1
24 hour <3,500 GPD No treatment; even distribution
Tier 3 Dark Greywater2
No limit <3,500 GPD Treatment required; even distribution
Table 7. Chapter 246-274 WAC Greywater Reuse for Subsurface Irrigation. 1Light greywater is defined as wastewater from sinks, showers, tubs and clothes washing machines
2Dark greywater is defined as all combined greywater that does not contact toilet or urinal wastes
Sustainable strategies WW6 and WW8 are composed of light greywater sources but since flows exceed 60 GPD, both strategies fall within Tier 2 guidelines. Sustainable strategy WW10 has dark greywater sources and exceeds 3,500 GPD. Therefore, it should be permitted under Chapter 246-272 WAC (Large Onsite Sewage Systems).
The following charts illustrate potable water demand and wastewater flow reductions attainable by changing from the assumed typical city fixture flow rates to water saving scenarios that incorporate water reuse and decentralized treatment options. Typical city flow rates and usage were calculated by using flow rates and usage information provided by “Residential End Water Uses” by the AWWA Research Foundation and American Water Works Association and altering them to fit the 80gpcd from table 4-2 (page 4-4) of the City of Mabton Wastewater Facility Plan by Grey and Osborne, Inc.
Mabton Green Projects Water and Energy Efficiency Alternatives
August 2011
2020 ENGINEERING, Inc. 11
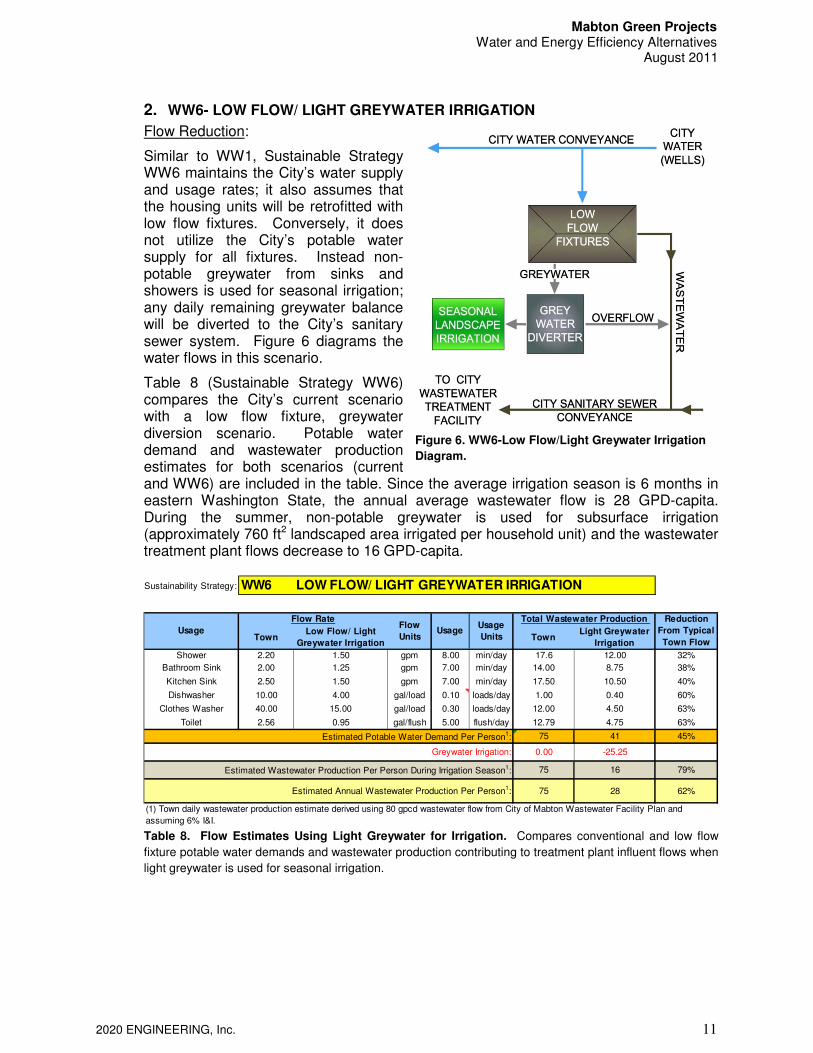
2. WW6- LOW FLOW/ LIGHT GREYWATER IRRIGATION
Flow Reduction:
Similar to WW1, Sustainable Strategy WW6 maintains the City’s water supply and usage rates; it also assumes that the housing units will be retrofitted with low flow fixtures. Conversely, it does not utilize the City’s potable water supply for all fixtures. Instead non-potable greywater from sinks and showers is used for seasonal irrigation; any daily remaining greywater balance will be diverted to the City’s sanitary sewer system. Figure 6 diagrams the water flows in this scenario.
Table 8 (Sustainable Strategy WW6) compares the City’s current scenario with a low flow fixture, greywater diversion scenario. Potable water demand and wastewater production estimates for both scenarios (current and WW6) are included in the table. Since the average irrigation season is 6 months in eastern Washington State, the annual average wastewater flow is 28 GPD-capita. During the summer, non-potable greywater is used for subsurface irrigation (approximately 760 ft2 landscaped area irrigated per household unit) and the wastewater treatment plant flows decrease to 16 GPD-capita.
Table 8. Flow Estimates Using Light Greywater for Irrigation. Compares conventional and low flow
fixture potable water demands and wastewater production contributing to treatment plant influent flows when
light greywater is used for seasonal irrigation.
Sustainability Strategy: WW6 LOW FLOW/ LIGHT GREYWATER IRRIGATION
TownLow Flow/ Light
Greywater IrrigationTown
Light Greywater
Irrigation
Shower 2.20 1.50 gpm 8.00 min/day 17.6 12.00 32%
Bathroom Sink 2.00 1.25 gpm 7.00 min/day 14.00 8.75 38%
Kitchen Sink 2.50 1.50 gpm 7.00 min/day 17.50 10.50 40%
Dishwasher 10.00 4.00 gal/load 0.10 loads/day 1.00 0.40 60%
Clothes Washer 40.00 15.00 gal/load 0.30 loads/day 12.00 4.50 63%
Toilet 2.56 0.95 gal/flush 5.00 flush/day 12.79 4.75 63%
75 41 45%
0.00 -25.25
75 16 79%
75 28 62%
(1) Town daily wastewater production estimate derived using 80 gpcd wastewater flow from City of Mabton Wastewater Facility Plan and
assuming 6% I&I.
Reduction
From Typical
Town Flow
Estimated Wastewater Production Per Person During Irrigation Season1:
Usage
Flow Rate
Greywater Irrigation:
Flow
UnitsUsage
Usage
Units
Total Wastewater Production
Estimated Annual Wastewater Production Per Person1:
Estimated Potable Water Demand Per Person1:
Figure 6. WW6-Low Flow/Light Greywater Irrigation
Diagram.
Mabton Green Projects Water and Energy Efficiency Alternatives
August 2011
2020 ENGINEERING, Inc. 12
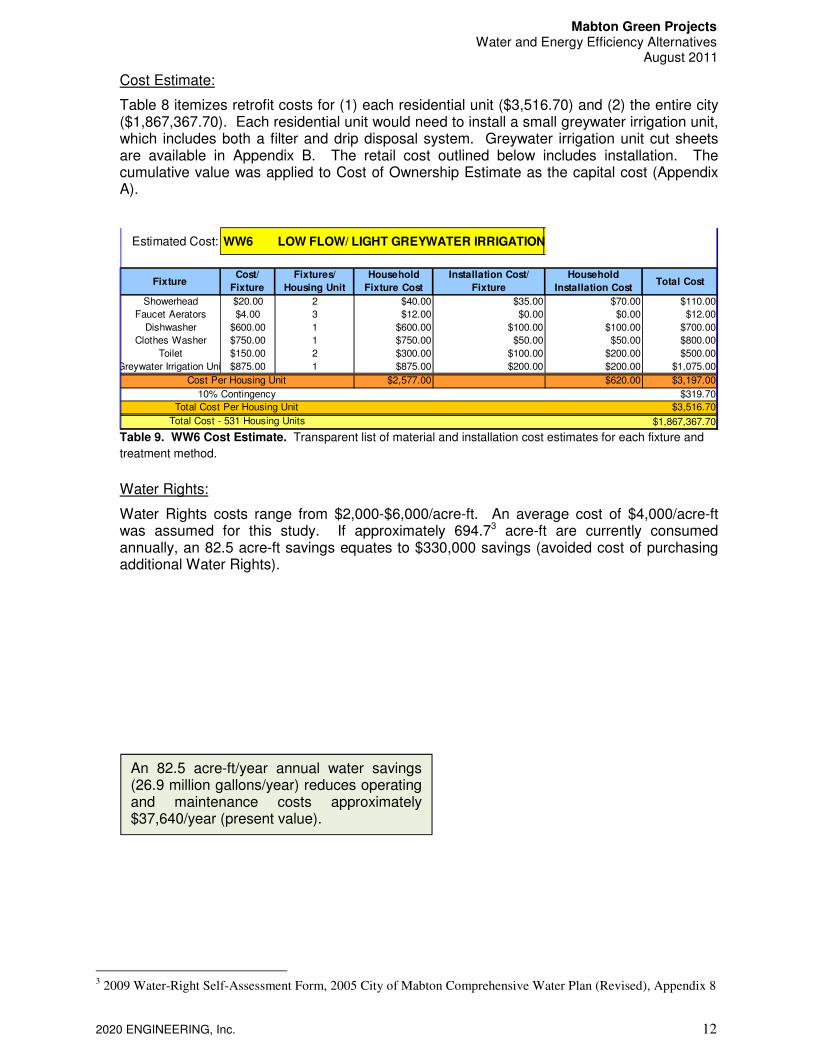
Cost Estimate:
Table 8 itemizes retrofit costs for (1) each residential unit ($3,516.70) and (2) the entire city ($1,867,367.70). Each residential unit would need to install a small greywater irrigation unit, which includes both a filter and drip disposal system. Greywater irrigation unit cut sheets are available in Appendix B. The retail cost outlined below includes installation. The cumulative value was applied to Cost of Ownership Estimate as the capital cost (Appendix A).
Water Rights:
Water Rights costs range from $2,000-$6,000/acre-ft. An average cost of $4,000/acre-ft was assumed for this study. If approximately 694.73 acre-ft are currently consumed annually, an 82.5 acre-ft savings equates to $330,000 savings (avoided cost of purchasing additional Water Rights).
3 2009 Water-Right Self-Assessment Form, 2005 City of Mabton Comprehensive Water Plan (Revised), Appendix 8
Estimated Cost: WW6 LOW FLOW/ LIGHT GREYWATER IRRIGATION
FixtureCost/
Fixture
Fixtures/
Housing Unit
Household
Fixture Cost
Installation Cost/
Fixture
Household
Installation CostTotal Cost
Showerhead $20.00 2 $40.00 $35.00 $70.00 $110.00
Faucet Aerators $4.00 3 $12.00 $0.00 $0.00 $12.00
Dishwasher $600.00 1 $600.00 $100.00 $100.00 $700.00
Clothes Washer $750.00 1 $750.00 $50.00 $50.00 $800.00
Toilet $150.00 2 $300.00 $100.00 $200.00 $500.00
Greywater Irrigation Unit $875.00 1 $875.00 $200.00 $200.00 $1,075.00
$2,577.00 $620.00 $3,197.00
$319.70
$3,516.70
$1,867,367.70
Cost Per Housing Unit
10% Contingency
Total Cost Per Housing Unit
Total Cost - 531 Housing Units
Table 9. WW6 Cost Estimate. Transparent list of material and installation cost estimates for each fixture and
treatment method.
An 82.5 acre-ft/year annual water savings (26.9 million gallons/year) reduces operating and maintenance costs approximately $37,640/year (present value).
Mabton Green Projects Water and Energy Efficiency Alternatives
August 2011
2020 ENGINEERING, Inc. 13
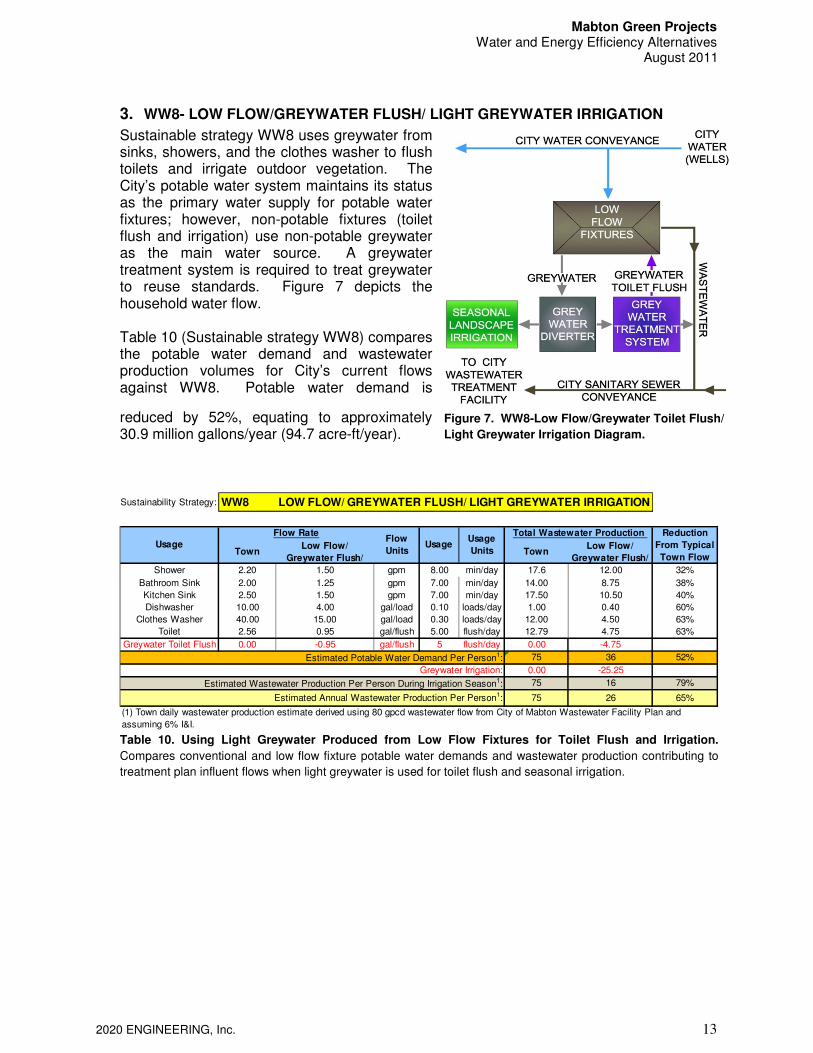
3. WW8- LOW FLOW/GREYWATER FLUSH/ LIGHT GREYWATER IRRIGATION
Sustainable strategy WW8 uses greywater from sinks, showers, and the clothes washer to flush toilets and irrigate outdoor vegetation. The City’s potable water system maintains its status as the primary water supply for potable water fixtures; however, non-potable fixtures (toilet flush and irrigation) use non-potable greywater as the main water source. A greywater treatment system is required to treat greywater to reuse standards. Figure 7 depicts the household water flow. Table 10 (Sustainable strategy WW8) compares the potable water demand and wastewater production volumes for City’s current flows against WW8. Potable water demand is
reduced by 52%, equating to approximately 30.9 million gallons/year (94.7 acre-ft/year).
Table 10. Using Light Greywater Produced from Low Flow Fixtures for Toilet Flush and Irrigation.
Compares conventional and low flow fixture potable water demands and wastewater production contributing to
treatment plan influent flows when light greywater is used for toilet flush and seasonal irrigation.
Sustainability Strategy: WW8 LOW FLOW/ GREYWATER FLUSH/ LIGHT GREYWATER IRRIGATION
TownLow Flow/
Greywater Flush/ Town
Low Flow/
Greywater Flush/
Shower 2.20 1.50 gpm 8.00 min/day 17.6 12.00 32%
Bathroom Sink 2.00 1.25 gpm 7.00 min/day 14.00 8.75 38%
Kitchen Sink 2.50 1.50 gpm 7.00 min/day 17.50 10.50 40%
Dishwasher 10.00 4.00 gal/load 0.10 loads/day 1.00 0.40 60%
Clothes Washer 40.00 15.00 gal/load 0.30 loads/day 12.00 4.50 63%
Toilet 2.56 0.95 gal/flush 5.00 flush/day 12.79 4.75 63%
Greywater Toilet Flush 0.00 -0.95 gal/flush 5 flush/day 0.00 -4.75
75 36 52%
0.00 -25.25
75 16 79%
75 26 65%
Total Wastewater Production
Usage
Flow Rate
(1) Town daily wastewater production estimate derived using 80 gpcd wastewater flow from City of Mabton Wastewater Facility Plan and
assuming 6% I&I.
Estimated Annual Wastewater Production Per Person1:
Flow
UnitsUsage
Usage
Units
Reduction
From Typical
Town Flow
Estimated Wastewater Production Per Person During Irrigation Season1:
Estimated Potable Water Demand Per Person1:
Greywater Irrigation:
Figure 7. WW8-Low Flow/Greywater Toilet Flush/
Light Greywater Irrigation Diagram.
Mabton Green Projects Water and Energy Efficiency Alternatives
August 2011
2020 ENGINEERING, Inc. 14
Cost Estimate:
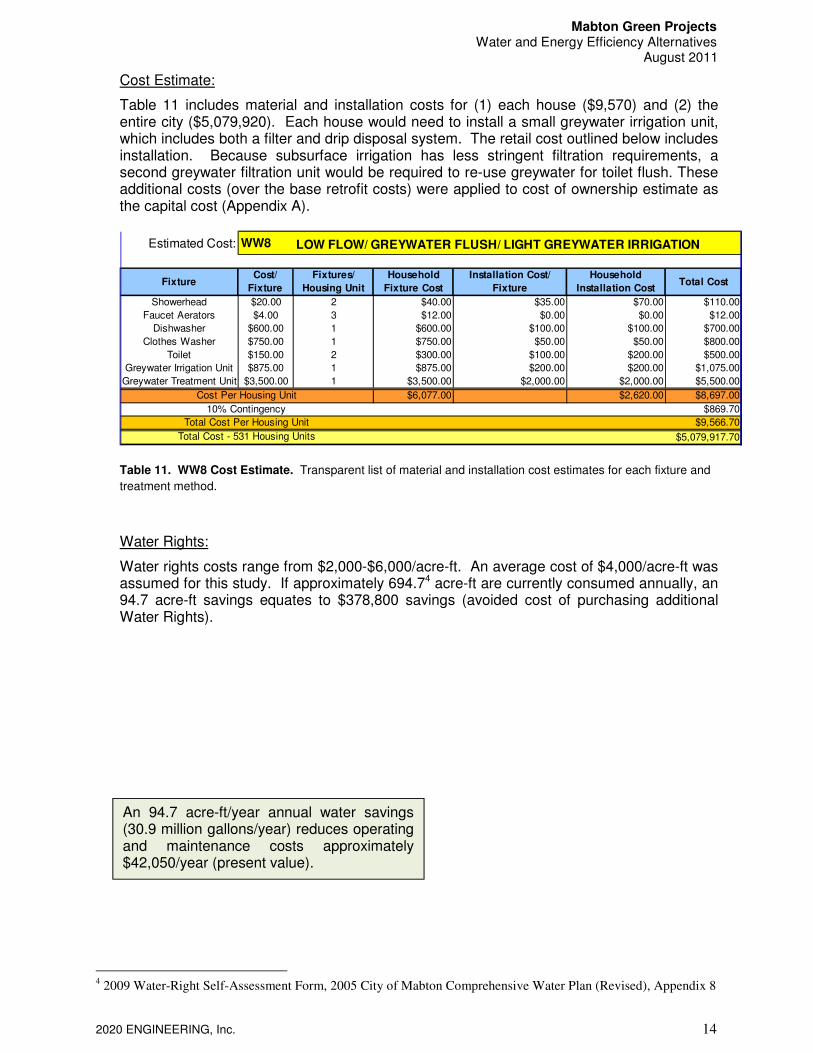
Table 11 includes material and installation costs for (1) each house ($9,570) and (2) the entire city ($5,079,920). Each house would need to install a small greywater irrigation unit, which includes both a filter and drip disposal system. The retail cost outlined below includes installation. Because subsurface irrigation has less stringent filtration requirements, a second greywater filtration unit would be required to re-use greywater for toilet flush. These additional costs (over the base retrofit costs) were applied to cost of ownership estimate as the capital cost (Appendix A).
Table 11. WW8 Cost Estimate. Transparent list of material and installation cost estimates for each fixture and
treatment method.
Water Rights:
Water rights costs range from $2,000-$6,000/acre-ft. An average cost of $4,000/acre-ft was assumed for this study. If approximately 694.74 acre-ft are currently consumed annually, an 94.7 acre-ft savings equates to $378,800 savings (avoided cost of purchasing additional Water Rights).
4 2009 Water-Right Self-Assessment Form, 2005 City of Mabton Comprehensive Water Plan (Revised), Appendix 8
Estimated Cost: WW8 LOW FLOW/ GREYWATER FLUSH/ LIGHT GREYWATER IRRIGATION
FixtureCost/
Fixture
Fixtures/
Housing Unit
Household
Fixture Cost
Installation Cost/
Fixture
Household
Installation CostTotal Cost
Showerhead $20.00 2 $40.00 $35.00 $70.00 $110.00
Faucet Aerators $4.00 3 $12.00 $0.00 $0.00 $12.00
Dishwasher $600.00 1 $600.00 $100.00 $100.00 $700.00
Clothes Washer $750.00 1 $750.00 $50.00 $50.00 $800.00
Toilet $150.00 2 $300.00 $100.00 $200.00 $500.00
Greywater Irrigation Unit $875.00 1 $875.00 $200.00 $200.00 $1,075.00
Greywater Treatment Unit $3,500.00 1 $3,500.00 $2,000.00 $2,000.00 $5,500.00
$6,077.00 $2,620.00 $8,697.00
$869.70
$9,566.70
$5,079,917.70
10% Contingency
Total Cost - 531 Housing Units
Cost Per Housing Unit
Total Cost Per Housing Unit
An 94.7 acre-ft/year annual water savings (30.9 million gallons/year) reduces operating and maintenance costs approximately $42,050/year (present value).
Mabton Green Projects Water and Energy Efficiency Alternatives
August 2011
2020 ENGINEERING, Inc. 15
4. WW10- DECENTRALIZED TREATMENT AND WATER REUSE
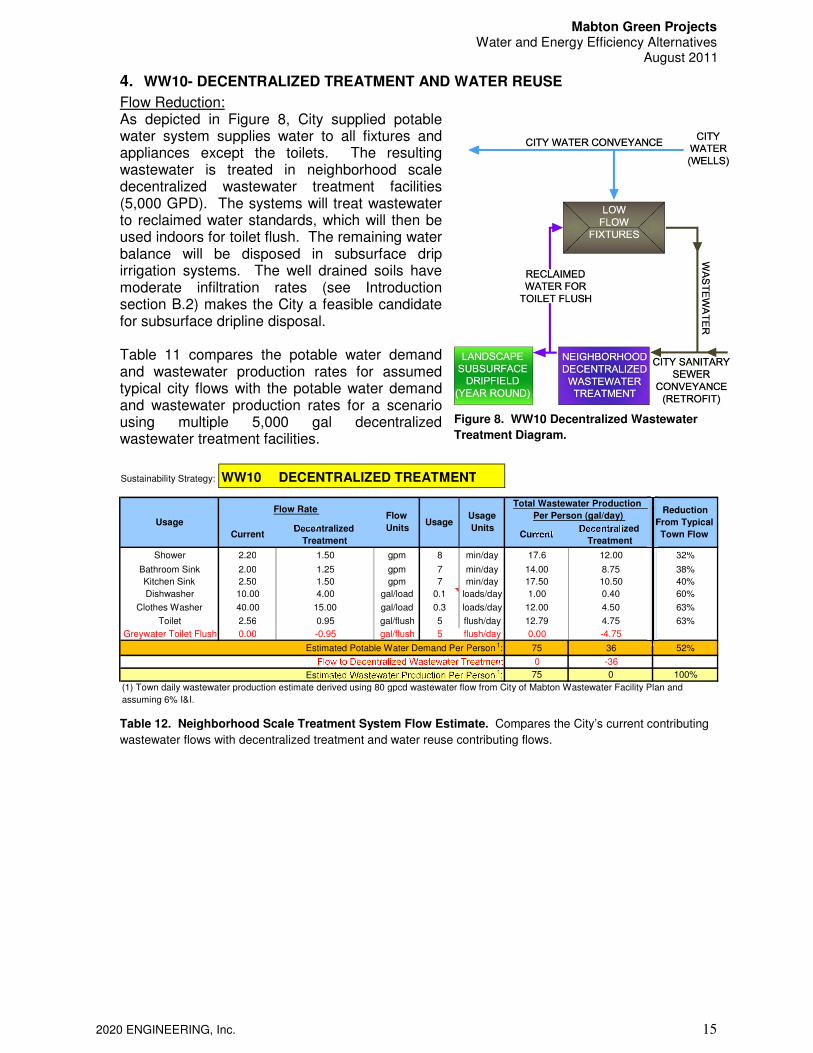
Flow Reduction: As depicted in Figure 8, City supplied potable water system supplies water to all fixtures and appliances except the toilets. The resulting wastewater is treated in neighborhood scale decentralized wastewater treatment facilities (5,000 GPD). The systems will treat wastewater to reclaimed water standards, which will then be used indoors for toilet flush. The remaining water balance will be disposed in subsurface drip irrigation systems. The well drained soils have moderate infiltration rates (see Introduction section B.2) makes the City a feasible candidate for subsurface dripline disposal. Table 11 compares the potable water demand and wastewater production rates for assumed typical city flows with the potable water demand and wastewater production rates for a scenario using multiple 5,000 gal decentralized wastewater treatment facilities.
Sustainability Strategy: WW10 DECENTRALIZED TREATMENT
CurrentDecentralized
TreatmentCurrent
Decentralized
Treatment
Shower 2.20 1.50 gpm 8 min/day 17.6 12.00 32%
Bathroom Sink 2.00 1.25 gpm 7 min/day 14.00 8.75 38%
Kitchen Sink 2.50 1.50 gpm 7 min/day 17.50 10.50 40%
Dishwasher 10.00 4.00 gal/load 0.1 loads/day 1.00 0.40 60%
Clothes Washer 40.00 15.00 gal/load 0.3 loads/day 12.00 4.50 63%
Toilet 2.56 0.95 gal/flush 5 flush/day 12.79 4.75 63%
Greywater Toilet Flush 0.00 -0.95 gal/flush 5 flush/day 0.00 -4.75
75 36 52%
0 -36
75 0 100% Estimated Wastewater Production Per Person 1 : (1) Town daily wastewater production estimate derived using 80 gpcd wastewater flow from City of Mabton Wastewater Facility Plan and
assuming 6% I&I.
Usage
Flow to Decentralized Wastewater Treatment
Estimated Potable Water Demand Per Person1 :
Reduction
From Typical
Town Flow
Flow RateFlow
UnitsUsage
Usage
Units
Total Wastewater Production
Per Person (gal/day)
Figure 8. WW10 Decentralized Wastewater
Treatment Diagram.
Table 12. Neighborhood Scale Treatment System Flow Estimate. Compares the City’s current contributing
wastewater flows with decentralized treatment and water reuse contributing flows.
Mabton Green Projects Water and Energy Efficiency Alternatives
August 2011
2020 ENGINEERING, Inc. 16
Cost Estimate:
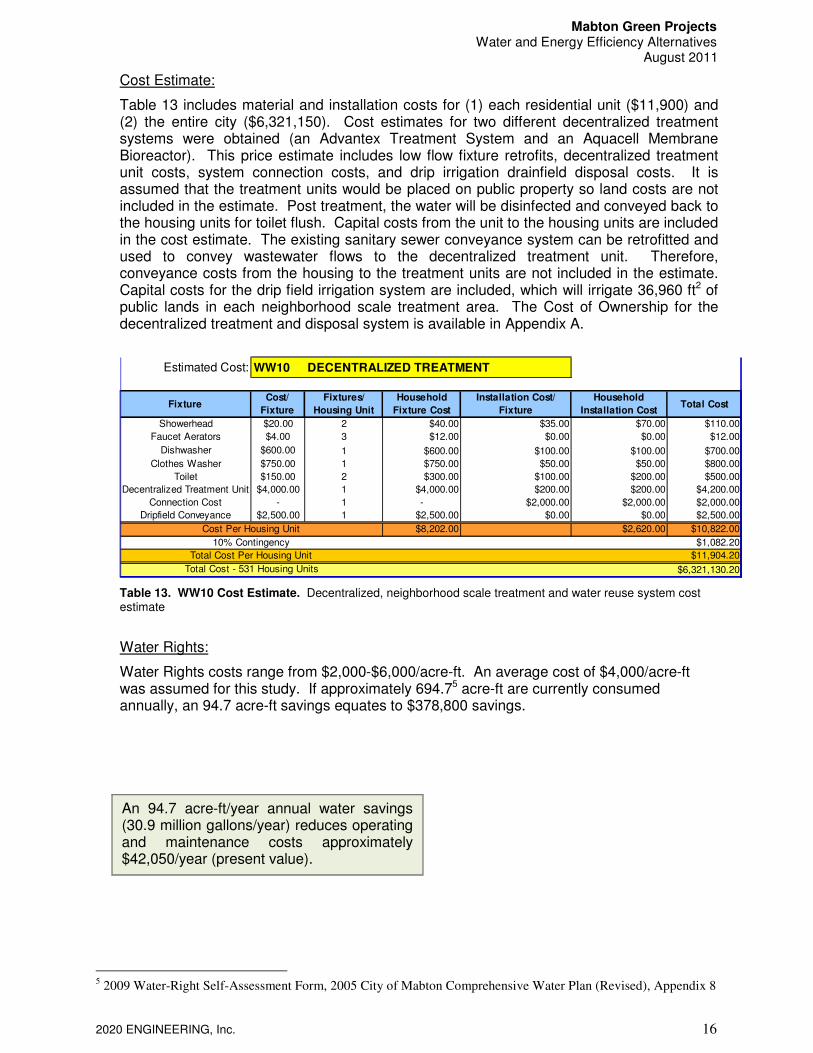
Table 13 includes material and installation costs for (1) each residential unit ($11,900) and (2) the entire city ($6,321,150). Cost estimates for two different decentralized treatment systems were obtained (an Advantex Treatment System and an Aquacell Membrane Bioreactor). This price estimate includes low flow fixture retrofits, decentralized treatment unit costs, system connection costs, and drip irrigation drainfield disposal costs. It is assumed that the treatment units would be placed on public property so land costs are not included in the estimate. Post treatment, the water will be disinfected and conveyed back to the housing units for toilet flush. Capital costs from the unit to the housing units are included in the cost estimate. The existing sanitary sewer conveyance system can be retrofitted and used to convey wastewater flows to the decentralized treatment unit. Therefore, conveyance costs from the housing to the treatment units are not included in the estimate. Capital costs for the drip field irrigation system are included, which will irrigate 36,960 ft2 of public lands in each neighborhood scale treatment area. The Cost of Ownership for the decentralized treatment and disposal system is available in Appendix A.
Table 13. WW10 Cost Estimate. Decentralized, neighborhood scale treatment and water reuse system cost estimate
Water Rights:
Water Rights costs range from $2,000-$6,000/acre-ft. An average cost of $4,000/acre-ft was assumed for this study. If approximately 694.75 acre-ft are currently consumed annually, an 94.7 acre-ft savings equates to $378,800 savings.
5 2009 Water-Right Self-Assessment Form, 2005 City of Mabton Comprehensive Water Plan (Revised), Appendix 8
Estimated Cost: WW10 DECENTRALIZED TREATMENT
FixtureCost/
Fixture
Fixtures/
Housing Unit
Household
Fixture Cost
Installation Cost/
Fixture
Household
Installation CostTotal Cost
Showerhead $20.00 2 $40.00 $35.00 $70.00 $110.00
Faucet Aerators $4.00 3 $12.00 $0.00 $0.00 $12.00
Dishwasher $600.00 1 $600.00 $100.00 $100.00 $700.00
Clothes Washer $750.00 1 $750.00 $50.00 $50.00 $800.00
Toilet $150.00 2 $300.00 $100.00 $200.00 $500.00
Decentralized Treatment Unit $4,000.00 1 $4,000.00 $200.00 $200.00 $4,200.00
Connection Cost - 1 - $2,000.00 $2,000.00 $2,000.00
Dripfield Conveyance $2,500.00 1 $2,500.00 $0.00 $0.00 $2,500.00
$8,202.00 $2,620.00 $10,822.00
$1,082.20
$11,904.20
$6,321,130.20
Cost Per Housing Unit
10% Contingency
Total Cost Per Housing Unit
Total Cost - 531 Housing Units
An 94.7 acre-ft/year annual water savings (30.9 million gallons/year) reduces operating and maintenance costs approximately $42,050/year (present value).
Mabton Green Projects Water and Energy Efficiency Alternatives
August 2011
2020 ENGINEERING, Inc. 17
E. Summary (Part 1: Water Efficiency)
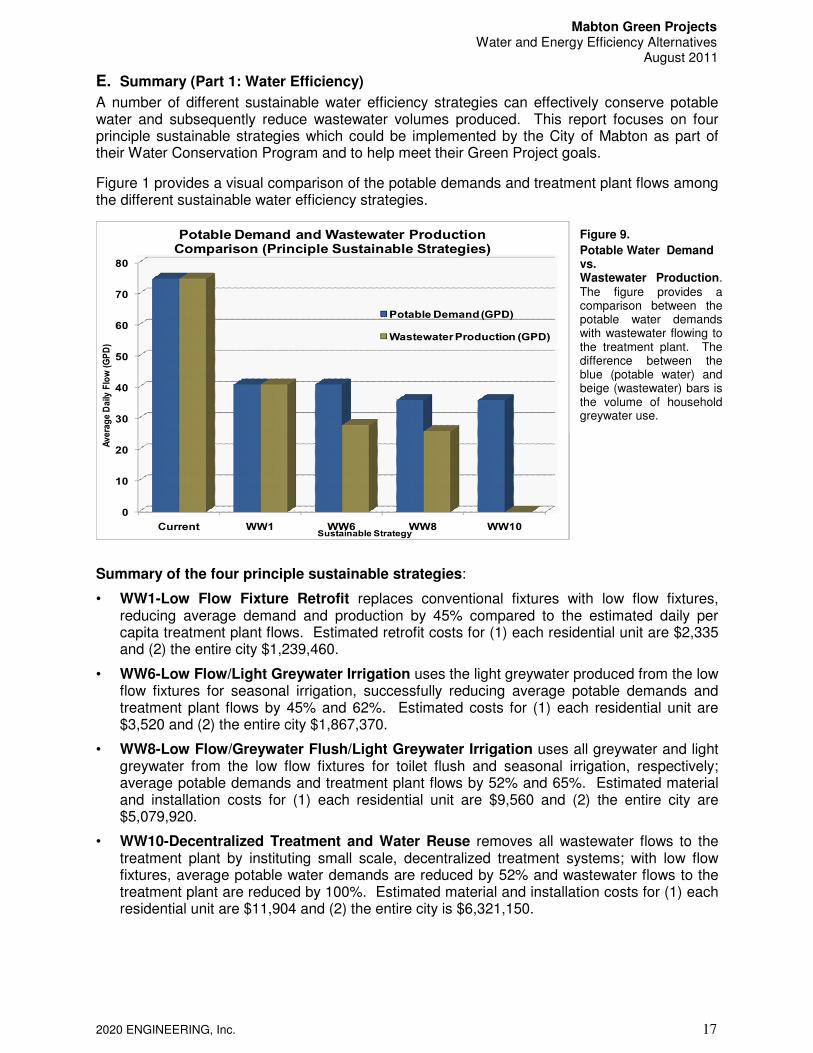
A number of different sustainable water efficiency strategies can effectively conserve potable water and subsequently reduce wastewater volumes produced. This report focuses on four principle sustainable strategies which could be implemented by the City of Mabton as part of their Water Conservation Program and to help meet their Green Project goals.
Figure 1 provides a visual comparison of the potable demands and treatment plant flows among the different sustainable water efficiency strategies.
Summary of the four principle sustainable strategies:
• WW1-Low Flow Fixture Retrofit replaces conventional fixtures with low flow fixtures, reducing average demand and production by 45% compared to the estimated daily per capita treatment plant flows. Estimated retrofit costs for (1) each residential unit are $2,335 and (2) the entire city $1,239,460.
• WW6-Low Flow/Light Greywater Irrigation uses the light greywater produced from the low flow fixtures for seasonal irrigation, successfully reducing average potable demands and treatment plant flows by 45% and 62%. Estimated costs for (1) each residential unit are $3,520 and (2) the entire city $1,867,370.
• WW8-Low Flow/Greywater Flush/Light Greywater Irrigation uses all greywater and light greywater from the low flow fixtures for toilet flush and seasonal irrigation, respectively; average potable demands and treatment plant flows by 52% and 65%. Estimated material and installation costs for (1) each residential unit are $9,560 and (2) the entire city are $5,079,920.
• WW10-Decentralized Treatment and Water Reuse removes all wastewater flows to the treatment plant by instituting small scale, decentralized treatment systems; with low flow fixtures, average potable water demands are reduced by 52% and wastewater flows to the treatment plant are reduced by 100%. Estimated material and installation costs for (1) each residential unit are $11,904 and (2) the entire city is $6,321,150.
Figure 9.
Potable Water Demand vs. Wastewater Production. The figure provides a comparison between the potable water demands with wastewater flowing to the treatment plant. The difference between the blue (potable water) and beige (wastewater) bars is the volume of household greywater use.
Mabton Green Projects Water and Energy Efficiency Alternatives
August 2011
2020 ENGINEERING, Inc. 18
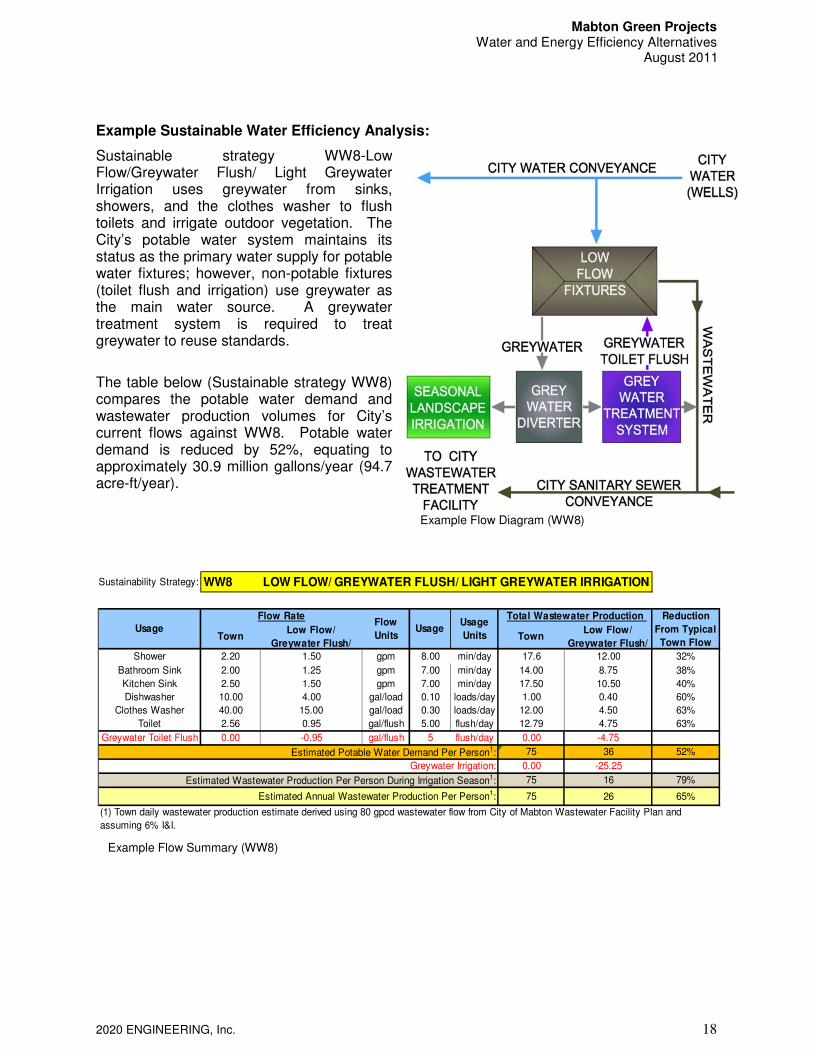
Example Sustainable Water Efficiency Analysis:
Sustainable strategy WW8-Low Flow/Greywater Flush/ Light Greywater Irrigation uses greywater from sinks, showers, and the clothes washer to flush toilets and irrigate outdoor vegetation. The City’s potable water system maintains its status as the primary water supply for potable water fixtures; however, non-potable fixtures (toilet flush and irrigation) use greywater as the main water source. A greywater treatment system is required to treat greywater to reuse standards.
The table below (Sustainable strategy WW8) compares the potable water demand and wastewater production volumes for City’s current flows against WW8. Potable water demand is reduced by 52%, equating to approximately 30.9 million gallons/year (94.7 acre-ft/year).
Sustainability Strategy: WW8 LOW FLOW/ GREYWATER FLUSH/ LIGHT GREYWATER IRRIGATION
TownLow Flow/
Greywater Flush/ Town
Low Flow/
Greywater Flush/
Shower 2.20 1.50 gpm 8.00 min/day 17.6 12.00 32%
Bathroom Sink 2.00 1.25 gpm 7.00 min/day 14.00 8.75 38%
Kitchen Sink 2.50 1.50 gpm 7.00 min/day 17.50 10.50 40%
Dishwasher 10.00 4.00 gal/load 0.10 loads/day 1.00 0.40 60%
Clothes Washer 40.00 15.00 gal/load 0.30 loads/day 12.00 4.50 63%
Toilet 2.56 0.95 gal/flush 5.00 flush/day 12.79 4.75 63%
Greywater Toilet Flush 0.00 -0.95 gal/flush 5 flush/day 0.00 -4.75
75 36 52%
0.00 -25.25
75 16 79%
75 26 65%
Reduction
From Typical
Town Flow
Estimated Wastewater Production Per Person During Irrigation Season1:
Estimated Potable Water Demand Per Person1:
Greywater Irrigation:
Flow
UnitsUsage
Usage
Units
(1) Town daily wastewater production estimate derived using 80 gpcd wastewater flow from City of Mabton Wastewater Facility Plan and
assuming 6% I&I.
Estimated Annual Wastewater Production Per Person1:
Total Wastewater Production
Usage
Flow Rate
Example Flow Diagram (WW8)
Example Flow Summary (WW8)
Mabton Green Projects Water and Energy Efficiency Alternatives
August 2011
2020 ENGINEERING, Inc. 19
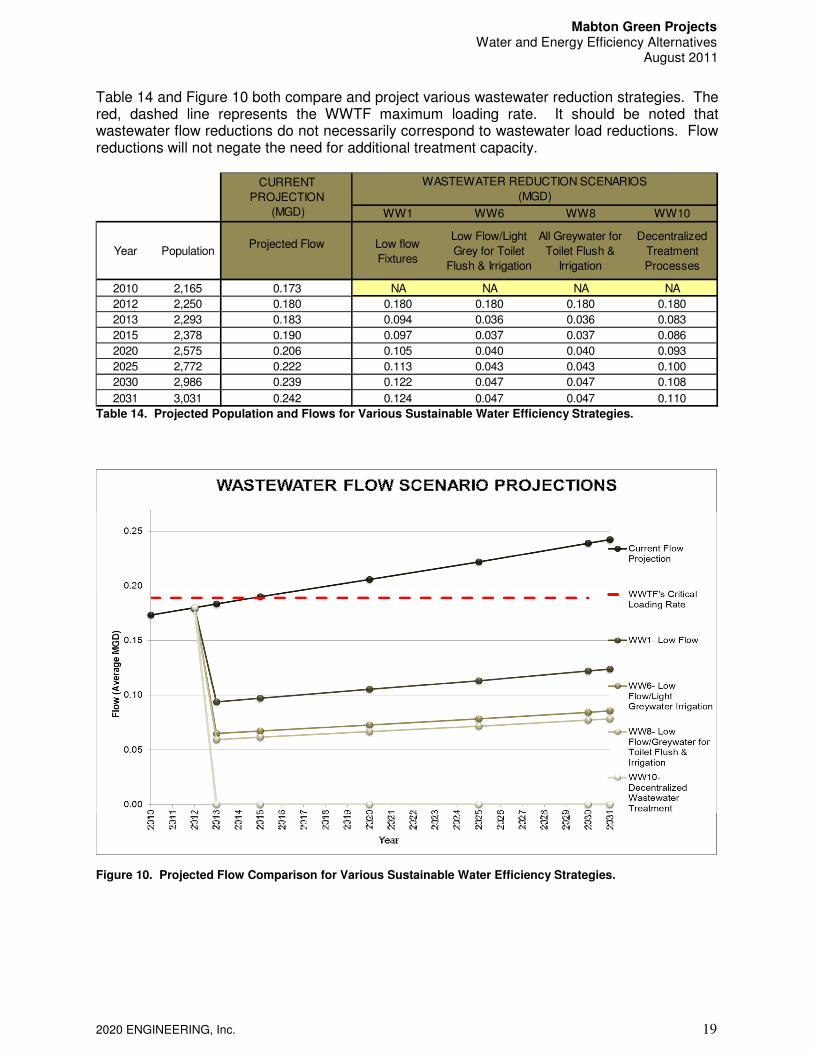
Table 14 and Figure 10 both compare and project various wastewater reduction strategies. The red, dashed line represents the WWTF maximum loading rate. It should be noted that wastewater flow reductions do not necessarily correspond to wastewater load reductions. Flow reductions will not negate the need for additional treatment capacity.
Table 14. Projected Population and Flows for Various Sustainable Water Efficiency Strategies.
Figure 10. Projected Flow Comparison for Various Sustainable Water Efficiency Strategies.
WW1 WW6 WW8 WW10
Year PopulationProjected Flow Low flow
Fixtures
Low Flow/Light
Grey for Toilet
Flush & Irrigation
All Greywater for
Toilet Flush &
Irrigation
Decentralized
Treatment
Processes
2010 2,165 0.173 NA NA NA NA
2012 2,250 0.180 0.180 0.180 0.180 0.180
2013 2,293 0.183 0.094 0.036 0.036 0.083
2015 2,378 0.190 0.097 0.037 0.037 0.086
2020 2,575 0.206 0.105 0.040 0.040 0.093
2025 2,772 0.222 0.113 0.043 0.043 0.100
2030 2,986 0.239 0.122 0.047 0.047 0.108
2031 3,031 0.242 0.124 0.047 0.047 0.110
WASTEWATER REDUCTION SCENARIOS
(MGD)
CURRENT
PROJECTION
(MGD)
Mabton Green Projects Water and Energy Efficiency Alternatives
August 2011
2020 ENGINEERING, Inc. 20
Part 2: Energy Efficiency (Natural Wastewater Treatment Alternatives)
A. Introduction
The purpose of this portion of the report is to present a low energy alternative to upgrade to the wastewater management system for the City of Mabton, Washington. The ideal wastewater management system will provide effective treatment with low energy input, while also providing an attractive system with wetlands and wildlife habitat.
A range of low energy wastewater treatment alternatives were evaluated for the City of Mabton WWTF upgrade. The alternatives evaluated range from limited discharge systems with no energy required to multi-stage process requiring aeration, pumping and mixing. Of the alternatives evaluated, a three-stage system was selected as the best overall alternative. These selected alternatives are described below. A discussion of the full range of alternatives is presented in subsequent sections.
B. Natural Treatment Systems (Overview)
Natural treatment systems can be entirely passive, which results in the least energy inputs and the greatest land requirements. Natural systems can also be supplemented with mechanical aeration systems, which drastically reduces the land area required but increases the power consumption. This study has evaluated both “passive” and “intensified” alternatives for both the lagoon and wetland stages of the overall treatment process. This study concludes that a combination of lagoons and wetlands would provide the optimal combination of a low-energy natural treatment system for the City of Mabton. Lagoon systems have been demonstrated to be more effective in handling organic loading and flow variations, while wetland systems have been demonstrated to be more effective at achieving low effluent concentrations (Kadlec, 2004). Combining these two natural systems into a staged pond-wetland process results in an overall treatment train capable of processing high organic loads and achieving low effluent concentrations. This report presents an initial preliminary evaluation of low-energy wastewater treatment alternatives for the City of Mabton. These evaluations are based on meeting design criteria listed in Table 15 and Table 16 as the minimum. Additional treatment for nitrogen removal to 10 mg/L is also evaluated along with options for phosphorus removal to <1 mg/L.
1. Lagoon Options
Lagoon-based treatment systems suitable for the City of Mabton could be entirely passive (facultative lagoons), or mechanically aerated (partial-mix aerated lagoons). Facultative Lagoons:
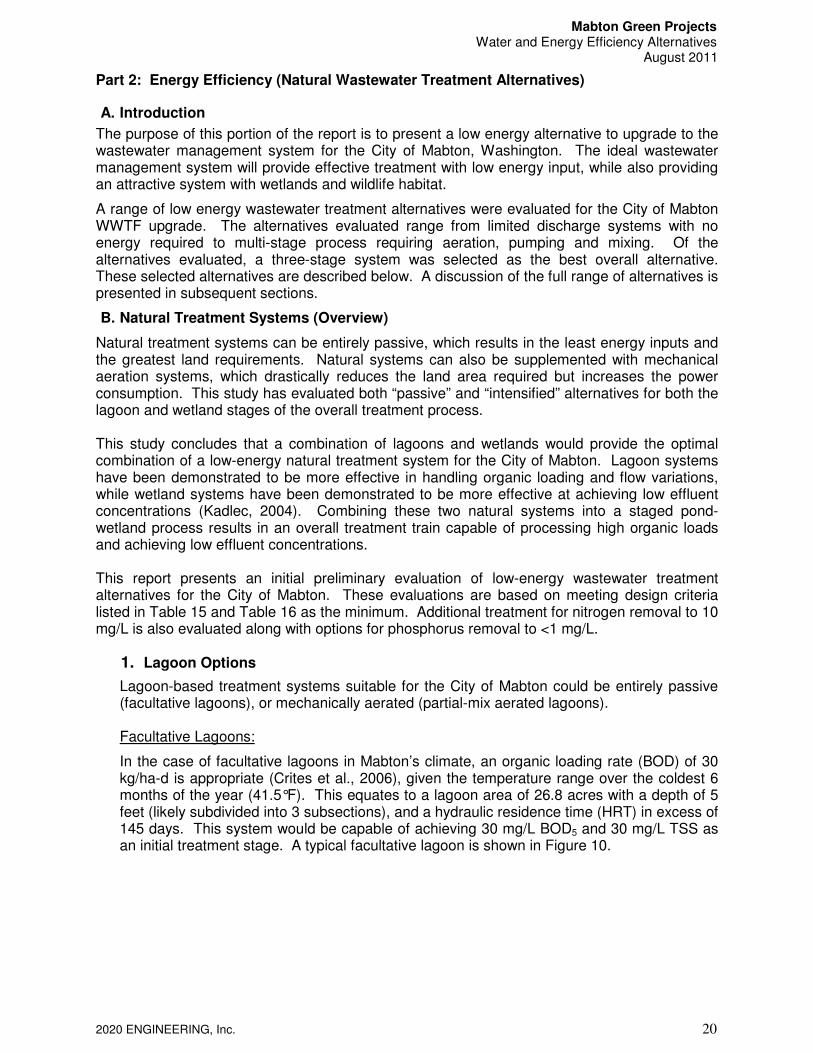
In the case of facultative lagoons in Mabton’s climate, an organic loading rate (BOD) of 30 kg/ha-d is appropriate (Crites et al., 2006), given the temperature range over the coldest 6 months of the year (41.5°F). This equates to a lagoon area of 26.8 acres with a depth of 5 feet (likely subdivided into 3 subsections), and a hydraulic residence time (HRT) in excess of 145 days. This system would be capable of achieving 30 mg/L BOD5 and 30 mg/L TSS as an initial treatment stage. A typical facultative lagoon is shown in Figure 10.
Mabton Green Projects Water and Energy Efficiency Alternatives
August 2011
2020 ENGINEERING, Inc. 21
Figure 11. Typical Facultative Lagoon
Because a facultative lagoon is entirely passive, there is zero mechanical/electrical energy input. Aerated Lagoons:
Aerated lagoons are designed to be much smaller and compact than facultative lagoons. They rely on mechanical aeration systems to satisfy the oxygen demand required for wastewater treatment, and often have internal baffle curtains to improve hydraulics and treatment efficiency. In the case of Mabton, a partially aerated lagoon would be approximately 4 acres in size, with a depth of 10 feet (Alternative B). The partially aerated lagoon would likely use a combination of fine bubble aeration and mixers to achieve required oxygen transfer and mixing. The aerated lagoon would likely have two separate cells, each with an internal baffle curtain (creating four separate compartments overall). The system would be capable of achieving 30 mg/L BOD5 and 30 mg/L TSS as an initial treatment stage. The aerated lagoon option has been sized according to Rich (1999).
Mabton Green Projects Water and Energy Efficiency Alternatives
August 2011
2020 ENGINEERING, Inc. 22
2. Wetland Options
Constructed wetlands are a treatment technology that have been applied for over 40 years. There are several types of constructed wetlands:
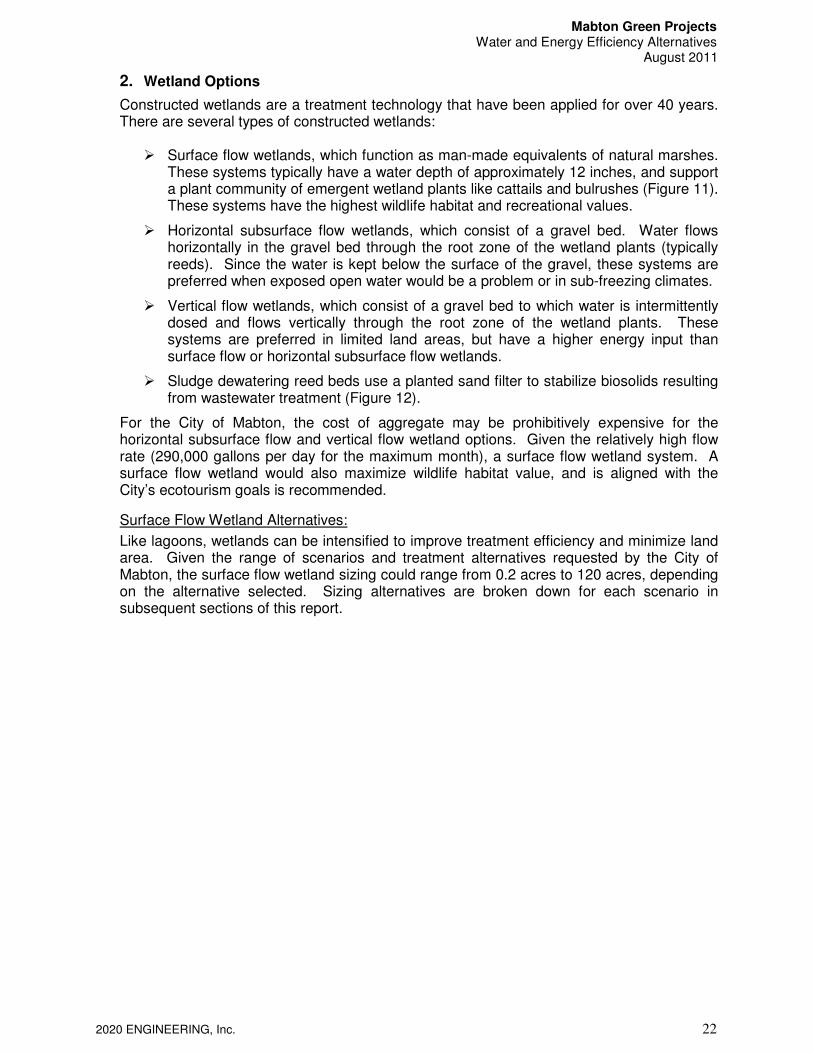
� Surface flow wetlands, which function as man-made equivalents of natural marshes.
These systems typically have a water depth of approximately 12 inches, and support a plant community of emergent wetland plants like cattails and bulrushes (Figure 11). These systems have the highest wildlife habitat and recreational values.
� Horizontal subsurface flow wetlands, which consist of a gravel bed. Water flows horizontally in the gravel bed through the root zone of the wetland plants (typically reeds). Since the water is kept below the surface of the gravel, these systems are preferred when exposed open water would be a problem or in sub-freezing climates.
� Vertical flow wetlands, which consist of a gravel bed to which water is intermittently dosed and flows vertically through the root zone of the wetland plants. These systems are preferred in limited land areas, but have a higher energy input than surface flow or horizontal subsurface flow wetlands.
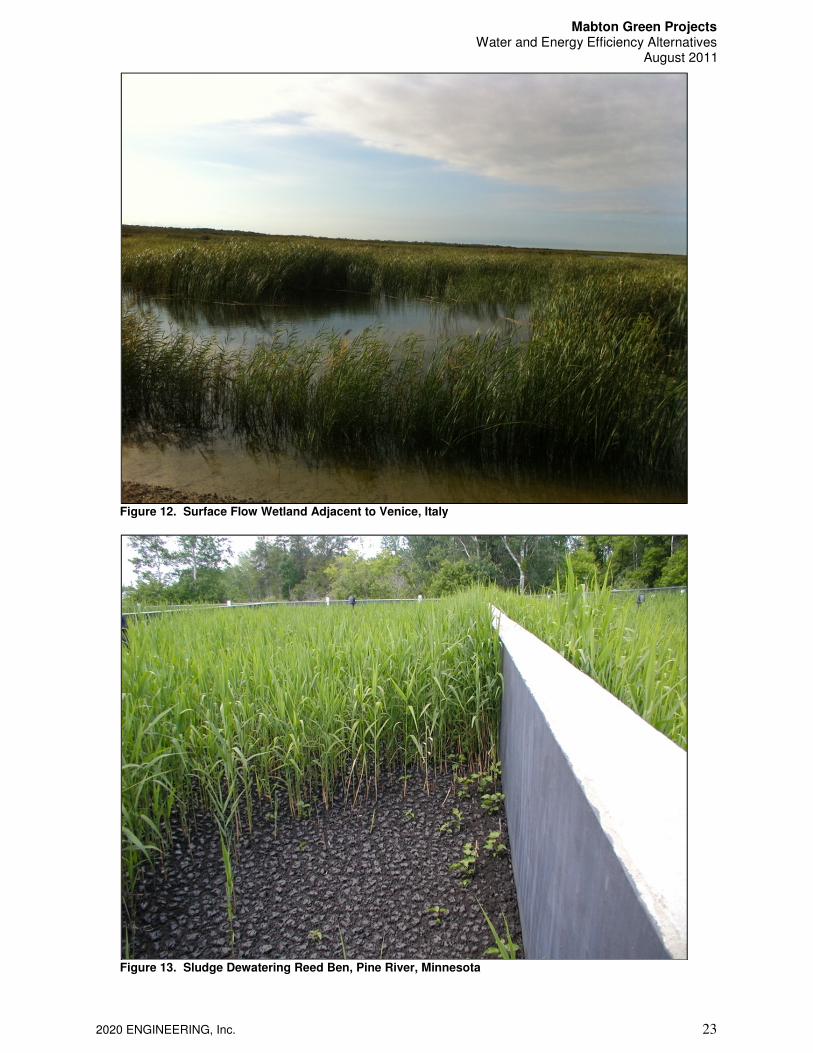
� Sludge dewatering reed beds use a planted sand filter to stabilize biosolids resulting from wastewater treatment (Figure 12).
For the City of Mabton, the cost of aggregate may be prohibitively expensive for the horizontal subsurface flow and vertical flow wetland options. Given the relatively high flow rate (290,000 gallons per day for the maximum month), a surface flow wetland system. A surface flow wetland would also maximize wildlife habitat value, and is aligned with the City’s ecotourism goals is recommended.
Surface Flow Wetland Alternatives:
Like lagoons, wetlands can be intensified to improve treatment efficiency and minimize land area. Given the range of scenarios and treatment alternatives requested by the City of Mabton, the surface flow wetland sizing could range from 0.2 acres to 120 acres, depending on the alternative selected. Sizing alternatives are broken down for each scenario in subsequent sections of this report.
Mabton Green Projects Water and Energy Efficiency Alternatives
August 2011
2020 ENGINEERING, Inc. 23
Figure 12. Surface Flow Wetland Adjacent to Venice, Italy
Figure 13. Sludge Dewatering Reed Ben, Pine River, Minnesota
Mabton Green Projects Water and Energy Efficiency Alternatives
August 2011
2020 ENGINEERING, Inc. 24
C. Wastewater Description and Discharge Standards
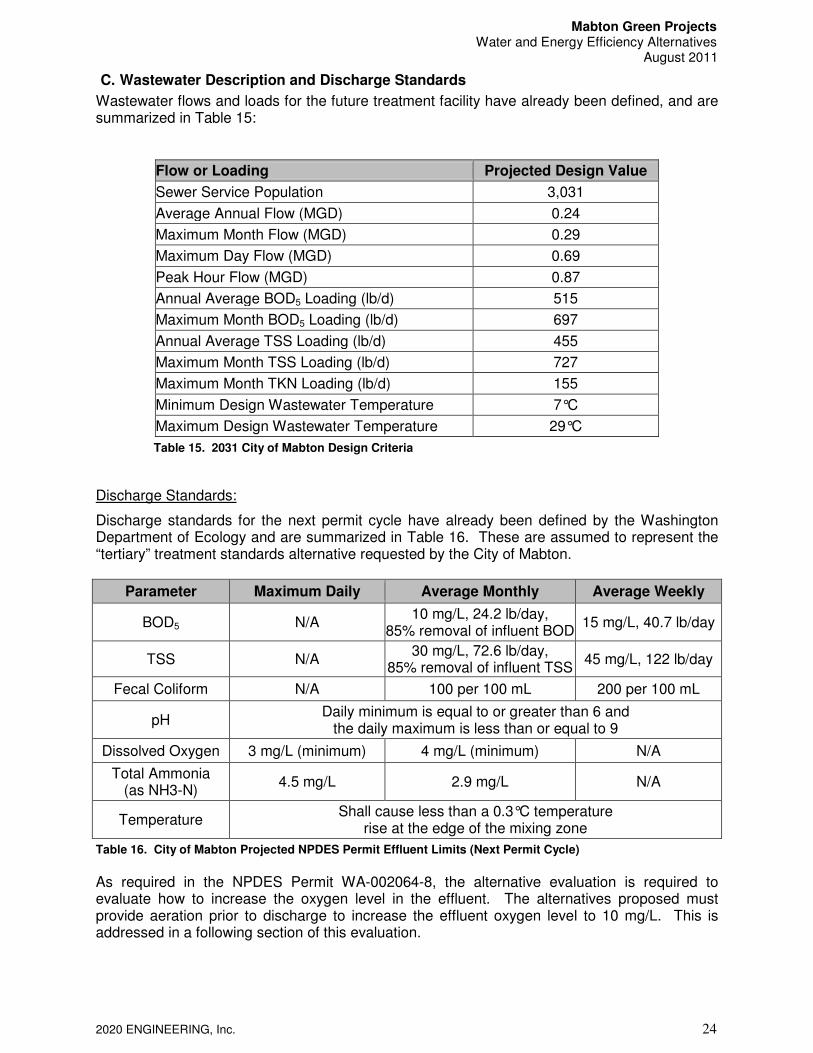
Wastewater flows and loads for the future treatment facility have already been defined, and are summarized in Table 15:
Flow or Loading Projected Design Value
Sewer Service Population 3,031
Average Annual Flow (MGD) 0.24
Maximum Month Flow (MGD) 0.29
Maximum Day Flow (MGD) 0.69
Peak Hour Flow (MGD) 0.87
Annual Average BOD5 Loading (lb/d) 515
Maximum Month BOD5 Loading (lb/d) 697
Annual Average TSS Loading (lb/d) 455
Maximum Month TSS Loading (lb/d) 727
Maximum Month TKN Loading (lb/d) 155
Minimum Design Wastewater Temperature 7°C
Maximum Design Wastewater Temperature 29°C
Table 15. 2031 City of Mabton Design Criteria
Discharge Standards:
Discharge standards for the next permit cycle have already been defined by the Washington Department of Ecology and are summarized in Table 16. These are assumed to represent the “tertiary” treatment standards alternative requested by the City of Mabton.
Parameter Maximum Daily Average Monthly Average Weekly
BOD5 N/A 10 mg/L, 24.2 lb/day,
85% removal of influent BOD 15 mg/L, 40.7 lb/day
TSS N/A 30 mg/L, 72.6 lb/day,
85% removal of influent TSS 45 mg/L, 122 lb/day
Fecal Coliform N/A 100 per 100 mL 200 per 100 mL
pH Daily minimum is equal to or greater than 6 and
the daily maximum is less than or equal to 9
Dissolved Oxygen 3 mg/L (minimum) 4 mg/L (minimum) N/A
Total Ammonia (as NH3-N)
4.5 mg/L 2.9 mg/L N/A
Temperature Shall cause less than a 0.3°C temperature
rise at the edge of the mixing zone
Table 16. City of Mabton Projected NPDES Permit Effluent Limits (Next Permit Cycle)
As required in the NPDES Permit WA-002064-8, the alternative evaluation is required to evaluate how to increase the oxygen level in the effluent. The alternatives proposed must provide aeration prior to discharge to increase the effluent oxygen level to 10 mg/L. This is addressed in a following section of this evaluation.
Mabton Green Projects Water and Energy Efficiency Alternatives
August 2011
2020 ENGINEERING, Inc. 25
Fecal Coliform Standards:
The low energy treatment alternatives would likely meet discharge requirements for fecal coliform by the disinfection method proposed in the conventional upgrade evaluation (UV system). The effluent from any of the alternatives would be suitable for ultraviolet light disinfection to meet a discharge limits for fecal coliform. The cost and power requirements for disinfection were taken from information provided by Grey & Osborne from their WWTF upgrade recommendations. Future Nutrient Removal:
The low energy treatment alternative shall be able to meet a future projected permit limit of 10 mg/L for Total Nitrogen (TN). The facility shall be capable of being modified to meet a future phosphorus limit which might be less than 1 mg/L.
City of Mabton Location and Climate:
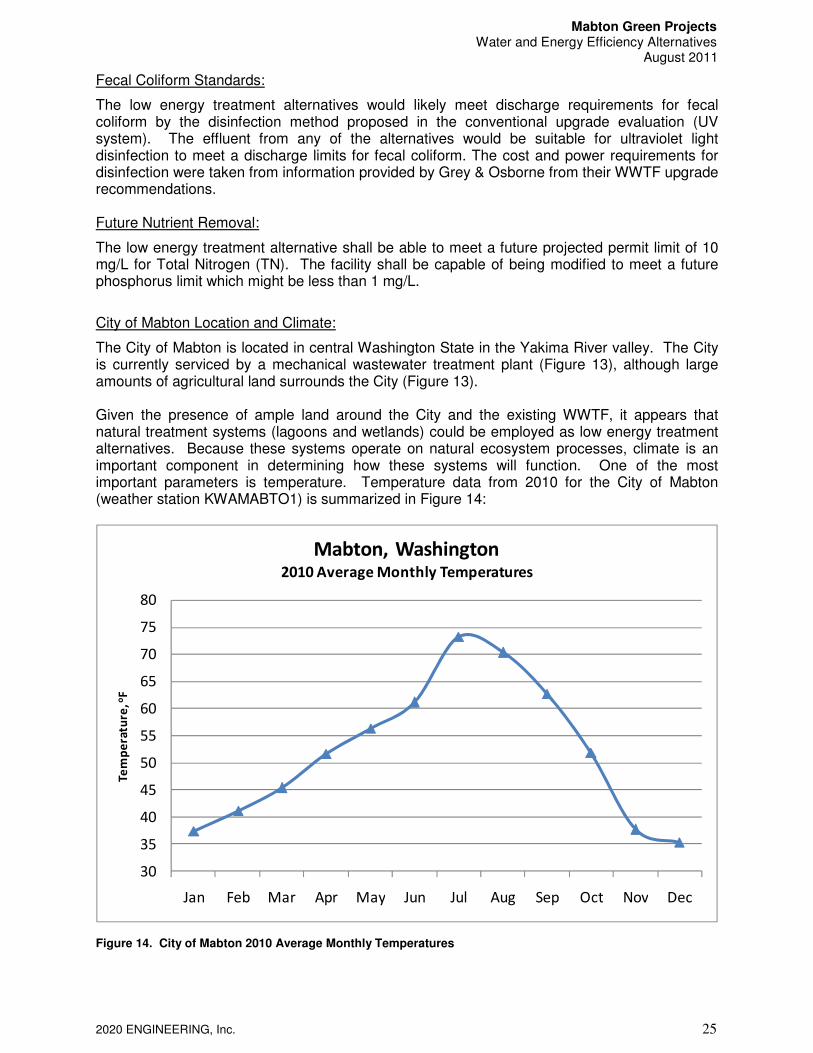
The City of Mabton is located in central Washington State in the Yakima River valley. The City is currently serviced by a mechanical wastewater treatment plant (Figure 13), although large amounts of agricultural land surrounds the City (Figure 13). Given the presence of ample land around the City and the existing WWTF, it appears that natural treatment systems (lagoons and wetlands) could be employed as low energy treatment alternatives. Because these systems operate on natural ecosystem processes, climate is an important component in determining how these systems will function. One of the most important parameters is temperature. Temperature data from 2010 for the City of Mabton (weather station KWAMABTO1) is summarized in Figure 14:
Figure 14. City of Mabton 2010 Average Monthly Temperatures
30
35
40
45
50
55
60
65
70
75
80
Jan Feb Mar Apr May Jun Jul Aug Sep Oct Nov Dec
Te
mp
era
ture
, oF
Mabton, Washington2010 Average Monthly Temperatures
Mabton Green Projects Water and Energy Efficiency Alternatives
August 2011
2020 ENGINEERING, Inc. 26
As shown in Figure 13, during 2010 the maximum average monthly temperature occurred in July (73.2˚F), and the minimum monthly average temperature occurred December (35.3˚F). This has important consequences for the design of natural treatment systems. Due to the long hydraulic residence times present in most lagoon and wetland systems, the water temperature will equilibrate to the average monthly air temperature (Kadlec and Wallace, 2009).
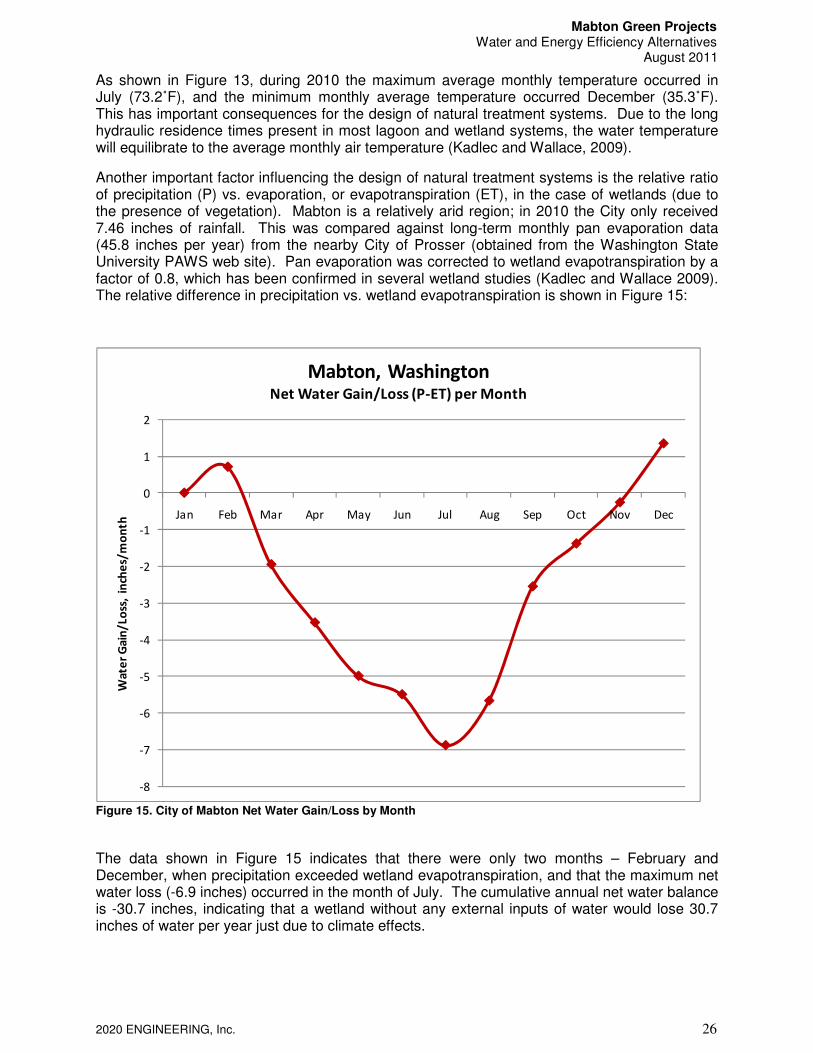
Another important factor influencing the design of natural treatment systems is the relative ratio of precipitation (P) vs. evaporation, or evapotranspiration (ET), in the case of wetlands (due to the presence of vegetation). Mabton is a relatively arid region; in 2010 the City only received 7.46 inches of rainfall. This was compared against long-term monthly pan evaporation data (45.8 inches per year) from the nearby City of Prosser (obtained from the Washington State University PAWS web site). Pan evaporation was corrected to wetland evapotranspiration by a factor of 0.8, which has been confirmed in several wetland studies (Kadlec and Wallace 2009). The relative difference in precipitation vs. wetland evapotranspiration is shown in Figure 15:
Figure 15. City of Mabton Net Water Gain/Loss by Month
The data shown in Figure 15 indicates that there were only two months – February and December, when precipitation exceeded wetland evapotranspiration, and that the maximum net water loss (-6.9 inches) occurred in the month of July. The cumulative annual net water balance is -30.7 inches, indicating that a wetland without any external inputs of water would lose 30.7 inches of water per year just due to climate effects.
-8
-7
-6
-5
-4
-3
-2
-1
0
1
2
Jan Feb Mar Apr May Jun Jul Aug Sep Oct Nov Dec
Wa
ter
Ga
in/
Lo
ss,
inch
es/
mo
nth
Mabton, WashingtonNet Water Gain/Loss (P-ET) per Month
Mabton Green Projects Water and Energy Efficiency Alternatives
August 2011
2020 ENGINEERING, Inc. 27
D. Low Energy Wastewater Treatment Alternatives
The low energy wastewater treatment alternatives evaluated in this report both have first stages that achieve secondary treatment – BOD5 of 25 mg/L and TSS of 30 mg/L. The first stages would need to be followed by further treatment to achieve the ammonia discharge limits in winter. The initial treatment stage would be a lagoon – either the facultative lagoon option or the aerated lagoon option. Either lagoon system would be capable of meeting approximately the same effluent standards (30 mg/L BOD, 30 mg/L TSS). The water discharged from the lagoon would then be polished in a surface flow wetland designed to meet a BOD5 of 13.8 mg/L, which should be sufficient for final treatment to meet the discharge standards for BOD, TSS and Ammonia.
1. Facultative Lagoon and Surface Flow Wetland
Alternative A-1 – Secondary Treatment ONLY- Facultative Lagoon + Surface Flow Wetland
Energy for Facultative Lagoon Treatment: 0 Energy for Surface Flow Wetland Treatment: 62,800 kW-hr per year Land Requirement: 28 acres (22 for lagoon + 6 for wetland) Discharge Standard 25 mg/L BOD5, 30 mg/L TSS
Note: Polishing and ammonia removal are presented in following section
2. Aerated Lagoon and Surface Flow Wetland
Alternative B-1 – Secondary Treatment ONLY-Aerated Lagoon + Surface Flow Wetland
Energy for Aerated Lagoon Treatment: 300,000 kW-hr per year Energy for Surface Flow Wetland Treatment: 62,800 kW-hr per year Land Requirement: 9.7 acres (4 for lagoon + 5.7 for wetland) Discharge Standard 25 mg/L BOD5, 30 mg/L TSS
Note: Polishing and ammonia removal are presented in following section
Either Scenario A-1 or B-1 require additional treatment to meet the future permit limits for ammonia that the Department of Ecology intends to impose on the City of Mabton (A-2 and B-2 alternatives, see Figures 15 and 17).
3. Aerated Gravel Bed: Third Stage Polishing/Ammonia Removal
The major challenge under the of the upcoming discharge requirements is meeting the average monthly ammonia limit under winter conditions, when the water temperature could be as low as 2°C (35.6°F). This requires either an enlarged surface flow wetland or a third stage treatment system. In order to meet the ammonia standard of 2.9 mg/L 90% of the time, a surface wetland would have to be designed to discharge 1.6 mg/L of ammonia. This analysis indicates that a non-aerated (passive) surface flow wetland cannot meet this standard (the wetland size at 2°C exceeds the area needed for the zero-discharge option).
One possible approach would be an aeration-enhanced surface flow wetland. This is a surface flow wetland with deeper zones placed across its width at intervals. The deeper zones would be aerated with fine bubble diffuser systems. The aeration enhanced wetland to for this approach would have an area requirement of 29.5 acres and an energy demand of about 95,000 kW-hr per year. Aerated wetlands may have difficulty meeting the ammonia
Mabton Green Projects Water and Energy Efficiency Alternatives
August 2011
2020 ENGINEERING, Inc. 28
limit of 2.9 mg/L under winter conditions (2°C). The limit represents the know limit of wetland performance. Consequently there is very little data to support this design in light of regulatory review. Another approach to meet the ammonia discharge limit would be to use an aerated, gravel-bed or subsurface flow wetland to remove ammonia after the surface flow wetlands. This approach has the added advantage of producing low TSS and low turbidity allowing for smaller size or dosing of the subsequent disinfection system. The size and low construction cost of this approach are further advantages of this approach. One technology, known as a SAGR, was developed in Canada specifically to remove ammonia from lagoon effluents (down to water temperatures of 33°F) under very cold winter conditions in Manitoba, Saskatchewan, and Alberta. The SAGR unit would have an area of 0.5 acres and an energy demand of 78,500 kW-hr per year. Other technology options are possible and could be explored further in a more detailed analysis or preliminary engineering.
Third Stage-Polishing and Ammonia Removal with Aerated Gravel Bed
Energy for Aerated Gravel Bed Polishing: 78,500 kW-hr per year Approximate Land Requirement: 0.5 acres Discharge Standard 10 mg/L BOD5, 10 mg/L TSS, 2.9 mg/L NH3-N
4. Zero Discharge and/or Controlled Batch Discharge
With the climate in the Mabton area, it is apparent that a wetland will always “lose” water due to the water balance (P-E or ET). A basin designed to evaporate all of Mabton’s wastewater would require an area of approximately 120 acres. Zero discharge systems already exist. These systems are typically employed in very remote areas where an evaporation pond is not viewed as a nuisance and there is no chance of effluent re-use or discharge of the effluent to surface waters. This could be combined with a facultative lagoon (26 acres) for a zero-energy treatment alternative. If the evaporative basin had a watertight bottom and sides, it would eventually become a salt flat as dissolved solids in the effluent accumulated.
Zero Discharge
Energy for Facultative Lagoon Treatment: None Energy for Evaporation Basin: None Net Land Requirement: 146 acres Discharge Standard: No discharge and/or batch discharge
If the Department of Ecology has different discharge standards for intermittent discharges (Winter or Spring) during high flow periods in the Yakima River, small quantities of water could be released to prevent salt buildup in the wetland. This water would have relatively high total dissolved solids (TDS) due to concentration in the lagoon and wetlands. This alternative represents the most land-intensive option. It is also zero-energy for treatment and avoids most or all discharge requirements, because discharge to the Yakima River would be purely at the discretion of the City. A zero discharge system is not recommended for Mabton since maintaining discharge flows to the Yakima River is part of the current WWTF permit requirements.
Mabton Green Projects Water and Energy Efficiency Alternatives
August 2011
2020 ENGINEERING, Inc. 29
5. Nitrogen Removal
Nitrogen removal could be added to the alternatives outlined above. For initial nitrogen removal, effluent from the wetland or aerated gravel bed would be recycled back to the influent of the lagoon. Nitrate-nitrogen (oxidized ammonia) in the recycle would be consumed by bacteria metabolizing influent BOD. The combined effect of these processes is estimated to remove 80% of the total nitrogen (TN).
To ensure compliance with the 10 mg/L TN limit, a denitrification reactor could be added downstream of the aerated gravel bed reactor. This would be an un-aerated reactor with a BOD source such as ethanol or acetic acid added in controlled dosing. The bacteria films in the reactor consume the remaining nitrate while metabolizing the added BOD. A moving-bed bioreactor (MBBR) is an example of such a technology.
Denitrification – DN Recycle and MBBR Nutrient Removal Energy for Flow Recycling: 31,400 kW-hr per year Energy for MBBR Unit: 78,500 kW-hr per year Total Land Requirement: 0.2 acres
6. Phosphorous Removal
If required in future discharge permits, phosphorus removal can consistently be achieved with alum addition after the facultative lagoon. Phosphorus would precipitate in second lagoon with an area of approximately 2 acres. Accumulated sludge would be removed from this lagoon on a 5 year or longer basis depending on accumulation rates. This management approach could be added at a later date with minor modifications to the treatment process.
7. Sludge Management
Sludge will be generated in the lagoon from the removal of BOD and TSS. Sludge would also be generated from the phosphorus removal processes. This sludge can be dewatered on site in a reed bed for sludge dewatering. Solids from dewatered sludge are a very dry material similar to composted organic material, removed every 5 years and applied to land as a soil amendment. Alternatively, the sludge can be removed in a more liquid form directly from the lagoons and be applied to agricultural land. The latter approach provides a complete sludge management cost, and is listed in Table 17 below.
Sludge Source
Sludge Volume Generated Five Year Management Costs
Annual 5 year based on per gallon cost of:
gal/year Vol., gal. $0.04/gal $0.08/gal
Facultative or Partially Aerated Lagoon Total: Alternatives A-2
120,000 600,000 $24,000 $48,000
Phosphorus Removal Lagoon
180,000 900,000 $36,000 $72,000
Total for Alternative A-2 Plus Phosphorus Removal
300,000 500,000 $60,000 $120,000
Table 17. Sludge Management- Pump and Land Apply
Mabton Green Projects Water and Energy Efficiency Alternatives
August 2011
2020 ENGINEERING, Inc. 30
8. Temperature and Dissolved Oxygen
The dissolved oxygen concentration and water temperature are effluent parameters that may affect the design of the treatment system or timing of the effluent discharge. Effluent temperatures will be significantly affected by heat transfer in the lagoon and wetlands with seasonal variations. Limitations on increases in the river water temperature from effluent discharge may affect the system design and or timing of the discharge. Computer models need to be developed for effluent temperature and increases in river water temperature before further conclusions can be drawn. However, there are modifications to the lagoon design, such as floating vegetated rafts, which can be used to mitigate water temperature changes. One of the Department of Ecology criteria is that the alternative system be capable of achieving a dissolved oxygen (DO) level of 10 mg/L. If the site is flat, cascade aeration is not an option. In that case, a post-treatment aeration chamber would have to be provided to increase the effluent DO. The concentration of DO in the water decreases as the temperature increases. The target DO objective of 10 mg/L can only be met (through conventional aeration methods) when the water temperature is less than 59°F (American Fisheries Society, 1984). Analysis of the data in Figure 13 indicates that from June through September, the water would be too warm to sustain an equilibrium DO concentration above 10 mg/L. The DO concentration can be artificially increased using pure oxygen as a feedstock, but this would significantly add to the operational complexity of the system and may have an adverse impact to aquatic life in the Yakima River due to “fizzing” (spontaneous bubble formation in the effluent). It is recommended that the Washington Department of Ecology be contacted to confirm this standard before engineering controls are implemented to guarantee the 10 mg/L DO standard during the summer months.
9. Disinfection
All of the lagoon and wetland options summarized in this report create wildlife habitat for waterfowl, muskrats, and beavers. Wildlife use of the facility will add fecal coliform bacteria (non-human) to the effluent, so it is highly unlikely the facility could meet the proposed fecal coliform standard (100 per 100 mL) listed in Table 15, without a supplemental disinfection process (except for Scenario 1 – the zero discharge alternative). The disinfection process could be chlorine- or UV-based, but is considered outside of the scope of this evaluation. The use of a UV system is assumed for other references in this report as it is the current recommended method of disinfection listed in the proposed City of Mabton WWTF upgrade plans.
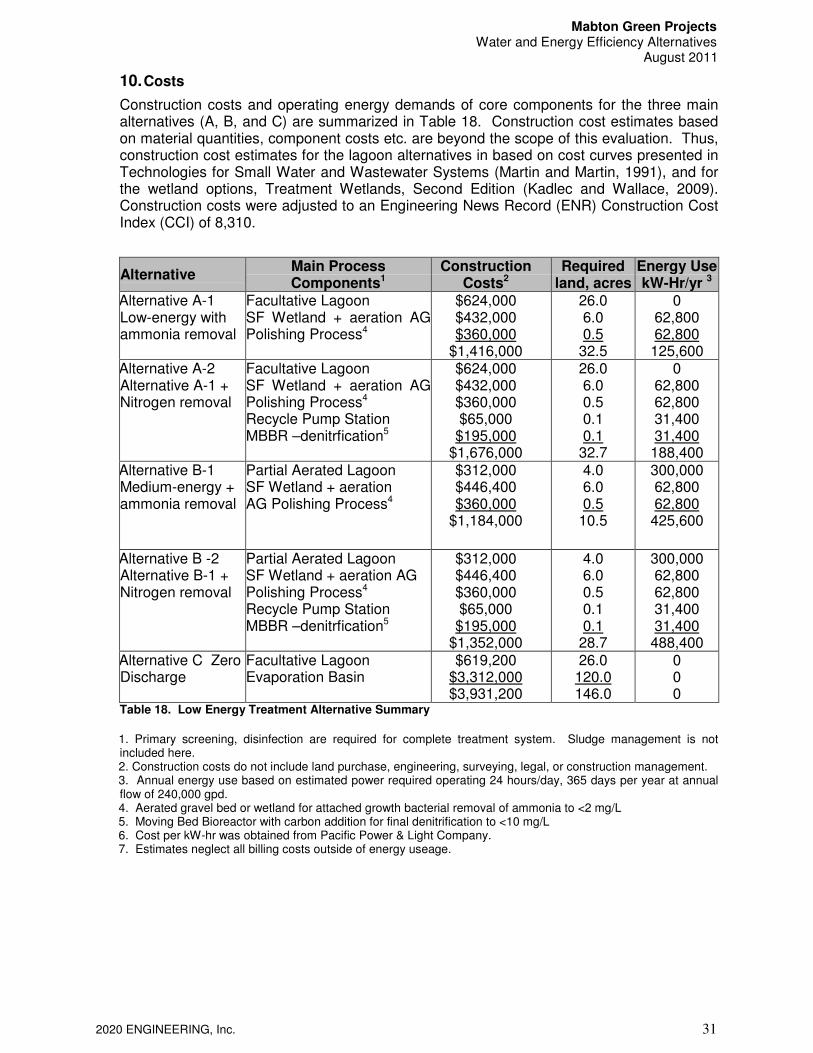
Mabton Green Projects Water and Energy Efficiency Alternatives
August 2011
2020 ENGINEERING, Inc. 31
10. Costs
Construction costs and operating energy demands of core components for the three main alternatives (A, B, and C) are summarized in Table 18. Construction cost estimates based on material quantities, component costs etc. are beyond the scope of this evaluation. Thus, construction cost estimates for the lagoon alternatives in based on cost curves presented in Technologies for Small Water and Wastewater Systems (Martin and Martin, 1991), and for the wetland options, Treatment Wetlands, Second Edition (Kadlec and Wallace, 2009). Construction costs were adjusted to an Engineering News Record (ENR) Construction Cost Index (CCI) of 8,310.
Table 18. Low Energy Treatment Alternative Summary
1. Primary screening, disinfection are required for complete treatment system. Sludge management is not included here. 2. Construction costs do not include land purchase, engineering, surveying, legal, or construction management. 3. Annual energy use based on estimated power required operating 24 hours/day, 365 days per year at annual flow of 240,000 gpd. 4. Aerated gravel bed or wetland for attached growth bacterial removal of ammonia to <2 mg/L 5. Moving Bed Bioreactor with carbon addition for final denitrification to <10 mg/L 6. Cost per kW-hr was obtained from Pacific Power & Light Company. 7. Estimates neglect all billing costs outside of energy useage.
Alternative Main Process Components1
Construction Costs2
Required land, acres
Energy Use kW-Hr/yr 3
Alternative A-1 Low-energy with ammonia removal
Facultative Lagoon SF Wetland + aeration AG Polishing Process4
$624,000 $432,000 $360,000
$1,416,000
26.0 6.0 0.5
32.5
0 62,800 62,800 125,600
Alternative A-2 Alternative A-1 + Nitrogen removal
Facultative Lagoon SF Wetland + aeration AG Polishing Process4 Recycle Pump Station MBBR –denitrfication5
$624,000 $432,000 $360,000 $65,000 $195,000
$1,676,000
26.0 6.0 0.5 0.1 0.1
32.7
0 62,800 62,800 31,400 31,400 188,400
Alternative B-1 Medium-energy + ammonia removal
Partial Aerated Lagoon SF Wetland + aeration AG Polishing Process4
$312,000 $446,400 $360,000
$1,184,000
4.0 6.0 0.5
10.5
300,000 62,800 62,800 425,600
Alternative B -2 Alternative B-1 + Nitrogen removal
Partial Aerated Lagoon SF Wetland + aeration AG Polishing Process4 Recycle Pump Station MBBR –denitrfication5
$312,000 $446,400 $360,000 $65,000 $195,000
$1,352,000
4.0 6.0 0.5 0.1 0.1
28.7
300,000 62,800 62,800 31,400 31,400 488,400
Alternative C Zero Discharge
Facultative Lagoon Evaporation Basin
$619,200 $3,312,000 $3,931,200
26.0 120.0 146.0
0 0 0
Mabton Green Projects Water and Energy Efficiency Alternatives
August 2011
2020 ENGINEERING, Inc. 32
E. Summary (Part 2: Energy Efficiency)
Alternative A-2 was selected as the favorite low energy wastewater treatment alternative because it provides reliable treatment in a moderate footprint with low capital costs and very low energy requirements. Alternative A can be easily upgraded for nutrient removal by adding additional low-energy, relatively low cost processes. Note that all the alternatives include a lagoon as the first biological treatment process. Lagoons are capable of absorbing peak flows and significant flow variation while discharging relatively stable outflows. This is an important consideration for Mabton, where peak daily flows are nearly three times the average annual flow.
Alternative A-2 - main components in approximate order (Figure 15-16): � Headworks screen � Facultative (non-aerated) lagoon – initial BOD and TSS removal � Surface flow wetland with aerated zones– additional BOD and TSS removal � Aerated gravel bed – treatment to meet discharge standards next permit cycle
(BOD<10 mg/L, TSS < 30 mg/L, Ammonia <2.9 mg/L) � UV System � Land Area- + 33.0 acres
The second favorite option is Alternative B-2 which also provides a cost-effective natural wastewater treatment system. This option may be considered as an alternative to A-2 since it requires less land area for its components.
Alternative B-2 - main components in approximate order (Figure 17): � Headworks screen � Partial Aerated Lagoon � Surface Flow (SF) Wetland + aeration Attached Growth (AG) Polishing Process � Recycle Pump Station � MBBR –denitrfication � UV System � Land Area- + 12.0 acres
Preliminary rough construction costs, land required and energy use for Alternative A-2 and Alternative B-2 are summarized in Table 19.
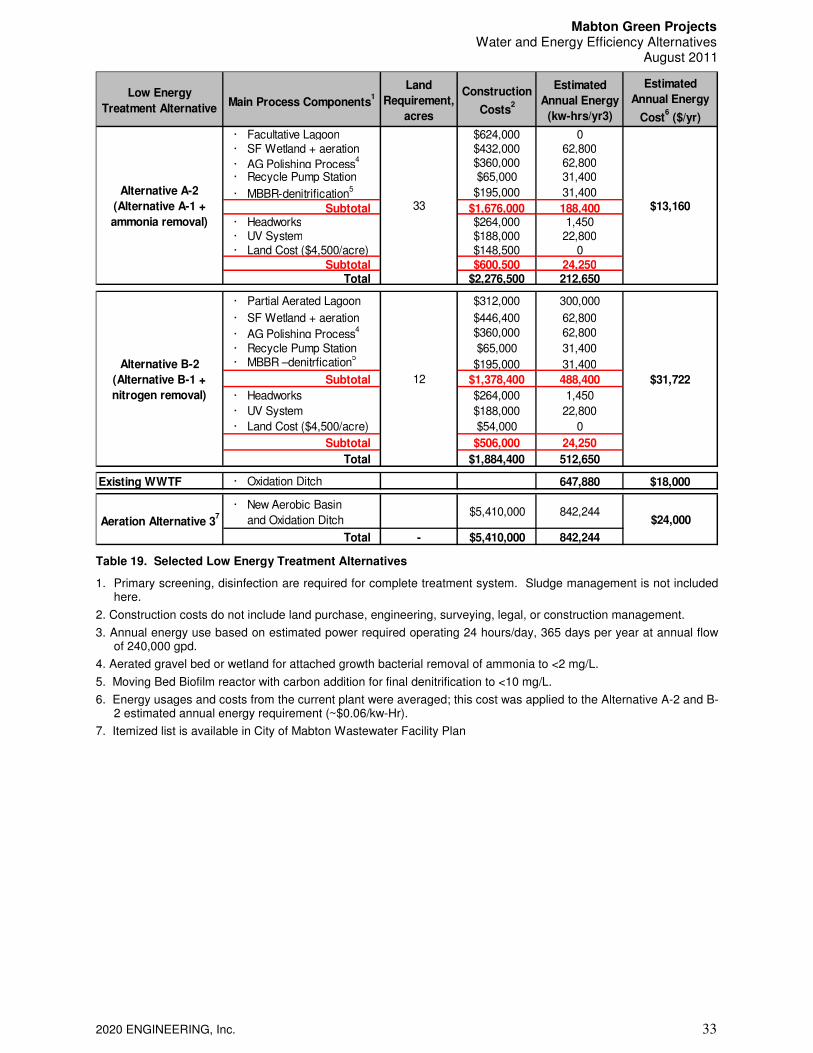
Mabton Green Projects Water and Energy Efficiency Alternatives
August 2011
2020 ENGINEERING, Inc. 33
Table 19. Selected Low Energy Treatment Alternatives
1. Primary screening, disinfection are required for complete treatment system. Sludge management is not included here.
2. Construction costs do not include land purchase, engineering, surveying, legal, or construction management.
3. Annual energy use based on estimated power required operating 24 hours/day, 365 days per year at annual flow of 240,000 gpd.
4. Aerated gravel bed or wetland for attached growth bacterial removal of ammonia to <2 mg/L.
5. Moving Bed Biofilm reactor with carbon addition for final denitrification to <10 mg/L.
6. Energy usages and costs from the current plant were averaged; this cost was applied to the Alternative A-2 and B-2 estimated annual energy requirement (~$0.06/kw-Hr).
7. Itemized list is available in City of Mabton Wastewater Facility Plan
Low Energy
Treatment AlternativeMain Process Components
1
Land
Requirement,
acres
Construction
Costs2
Estimated
Annual Energy
(kw-hrs/yr3)
Estimated
Annual Energy
Cost6 ($/yr)
· Facultative Lagoon $624,000 0· SF Wetland + aeration $432,000 62,800
· AG Polishing Process4 $360,000 62,800
· Recycle Pump Station $65,000 31,400
· MBBR-denitrification5 $195,000 31,400
Subtotal $1,676,000 188,400· Headworks $264,000 1,450· UV System $188,000 22,800· Land Cost ($4,500/acre) $148,500 0
Subtotal $600,500 24,250Total $2,276,500 212,650
· Partial Aerated Lagoon $312,000 300,000
· SF Wetland + aeration $446,400 62,800
· AG Polishing Process4 $360,000 62,800
· Recycle Pump Station $65,000 31,400· MBBR –denitrfication
5$195,000 31,400
Subtotal $1,378,400 488,400
· Headworks $264,000 1,450
· UV System $188,000 22,800
· Land Cost ($4,500/acre) $54,000 0
Subtotal $506,000 24,250
Total $1,884,400 512,650
Existing WWTF · Oxidation Ditch 647,880 $18,000
· New Aerobic Basin
and Oxidation Ditch$5,410,000 842,244
Total - $5,410,000 842,244
33
Alternative A-2
(Alternative A-1 +
ammonia removal)
$24,000Aeration Alternative 37
Alternative B-2
(Alternative B-1 +
nitrogen removal)
12 $31,722
$13,160
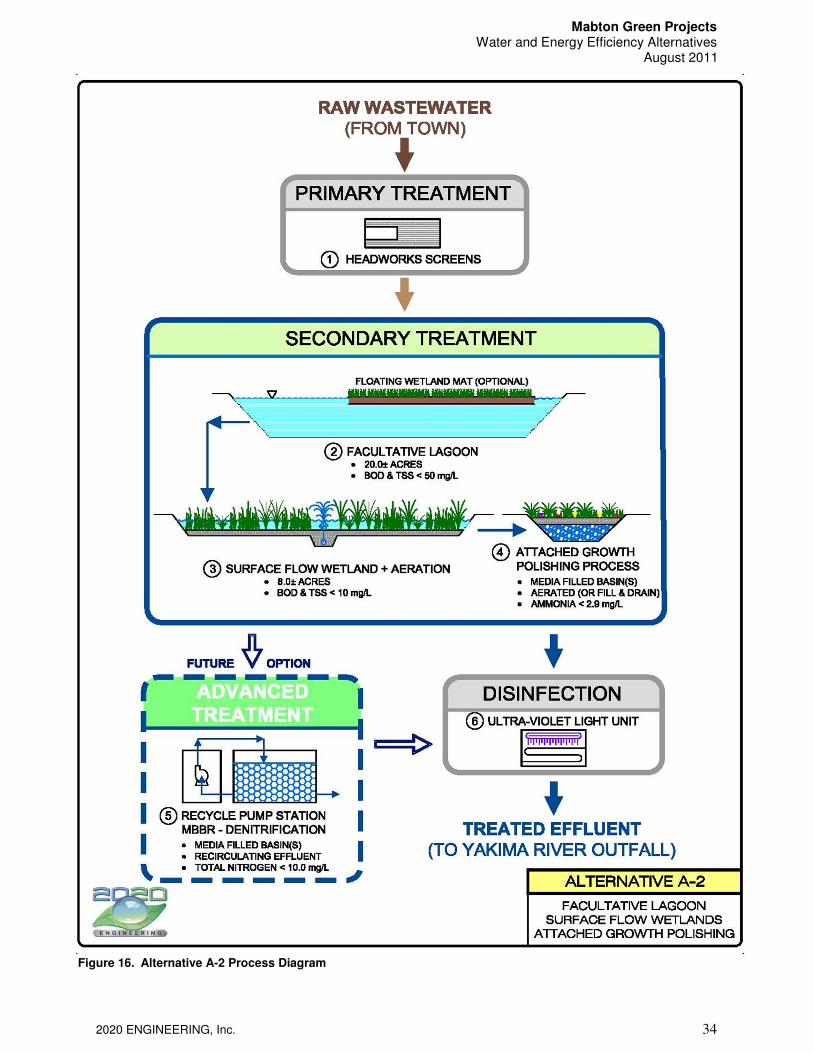
Mabton Green Projects Water and Energy Efficiency Alternatives
August 2011
2020 ENGINEERING, Inc. 34
Figure 16. Alternative A-2 Process Diagram
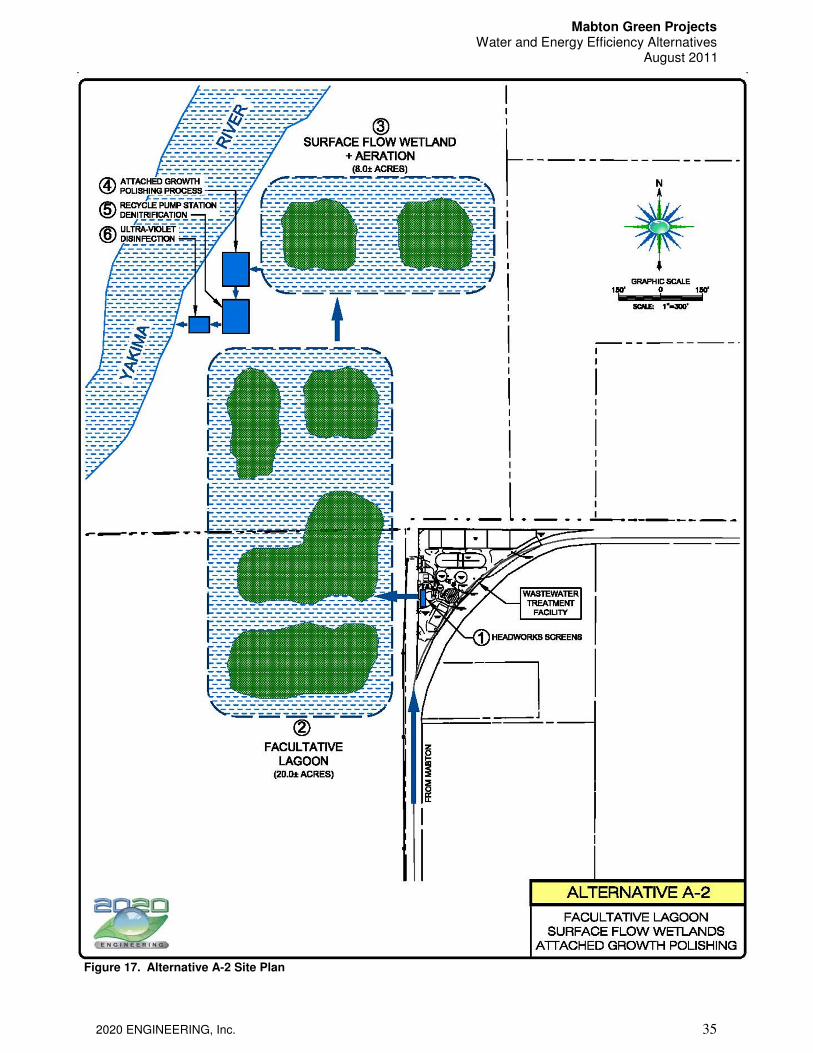
Mabton Green Projects Water and Energy Efficiency Alternatives
August 2011
2020 ENGINEERING, Inc. 35
Figure 17. Alternative A-2 Site Plan
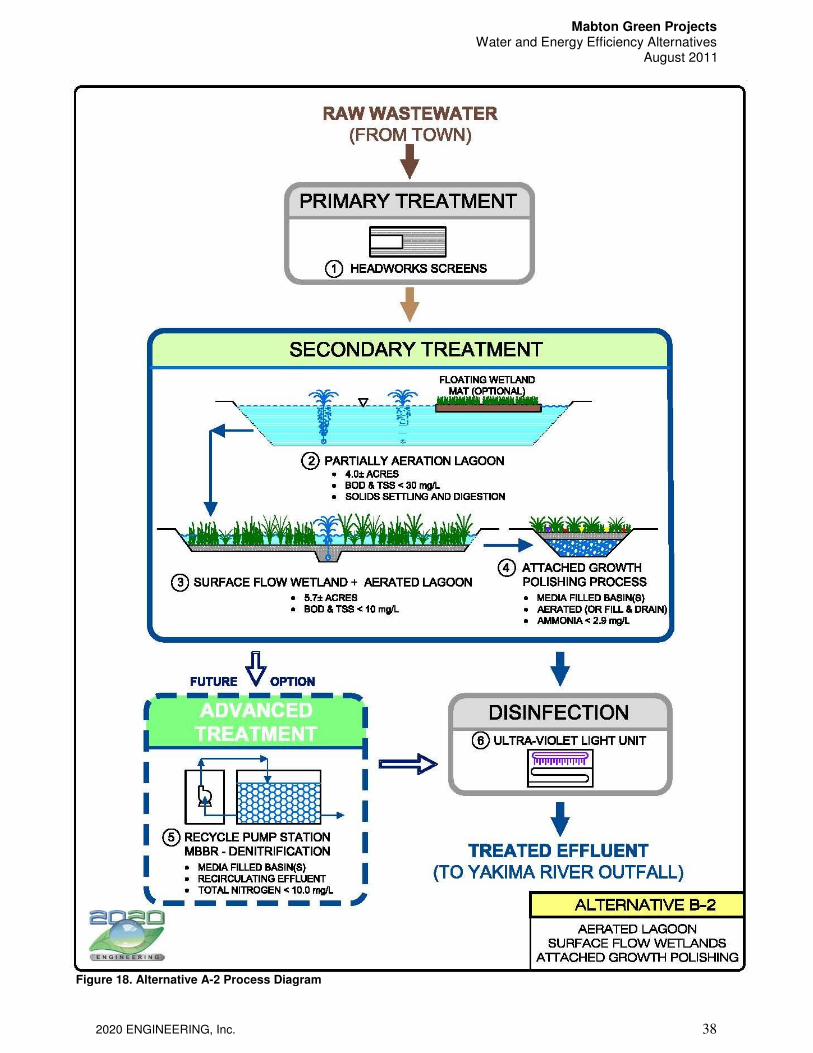
Mabton Green Projects Water and Energy Efficiency Alternatives
August 2011
2020 ENGINEERING, Inc. 38
Figure 18. Alternative A-2 Process Diagram

Mabton Green Projects Water and Energy Efficiency Alternatives
August 2011
2020 ENGINEERING, Inc. 37
F. References (Part 2)
Colt, J., 1984. Computation of Dissolved Gas Concentrations in Water as Functions of
Temperature, Salinity, and Pressure. American Fisheries Society Special Publication 14.
Davis, California.
Crites, R.W., Middlebrooks, E.J., Reed S.C., 2006. Natural Wastewater Treatment Systems.
Boca Raton, Florida. CRC Press.
Kadlec, R.H., 2004. Wetland to Pond Treatment Gradients. Proceedings of the 9th International
Conference on Wetland Systems; Avignon, France. 26 September – 1 October, 2004.
International Water Association.
Kadlec, R.H., Wallace, S.D., 2009. Treatment Wetlands, Second Edition. Boca Raton, Florida.
CRC Press.
Martin, E.J., Martin E.T., 1991. Technologies for Small Water and Wastewater Systems. New
York, New York. Van Nostrand Reinhold.
Rich, L.R., 1999. High Performance Aerated Lagoon Systems. American Academy of
Environmental Engineers.