Ma et al. Autophagy and melanoma 1 Measurements of tumor cell
35
Ma et al. Autophagy and melanoma 1 Measurements of tumor cell autophagy predict invasiveness, resistance to chemotherapy, and survival in melanoma Authors: Xiaohong Ma 1 , Shengfu Piao 1 , Dan Wang 1 , Quentin Mcafee 1 , Katherine L. Nathanson 2,5 Julian J. Lum 4 , Lin Z. Li 2,3,6* Ravi K. Amaravadi*† 1,2,6 Affiliations: 1-Division of Hematology-Oncology, Department of Medicine, University of Pennsylvania, Philadelphia, PA; 2-Abramson Cancer Center, University of Pennsylvania, Philadelphia, PA; 3-Department of Radiology, University of Pennsylvania, Philadelphia, PA; 4- Trev and Joyce Deeley Research Centre BC Cancer Agency, Victoria, BC; 5- Division of Medical Genetics, Department of Medicine, University of Pennsylvania 6-Institute of Translational Medicine and Therapeutics, University of Pennsylvania, Philadelphia, PA. *Lin Li and Ravi Amaravadi contributed equally to this work †Corresponding author: Ravi Amaravadi, MD Abramson Cancer Center 16 Penn Tower 3400 Spruce Street Philadelphia, PA 19104 Running header: Autophagy and melanoma Research. on April 13, 2019. © 2011 American Association for Cancer clincancerres.aacrjournals.org Downloaded from Author manuscripts have been peer reviewed and accepted for publication but have not yet been edited. Author Manuscript Published OnlineFirst on February 15, 2011; DOI: 10.1158/1078-0432.CCR-10-2372
Transcript of Ma et al. Autophagy and melanoma 1 Measurements of tumor cell

Ma et al. Autophagy and melanoma
1
Measurements of tumor cell autophagy predict invasiveness, resistance to chemotherapy, and survival in melanoma Authors: Xiaohong Ma1, Shengfu Piao1, Dan Wang1, Quentin Mcafee1, Katherine L. Nathanson2,5 Julian J. Lum4, Lin Z. Li2,3,6* Ravi K. Amaravadi*†1,2,6 Affiliations: 1-Division of Hematology-Oncology, Department of Medicine, University of Pennsylvania, Philadelphia, PA; 2-Abramson Cancer Center, University of Pennsylvania, Philadelphia, PA; 3-Department of Radiology, University of Pennsylvania, Philadelphia, PA; 4- Trev and Joyce Deeley Research Centre BC Cancer Agency, Victoria, BC; 5- Division of Medical Genetics, Department of Medicine, University of Pennsylvania 6-Institute of Translational Medicine and Therapeutics, University of Pennsylvania, Philadelphia, PA. *Lin Li and Ravi Amaravadi contributed equally to this work †Corresponding author: Ravi Amaravadi, MD Abramson Cancer Center 16 Penn Tower 3400 Spruce Street Philadelphia, PA 19104 Running header: Autophagy and melanoma
Research. on April 13, 2019. © 2011 American Association for Cancerclincancerres.aacrjournals.org Downloaded from
Author manuscripts have been peer reviewed and accepted for publication but have not yet been edited. Author Manuscript Published OnlineFirst on February 15, 2011; DOI: 10.1158/1078-0432.CCR-10-2372
Ma et al. Autophagy and melanoma
2
Statement of Translational Relevance
The role of autophagy in determining the aggressiveness and therapeutic resistance of
melanoma has not been fully appreciated. In this study we define an objective index to
enumerate autophagy levels in primary human melanoma tissues. A high autophagic index is
associated with poor prognosis and resistance to therapy in patients with advanced melanoma.
The high levels of autophagy observed in aggressive human tumors was reproduced only when
melanoma cell lines were grown as three dimensional spheroids or xenograft tumors, and not
when cells were grown in monolayer culture. The spheroid model demonstrated that autophagy
inhibition alone and in combination with chemotherapy selectively resulted in cell death in
aggressive melanoma cells. The results of this study identify autophagy as a new therapeutic
target in melanoma, and provide the preclinical rationale for investigating autophagy inhibitors in
melanoma.
Research. on April 13, 2019. © 2011 American Association for Cancerclincancerres.aacrjournals.org Downloaded from
Author manuscripts have been peer reviewed and accepted for publication but have not yet been edited. Author Manuscript Published OnlineFirst on February 15, 2011; DOI: 10.1158/1078-0432.CCR-10-2372

Ma et al. Autophagy and melanoma
3
Abstract
Purpose: Autophagy consists of lysosome-dependent degradation of cytoplasmic contents
sequestered by autophagic vesicles (AV). The role of autophagy in determining tumor
aggressiveness and response to therapy in melanoma was investigated in this study.
Experimental Design: Autophagy was measured in tumor biopsies obtained from metastatic
melanoma patients enrolled on a phase II trial of temozolomide and sorafenib and correlated to
clinical outcome. These results were compared to autophagy measurements in aggressive and
indolent melanoma cells grown in two and three dimensional culture and as xenograft tumors.
The effects of autophagy inhibition with either hydroxychloroquine or inducible shRNA against
the autophagy gene ATG5 were assessed in three dimensional spheroids. Results: Patients
whose tumors had a high autophagic index were less likely to respond to treatment and had a
shorter survival compared to those with a low autophagic index. Differences in autophagy were
less evident in aggressive and indolent melanoma cells grown in monolayer culture. In contrast,
autophagy was increased in aggressive compared to indolent melanoma xenograft tumors. This
difference was recapitulated when aggressive and indolent melanoma cells were grown as
spheroids. Autophagy inhibition with either hydroxychloroquine or inducible shRNA against
ATG5 resulted in cell death in aggressive melanoma spheroids, and significantly augmented
temozolomide-induced cell death. Conclusions: Autophagy is a potential prognostic factor and
therapeutic target in melanoma. Three dimensional culture mimics the tumor microenvironment
better than monolayer culture and is an appropriate model for studying therapeutic combinations
involving autophagy modulators autophagy inhibition should be tested clinically in patients with
melanoma.
Research. on April 13, 2019. © 2011 American Association for Cancerclincancerres.aacrjournals.org Downloaded from
Author manuscripts have been peer reviewed and accepted for publication but have not yet been edited. Author Manuscript Published OnlineFirst on February 15, 2011; DOI: 10.1158/1078-0432.CCR-10-2372

Ma et al. Autophagy and melanoma
4
Introduction
While combination regimens involving cytotoxic chemotherapies or targeted therapies have
improved survival in a number of malignancies, similar approaches have failed to improve
survival in patients with metastatic melanoma (1). One common mechanism of resistance to
chemotherapy and targeted therapies that has more recently been recognized is autophagy.
Autophagy is a catabolic process characterized by the formation of autophagic vesicles (AV)
that sequester damaged organelles and proteins and target them for degradation through fusion
with the lysosomes (2). Autophagy is increased in cells faced with metabolic stresses including
growth factor withdrawal (3), nutrient deprivation, and hypoxia (4, 5). Multiple cancer therapies,
including cytotoxic chemotherapy, kinase inhibitors, proteasome inhibitors, radiation, and
angiogenesis inhibitors can induce autophagy in most cancer cell lines (6). While under certain
experimental conditions, stress-induced autophagy can result in the death of cancer cells in
traditional two dimensional culture, stress-induced autophagy contributes significantly to the
survival of tumor cells growing within the tumor microenvironment. (7). Besides metabolic or
cell intrinsic stresses, therapy-induced autophagy can limit the antitumor efficacy of a number of
therapies. Our previous work demonstrated that co-treatment with the autophagy inhibitor
hydroxychloroquine (HCQ) could effectively block the last step of autophagy and enhance cell
death induced by activation of p53 or treatment with alkylating chemotherapy in a model of Myc-
induced tumorigenesis (8, 9). Based on this finding and reports from other investigators that
autophagy inhibition could augment the efficacy of a number of cancer therapies, numerous
phase I trials combining HCQ with cytotoxic chemotherapy or targeted therapies have been
launched (10). These trials are aimed at establishing the safety of the combination, but
eventually the activity of the combinations will be tested in phase II trials. At this point enrollment
Research. on April 13, 2019. © 2011 American Association for Cancerclincancerres.aacrjournals.org Downloaded from
Author manuscripts have been peer reviewed and accepted for publication but have not yet been edited. Author Manuscript Published OnlineFirst on February 15, 2011; DOI: 10.1158/1078-0432.CCR-10-2372
Ma et al. Autophagy and melanoma
5
to these trials would ideally be limited to the patients that are most likely to respond to
autophagy inhibition, but currently there are no biomarkers to identify those patients.
Measuring autophagy in tissue is difficult, and most of the advances in understanding
the role of autophagy in cancer has come from studying cell lines which overexpress
fluorescently tagged autophagy markers, or by using knockout mouse models. There is little to
no understanding of the variation of autophagy in clinical tumor samples and the significance of
this variation. As a first step to address this, we measured autophagy in pre-treatment tumors
obtained from metastatic melanoma patients enrolled on a phase II clinical trial of temozolomide
and sorafenib(11). Here we report a striking heterogeneity in pre-treatment tumor cell
autophagy in patients, and the finding that patients with high levels of autophagy in their tumors
had a significantly shorter survival than those with low levels of autophagy. When melanoma
cells were grown in two dimensional culture there were minimal differences in autophagy
between aggressive and indolent cell lines. However, these differences were accentuated when
aggressive and indolent melanoma cells were grown into xenograft tumors. Finally we report
that three dimensional spheroid culture is a model that more closely reproduces autophagy
observed within the in vivo tumor microenvironment than traditional two dimensional monolayer
culture. Our findings provide the first evidence that autophagy is associated with aggressive
melanoma and poor survival in clinical samples, and identifies a laboratory model system to
study the implications of this finding.
Research. on April 13, 2019. © 2011 American Association for Cancerclincancerres.aacrjournals.org Downloaded from
Author manuscripts have been peer reviewed and accepted for publication but have not yet been edited. Author Manuscript Published OnlineFirst on February 15, 2011; DOI: 10.1158/1078-0432.CCR-10-2372

Ma et al. Autophagy and melanoma
6
Materials and Methods
Patient samples, tumor genotype and clinical outcomes. Cutaneous tumor biopsies were obtained
from metastatic lesions from Stage IV melanoma patients with or without brain metastases enrolled on
a 4-arm phase II trial of the oral alkylating chemotherapy temozolomide and oral multikinase inhibitor
sorafenib(11). For details of study rationale, patient eligibility, schedule of treatment, assessments and
trial results see Amaravadi et al.(11). The study protocol was approved by the institutional review
boards at the University of Pennsylvania and Dana Farber/Harvard Cancer Center. All patients
provided informed consent for treatment and biopsies before enrollment. Biopsies were performed on
all patients that had cutaneous metastatic lesions that were safe to biopsy, using local anesthetics
followed by a punch biopsy of lesions. Isolated tumor tissue was immediately fixed in EM fixative.
Mutations in BRAF (exons 11, 15) and NRAS (exons 1, 2) were from archival tumor blocks or fresh
tumor biopsy as described (12). Samples were tested for mutations in exons 1-9 of PTEN as
published(13). Exons were amplified by PCR, treated with ExoSAP and processed for sequencing
using the Applied Biosystems BigDye® Terminator v1.1 Cycle Sequencing Kit. Uni-directional
sequencing was performed on an Applied Biosystems 3130xl automated sequencer. Sequence traces
were analyzed with Mutation Surveyor v3.2 (www.softgenetics.com). DNA from a genomic control as
well as the GenBank file for PTEN [NC_000010.10]) were used as a reference during mutation
detection. All exons were sequenced in both the forward and reverse directions. Multiplex ligation-
dependent probe amplification (MLPA) was used to screen for copy number changes in PTEN as
previously described (14). Progression-free survival was defined as the interval of time since receiving
first study drug to time of clinical or radiographic progression, or death due to any cause. Kaplan-Meier
estimates of progression-free survival and overall survival, 95% confidence intervals, and the Wilcoxin
log rank test, used to define hazard ratios were calculated using Graphpad Prism software.
Research. on April 13, 2019. © 2011 American Association for Cancerclincancerres.aacrjournals.org Downloaded from
Author manuscripts have been peer reviewed and accepted for publication but have not yet been edited. Author Manuscript Published OnlineFirst on February 15, 2011; DOI: 10.1158/1078-0432.CCR-10-2372
Ma et al. Autophagy and melanoma
7
Cell lines and plasmids. Melanoma cell lines A375P, WM3918, SK-MEL-28, and C8161 were
maintained in RPMI 1640 (Invitrogen) supplemented with 10% fetal bovine serum (Sigma), 50
μg/ml gentamicin and 25 mM HEPES in the presence of 5% CO2 at 37ºC. A375P GFP-LC3,
C8161GFP-LC3 were generated as previously described (8). To generate C8161 tet-shControl
cells, the psingle –tTS plasmid vector encoding an shRNA directed against luciferase was
transfected into C8161 cells and positive clones were selected with neomycin and limiting
dilution (Clontech). To generate C8161 tet-shATG5 cell lines, upper and lower strand
oligonucleotides directed against ATG5 were synthesized following manufacturer’s instructions.
Five plasmids encoding distinct hairpin sequences were generated initially. Cotransfection of
C8161 with a combination of 3 plasmid vectors (Sense strand: tet-shATG5 hp 3:
CCAGATATTCTGGAATGGAAA ; tet-shATG5hp4:CCTTTCATTCAGAAGCTGTTT; tet-shATG5 hp 5:
CCTGAACAGAATCATCCTTAA) yielded the highest efficiency of doxycycline inducible
knockdown.
In vitro melanoma invasion assay, GFP-LC3 imaging, and immunoblotting. The BD
BioCoatTM Matrigel TM invasion chamber (BD Biosciences) was used according to the
manufacturer’s protocol and as previously described(15, 16). Briefly, 100,000 cells were plated
in the top well. After 72 hours, cells from both upper and lower chamber were counted by trypan
blue exclusion. Invasion rate was calculated as #lower chamber cells/ (# lower chamber +
upper chamber cells). For GFP-LC3 imaging, A375P GFP-LC3 and C8161 GFP-LC3 cells were
exposed to the indicated treatments and fixed with 4% paraformaldehyde for 30 minutes at
room temperature, washed three times and centrifuged onto slides. Fluorescence imaging was
captured at 100X magnification on a Nikon Eclipse E800 fluorescent microscope. Cells were
scored as punctate if they had >4 GFP-LC3 dots. For immunoblotting, cells were lysed in RIPA
buffer (1% Sodium Deoxycholine, 0.1% SDS, 1% Triton X-100, 10 mM Tris at pH 8.0, 0.14 M
NaCl), protease inhibitors (Roche Diagnostics) and phosphatase inhibitor cocktail (Sigma).
Research. on April 13, 2019. © 2011 American Association for Cancerclincancerres.aacrjournals.org Downloaded from
Author manuscripts have been peer reviewed and accepted for publication but have not yet been edited. Author Manuscript Published OnlineFirst on February 15, 2011; DOI: 10.1158/1078-0432.CCR-10-2372

Ma et al. Autophagy and melanoma
8
Immunoblotting was performed as previously described (8) using the following antibodies
(1:1000 or 1:2500): LC3 (QCB biologicals), Atg5 (Sigma), P62 /SQSTM1 (Santa Cruz),
phosphor-AKt (Cell Signaling), phosphor-p70S6K (Cell signaling) actin (Sigma). Band densities
from Western Blots were quantified using Adobe Photoshop CS4 Extended and ImageJ (NIH).
All immunoblots presented and quantified are representative of experiments repeated on three
separate occasions.
Tumor xenograft experiments . Approval for animal care and use for these experiments was
provided by the Institutional Animal Care and Use Committee (IACUC) at the University of
Pennsylvania. All experiments were carried out using 5 week old Nu/Nu nude mice obtained
from Charles River Labs. Cultured cells of A375P and C8161 were respectively harvested in
ice-cold PBS and expanded in vivo by subcutaneous injection into the flanks of mice (1 x10⁶
cell/flank). Tumor size was measured twice a week using calipers, and tumor volume was
calculated using the following formula: Volume(mm3) = A(length)×B(width)×(A+B)/2]. For each
tumor, sections of visually viable tumor tissue were fixed in 10% formalin for preparation of
paraffin-embedded sections and H& E, and 2% gluteraldehyde for electron microscopy. Tumor
lysates were achieved through manual agitation of remaining tumor tissue in RIPA buffer.
Electron microscopy. Tissue obtained from human and mouse tumors and 3D spheroids were
fixed with 2% gluteraldehyde and stored at 4ºC until embedding. Cells were postfixed with 2%
osmium tetroxide, this was followed by an increasing gradient dehydration step using ethanol
and propylene oxide. Cells were then embedded in LX-112 medium (Ladd), and sections were
cut ultrathin (90 nm) , placed on uncoated copper grids, and stained with 0.2% lead citrate and
1% uranyl acetate(3). Images were examined with a JEOL-1010 electron microscope (JEOL) at
80 Kv. For quantification of viable cells using electron micrographs of tumor tissue, high-
Research. on April 13, 2019. © 2011 American Association for Cancerclincancerres.aacrjournals.org Downloaded from
Author manuscripts have been peer reviewed and accepted for publication but have not yet been edited. Author Manuscript Published OnlineFirst on February 15, 2011; DOI: 10.1158/1078-0432.CCR-10-2372

Ma et al. Autophagy and melanoma
9
powered micrographs (6000X-20,000X) of 20-25 single cells from multiple distinct low-powered
fields in each tumor were obtained. Autophagic vesicles (AV) were scored by investigators who
were blinded to aggressive or indolent descriptors. Morphological criteria for AV included 1)
circularity 2) contrast with structures that were white or lighter than the cytoplasm 3) Vesicles
with contents 4) Vesicles >200nm in size and 5) Vesicles > 200 nm interior to the plasma
membrane. Vesicular structures with cristae characteristic of mitochondria in cross section, or
with electron dense pigment were excluded and counted as mitochondria and melanosomes
respectively. Counts were represented as box and whisker plots or mean ± standard error of the
mean.
Three dimensional culture. Melanoma spheroids were implanted in collagen using the liquid
overlay technique previously described (17). Briefly, 5000 cells per well were plated on agar
(1.5% in PBS) and allowed to grow for 72-96 hours. Most cell lines plated at the correct density
formed spheroids in the middle of the well. Collagen matrix was formed by adding 1.3%
NaHCO3 to collagen mix (10% 10 XEMEM, 1.7 mM L-glutamine, 10% FBS, bovine collagen
(Organogenesis Inc, Canton, Massachusetts ). Spheroids were harvested and resuspended in
collagen matrix and plated in 24 well plates and supplemented with RPMI 1640 containing 10%
serum. Allspheroid experiments were conducted in triplicate. Spheroids implanted in collagen
were imaged by brightfield and fluorescence microscopy at 40X. Fraction of cells invading
collagen = (total area –core area) /total area. Lysates were prepared from spheroids by treating
spheroids implanted in collagen with collagenase and then lysing collected spheroids in RIPA
buffer. Cell death was assessed using the Live/Dead Assay (Molecular Probes) and fluorescent
microscopy. Spheroid dimensions and quantification of % dead cells was done using the lasso
and magic wand tools in Adobe photoshop Extended CS4. The % dead cells = integrated pixel
density of Dead/ (Live+Dead).
Research. on April 13, 2019. © 2011 American Association for Cancerclincancerres.aacrjournals.org Downloaded from
Author manuscripts have been peer reviewed and accepted for publication but have not yet been edited. Author Manuscript Published OnlineFirst on February 15, 2011; DOI: 10.1158/1078-0432.CCR-10-2372

Ma et al. Autophagy and melanoma
10
Results
A high autophagic index is associated with poor survival in metastatic melanoma. To
assess differences in autophagy in melanoma tumors, pre-treatment punch biopsies were
performed on cutaneous tumors from 12 patients enrolled on a phase II trial of temozolomide
and sorafenib (11). Samples were processed for electron microscopy. Striking differences in the
the autophagic index (the number of AV per cell) were apparent in cells with intact nuclear and
cytoplasmic membranes. Some tumors had a low autophagic index and displayed few AV/cell
(Figure 1A, Supplemental Figure 1C) while other tumors had a high autophagic index where
most cells were engorged with vesicles (Figure 1B, Supplemental Figures1D-E). Using strict
morphological criteria (see methods) the mean number of AV/cell was scored for each tumor.
The two cellular structures which most resemble AV are mitochondria (circular organelle
containing cristae; Supplemental figure 1A) and melanosomes (pigment containing vesicles;
Supplemental Figure 1B). These structures were excluded from scoring of AV.
To determine if specific oncogenic mutations could be responsible for the observed
differences in autophagy in patient tumors, genomic sequencing of tumor DNA was performed.
Recurrent somatic mutations in Ras signaling involving BRAF and NRAS (50% and 10%
incidence in cutaneous melanoma, respectively) are currently being used to subcategorize
melanoma patients and decide treatment options (18). Activation of MAPK signaling has
previously been described to promote autophagy in model systems (19). There was no
significant difference in the mean number of AV/cell in patients whose tumors harbored
mutations in BRAF or NRAS or who were wild type for both genes. To investigate the impact of
the most common mutation in melanoma that impacts PI3K/AKt/mTOR signaling on AV number,
the phosphatase and tensin homolog (PTEN) gene was interrogated for the presence of
mutation or homozygous deletion by exon sequencing and multiplex ligation dependent probe
amplification (MLPA). No mutations or homozygous deletions of PTEN were detected in the
Research. on April 13, 2019. © 2011 American Association for Cancerclincancerres.aacrjournals.org Downloaded from
Author manuscripts have been peer reviewed and accepted for publication but have not yet been edited. Author Manuscript Published OnlineFirst on February 15, 2011; DOI: 10.1158/1078-0432.CCR-10-2372
Ma et al. Autophagy and melanoma
11
patient samples with adequate DNA (data not shown). To determine if a high or low
autophagic index had any effect on clinical outcome, biopsied patients were separated into two
groups based on their duration of progression-free survival (PFS) on temozolomide and
sorafenib. Although the combination of temozolomide and sorafenib was found to have rates of
6-month progression-free survival (PFS) that met benchmarks to be considered an active
regimen (20), the response rates and overall survival were no different than previously
published response rates for temozolomide alone, and a randomized trial involving this regimen
was not pursued (11). Patients with a median PFS of <2 months (who derived no benefit from
this treatment), had tumors with a significantly higher number of AV/cell than tumors from
patients with median PFS � 2 months who derived clinical benefit from this treatment (median
8.4 AV/cell, and 3.9 AV/cell, respectively (p=0.01); Figure 1C). This analysis indicated that 6
AV/cell could be used as a meaningful cutoff to distinguish tumors with high (�6AV/cell) and low
(<6 AV/cell) autophagic indices in patient tumors. Kaplan-Meier survival analysis indicated that
the median survival of melanoma patients treated with temozolomide and sorafenib whose
tumors had a low autophagic index was 8 months compared to a median survival of 2 months in
patients whose tumors had a high autophagic index (p=0.038). There were no significant
differences between the two groups in other known baseline characteristics that are prognostic
for survival in melanoma (age, stage, elevated LDH, ECOG performance status, sex, prior
therapy, prior temozolomide, presence of brain metastases (supplemental Table 1). Recent
reports indicate that autophagy genes may play a role in melanosome production (21). There
was no significant difference in the percentage of tumors that were melanotic in each of these
two groups, indicating that autophagy levels vary independently of pigment production in
melanoma tumors.
Research. on April 13, 2019. © 2011 American Association for Cancerclincancerres.aacrjournals.org Downloaded from
Author manuscripts have been peer reviewed and accepted for publication but have not yet been edited. Author Manuscript Published OnlineFirst on February 15, 2011; DOI: 10.1158/1078-0432.CCR-10-2372
Ma et al. Autophagy and melanoma
12
Autophagy in aggressive and indolent melanoma cell lines grown as monolayers. To
determine if the clinical observation that a high autophagic index is associated with aggressive
tumor behavior, markers of autophagy were investigated in well characterized melanoma cell
lines with varying degrees of invasion and metastases: C8161 (22) and SKMEL28 (23) are cell
lines known to grow rapidly and invade when grown as subcutaneous xenograft tumors,
whereas A375P (22) and WM3918 (Herlyn, unpublished) are cell lines which are known to grow
slowly and have no invasive potential in vivo. In traditional monolayer culture, the growth rate of
C8161 was significantly higher than A375 cells. SKMEL28 and WM3918 were the slowest
growing cells (Supplemental Figure 2A). Measurement of invasive potential was performed
using the Boyden chamber invasion assay. C8161 and SKMEL28 were the most invasive, while
A375P and WM3918 cells were less invasive. C8161 cells were more than 7-fold more invasive
than the least invasive WM3918 cell line (Figure 2A). Together these studies confirmed the
grouping of aggressive (C8161 and SKMEL28) and indolent (A375P and WM3918) cell lines.
To determine if differences in tumor cell autophagy could be observed in aggressive
versus indolent melanoma cell lines in vitro, autophagy reporter cell lines C8161 GFP-LC3 cells
and A375P GFP-LC3 cells were generated. LC3 is a cytoplasmic ubiquitin-like protein which is
conjugated to lipids on the surface of AV(24). The GFP-LC3 fusion protein produces a diffuse
fluorescence in the absence of autophagy and a punctate fluorescence when AV accumulate.
While some differences in the percentage of autophagic cells could be observed in A375PGFP-
LC3 and C8161GFP-LC3 cells, there was a high percentage of punctate cells in both cell lines
(Figure 2B). Pharmacological induction of autophagy with the mTOR inhibitor rapamycin or
blockade of the lysosome with the autophagy inhibitor chloroquine (CQ) would in both cases
lead to AV accumulation that can be visualized by the GFP-LC3 reporter. Treatment with CQ, or
rapamycin resulted in an accumulation of AV in both aggressive (C8161 GFP-LC3) and indolent
Research. on April 13, 2019. © 2011 American Association for Cancerclincancerres.aacrjournals.org Downloaded from
Author manuscripts have been peer reviewed and accepted for publication but have not yet been edited. Author Manuscript Published OnlineFirst on February 15, 2011; DOI: 10.1158/1078-0432.CCR-10-2372

Ma et al. Autophagy and melanoma
13
(A375P GFP-LC3) cell lines. Treatment of indolent or aggressive cell lines with low micromolar
concentrations of HCQ did not induce cell death (Supplemental Figure 2B).
Immunoblotting against the autophagy markers LC3, Atg5 and p62 was performed on
the panel of 4 cell lines cultured in complete medium and melanoma cells exposed to growth
factor and nutrient withdrawal (Figure 2C). LC3 can be detected by immunoblotting as an
unconjugated (LC3I) species, and conjugated to the surface of autophagic vesicles (LC3II)(24).
Atg5 is part of the ATG5-ATG12-Atg16 complex that takes part in assembling the autophagic
vesicle (2). P62 is a cytoplasmic docking protein that binds ubiquitinated proteins and traffics
them to AV for degradation. P62 binds to LC3, and is itself degraded in AV, therefore p62 levels
can reflect autophagic flux. High p62 levels have been associated with genotoxic stress and
implicated directly in tumorigenesis (25). While indolent melanoma cell lines had higher
LC3II/LCI ratio and lower p62 levels compared to aggressive cells, suggesting that indolent cell
lines were more autophagic than aggressive cells, these differences were not significant. There
was no difference in ATG5 levels between aggressive and indolent cell lines grown in
complete medium. To accentuate differences in autophagy between aggressive and indolent
melanoma cells, cells were grown under conditions of metabolic stress (serum and nutrient
withdrawal). Under these growth conditions, the LC3II/LC3I ratio increased in both indolent and
aggressive cell lines with no significant difference between the two groups (Figure 2D).
Similarly no significant differences were observed in levels of ATG5, or p62 as measured by fold
change from baseline. These results indicate that no significant differences in autophagy
markers were observed in aggressive and indolent melanoma cells grown in complete medium
or in conditions that are known to induce autophagy. Since growth factor signaling can directly
regulate autophagy through mTOR signaling, immunoblotting against phospho-Akt and
phospho-p70s6K was perfomed. No significant differences in the phosphorylation status of Akt
or p70s6K was apparent between indolent and aggressive cell lines in either complete or
Research. on April 13, 2019. © 2011 American Association for Cancerclincancerres.aacrjournals.org Downloaded from
Author manuscripts have been peer reviewed and accepted for publication but have not yet been edited. Author Manuscript Published OnlineFirst on February 15, 2011; DOI: 10.1158/1078-0432.CCR-10-2372

Ma et al. Autophagy and melanoma
14
serum/nutrient free medium (data not shown). Taken together these results indicate that
differences in autophagy are minimal in aggressive and indolent melanoma cell lines when they
are grown in two dimensional cell culture.
Differences in autophagy in indolent and aggressive melanoma tumor xenografts. To
investigate the differences in autophagy in indolent and aggressive melanomas in tumor
xenografts, A375P and C8161 cells were implanted in the flanks of nude mice. After 33 days of
growth C8161 tumors were significantly larger than A375P tumors (181±86 mm3, and 50±7
mm3, respectively; figure 3A). Freshly harvested tumor tissue was analyzed by electron
microscopy, and tumor cell lysates were prepared for immunoblotting. EM images were used to
score AV/cell. The mean AV/cell was significantly increased in C8161 xenografts compared to
A375P xenografts (median values 2.8 and 0.8, respectively; Figure 3B). Examination of low and
high magnification EM images of A375P (Figure 3C) and C8161 (Figure 3D) demonstrated
differences in autophagy in indolent and aggressive melanoma are accentuated in vivo within
the tumor microenvironment. To confirm the differences in autophagy obtained by EM
morphological criteria, tumor cell lysates from C8161 and A375P were subjected to
immunoblotting against the autophagy markers LC2, p62, and ATG5 (Figure 3E). In three
separate tumors for each cell line, a consistent pattern of increased expression of ATG5,
decreased levels of p62 and increased levels of LC3II were observed in aggressive C8161
tumor cell lysates compared to indolent A375P tumor cell lysates. Significant differences for
LC3II/LC3I and ATG5 were observed between aggressive and indolent xenografts. These
findings indicate that autophagy is significantly increased in aggressive compared to indolent
melanoma tumor xenografts.
Research. on April 13, 2019. © 2011 American Association for Cancerclincancerres.aacrjournals.org Downloaded from
Author manuscripts have been peer reviewed and accepted for publication but have not yet been edited. Author Manuscript Published OnlineFirst on February 15, 2011; DOI: 10.1158/1078-0432.CCR-10-2372
Ma et al. Autophagy and melanoma
15
Autophagy in three dimensional spheroid culture. Herlyn and colleagues have pioneered
three dimensional spheroid culture to study drug resistance in melanoma (17). Having
established that differences in autophagy between aggressive and indolent melanomas are
striking in patients, and in xenografts but less apparent in traditional two dimensional monolayer
culture, three dimensional spheroids were generated for aggressive (C8161 and SKMEL28) and
indolent (A375P and WMU3918) cell lines. Briefly cells were grown into spheroids in complete
medium on an agar surface and implanted into a collagen matrix. While the growth of the central
spheroid was not significantly different between indolent and aggressive spheroids at 24 or 48
hours (Supplemental Figure 3A), the total spheroid area was much larger in aggressive
spheroids compared to indolent spheroids (Supplemental Figure 3B). The fraction of cells
invading collagen was significantly increased in aggressive compared to indolent (mean ± SEM:
0.66 ± 0.13, and 0.12 ± 0.07, p=0.004) melanoma spheroids 48 hours after implantation into
collagen. After implantation in collagen for 48 hours, the fraction of cells invading collagen was
16-fold higher in C8161 than in the least invasive A375P cell line (Figure 4A). Western blot
analysis of lysates obtained from spheroids grown for 48 hours in collagen demonstrated
increased LC3II/LC3I ratio, decreased p62 and significantly increased ATG5 in aggressive
compared to indolent cells grown in three dimensional spheroids (Figure 4B). This combination
of markers is indicative of higher levels of autophagy observed in aggressive melanoma cells
grown in 3D culture than indolent melanoma cells. These results more closely resemble levels
of autophagy markers found in xenografts than levels of these markers in the same cell lines
grown in two dimensional culture. To characterize the autophagic index further within intact
spheroids, A375PGFP-LC3 and C8161GFP-LC3 cells were grown as spheroids. GFP-LC3
fluorescence was diffuse in A375P spheroids and punctate in C8161GFP-LC3 spheroids (Figure
4C). Electron microscopy of aggressive and indolent spheroids also demonstrated a significant
increase in the number of AV/cell in C8161 spheroids compared to A375P spheroids (Figure
Research. on April 13, 2019. © 2011 American Association for Cancerclincancerres.aacrjournals.org Downloaded from
Author manuscripts have been peer reviewed and accepted for publication but have not yet been edited. Author Manuscript Published OnlineFirst on February 15, 2011; DOI: 10.1158/1078-0432.CCR-10-2372
Ma et al. Autophagy and melanoma
16
4D). To assess the functional importance of increased levels of autophagy observed in
aggressive compared to indolent melanoma spheroids, spheroids were treated with PBS or a
low dose of the autophagy inhibitor hydroxychloroquine. Cell death was observed in spheroids
generated from both aggressive cell lines and not in spheroids generated in indolent cell lines
(Figure 4E).
Autophagy inhibition enhances cell death in aggressive melanoma spheroids. To study
the specific effects of autophagy inhibition on the survival of aggressive melanoma cells grown
in three dimensional culture, stable cell subclones of aggressive C8161 melanoma cell line were
generated that expressed a dox-inducible control short hairpin RNA (C8161 tet-shcontrol) or a
dox-inducible shRNA directed against the essential autophagy gene ATG5 (C8161 tet-shATG5).
In C8161 tet-shcontrol cells, no significant change in levels of ATG5, LC3I, or LC3II levels was
observed (Figure 5A). In C8161tet-shATG cells, doxycycline treatment (dox) resulted in a
significant decline in ATG5 levels, resulting in a reduced accumulation of AV as measured by a
dox-associated decline in LC3II/LC3I ratios confirmed effective autophagy inhibition in these
cells. Inducible knockdown of ATG5 resulted in minor growth inhibition of C8161 tet-shATG5
cells grown in two dimensional culture (Supplemental Figure 3C). To determine the effects of
knockdown of ATG5 on cell survival in 3D culture, spheroids generated from C8161 tet-
shcontrol and C8161tet-shATG5 cells were implanted in collagen. After 72 hours of dox,
spheroids were assessed by Live/Dead assay. Dox-induced expression of control shRNA
resulted in no cell death in C8161 tet-shControl cells. In C8161 tet-shATG5 spheroids dox-
dependent expression of shATG5 was associated with a greater than 2-fold increase in cell
death in the center of doxycyline-treated compared to untreated spheroids (Figure 5B). To
determine if the cell death associated with temozolomide, the cytotoxic chemotherapy
commonly used as a single agent to treat melanoma, could be augmented with combined
Research. on April 13, 2019. © 2011 American Association for Cancerclincancerres.aacrjournals.org Downloaded from
Author manuscripts have been peer reviewed and accepted for publication but have not yet been edited. Author Manuscript Published OnlineFirst on February 15, 2011; DOI: 10.1158/1078-0432.CCR-10-2372
Ma et al. Autophagy and melanoma
17
autophagy inhibition, C8161 tet-shATG5 spheroids were treated with DMSO or temozolomide in
the presence or absence of knockdown of ATG5. Cell death was observed in the periphery of
cells treated with DMSO or temozolomide, but when temozolomide was combined with
knockdown of ATG5, increased cell death was also observed in the center of spheroids.
Quantification of cell death found that knockdown of ATG5 significantly enhanced
temozolomide-induced cell death in C8161tet- shATG5 cells (Figure 5C). To determine if this
result could be reproduced with pharmacological inhibition of autophagy spheroids were treated
with HCQ alone and in combination with temozolomide. In two dimensional cell culture high
micromolar concentrations (100 μM) of HCQ results in minimal toxicity to C8161 and additive
cytotoxicity is achieved only when combining high concentrations of temozolomide (500 μM)
and hydroxychloroquine (100 μM) (Supplemental Figure 3D). In contrast nanomolar
concentrations of HCQ can elicit cell death in C8161 3D spheroids (Supplemental Figure 3E).
Nanomolar concentrations of HCQ augmented the cytotoxicity of temozolomide in three
dimensional culture (Figure 5D) indicating that this combination is worthy of testing in patients.
Discussion
Autophagy is a degradative process that was originally designated as type II
programmed cell death (26). Self-eating, if persistent can lead to depletion of cellular
components resulting in autophagic, apoptotic or necrotic cell death (6). Autophagy can limit
tumorigenesis through the clearance of damaged organelles and the mitigation of genotoxic
stress (27). BECN1 (Beclin1), an essential autophagy gene has been described as a
haploinsufficient tumor suppressor gene whose monoallelic deletion results in accelerated
tumorigenesis in mouse models (28). All of these facts point to autophagy as a tumor
suppressor mechanism, which implies that indolent tumors would be expected to have higher
Research. on April 13, 2019. © 2011 American Association for Cancerclincancerres.aacrjournals.org Downloaded from
Author manuscripts have been peer reviewed and accepted for publication but have not yet been edited. Author Manuscript Published OnlineFirst on February 15, 2011; DOI: 10.1158/1078-0432.CCR-10-2372
Ma et al. Autophagy and melanoma
18
levels of autophagy than rapidly proliferating aggressive tumors. Despite this role in limiting
tumor development, once tumors are established, increasing evidence indicates autophagy
allows tumor cells to survive within the tumor microenvironment (5, 6, 29-31). Much of this
evidence comes from transgenic mouse models and xenografts engineered from genetically
defined cell lines. Measuring autophagy is often difficult, even in these model systems, and this
has limited studies of autophagy in human tumors.
This is the first study to measure autophagy by electron microscopy in human tumors
and correlate this measurement to clinical outcomes of progression-free and overall survival in
cancer patients. Cutaneous metastases from patients with melanoma enrolled on a phase II
clinical trial provided an ideal set of tumor samples for this purpose, because tumors were not
large necrotic masses, the tissue was freshly harvested, and was not required for clinical
purposes. Moreover, since autophagy is a dynamic process, measurement of autophagy in
freshly obtained tissue at the time of entry into the clinical trial was more likely to be
representative of the biology of the metastatic disease at the time of treatment than
measurement of autophagy in archival tumor tissue.
The degree of heterogeneity that was found in tumor cell autophagy in melanoma
patients was striking. Mounting evidence indicates genetic alterations in oncogenes and tumor
suppressor genes can dictate autophagy levels in cancer cell lines (32, 33). The role of
activated kinases within the MAPK pathway has previously been described to promote
autophagy(19, 34). In this study, heterogeneity in autophagy levels was not explained by
genotype of the BRAF and NRAS genes, key drivers of MAPK signaling, but a small but
significant difference in autophagy levels between these common melanoma genotypes could
be found if larger numbers of patients were included. The autophagic index (mean number of
AV per cell) was significantly higher in patients that derived little or no clinical benefit from the
combination of temozolomide and sorafenib. Patients that had stable disease or responded to
Research. on April 13, 2019. © 2011 American Association for Cancerclincancerres.aacrjournals.org Downloaded from
Author manuscripts have been peer reviewed and accepted for publication but have not yet been edited. Author Manuscript Published OnlineFirst on February 15, 2011; DOI: 10.1158/1078-0432.CCR-10-2372

Ma et al. Autophagy and melanoma
19
therapy had low levels of autophagy in their tumors. A high autophagic index as determined by
counting AV/cell could be indicative of increased autophagy induction, or of a blockade of
clearance of autophagic vesicles. Our finding that autophagy inhibition selectively targets
aggressive melanoma cells that have increased autophagic vesicles in 3D culture suggests that
the high autophagic index observed in the tumors of patients with aggressive melanomas is an
indication of increased autophagy induction in response to stress. These findings validate the
emerging preclinical evidence in multiple models of malignancy that autophagy plays a critical
role in resistance to chemotherapy and targeted therapy(10). The results of this study indicate
that pre-treatment levels of autophagy can predict resistance to therapy, but additional studies
are necessary before autophagic vesicles counts by EM can be considered a predictive marker.
Kaplan-Meier survival analysis indicated a 4-fold increase in the length of median
overall survival in patients with low levels of autophagy compared to patients with high levels of
autophagy. This finding indicates that autophagy could be a prognostic marker in addition to a
predictive marker in melanoma patients. A similar conclusion was made in a recent report that
found elevated levels of beclin 1 predicted poor survival in patients with nasopharyngeal
carcinoma (35). Further development of assays to measure autophagy in human tissue that
correlate well with the gold standard of EM are necessary to measure autophagy in larger
numbers of patients using paraffin-embedded tissue. One limitation of this study is that
autophagy was measured by EM in a small portion of one cutaneous tumor from each patient.
Intratumoral variation in autophagy levels due to the geography of the local tumor
microenvironment and inter-tumor variation in autophagy levels within the same patient were not
addressed in this study. Emerging immunohistochemical autophagy markers will shed light on
the variability of autophagy levels within one or many lesions in the same patient, and this
degree of variability will be critical to determine before autophagy markers become candidates
for prognostic or predictive biomarkers for melanoma.
Research. on April 13, 2019. © 2011 American Association for Cancerclincancerres.aacrjournals.org Downloaded from
Author manuscripts have been peer reviewed and accepted for publication but have not yet been edited. Author Manuscript Published OnlineFirst on February 15, 2011; DOI: 10.1158/1078-0432.CCR-10-2372
Ma et al. Autophagy and melanoma
20
To determine if the high autophagic index found in aggressive melanomas and low
autophagic index found in indolent melanomas could be modeled in the laboratory, multiple
markers of autophagy were measured in four melanoma cell lines with known degrees of
invasiveness grown in traditional two dimensional culture. No clear differences between
indolent and aggressive cell lines were observed in the well established autophagy markers LC3
ATG5, or p62. Both aggressive and indolent cell lines increased autophagy equally in response
to metabolic or therapeutic stress. In contrast, when grown as xenografts, aggressive melanoma
cells had an increased autophagic index (along with increased LC3II/LC3I ratio and ATG5 levels
and decreased p62 levels) compared to indolent xenografts recapitulating the finding made in
human tumors.. These results underscore the emerging appreciation for how the tumor
microenvironment influences tumor cell autophagy, resulting in markedly different phenotypes
when cells are grown in monolayer tissue culture or when they are grown in more complex
microenvironments. . Lu et al. reported experiments which found scheduled induction of
autophagy produced cell death in in two dimensional culture, but contributed to autophagic cell
survival when the same cell line is grown as a xenograft (7). In this ovarian cancer model the
presence of cytokines (eg IGF-1), angiogenic factors (eg VEGF) and components of the
extracellular matrix (eg collagen) all contribute to switch the cell fate from death to survival in
autophagic cells.
Our previous work on the microenvironment in melanoma tumors suggest that the
increased autophagy observed in aggressive compared to indolent melanomas, may be driven
by nutrient limitation or hypoxia which in turn leads to the production of reactive oxygen species
(ROS). Cryogenic NADH/flavoprotein fluorescence imaging (mitochondrial redox scanning)
indicated that C8161 tumors contained were highly oxidized, characteristic of tissue starved of
mitochondrial substrates while A375P melanoma xenografts were uniformly in a reduced state
(36). Imaging studies demonstrated that the blood transfer rate (a surrogate of oxygen
Research. on April 13, 2019. © 2011 American Association for Cancerclincancerres.aacrjournals.org Downloaded from
Author manuscripts have been peer reviewed and accepted for publication but have not yet been edited. Author Manuscript Published OnlineFirst on February 15, 2011; DOI: 10.1158/1078-0432.CCR-10-2372

Ma et al. Autophagy and melanoma
21
delivery) and capillary patency was significantly higher in A375P melanomas than in C8161
melanomas.(37). (38). Thus, melanoma cells in the aggressive tumors appeared to be
undergoing starvation of nutrients. Despite this metabolic challenge, highly metastatic
melanoma tumor cores contained few apoptotic cells whereas A375P melanoma tumors
contained a significantly higher number of apoptotic cells (38). The findings of the current study
along with previous work characterizing the tumor microenvironment indicates that metabolic
stress-induced autophagy in aggressive melanoma cells growing within the tumor
microenvironment contributes to tumor cell survival and resistance to therapy, and therefore
should be a target for novel therapies.
To develop a high throughput model to study autophagy and autophagy inhibition in
melanoma further, the three dimensional spheroid model described by Herlyn et al. was
employed. As observed in the xenograft tumors, aggressive melanoma spheroids had higher
LC3II/LC3I, and ATG5 levels and lower p62 levels than indolent melanoma spheroids. High
levels of the essential autophagy protein ATG5 were detected in aggressive melanoma cells
grown in spheroids and in tumor xenografts but not in the same cells grown in monolayer
culture. Further studies are underway to understand the mechanism behind this differential
expression and increased reliance on autophagy for survival in aggressive compared to indolent
melanomas. Treatment with clinically achievable concentrations of the autophagy inhibitor HCQ,
or knockdown of the essential autophagy gene ATG5 resulted in cell death in the center of
aggressive but not indolent melanoma spheroids, indicating tumor cell autophagy in aggressive
melanoma spheroids was promoting cell survival. Autophagy inhibition also augmented
temozolomide-induced cell death in 3D spheroids demonstrating how this model can be used to
screen for drugs whose activity might be augmented by autophagy inhibition and provide the
rationale for further preclinical or clinical trials. Based on these and other compelling preclinical
studies (39, 40) a phase I trial of temozolomide and HCQ has been launched in patients with
Research. on April 13, 2019. © 2011 American Association for Cancerclincancerres.aacrjournals.org Downloaded from
Author manuscripts have been peer reviewed and accepted for publication but have not yet been edited. Author Manuscript Published OnlineFirst on February 15, 2011; DOI: 10.1158/1078-0432.CCR-10-2372

Ma et al. Autophagy and melanoma
22
advanced solid tumors and melanoma (NCT00714181). As the number of potential autophagy
inhibitors and the number of drugs that may be limited by autophagy increase, so does the need
to identify patients that are more or less susceptible to this strategy. This study indicates
patients with aggressive melanoma are more likely to have higher levels of autophagy in their
tumor and therefore by more susceptible to autophagy inhibition as a therapeutic strategy.
Additional studies will be necessary to determine if electron microscopy or other emerging
biomarkers of autophagy such as ATG5 might be employed as prognostic and/or predictive
biomarkers to serve this purpose.
Research. on April 13, 2019. © 2011 American Association for Cancerclincancerres.aacrjournals.org Downloaded from
Author manuscripts have been peer reviewed and accepted for publication but have not yet been edited. Author Manuscript Published OnlineFirst on February 15, 2011; DOI: 10.1158/1078-0432.CCR-10-2372
Ma et al. Autophagy and melanoma
23
Figure Legends Figure 1. Tumor cell autophagy and clinical outcome in patients with metastatic
melanoma. Tumor biopsies of cutaneous metastases from Stage IV melanoma patients (n=12)
treated on a phase II trial of temozolomide and sorafenib were processed for electron
microscopy (EM).(A-B) Representative images of a tumor with low (A) or high (B) number of
autophagic vesicles per cell (AV/cell; arrows), scale bar 2 μm . (C) Mean ± standard error of
mean (SEM) of the average number of AV/cell by EM in tumors that had the following
genotypes: BRAFm: BRAF V600E/NRAS wild type (WT); WT/WT: BRAF WT/NRAS WT or
BRAF WT/NRAS failed NRASm: BRAF WT/NRAS Q61K (D) Box and whisker plots of mean
AV/cell with �2 months or >2 months progression-free survival (PFS); P=0.001, Mann-Whitney
test (D) Kaplan-Meier survival analysis for patients with tumors containing <6 AV/cell (solid) and
�6 AV/cell (dashed); HR 0.22 [95%CI 0.06-0.86] p=0.03 log rank test.
Figure 2. Invasiveness and tumor cell autophagy in aggressive and indolent melanoma
cell lines. (A) Invasion rate by the Boyden Chamber assay (B) Autophagy modulation with the
autophagy inhibitor chloroquine (CQ) or the autophagy inducer rapamycin (Rap) in cell lines
expressing the autophagy marker GFP-LC3. Diffuse fluorescence: no autophagy; punctate
fluorescence: accumulation of autophagic vesicles. (C) Immunoblotting against autophagy
markers in aggressive (SKMEL28, C8161) and indolent (WM3918, A375P) cell lines grown in
complete medium:Replete; and in serum free (24 hours) and nutrient free medium (2
hours):SF/N deprived. (D) Gel densitometry of autophagy markers in replete and SF/N deprived
media. Fold change of markers in SF/N deprived conditions were compared to Replete
measurements.
Figure 3. Tumor cell autophagy in indolent and aggressive melanoma xenografts. Tumor
xenografts were generated in the flanks of nude mice using indolent A375P (n=5) and
Research. on April 13, 2019. © 2011 American Association for Cancerclincancerres.aacrjournals.org Downloaded from
Author manuscripts have been peer reviewed and accepted for publication but have not yet been edited. Author Manuscript Published OnlineFirst on February 15, 2011; DOI: 10.1158/1078-0432.CCR-10-2372

Ma et al. Autophagy and melanoma
24
aggressive C8161 (n=7) melanoma cell lines. (A) Tumor size after 33 days, p=0.001, t-test (B-
D)Tumors were processed for EM; (B) Mean number AV/cell; p=0.001, Mann-Whitney test.
Representative images of tumor cells from (C) two different A375P tumors and (D) two different
C8161 tumors; scale bars: 2μm. (E) Lysates from three separate A375P and C8161 tumors
were used for immunoblotting against the autophagy markers LC3, p62 and ATG5, and actin
loading control.
Figure 4. Growth, invasion, and tumor cell autophagy of aggressive and indolent
melanoma spheroids grown in a three dimensional collagen matrix. (A) Brightfield
microscopy of spheroids; black arrow: central spheroid boundary; red arrow: boundary of
invasion (B) immunoblots of lysates derived from spheroids 48 hours after implantation in
collagen; mean +/- SD gel densities for indolent (WM3918, A375) and aggressive (SKMEL28,
C8161). (C) Brightfield and fluorescent microscopy of A375P GFP-LC3 and C8161GFP-LC3
spheroids (48 hours) (D) Electron micrographs of A375P and C8161 spheroids (48hours);
arrows: autophagic vesicles. (D) Live (green)/Dead (orange) assay of melanoma spheroids in
3D culture 48 hours after the indicated treatments, HCQ: hydroxychloroquine; Scale bar: 200
μm (A,C,E); 2 μm (D).
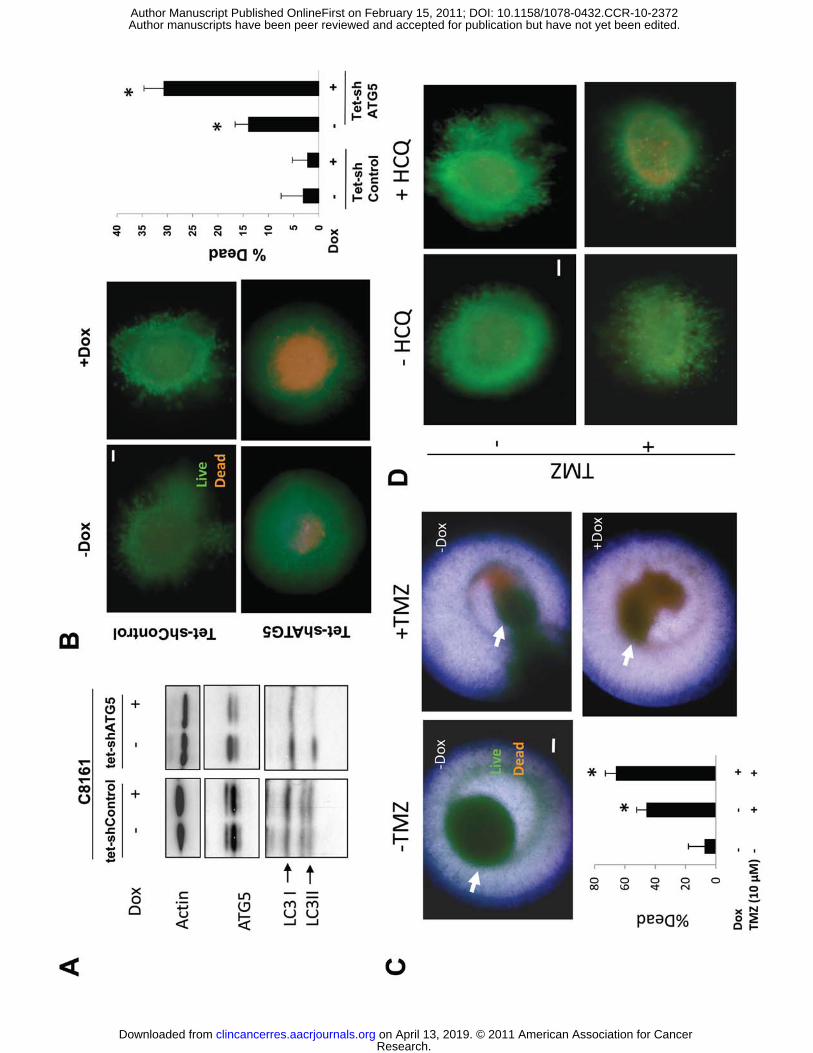
Figure 5. Autophagy inhibition in three dimensional melanoma spheroids. (A)
Immunoblotting of lysates from C8161 tet-shControl and C8161 tet-shATG5 cells treated with or
without doxycyline (Dox) for 72 hours. (B) C8161tet- shcontrol and C8161 tet-shATG5 spheroids
(arrows) were treated with or without dox for 72 hours and analyzed by Live (green)/dead
(orange) assay (C) C8161 tet-shATG5 spheroids were treated with DMSO (-TMZ) or
Temozolomide (+TMZ) 10 μM with and without doxycycline treatment. Representative images
are overlays of separately captured images of fluorescence microscopy for live, dead, and
brightfield images of spheroid structure to better define the localization within spheroids of dead
cells. (D) Fluorescence images of C8161 tet-shControl spheroids grown in three dimensional
Research. on April 13, 2019. © 2011 American Association for Cancerclincancerres.aacrjournals.org Downloaded from
Author manuscripts have been peer reviewed and accepted for publication but have not yet been edited. Author Manuscript Published OnlineFirst on February 15, 2011; DOI: 10.1158/1078-0432.CCR-10-2372
Ma et al. Autophagy and melanoma
25
culture imaged with the Live/dead assay and treated with DMSO (-TMZ) or Temozolomide
10μM in the absence or presence of hydroxychloroquine (HCQ) 10 nM for 72 hours. (B-D) scale
bar 200 μm; *p<0.05.
Supplemental Figure 1: Electron microscopy of melanoma tumors (A-B) Examples of
structures that were and were not scored as double membrane autophagic vesicles (AV). (A)
black arrows: AV; white arrow: mitochondria (B) Black arrows: AV; white arrows: pigment-
containing melanosomes. (C-D) Additional representative images of melanoma tumor cells from
different patients than those represented in Figure 1A-B. (C) Tumor with low levels of autophagy
but high numbers of mitochondria in the cytoplasm. (D) Tumor with increased number of size of
AV (black arrows) (E) High magnification image of a tumor from a third patient in which the
cytoplasm is engorged with AV.
Supplemental Figure 2. (A) Growth rates of 4 melanoma cell lines (B) Cytoxicity of
hydroxychloroquine(HCQ) in 4 melanoma cell lines growing in complete media for 72 hours
Supplemental Figure 3. (A) Quantification of spheroid core area and (B) total area in indolent
(A375P and WM3918) and aggressive (C8161 and SKMEL28) spheroids (C) C8161 tet-
shControl and C8161 tet-shATG5 cells were grown in monolayer culture in the absence and
presence of doxycycline. Viable cells were measured at 72 hours. (D) C8161 cells were treated
with DMSO, temozolomide (TMZ), hydroxychloroquine (HCQ) or the combination at the
indicated doses. MTT assay was performed at 72 hours (E) C8161 melanoma spheroids were
implanted in collagen and treated with the indicated doses of HCQ. Live (green)/Dead (orange)
assay was performed at 72 hours. Representative images are shown. For all experiments data
is presented as mean ±SD
Research. on April 13, 2019. © 2011 American Association for Cancerclincancerres.aacrjournals.org Downloaded from
Author manuscripts have been peer reviewed and accepted for publication but have not yet been edited. Author Manuscript Published OnlineFirst on February 15, 2011; DOI: 10.1158/1078-0432.CCR-10-2372

Ma et al. Autophagy and melanoma
26
Supplemental Figure4. Electron micrographs of (A) A375P and (B) C8161 cells growing within
3D spheroids. Scale bars 2μm.Arrows: autophagic vesicles.
Acknowledgements We thank Dr. Craig Thompson for his instrumental support, and Drs. Meenhard Herlyn and . Adina Monica-Vultur for guidance on three dimensional culture. We thank Ray Meade in the biomedical imaging core of the Abramson Cancer Center for the outstanding preparation of electron microscopy specimens. We thank Richard Letrero and Kurt D’Andrea of the Nathanson Lab for sequencing and MLPA testing. We thank Dr. Lynn Schuchter and the Melanoma Program, Dr. Peter O’Dwyer and the Developmental Therapeutic Program. We also thank Dr. Jerry Glickson and Dr. Wafik El-Deiry for their valuable support and discussion. This work was supported by NIH grants 1K23CA120862-01A2 (R.K.A.), Penn/Wistar Skin SPORE; and pilot grants from NCI 5-U54-CA105008 ACS 78-002-29, NCI RR02305 and NCI 2U24-CA083105(L.Z.L.).
Research. on April 13, 2019. © 2011 American Association for Cancerclincancerres.aacrjournals.org Downloaded from
Author manuscripts have been peer reviewed and accepted for publication but have not yet been edited. Author Manuscript Published OnlineFirst on February 15, 2011; DOI: 10.1158/1078-0432.CCR-10-2372
Ma et al. Autophagy and melanoma
27
References 1. Amaravadi RK, Flaherty KT. Targeted therapy for metastatic melanoma. Clin Adv Hematol Oncol 2007;5: 386-94. 2. Mizushima N, Levine B, Cuervo AM, Klionsky DJ. Autophagy fights disease through cellular self-digestion. Nature 2008;451: 1069-75. 3. Lum JJ, Bauer DE, Kong M, et al. Growth factor regulation of autophagy and cell survival in the absence of apoptosis. Cell 2005;120: 237-48. 4. Rzymski T, Milani M, Pike L, et al. Regulation of autophagy by ATF4 in response to severe hypoxia. Oncogene. 5. Degenhardt K, Mathew R, Beaudoin B, et al. Autophagy promotes tumor cell survival and restricts necrosis, inflammation, and tumorigenesis. Cancer Cell 2006;10: 51-64. 6. Amaravadi RK, Thompson CB. The roles of therapy-induced autophagy and necrosis in cancer treatment. Clin Cancer Res 2007;13: 7271-9. 7. Lu Z, Luo RZ, Lu Y, et al. The tumor suppressor gene ARHI regulates autophagy and tumor dormancy in human ovarian cancer cells. J Clin Invest 2008;118: 3917-29. 8. Amaravadi RK, Yu D, Lum JJ, et al. Autophagy inhibition enhances therapy-induced apoptosis in a Myc-induced model of lymphoma. J Clin Invest 2007;117: 326-36. 9. Maclean KH, Dorsey FC, Cleveland JL, Kastan MB. Targeting lysosomal degradation induces p53-dependent cell death and prevents cancer in mouse models of lymphomagenesis. J Clin Invest 2008;118: 79-88. 10. White E, DiPaola RS. The double-edged sword of autophagy modulation in cancer. Clin Cancer Res 2009;15: 5308-16. 11. Amaravadi RK, Schuchter LM, McDermott DF, et al. Phase II Trial of Temozolomide and Sorafenib in Advanced Melanoma Patients with or without Brain Metastases. Clin Cancer Res 2009;15: 7711-8. 12. Smalley KS, Contractor R, Nguyen TK, et al. Identification of a novel subgroup of melanomas with KIT/cyclin-dependent kinase-4 overexpression. Cancer Res 2008;68: 5743-52. 13. Silva A, Yunes JA, Cardoso BA, et al. PTEN posttranslational inactivation and hyperactivation of the PI3K/Akt pathway sustain primary T cell leukemia viability. J Clin Invest 2008;118: 3762-74. 14. Villanueva J, Vultur A, Lee JT, et al. Acquired resistance to BRAF inhibitors mediated by a RAF kinase switch in melanoma can be overcome by cotargeting MEK and IGF-1R/PI3K. Cancer Cell 2010;18: 683-95. 15. Hendrix MJ, Seftor EA, Seftor RE, Fidler IJ. A simple quantitative assay for studying the invasive potential of high and low human metastatic variants. Cancer Lett 1987;38: 137-47. 16. Seftor EA, Seftor RE, Hendrix MJ. Selection of invasive and metastatic subpopulations from a heterogeneous human melanoma cell line. Biotechniques 1990;9: 324-31. 17. Smalley KS, Haass NK, Brafford PA, Lioni M, Flaherty KT, Herlyn M. Multiple signaling pathways must be targeted to overcome drug resistance in cell lines derived from melanoma metastases. Mol Cancer Ther 2006;5: 1136-44. 18. Fecher LA, Amaravadi RK, Flaherty KT. The MAPK pathway in melanoma. Curr Opin Oncol 2008;20: 183-9. 19. Wang J, Whiteman MW, Lian H, et al. A Non-canonical MEK/ERK Signaling Pathway Regulates Autophagy via Regulating Beclin 1. J Biol Chem 2009;284: 21412-24.
Research. on April 13, 2019. © 2011 American Association for Cancerclincancerres.aacrjournals.org Downloaded from
Author manuscripts have been peer reviewed and accepted for publication but have not yet been edited. Author Manuscript Published OnlineFirst on February 15, 2011; DOI: 10.1158/1078-0432.CCR-10-2372

Ma et al. Autophagy and melanoma
28
20. Korn EL, Liu PY, Lee SJ, et al. Meta-analysis of phase II cooperative group trials in metastatic stage IV melanoma to determine progression-free and overall survival benchmarks for future phase II trials. J Clin Oncol 2008;26: 527-34. 21. Ganesan AK, Ho H, Bodemann B, et al. Genome-wide siRNA-based functional genomics of pigmentation identifies novel genes and pathways that impact melanogenesis in human cells. PLoS Genet 2008;4: e1000298. 22. Welch DR, Bisi JE, Miller BE, et al. Characterization of a highly invasive and spontaneously metastatic human malignant melanoma cell line. Int J Cancer 1991;47: 227-37. 23. Luca M, Hunt B, Bucana CD, Johnson JP, Fidler IJ, Bar-Eli M. Direct correlation between MUC18 expression and metastatic potential of human melanoma cells. Melanoma Res 1993;3: 35-41. 24. Tanida I, Ueno T, Kominami E. LC3 conjugation system in mammalian autophagy. Int J Biochem Cell Biol 2004;36: 2503-18. 25. Mathew R, Karp CM, Beaudoin B, et al. Autophagy suppresses tumorigenesis through elimination of p62. Cell 2009;137: 1062-75. 26. Kroemer G, Galluzzi L, Vandenabeele P, et al. Classification of cell death: recommendations of the Nomenclature Committee on Cell Death 2009. Cell Death Differ 2009;16: 3-11. 27. Mathew R, Kongara S, Beaudoin B, et al. Autophagy suppresses tumor progression by limiting chromosomal instability. Genes Dev 2007;21: 1367-81. 28. Qu X, Yu J, Bhagat G, et al. Promotion of tumorigenesis by heterozygous disruption of the beclin 1 autophagy gene. J Clin Invest 2003;112: 1809-20. 29. Bellodi C, Lidonnici MR, Hamilton A, et al. Targeting autophagy potentiates tyrosine kinase inhibitor-induced cell death in Philadelphia chromosome-positive cells, including primary CML stem cells. J Clin Invest 2009;119: 1109-23. 30. Carew JS, Nawrocki ST, Kahue CN, et al. Targeting autophagy augments the anticancer activity of the histone deacetylase inhibitor SAHA to overcome Bcr- Abl-mediated drug resistance. Blood 2007. 31. Ding WX, Ni HM, Gao W, et al. Oncogenic transformation confers a selective susceptibility to the combined suppression of the proteasome and autophagy. Mol Cancer Ther 2009;8: 2036-45. 32. Maiuri MC, Tasdemir E, Criollo A, et al. Control of autophagy by oncogenes and tumor suppressor genes. Cell Death Differ 2009;16: 87-93. 33. Jones RG, Thompson CB. Tumor suppressors and cell metabolism: a recipe for cancer growth. Genes Dev 2009;23: 537-48. 34. Maddodi N, Huang W, Havighurst T, Kim K, Longley BJ, Setaluri V. Induction of autophagy and inhibition of melanoma growth in vitro and in vivo by hyperactivation of oncogenic BRAF. J Invest Dermatol;130: 1657-67. 35. Wan XB, Fan XJ, Chen MY, et al. Elevated Beclin 1 expression is correlated with HIF-1alpha in predicting poor prognosis of nasopharyngeal carcinoma. Autophagy;6: 395-404. 36. Li LZ, Zhou R, Xu HN, et al. Quantitative magnetic resonance and optical imaging biomarkers of melanoma metastatic potential. Proc Natl Acad Sci U S A 2009;106: 6608-13. 37. Li LZ, Zhou R, Zhong T, et al. Predicting melanoma metastatic potential by optical and magnetic resonance imaging. Adv Exp Med Biol 2007;599: 67-78. 38. Xu HN, Zhou R, Nioka S, Chance B, Glickson JD, Li LZ. Histological basis of MR/optical imaging of human melanoma mouse xenografts spanning a range of metastatic potentials. Adv Exp Med Biol 2009;645: 247-53. 39. Kanzawa T, Germano IM, Komata T, Ito H, Kondo Y, Kondo S. Role of autophagy in temozolomide-induced cytotoxicity for malignant glioma cells. Cell Death Differ 2004;11: 448-57.
Research. on April 13, 2019. © 2011 American Association for Cancerclincancerres.aacrjournals.org Downloaded from
Author manuscripts have been peer reviewed and accepted for publication but have not yet been edited. Author Manuscript Published OnlineFirst on February 15, 2011; DOI: 10.1158/1078-0432.CCR-10-2372

Ma et al. Autophagy and melanoma
29
40. Katayama M, Kawaguchi T, Berger MS, Pieper RO. DNA damaging agent-induced autophagy produces a cytoprotective adenosine triphosphate surge in malignant glioma cells. Cell Death Differ 2007;14: 548-58.
Research. on April 13, 2019. © 2011 American Association for Cancerclincancerres.aacrjournals.org Downloaded from
Author manuscripts have been peer reviewed and accepted for publication but have not yet been edited. Author Manuscript Published OnlineFirst on February 15, 2011; DOI: 10.1158/1078-0432.CCR-10-2372
Published OnlineFirst February 15, 2011.Clin Cancer Res Xiaohong Ma, Shengfu Piao, Daniel W Wang, et al. resistance to chemotherapy, and survival in melanomaMeasurements of tumor cell autophagy predict invasiveness,
Updated version
10.1158/1078-0432.CCR-10-2372doi:
Access the most recent version of this article at:
Material
Supplementary
http://clincancerres.aacrjournals.org/content/suppl/2011/05/19/1078-0432.CCR-10-2372.DC1
Access the most recent supplemental material at:
Manuscript
Authoredited. Author manuscripts have been peer reviewed and accepted for publication but have not yet been
E-mail alerts related to this article or journal.Sign up to receive free email-alerts
Subscriptions
Reprints and
To order reprints of this article or to subscribe to the journal, contact the AACR Publications
Permissions
Rightslink site. Click on "Request Permissions" which will take you to the Copyright Clearance Center's (CCC)
.http://clincancerres.aacrjournals.org/content/early/2011/02/12/1078-0432.CCR-10-2372To request permission to re-use all or part of this article, use this link
Research. on April 13, 2019. © 2011 American Association for Cancerclincancerres.aacrjournals.org Downloaded from
Author manuscripts have been peer reviewed and accepted for publication but have not yet been edited. Author Manuscript Published OnlineFirst on February 15, 2011; DOI: 10.1158/1078-0432.CCR-10-2372