M2 Dissertation v2 - ENS
40
Michael Pursey M2 APE Masters Thesis Supervisor: T. Piketty 1 CEO Pay & Factor Shares: Bargaining Effects in US Corporations 1970G2011 JEL Codes D30 & E25 Abstract This paper investigates changes in the distribution of value added over the past 30 years within a sample of US corporations and their relationship with CEO pay. The share of company value added going to staff compensation drops substantially over the period, while at the same time the share of staff compensation going to CEOs rises. We propose a framework in which CEOs bargain on behalf of investors to increase the capital share in value added, and are rewarded for doing so. Using firmGlevel data on factor shares and CEO pay, we find that better paid CEOs work in firms where CEO pay increases while the labour share fall substantially. The same relationship does not hold for lesserG paid CEOs. This pattern may contribute to understanding the wider evolution of income shares in the US economy over the period. 1. Introduction Recent research has documented the concentration of preGtax income shares at the very top of the distribution over the course of the last 30 years in the United States. Indeed the share of income going to the top 1% doubled from 10% in 1980 to 20% in 2011 (Piketty & Saez, 2003). Moreover, this trend is driven by gains in the income share of the top 0.1%, from 3% to 9% over the period 1 . The pattern of concentration continues even for the top 0.01% incomes. At the same time, the share of top incomes coming from wages stabilized (for the top 1% 2 ) or fell (for the top 0.1% 3 ) after half a century of consistent gains. These facts suggest two underlying causes are driving the evolution of the income distribution over the period. First, top wage earners must be taking up a larger share of the wage income distribution today than in 1980. Second, given that inequality in wealth is generally much greater than income inequality (Kopczuk & Saez, 2004), the capital share of overall income is also likely to have increased. Indeed, Piketty & Saez’ series on the 1 Piketty & Saez(2003, updated) 2 Wage income went from 60.5% of the top 1% earners’ total income (excl. capital gains) in 1980 to 59.1% in 2011. Piketty & Saez (2003Gupdated), table A7(cont.) 3 The wage income share of the top 0.1% fell from 49.1% to 45.6% of total income (excl. capital gains) from 1980 to 2011.
Transcript of M2 Dissertation v2 - ENS

Michael(Pursey( M2(APE(Masters(Thesis( Supervisor:(T.(Piketty((
1((
CEO(Pay(&(Factor(Shares:(Bargaining(Effects(in(US(
Corporations(1970G2011(JEL$Codes$D30$&$E25$
Abstract(
This(paper(investigates(changes(in(the(distribution(of(value(added(over(the(past(30(years(
within( a( sample(of(US( corporations( and( their( relationship(with(CEO(pay.(The( share(of(
company(value(added(going(to(staff(compensation(drops(substantially(over(the(period,(
while(at(the(same(time(the(share(of(staff(compensation(going(to(CEOs(rises.(We(propose(
a(framework(in(which(CEOs(bargain(on(behalf(of(investors(to(increase(the(capital(share(
in( value( added,( and( are( rewarded( for( doing( so.(Using( firmGlevel( data( on( factor( shares(
and( CEO( pay,( we( find( that( better( paid( CEOs( work( in( firms( where( CEO( pay( increases(
while(the(labour(share(fall(substantially.(The(same(relationship(does(not(hold(for(lesserG
paid(CEOs.(This(pattern(may(contribute(to(understanding(the(wider(evolution(of(income(
shares(in(the(US(economy(over(the(period.(
1.(Introduction(
Recent(research(has(documented(the(concentration(of(preGtax(income(shares(at(the(very(
top(of(the(distribution(over(the(course(of(the(last(30(years(in(the(United(States.(Indeed(
the( share( of( income( going( to( the( top( 1%(doubled( from(10%( in( 1980( to( 20%( in( 2011(
(Piketty(&(Saez,(2003).(Moreover,(this(trend(is(driven(by(gains(in(the(income(share(of(the(
top(0.1%,(from(3%(to(9%(over(the(period1.(The(pattern(of(concentration(continues(even(
for(the(top(0.01%(incomes.(
At( the( same( time,( the( share(of( top( incomes(coming( from(wages( stabilized( (for( the( top(
1%2)( or( fell( (for( the( top( 0.1%3)( after( half( a( century( of( consistent( gains.( These( facts(
suggest(two(underlying(causes(are(driving(the(evolution(of(the(income(distribution(over(
the(period.(First,(top(wage(earners(must(be(taking(up(a(larger(share(of(the(wage(income(
distribution( today( than( in( 1980.( Second,( given( that( inequality( in( wealth( is( generally(
much( greater( than( income( inequality( (Kopczuk( &( Saez,( 2004),( the( capital( share( of(
overall( income( is( also( likely( to( have( increased.( Indeed,( Piketty( &( Saez’( series( on( the(
((((((((((((((((((((((((((((((((((((((((((((((((((((((((1(Piketty(&(Saez(2003,(updated)((2(Wage(income(went(from(60.5%(of(the(top(1%(earners’(total(income((excl.(capital(gains)(in(1980(to(59.1%(in(2011.(Piketty(&(Saez((2003Gupdated),(table(A7(cont.)(3The(wage(income(share(of(the(top(0.1%(fell(from(49.1%(to(45.6%(of(total(income((excl.(capital(gains)(from(1980(to(2011.(

Michael(Pursey( M2(APE(Masters(Thesis( Supervisor:(T.(Piketty((
2((
distribution(of(wage(income(confirms(the(former,(with(the(top(1%(share(in(wage(income(
going(from(6.4%(in(1980(to(11%(in(20114.(On(the(other(hand,(evidence(linking(gains(in(
the(capital(share(to(top(income(shares(less(clearGcut.(((
In( seeking( to( analyse( the( relative( importance( of( these( phenomena,( there( are( two(
obvious(places(to(start.(Firstly,(if(the(distribution(of(the(labour(share(of(value(added(has(
become( more( uneven( at( the( very( top,( top( earners’( wages( –( such( as( those( of( CEOs( –(
would(be(rising(faster(than(average(wages.(Secondly,( if(capital( income(increased(faster(
than(wage(income(over(the(period,(the(proportions(of(value(added(in(the(economy(going(
to( capital( and( labour( would( reflect( this.( Should( both( phenomena( be( occurring(
concurrently,( a( theoretical( framework( linking( the( two( would( go( some( way( towards(
understanding(the(causes(behind(increasing(income(inequality(in(the(United(States.(
Indeed,(several(reasons(that(have(been(put(forward(to(explain(why(labour(income(may(
have(become(more(unequal(struggle(to(explain(a(simultaneous(increase(in(the(return(to(
capital.(Theories(attributing(rising(income(inequality(to(skillGbiased(technical(change(are(
one( example.( Under( standard( skillGbiased( technical( change( models,( it( is( argued( that(
emerging( technological( developments( are( complementary( with( higher( skilled( labour,(
thereby(increasing(the(demand(for(skills(even(as(the(supply(of(collegeGeducated(workers(
grew.(Since(the(demand(for(unskilled(workers(is(assumed(not(to(have(changed(much,(the(
subsequent(pay(divergence(is(postulated(to(explain(growth(in(income(inequality.(
Should( the( technological( developments( be( more( capital( intensive( than( existing(
industries,( the( skillGcapital( complementarity( these( models( feature( might( explain( an(
increasing(capital(share(and(concurrent(rise( in( income(inequality.(Similarly( if( technical(
evolutions(lead(to(monopolistic(rents(in(new(industries,(the(skillGbiased(technical(change(
framework( might( be( compatible( with( a( rising( capital( share.( Given( the( anecdotal(
evidence( that( new( industries( are( less( capital( intensive( than( old( ones,( the( latter( story(
seems(the(more(plausible(of(the(two.((
Note(however,( that(monopolistic( rents( are(a( feature(of( imperfect( competition(–(which(
the( skillGbiased( technical( change(models( tend( to( rule(out.(More( importantly,( advanced(
countries(undergoing(similar(technical(change(have(not(experienced(the(level(of(income(
concentration( that( has( occurred( in( the( United( States,( such( as( continental( Europe( and(
Japan.( This( international( evidence( makes( it( hard( to( believe( evolutions( in( the( income(
distribution(are(driven(by(skillGbiased(capital( change,(making( these(model( illGsuited( to(
understanding(the(concurrent(evolution(of(the(labour(share.(
((((((((((((((((((((((((((((((((((((((((((((((((((((((((4(Piketty(&(Saez((2003,(updated)(fig.(9( (

Michael(Pursey( M2(APE(Masters(Thesis( Supervisor:(T.(Piketty((
3((
Other( models( have( sought( to( explain( the( evolution( of( the( income( distribution( in(
different( countries( through( changes( in( taxation.( Indeed,( a( standard( response( to(
reductions( in(the(top(marginal(tax(rate(would(see(top(earners(supply(more( labour(and(
increase(their(pay(accordingly.(Another(response(to(lower(taxation(could(see(a(reduction(
in( tax(avoidance(efforts.(This(channel(would(explain(part(of( the(rise( in(preGtax( income(
inequality(as(coming(from(top(earners(ceasing(to(hide(as(much(of(their(income(from(tax(
authorities,( given( that( the( incentive( to( avoid( tax( decreases(when( tax( rates( are( lower.(
Looking(at( figures( from(the(World(Top(Income(Database5,(we(do(certainly(see(that( the(
surge( in( top( income( shares( coincides( remarkably( with( reductions( in( taxation.(
International(evidence(also(supports(the(hypothesis(that(changes(in(taxation(are(at(the(
root( of( changes( in( the( income( distribution,( since( those( countries( that( reduced( top(
marginal(tax(rates(the(most(and(from(the(highest(starting(point((Australia,(Canada,(UK,(
USA)(have(also(experienced(the(largest(increase(in(top(income(shares.(
While(both(these(channels(can(explain(some(of(the(evolution(in(the(income(distribution,(
estimates( of( the( implied( elasticities( of( income( with( respect( to( tax( suggest( that( there(
must( be( other( responses( by( top( income( earners( to( falls( in( taxation.( Piketty,( Saez( and(
Stantcheva( (2013)( have( suggested( that( one( such( response( comes( in( the( form( of(
increased(efforts(in(bargaining(for(pay,(and(estimate(that(this(elasticity(is(higher(than(the(
elasticity( for( increased(effort.(Building(on(work(by(Bertrand(and(Mullainathan( (2001),(
they(also(show(that(CEO(pay(for(luck(is(substantially(higher(under(low(tax(regimes(than(
high(tax(regimes.(Thus(they(postulate(that(CEOs(have(increased(their(bargaining(efforts(
to( increase( their( compensation( in( a( way( that( does( not( reflect( higher( marginal(
productivity.(In(this(imperfectly(competitive(scenario,(higher(paid(CEOs(tend(to(be(more(
rewarded( for( the( market’s( overall( performance( rather( than( for( outperforming( their(
rivals(when(taxes(are(lower.(In(other(words,(the(proportion(of(CEO(compensation(that(is(
unrelated(to(their(firm’s(performance(–(and(by(proxy(their(own(performance(G(increases(
when(taxes(are(lower.(
High(earners(capturing(a( larger(part(of(profits( is( likely( to(contribute( to( labour( income(
inequality(increasing.(Evolutions(in(the(capital(share(of(overall(income(are(also(likely(to(
be(related(to(increasing(top(income(shares.(The(evidence(suggests(that(top(wage(earners(
also(have(a(role( in(shaping(changes( in( the(capital(share.( Indeed( in( their(study,(Piketty,(
Saez( and( Stantcheva( find( that( CEO( pay( remains( highly( correlated( to( investor( returns,(
despite( pay( for( luck.( Other( studies( (Gabaix( &( Landier,( 2008)( confirm( the( strong(
relationship( between( CEO( compensation( and( market( capitalization.( Thus( even( lucky(
((((((((((((((((((((((((((((((((((((((((((((((((((((((((5(Online(at(topincomes.parisschoolofeconomics.eu(

Michael(Pursey( M2(APE(Masters(Thesis( Supervisor:(T.(Piketty((
4((
CEO’s(interests(are(still(very(much(aligned(with(those(of( investors,(at( least(in(the(short(
run.(
This( is( revealing( for(at( least( two(reasons.(Firstly,(better(aligning(CEO(pay( to( investors’(
absolute( returns( has( not( resolved( the( problem( caused( by( the( difficulty( in( observing(
CEOs’(relative(marginal(productivity.(CEOs(are(still(paid(for(luck,(leaving(plenty(of(room(
for( bargaining( a( wage( above( what( they( would( receive( under( perfect( competition.(
Secondly,( the( way( CEOs( are( incentivised( to( increase( investors’( shortGterm( absolute(
returns(does(not(emphasise(growth(by(gains(in(revenue(relative(to(competitors(–(cutting(
absolute(costs(also(highly(rewarded.(Looking(more(closely(at(the(bargaining(activities(of(
high(earners,(it(seems(unlikely(then(that(CEOs(should(focus(all(their(efforts(on(gaining(a(
greater(share(of(value(added(at( the(expense(of( investors.(They(are(also( incentivised(to(
gain(a(greater(share(of(value(added(for(investors(at(the(expense(of(other(staff.(((
This( response( would( consequently( see( CEOs( capturing( a( larger( part( of( staff(
compensation,( given( their( pay’s( alignment( with( investors’( share( in( value( added.( This(
paper(proposes(that(CEOs(bargain(with(both(investors(and(employees.(With(employees,(
CEOs(bargain(for(a(greater(share(of(value(added(for(investors,(not(just(for(a(higher(share(
in(payroll.(Doing(so( improves(CEOs’(bargaining(position(with( investors,(whose(returns(
they(seek(a(greater(share(of(by(increasing(pay(for(luck.(Bargaining(on(both(fronts(would(
allow( CEOs( to( benefit( from( wage( income( concentration( and( capital( share( increases(
simultaneously.(
Conceivably,( CEO( bargaining( efforts( with( employees( extend( down( the( management(
chain,( as( lower( ranked(executives(are(also( rewarded(with(pay( rises( for( containing( the(
compensation( of( staff( they( oversee.( Should( top( executives( have( increased( their(
bargaining(efforts(through(all(of(these(channels(over(the(last(thirty(years,(the(mechanism(
might( go( some( way( towards( explaining( how( rising( inequality( within( labour( incomes(
might(be(accompanied(by(rising(inequality(between(labour(and(capital(incomes.(
But(aren’t(factor(shares(stable(over(time,(one(of(Kaldor’s((1963)(facts?(It(is(a(feature(of(
many( growth( models,( including( CobbGDouglas( variants( of( the( Solow( model,( that(
technological(change(is(assumed(to(be(factorGneutral.(Endogenous(growth(models(do(not(
postulate(otherwise(either.(Indeed,(the(“stylized(fact”(of(factorGshare(stability(has(found(
empirical( support( in( many( studies.( This( paper( revisits( standard( measures( of( factorG
shares( to( see( whether( recent( trends( have( moved( away( from( the( stability( found( in(
previous( studies.( Typical( measures( of( factor( shares,( such( as( those( produced( by( the(
Bureau(of(Economic(Analysis(or( the(Bureau(of(Labour(Statistics(use(macro(data(at( the(
level(of(national(accounts.(Recent(studies(using(similar(macro(data(have(shown(that(the(

Michael(Pursey( M2(APE(Masters(Thesis( Supervisor:(T.(Piketty((
5((
labour(share(has(been(declining( in(many(OECD(countries((Karabarbounis(and(Neiman,(
2013).( But( for( the( purpose( of( investigating( the( bargaining( dynamics( described( above,(
firmGlevel( data( is(more( appropriate,( especially( firmGlevel( data( incorporating( executive(
compensation.((
This( paper( therefore( presents( a( dataset( combining( major( US( firms’( financial( data(
obtained( from( the(CompustatGCRSP(Annual$Fundamentals(with(CEO(and(executive(pay(
data( from( Forbes( and( Execucomp.( The( dataset( covers( the( period( from( 1970( to( 2011.(
Factor( shares( are( calculated(and( the( relationship(between( firm(performance,(CEO(pay(
and(the(value(added(share(is(analysed.(We(find(that(there(has(been(a(significant(increase(
in(the(share(of(value(added(attributed(to(capital(at(the(same(time(as(executive(pay(has(
taken( up( an( increasing( share( of( overall( payroll.( Furthermore,( regressing( CEO( pay( on(
firmGlevel(factor(shares(shows(that(CEOs(compensation(tends(to(increase(more(in(firms(
where(the(capital(share(of(value(added(has(risen.(This(effect(is(also(stronger(in(low(tax(
environments( relative( to( high( tax( environments,( suggesting( that( bargaining( may( be(
playing(a(role(–(encouraged(by(the(bigger(pie(available(as(described(by(Piketty,(Saez(&(
Stantcheva.(((
In(the(first(section(of(this(paper,(the(firmGlevel(data(set(is(presented.(The(second(section(
compares( the( evolution( of( factor( shares( at( firm( level( with( those( from( the( national(
accounts(and(suggests(possible(causes(for(the(divergence.(The(third(section(investigates(
the( relationship( between( executive( compensation(with( average( pay( and( variations( in(
firmGlevel(factor(shares.(The(final(section(concludes.(
2.(Firm4level(data(
The(CompustatGCRSP(merged(Annual$Fundamentals$database(is(a(comprehensive(set(of(
company(financials(covering(almost(all(publicly(listed(corporations(in(the(United(States(
over(the(period(from(1960(to(2011,(the(latest(complete(year(for(which(data(is(available.(
In( 2010,( there(were( 3,885(USGbased( corporations( in( the( database(with( a( total(market(
capitalization( of( $15.9( trillion( and( 35.5(million( employees.( To( put( this( last( number( in(
perspective,( Bureau( of( Economic( Analysis( (BEA)( data( indicates( that( domestic( and(
foreign( private( employment( by( US( firms( stood( at( 118.5( million( workers( in( 2010.(
Furthermore,( aggregate( EBITDA6(for( 2010( was( $2.2(trillion( in( the( Compustat( sample(
compared(to($3.5( trillion(dollars( in(corporate(gross(operating(surplus(by(US( firms(and(
((((((((((((((((((((((((((((((((((((((((((((((((((((((((6Earnings(before(tax,(interest,(depreciation(and(amortization.(This(is(the(firmGlevel(financial(statistic(that(equates(to(national(Gross(Operating(Surplus,(as(defined(in(the(national(accounts.(

Michael(Pursey( M2(APE(Masters(Thesis( Supervisor:(T.(Piketty((
6((
their( foreign(affiliates(as(defined(by( the(BEA.(For(comparison,( the(US(private(sector(as(
whole(generated(a($5.2(trillion(domestic(gross(operating(surplus(in(2011.((
Although( these( numbers( are( not( directly( comparable,( since( firmGlevel( data( include(
figures(for(consolidated(foreign(subsidiaries,(they(give(an(idea(of(the(sheer(size(of(the(US(
corporate( business( sector( and( indicate( that( the( Compustat( database( is( almost(
exhaustive(in(its(coverage(of(corporate(America.(For(our(purposes(then,(bearing(in(mind(
that( corporate( business( domestic( value( added( represented( 56%( of( US( GDP( in( 2011,(
studying(the(evolution(of(corporate(factor(shares(and(labour(income(distribution(should(
give( a( reasonable( representation( of( the( underlying( mechanisms( shaping( the( overall(
picture.( The( table( below( shows( a( summary( of( how( the( Compustat( aggregate( data(
compare(with(domestic(aggregate(statistics(from(the(BEA(since(2000.(
(
The( Compustat( data( do( have( one( major( drawback( however( for( the( purposes( of( our(
study,( namely( that( the( universe( of( firms( reporting( the( staff( compensation( figures(
required( to( compute( factor( shares( is( a( relatively( small( subset( of( the( overall( database.(
Indeed,( only( 784( of( the( 3,753( companies( in( the( database( shared( staff( compensation(
numbers( in(2011.(While( this( is( still( a( respectable(sample(size,( it( is( important( to(check(
that(the(sample(is(reasonably(representative(over(the(period(analysed.(Doing(so(reveals(
that(the(universe(of(firms(with(staff(expenses(data(has(stayed(relatively(stable(over(the(
last(40(years(with(the(exception(of(a(large(increase(in(1993(followed(by(a(steady(decline(
to(the(present(day.(Meanwhile,(the(overall(number(of(firms(in(the(Compustat(sample(is(
more(volatile,(with(rapid(growth(to(exceed(7,000(in(1996(before(shrinking(considerably(
since(then.((
YearEBITDA'
(2011'$M)Employment'(thousands)
Full(Compustat(Sample((Domestic(&(Foreign)
Corporate'gross'operating'surplus'
(2011'$M)
Private(Employment((thousands)
Compustat'EBITDA'vs'BEA'GOS
Compustat'employment'vs'BEA'employment
Domestic(&(Foreign(estimates*(from(BEA(data
2000 2,082,201'' 37,0962001 1,873,796'' 36,0112002 1,836,253'' 35,8962003 1,991,436'' 35,7472004 2,185,220'' 36,7772005 2,356,179'' 37,2152006 2,616,888'' 37,7442007 2,589,745'' 37,3442008 1,907,405'' 36,5322009 1,772,614'' 34,5962010 2,237,839'' 35,5462011 2,403,305'' 36,394
*'Sum'of'BEA'data'for'domestic'corporate'GOS'and'foreign'affiliates'majoritarily'owned'by'US'corporates.'NonUbank'foreign'affiliates'until'2008,'allUindustry'thereafter.
2,536,400'''''''''''' 119,262''''' 82% 31%2,422,582'''''''''''' 118,994''''' 77% 30%2,479,279'''''''''''' 117,193''''' 74% 31%2,619,050'''''''''''' 116,759''''' 76% 31%2,907,329'''''''''''' 118,555''''' 75% 31%3,171,375'''''''''''' 121,044''''' 74% 31%3,410,303'''''''''''' 123,768''''' 77% 30%3,322,563'''''''''''' 125,439''''' 78% 30%3,200,164'''''''''''' 124,368''''' 60% 29%3,118,574'''''''''''' 119,115''''' 57% 29%3,492,568'''''''''''' 118,497''''' 64% 30%
*'Sum'of'BEA'data'for'domestic'corporate'GOS'and'foreign'affiliates'majoritarily'owned'by'US'corporates.'NonUbank'foreign'affiliates'until'2008,'allUindustry'thereafter.
Michael(Pursey( M2(APE(Masters(Thesis( Supervisor:(T.(Piketty((
7((
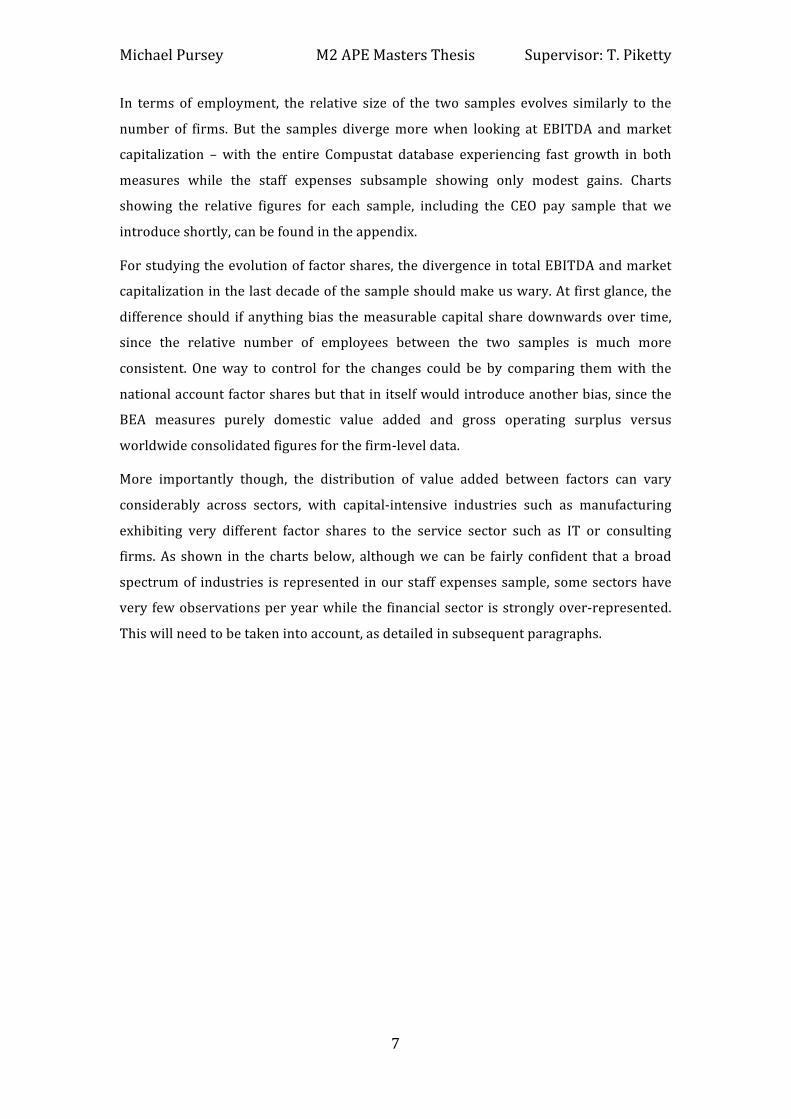
In( terms( of( employment,( the( relative( size( of( the( two( samples( evolves( similarly( to( the(
number( of( firms.( But( the( samples( diverge(more(when( looking( at( EBITDA( and(market(
capitalization( –(with( the( entire( Compustat( database( experiencing( fast( growth( in( both(
measures( while( the( staff( expenses( subsample( showing( only( modest( gains.( Charts(
showing( the( relative( figures( for( each( sample,( including( the( CEO( pay( sample( that( we(
introduce(shortly,(can(be(found(in(the(appendix.($
For(studying(the(evolution(of(factor(shares,(the(divergence(in(total(EBITDA(and(market(
capitalization(in(the(last(decade(of(the(sample(should(make(us(wary.(At(first(glance,(the(
difference( should( if( anything(bias( the(measurable( capital( share(downwards(over( time,(
since( the( relative( number( of( employees( between( the( two( samples( is( much( more(
consistent.( One(way( to( control( for( the( changes( could( be( by( comparing( them(with( the(
national(account(factor(shares(but(that(in(itself(would(introduce(another(bias,(since(the(
BEA( measures( purely( domestic( value( added( and( gross( operating( surplus( versus(
worldwide(consolidated(figures(for(the(firmGlevel(data.$
More( importantly( though,( the( distribution( of( value( added( between( factors( can( vary(
considerably( across( sectors,( with( capitalGintensive( industries( such( as( manufacturing(
exhibiting( very( different( factor( shares( to( the( service( sector( such( as( IT( or( consulting(
firms.(As( shown( in( the( charts(below,( although(we( can(be( fairly( confident( that( a(broad(
spectrum(of( industries( is(represented( in(our(staff(expenses(sample,(some(sectors(have(
very(few(observations(per(year(while(the(financial(sector( is(strongly(overGrepresented.(
This(will(need(to(be(taken(into(account,(as(detailed(in(subsequent(paragraphs.(

Michael(Pursey( M2(APE(Masters(Thesis( Supervisor:(T.(Piketty((
8((
(
(
!19!!
!8!! !9!!!13!!
!47!!!1!! !2!!
!40!!
!12!!
!2!!!1!!
!1!!!35!!
!11!!
!541!!
!95!!
!19!!!10!! !16!!!1!!!1!!!2!!2008$Staff$Expense$Sample$Observa5ons$by$sector$
Energy! Materials!Capital!Goods! Commercial!&!Professional!Services!TransportaEon! Automobiles!and!Components!Consumer!Durables!and!Apparel! Consumer!Services!Media! Retailing!Food!&!Staples!Retailing! Food,!Beverage!&!Tobacco!Household!&!Personal!Products! Health!Care!Equipment!&!Services!PharmaceuEcals,!Biotechnology!&!Life!Sciences! Banks!Diversified!Financials! Insurance!Real!Estate! SoUware!&!Services!Technology!Hardware!&!Equipment! Semiconductors!&!Semiconductor!Equipment!TelecommunicaEon!Services! UEliEes!
!314!!
!183!!
!340!!
!149!!!75!!
!40!!!146!!
!158!!
!111!!
!172!!
!29!!!89!!!49!!!313!!!327!!
!551!!
!159!!
!99!!
!57!!
!323!!
!298!!
!137!!!57!!
!111!!
2008$Whole$Compustat$Observa5ons$by$Sector$
Energy! Materials!Capital!Goods! Commercial!&!Professional!Services!TransportaEon! Automobiles!and!Components!Consumer!Durables!and!Apparel! Consumer!Services!Media! Retailing!Food!&!Staples!Retailing! Food,!Beverage!&!Tobacco!Household!&!Personal!Products! Health!Care!Equipment!&!Services!PharmaceuEcals,!Biotechnology!&!Life!Sciences! Banks!Diversified!Financials! Insurance!Real!Estate! SoUware!&!Services!Technology!Hardware!&!Equipment! Semiconductors!&!Semiconductor!Equipment!

Michael(Pursey( M2(APE(Masters(Thesis( Supervisor:(T.(Piketty((
9((
Among( financial( sector( firms,( it( is( especially( banks( that( dominate( the( sample.( Indeed,(
almost( all( banks( report( total( staff( compensation,( whereas( many( other( industries( are(
more( sparsely( represented.( The( difficulty( is( that( banks’( capital( structure( is( highly(
unusual.( Profits( to( revenue( ratios( are(higher( than(most( industries,( especially( over( the(
last(thirty(years.(And(although(banks’(revenue(to(asset(ratio(is(much(lower(compared(to(
many( other( sectors,( banks( are( also( highly( leveraged.(Within( the( financial( sector( as( a(
whole,( a( great( deal( of( variation( could( also( be( expected.( It( is( unclear( therefore( how(
representative( factor( shares( for( the( financial( sector( might( be( compared( to( economyG
wide(measures.$
The( potential( pitfalls( in( using( unbalanced( data( without( adjustment( are( therefore(
particularly(acute(for(computing(factor(shares.(Unadjusted(shares(using(the(sample(are(
contained(in(the(appendix(as(testimony.(To(compensate(for(this(sectoral(imbalance,(we(
introduce(a(weighting(scheme(in(order(to(get(a(less(biased(representation(of(factor(share(
evolution( for( the( companies( included( in( Compustat.( The( retained( method( involves(
computing( a( 5Gyear( moving( average( of( industry( weights( by( EBITDA( for( the( whole(
Compustat(sample,(and(then(scaling(the(contributions(of(each(firm(in(the(staff(expenses(
subsample( to( obtain( similar( aggregate(weights( for( both( samples.(While( the(method( is(
not( without( drawbacks,( it( allows( us( to( obtain( reasonably( representative( data( with( a(
straightforward(and(consistent(adjustment.(
This(paper(therefore(features(two(datasets:(the(sample(of(firms(in(Compustat(for(which(
staff( compensation( data( are( available,( and( the( subsample( of( these( firms( for( which(
executive(compensation(is(also(available.(The(next(section(will(analyse(the(larger(sample(
to(get(an(understanding(of(the(evolution(of(factor(shares(in(the(broader(set(of(firms.(We(
will( then(move( to( the( executiveGstaff( expenses( subsample( to( see(how( the( evolution(of(
factor(shares(correlates(to(the(evolution(of(top(earners(within(firms.(
3.(Measurement(and(Evolution(of(Factor(Shares(
Recent(research(into(factor(shares(and(their(measurement(has(revived(a(literature(that(
had( been( somewhat( dormant( since( the( 1960s.( For( many( years,( factor( shares( were(
considered( to( be( more( or( less( constant( (Goldfarb( &( Leonard,( 2005).( Defining( factor(
shares(can(also(prove(problematic,(both(in(theory(and(in(practice.(The(basic(definition(of(
the( labour( share( starts( by( dividing( national( income( by( total( employee( compensation.(
But( this( definition( isn’t( entirely( satisfactory( when( considering( the( top( officers( of( a(
company.(Many(business(leaders(are(both(employees(and(owners,(so(categorizing(their(
salaries( as( part( of( the( labour( share( can( introduce( biases( –( especially( if( they( are(

Michael(Pursey( M2(APE(Masters(Thesis( Supervisor:(T.(Piketty((
10((
incentivized(to(optimize(their(income(classification(for(tax(purposes.(Furthermore,(many(
approaches(are(possible(when(treating(selfGemployed(workers’(incomes.(Krueger((1999)(
points( out( several( of( the( pitfalls( of( various( measures( and( alternatives.( Gollin( (2002)(
describes( how( standard( measures( underestimate( labour( shares( in( small( firms.(
Ultimately,(many( proposals( have( been(made( to( improve( on( basic(measures.( Since(we(
will(restrict(ourselves(to(analysing(factor(incomes(in(the(corporate(sector,(a(requirement(
for(simplicity(will(guide(this(paper’s(approach.(
A( good( place( to( start( is( the( definition( of( gross( value( added.( The( following( definition(
(Gomme(&(Rupert,(2004)(is(generally(accepted:(
!"#$$!!"#$%!!""#"= !"#$%&'()*"&!!"!!"#$%&''( + !"#$"#%&'!!"#$%&' + !"#$%&!!"#$%&
+ !"#!!"#$%$&#!!"#$%& + !"#$"%&'#"(′!!"#$%& + !"#$%&'(!!"#$%!!"##!!"!"#$#%"+ !"#$"%&'(&)*(
Labour( income( is( fairly( unambiguously( compensation( of( employees.( Defining( capital(
income(can(be(somewhat(more(controversial,(given(the(presence(of(proprietors’(income(
in( gross( value( added( as( explained( earlier.( Many( conventions( attribute( proprietors’(
income( according( to( the( labourGcapital( shares( obtained( from( splitting( the( portion( of(
value( added( that( excludes( it.( This( is( done( for( instance( by( various( sources( when(
computing(the(shares(of(private(business(income.(Since(we(will(be(restricting(ourselves(
to( the( corporate( sector( for( the( most( part,( this( issue( is( less( problematic.( Indeed,(
proprietors’( income( is( quite( clearly( accounted( for( in( corporate( profits( in( the( form( of(
dividends.(
A(common(national(accounts(measure(for(capital(income(in(the(corporate(sector(is(gross(
operating( surplus.( Gross( operating( surplus( is( essentially( the( sum(of( corporate( profits,(
rental(income,(net(interest(income(and(depreciation.(This(suits(our(purpose(nicely,(since(
it(has(a(clear(equivalent(in(firmGlevel(data(in(the(form(of(Earnings(Before(Interest,(Taxes,(
Depreciation(and(Amortization((EBITDA).(
Thus(the(only(remaining(question(for(this(paper’s(approach(in(calculating(factor(shares(
concerns( the( denominator,(which( in(most( calculations( is( simply( gross( value( added( as(
defined(above.(At(firm(level(however,(indirect(taxes(less(subsidies(is(not(often(reported,(
and( is( excluded( from(easily( comparable(measures( such(as(EBITDA(or(EBIT.(Therefore(
when(making(our(own(calculations,(we(will(use(value(added(as(the(denominator,(defined(
as(the(sum(of(employee(compensation(and(gross(operating(surplus((or(EBITDA(at( firm(

Michael(Pursey( M2(APE(Masters(Thesis( Supervisor:(T.(Piketty((
11((
level).(Fortunately,(this(is(unlikely(to(be(distortive(in(any(significant(way(since(the(share(
of( indirect( taxes( less( subsidies( in( gross(value(added( is( remarkably( constant(over( time(
according(to(the(BEA.(
Two( easily( accessible(mainstream( sources( detailing( the( distribution( of( income( among(
factors(are(the(BEA’s(National(Income(and(Product(Accounts((NIPA)(and(the(Bureau(of(
Labour( Statistic’s( labour( share( indices.( Both( sources( provide( estimates( for( different(
sectors(of(the(economy,(such(as(Nonfinancial$Corporations$or(Nonfarm$Business,(with(the(
BEA( reporting( the( levels( of( shares( while( the( BLS( reports( changes( in( index( form.(
Dishearteningly,( while( both( purport( using( the( same( source( data,( the( evolution( of( the(
corporate(business( labour(share(measured(by(NIPA( is(somewhat( less(volatile( than( the(
BLS(private(business(index.((
Many(reasons(for(this(discrepancy(are(explored(in(the(literature7,(most(of(which(revolve(
around(accounting(for(selfGemployed(and(proprietor(shares.(Another(reason(could(very(
well( be( linked( to( idiosyncratic( differences( between( the( corporate( and( nonGcorporate(
business(sectors,(although(this(seems(somewhat(implausible(given(that(the(NIPA(report(
data(on(overall(private(sector(industries(since(1987(that(do(not(replicate(the(BLS(series(
(see( appendix).(Note( that( the(BEA(does(however( caution(use(of( the(private( industries(
series(due(to(unreliability(and(changing(methodologies(early(in(the(sample.(
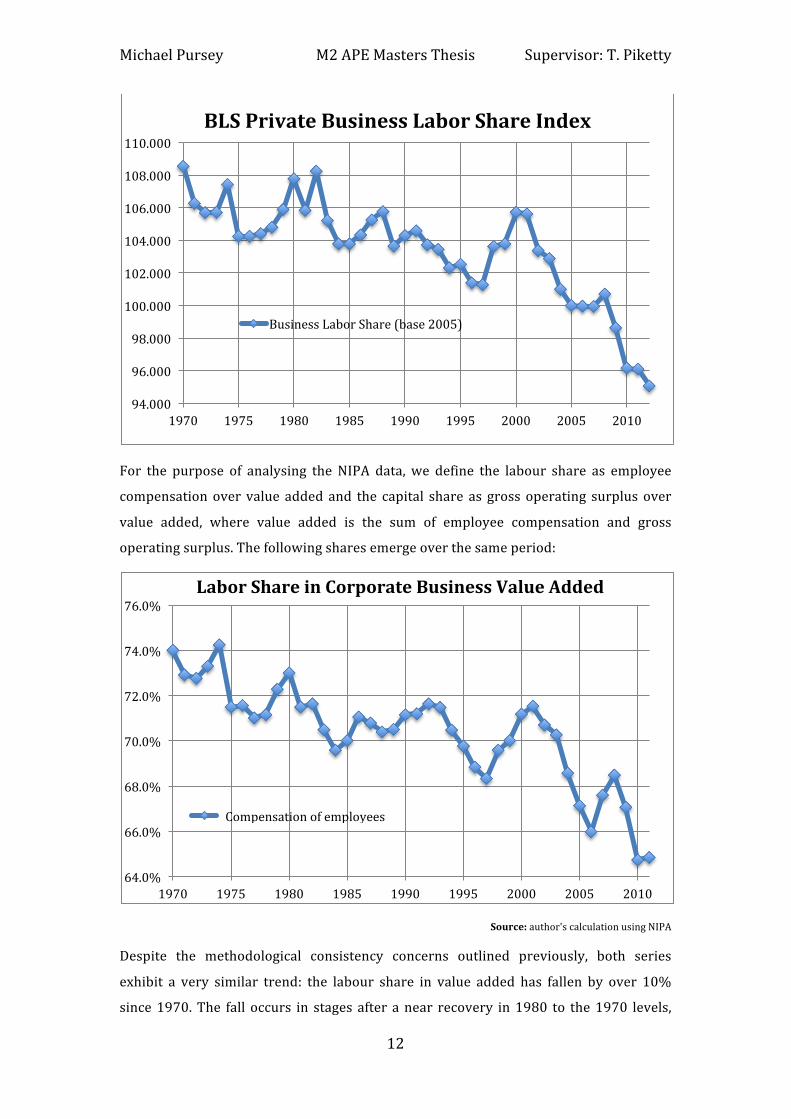
With(the(caveats(listed(above(in(mind,(the(NIPA(and(BLS(series(offer(an(excellent(starting(
point( in( discussing( the( evolution( of( factor( shares( in( the(United( States.( The(BLS( series(
since(1970(is(presented(below:(
((((((((((((((((((((((((((((((((((((((((((((((((((((((((7(See(for(instance(Krueger((1999),(Gollin((2002),(Rupert(&(Gomme((2004)(or(Freeman((2011)(
Michael(Pursey( M2(APE(Masters(Thesis( Supervisor:(T.(Piketty((
12((
(
For( the( purpose( of( analysing( the( NIPA( data,( we( define( the( labour( share( as( employee(
compensation(over( value( added(and( the( capital( share( as( gross(operating( surplus(over(
value( added,( where( value( added( is( the( sum( of( employee( compensation( and( gross(
operating(surplus.(The(following(shares(emerge(over(the(same(period:(
(
Source:(author's(calculation(using(NIPA(
Despite( the( methodological( consistency( concerns( outlined( previously,( both( series(
exhibit( a( very( similar( trend:( the( labour( share( in( value( added( has( fallen( by( over( 10%(
since(1970.(The( fall( occurs( in( stages( after( a(near( recovery( in(1980( to( the(1970( levels,(
94.000(
96.000(
98.000(
100.000(
102.000(
104.000(
106.000(
108.000(
110.000(
1970( 1975( 1980( 1985( 1990( 1995( 2000( 2005( 2010(
BLS(Private(Business(Labor(Share(Index(
Business(Labor(Share((base(2005)(
64.0%(
66.0%(
68.0%(
70.0%(
72.0%(
74.0%(
76.0%(
1970( 1975( 1980( 1985( 1990( 1995( 2000( 2005( 2010(
Labor(Share(in(Corporate(Business(Value(Added(
((Compensation(of(employees(

Michael(Pursey( M2(APE(Masters(Thesis( Supervisor:(T.(Piketty((
13((
with(the(largest(fall(occurring(since(2000.((This(in(itself(is(a(remarkable(decline(and(is(a(
trend(unseen( since( the(Great(Depression( (Piketty(&(Saez,( 2003).( Such(a(decline(might(
very(well(help(explain(the(pattern(of(top(earners(increasing(their(share(of(capital(income(
along( the( lines( argued( in( the( introduction( to( this( paper,( especially( in( the( last( decade.(
However( the( growth( in( top( income( shares( began( in( the( 1980s,( and( the( evolution( of(
domestic(factor(shares(from(the(NIPA(and(BLS(data(does(not(exhibit(such(a(steep(trend(
until(2000.(Put(bluntly,(we(might(expect( the(capital( share( to(have( increased(more(and(
earlier(given(the(evolution(householdGlevel(income(shares.(In(the(following(paragraphs,(
we(will(investigate(whether(looking(at(firmGlevel(data(might(hold(some(clues.(
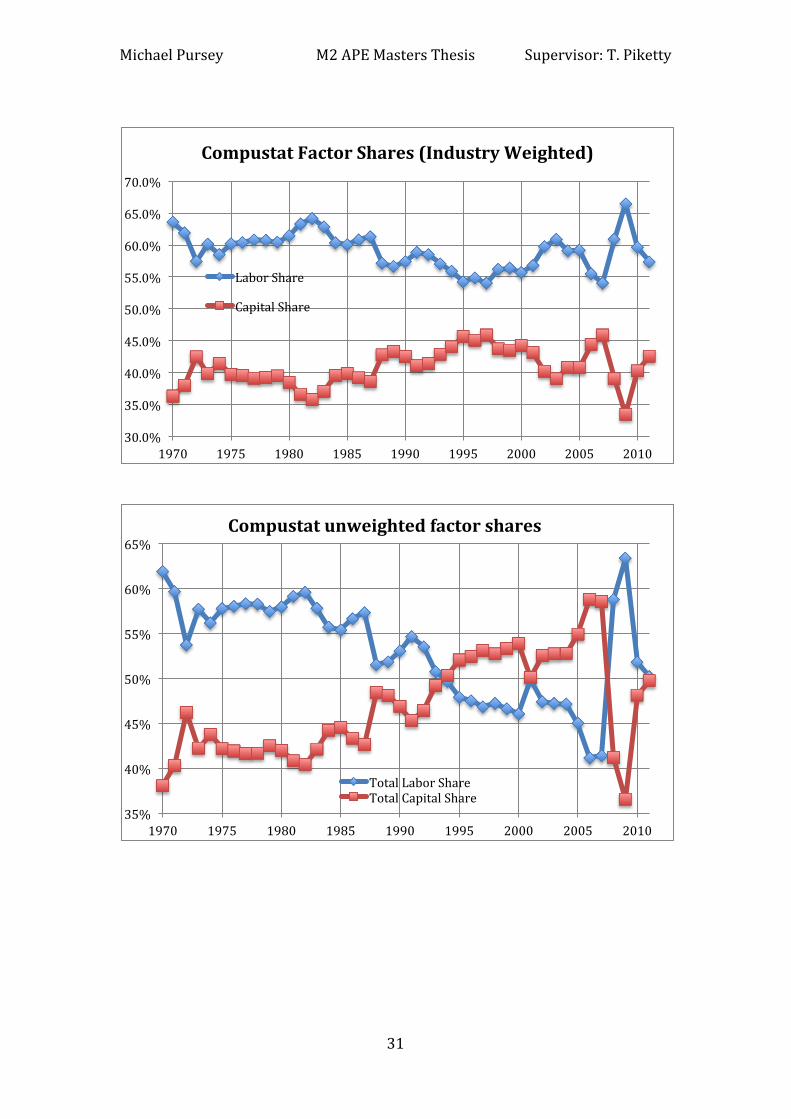
Looking(at(the(subsample(of(firms(in(Compustat(reporting(staff(expenses(over(the(period(
from( 1970( to( 2011,( defining( value( added( as( EBITDA( plus( staff( compensation( and(
applying( the( industry( weighting( scheme( detailed( previously,( the( following( picture(
emerges:(
(
There(are(several(aspects(to(this(graph(that(stand(out.(First(of(all,(the(labour(share(level(
is(considerably(lower(for(our(sample(relative(to(the(NIPA(and(BLS(measures.(To(a(certain(
extent,( a( lower( share(might(be(expected(given( that( the( corporations( in(Compustat( are(
among( the( largest( in( the( country( and( so( would( benefit( from( economies( of( scale( and(
greater(access(to(capital.(But(by(the(same(argument,(and(recalling(the(sheer(weight(of(US(
listed( firms( in( overall( corporate( value( added,( there( would( have( to( be( a( very( big(
difference( in( factor( shares( between( smaller( and( larger( firms( to( explain( the( near( 10G
percentage(point(gap.(This(is(hard(to(imagine.(
52.0%(
54.0%(
56.0%(
58.0%(
60.0%(
62.0%(
64.0%(
66.0%(
68.0%(
1970( 1975( 1980( 1985( 1990( 1995( 2000( 2005( 2010(
Compustat(Industry(Weighted(Labour(Share((
Labor(Share(

Michael(Pursey( M2(APE(Masters(Thesis( Supervisor:(T.(Piketty((
14((
Another(cause(may(be(simply(due(to(the(sampling(process.(But(assuming(our(weighting(
scheme(gives(a(reasonable(representation(of(the(overall(evolution(of(factor(shares(in(the(
Compustat(universes(of(listed(US(firms,(it(is(more(likely(the(difference(reflects(the(nature(
of(those(firms’(activities.(Indeed,(contrary(to(the(national(accounts(measures,(these(firms(
report( figures( for(EBITDA(and(staff(compensation(on(a(consolidated(basis.(This(means(
that( the( results( of( American( multinationals( with( controlling( interests( in( foreign(
subsidiaries(will(contain(results(from(activities(on(foreign(soil.(How(should(this(feature(
be(interpreted?(
There(are(several(possible(answers(of(course,(and(none(of(them(are(definitive.(However,(
it( is( important( to(note( that(while( the(evolution(of(wage( income( in( the(United(States( is(
clearly(related(to(purely(domestic(activities,(the(evolution(of(capital(income(is(not.(Thus(
the( proportion( of( multinationals’( staff( expenses( going( to( foreign( workers( impacts( US(
workers(only(indirectly(through(the(effect(of(foreign(competition(on(wages.(On(the(other(
hand,( domestic( shareholders( in( US( firms( benefit( directly( from( operating( surpluses(
earned(abroad.(This( is(reinforced(by(the( fact( that(US(corporations(are(overwhelmingly(
domestically(owned.(Despite(nearly(doubling(over(the(last(20(years,(foreign(ownership(
of( US( equities( stood( at( only( 13%( in( 2010,( with( combined( bond( and( equity( foreign(
ownership(of(16%8.(
Therefore,(while(the(impact(of(changes(in(multinationals’(internal(share(of(domestic(vs.(
foreign( labour( compensation( may( or( may( not( affect( the( evolution( of( domestic( wage(
income( shares,( changes( in( the( same( firms’( overall( factor( shares( will( almost( certainly(
affect( overall(US( income( shares.(Hence( the(higher( and( increasing( capital( share( among(
the(largest(US(corporations(relative(to(the(whole(corporate(sector(may(very(well(be(an(
important(part(of(the(reason(why(the(capital(share(of(top(earners’(income(has(increased(
markedly( since( 1980,( as( has( their( share( of( overall( income.( It( is( also( reasonable( to(
assume( that( much( of( US( top( earners’( capital,( when( not( engaged( in( entrepreneurial(
activities,(is(placed(in(large(domestic(corporates’(equity(and(bonds.(
Ideally( then,(we(would( like( to(study( the(evolution(of(domestic(vs.( foreign( labour(costs(
inside(multinationals(to(get(a(more(accurate(understanding(of(what(is(happening(within(
the( labour( share.( Unfortunately( unconsolidated( data( is( very( hard( to( find,( and( even(
aggregate(level(data(is(sparse.(The(NIPA(publishes(tables(on(international(flows(between(
US(multinationals’( domestic( and( foreign( affiliates,( but( only( extensively( so( since( 1998.(
Data(before(then(differs(on(a(yearly(basis(and(is( inconsistent(in(scope,(making(analysis(
difficult(and(time(consuming.(Nevertheless,(a( look(at(recent(developments(may(still(be(((((((((((((((((((((((((((((((((((((((((((((((((((((((((8(US(Census(2012(Statistical(abstract(

Michael(Pursey( M2(APE(Masters(Thesis( Supervisor:(T.(Piketty((
15((
informative.( The( chart( below( details( the( labour( share( in( majorityGowned( foreign(
affiliates( of( US( nonGbank( corporations( over( the( period( from( 1997( to( 2008,( using( the(
NIPA(employee(compensation(and(value(added(definitions:(
(
Source:(Author’s(calculation(based(on(NIPA(Series(
While(a(lower(level(might(have(been(expected(compared(to(the(domestic(NIPA(data(and(
Compustat( estimates,( these( figures(are( still( remarkably( low.(Bearing( in(mind( that( real(
value(added(by(the(nonGbank(foreign(affiliates(nearly(doubled(from(1997(to(2010,(this(is(
a( significant(development.(Although(direct( comparisons(are( tricky(due( to( the(different(
corporate(activity( scopes,( the(value(added(of(nonGbank(affiliates(was(17%(of( the(NIPA(
figure( for( the( entire( US( domestic( corporate( sector( in( 2010.( If( we( assume( that( all( the(
parent(US(multinationals( are(domestically( listed,( and( compare( an( estimate( for( foreign(
affiliate( EBITDA( to( the( Compustat( aggregate( EBITDA( for( 2010,( the( number( jumps( to(
35%.(From(the(point(of(view(of(employment,(the(affiliates(employed(11(million(workers(
in( 2010,( 10%( of( the( NIPA( estimates( for( the( entire( US( private( sector.( Again,( if( all( the(
parent(companies(were(listed,(foreign(affiliate(employment(would(represent(31%(of(the(
2010(aggregate(corporate(employment(according(to(Compustat(data.((
These(numbers(are( to(be( taken(with(a(pinch(of(salt(of(course,(and(not(only(because(of(
comparability( issues.( The( EBITDA( and( value( added( figures( in( particular( might( be(
misleading,(since(US(corporations(could(be(increasingly(aggressive(in(booking(operating(
surplus( in( foreign( affiliates( for( tax( purposes.( Nevertheless,( the( developments( hold(
striking(implications(for(returns(to(shareholders(and(domestic(workers.(If(the(associated(
36%(
37%(
38%(
39%(
40%(
41%(
42%(
43%(
44%(
45%(
46%(
1997( 1998( 1999( 2000( 2001( 2002( 2003( 2004( 2005( 2006( 2007( 2008(
Labour(Share(in(Value(Added:(Majority4Owned(US(Foreign(AfMiliates(
NonGBank(Labor(Share(

Michael(Pursey( M2(APE(Masters(Thesis( Supervisor:(T.(Piketty((
16((
growth(in(earnings(is(simply(to(avoid(US(tax(authorities,(it(is(also(avoiding(the(firms’(US(
employees.(
Going(back(to(the(factor(shares(measures(from(our(Compustat(factor(shares(subsample,(
another(notable(feature(is(the(higher(volatility(relative(to(the(NIPA(and(BLS,(especially(in(
the(face(of(the(most(recent(crisis.(Looking(specifically(at(upticks(in(the(labour(share,(they(
are( almost( all( associated( with( US( recessions( and( there( aftermath.( Indeed,( the( US(
economy(was( in(recession(during(6(months( in(1980,( from(mid(1981( to( late(1982,(mid(
1990( to(early(1991,(during(2001(and( from( late(2007( to(mid(2009.(So,(apart( from(a(2G
percentage( point( gain( from( 1995( to( 1996,( there( is( a( pretty( unambiguous( downward(
trend( in( the(data( since(1980,(which( is( interrupted(only(by( recessions.(That( the( labour(
share( climbs( in( recessions( is(understandable(given( that( gross(operating( surplus( is( the(
more( volatile( component( of( value( added( compared( with( relatively( stable( staff(
compensation.( The( extent( of( increases( in( labour( share( is( also( strongly( related( to( the(
severity( of( the( recessions,(which( is( even( truer( for( our(Compustat( sample( than( for( the(
aggregated(BLS(and(NIPA(data.(
While( the( higher( volatility( may( be( expected( from( using( a( smaller( sample,( the( more(
drastic(effect(of( the(crisis( is(most( likely( to(be( linked(to(our(sample’s(structure.(Using(a(
moving( average( industryGweighting( scheme( to( compensate( for( the( strong( presence( of(
banks( among( the( sample( certainly( improves( the( representativity( drastically,( as(
evidenced(by(the(raw(shares(shown(in(the(appendix.(But(the(sheer(scale(of(the(banking(
crisis(is(very(difficult(to(correct(for,(given(the(size(of(recent(losses(experienced(by(major(
players,( the( large(weight(of( the( financial(sector( in(US(value(added(over( the(period(and(
the(consolidation(of(the(sector(since(1980.(The(swing(in(factor(shares(from(the(2007(to(
2009(displayed(by(our(sample(cannot(be( ignored,(but( it(must(be(understood(in(proper(
context.(
So,( looking(at(various(measures(and( indicators( for( factor(shares(at(both(aggregate(and(
firm( level,( a( picture( emerges( of( an( increasing( capital( share( and( associated( decline( in(
labour( share( since( 1980.( This( evolution( is( particularly( true( for( the( largest( firms( in(
corporate( America,( where( the( capital( share( is( already( lower( throughout( the( period(
compared( to( the(aggregate(data.(Although( it( is(hard( to(obtain(a( clear(picture( from( the(
limited(data(available,(it(seems(that(some(of(this(difference(may(be(explained(by(the(fact(
that(firm(level(data(contains(the(foreign(value(added(of(multinationals(compared(to(the(
purely( domestic( aggregate( measures.( The( trend( appears( especially( strong( in( the( last(
decade,( as( reflected( by( the( NIPA( data( on( multinationals’( foreign( affiliates.( All( these(
observations(indicate(that(a(considerable(portion(of(increasing(top(income(shares,(which(
Michael(Pursey( M2(APE(Masters(Thesis( Supervisor:(T.(Piketty((
17((
to(a(large(extent(come(from(capital(income(at(the(very(top((0.1%)(of(the(distribution,(is(
linked(to(a(shift(in(the(share(of(value(added(away(from(labour(and(towards(capital.((
Given( that( the( contribution( of(wage( income( to( the( top( 1%( incomes( is( stable( over( the(
period( however,( this( shift( must( also( have( been( accompanied( by( increasing( wage(
inequality.(A(cursory(glance(at(the(Execucomp(data(confirms(that(top(executives(within(
these(very(same(firms(form(a(large(part(of(the(country’s(highest(wage(earners.(A(more(
detailed(analysis(is(called(for.(
4.(CEO(pay(and(labour(share(
Returning(to(the(initial(observation(that(the(recent(growth(in(inequality(has(been(driven(
by( gains( at( the( very( top( of( the( distribution( –( the( top( 1%,( 0.1%( and( 0.01%( –( it( is(
important( to(question(as( to(where(we(might(expect( such(striking(changes( to(originate(
precisely.( Indeed,( the( threshold( for(membership(of( the( top(1%(is(relatively( low(by( the(
standards(of(top(officers(in(corporate(America:($349(thousand(in(2011(income(excluding(
capital( gains9.( Even( the( threshold( for(membership( of( the( top(0.5%,( at( $508( thousand,(
might(not(be(unattainable(for(executives( in( large(firms.(To(illustrate,( fewer(than(5%(of(
all(US(corporate(executives(reported( in(Execucomp(earned( less( than($349(thousand( in(
2011(and(only(the(11%(lowest(paid(earned(less(than($508(thousand10.((
Equally(pertinently,( the( thresholds( for(membership(of( the( top(1%(and( top(0.5%(wage(
earners(are(lower(even,(at($325(thousand(and($454(thousand(respectively(in(2011.(That(
means(less(than(4%(of(executives(and(8%(of(executives(were(excluded(from(the(top(1%(
and(0.5%(wage( earners( respectively.( The( proportions( are( similar( in( the( subsample( of(
firms(reporting(staff(expenses(that(we(will(analyse(in(the(next(section,(with(only(a(couple(
of( percentage( points( more( executives( below( each( threshold11.( Tables( detailing( the(
numbers(of(executives(from(the(Forbes(&(Execucomp(samples(whose(pay(exceeded(the(
thresholds( for(membership( of( the( various( top( income( groups( as( defined( by( Piketty(&(
Saez(are(contained(in(the(appendix.(We(highlight(a(few(of(these(figures(in(the(following(
paragraphs.(
Going(further(up(the(pay(ladder,(68%(of(executives(reported(in(Execucomp(earned(more(
than( the( $1.04million( threshold( for( the( top( 0.1%( wage( incomes( in( 2011.( Exclusive(
((((((((((((((((((((((((((((((((((((((((((((((((((((((((9(Thresholds(obtained(from(Table(0,(Piketty(&(Saez((2003)(updated(data,(available(on(Emmanuel(Saez’(website.((10(869(of(8157(executives(of(US(companies(in(Execucomp(earned(less(than($508(thousand(in(2011,(and(350(executives(earned(less(than($349(thousand.(11(In(the(executive(payGstaff(expenses(matched(subGsample,(the(numbers(are(180(of(1259(executives(earning(less(than($508k(and(76(of(1259(earning(under($349k.(

Michael(Pursey( M2(APE(Masters(Thesis( Supervisor:(T.(Piketty((
18((
membership( of( top( incomes( shares( for( executives( only( begins( when( looking( at( pay(
above($4.32(million,(the(threshold(for(the(top(0.01%(wage(incomes,(for(which(only(19%(
of( executives( were( concerned.( In( terms( of( membership( numbers,( the( top( 0.01%(
consisted( of( 10,480( families( in( 2011.( Assuming( that( all( executives( are( the( only( wage(
earners( in( their( families,( 16%( of( the( top( 0.01%( in( 2011( were( executives( from( our(
Execucomp( sample.(Under( these( very( conservative( assumptions,( it( becomes( clear( that(
our(top(19%(executives(are(very(well(represented(amongst(the(top(0.01%(earners(in(the(
country.((
These( figures( having( been( obtained( with( the( most( conservative( of( assumptions,( it( is(
highly( likely( that( the( numbers( of( individuals( earning( these( levels( of( compensation( is(
much( smaller( than( 10( thousand.( It( is( therefore( probable( that( a( large( majority( of( the(
population( of( executives( whose( compensation( is( reported( in( Execucomp(will( be( very(
well(represented(amongst(the(families(at(the(highest(level(of(the(income(distribution(for(
which(we(have(data.(Computing( factor( shares( for( the(companies( these(executives( lead(
will( thus(bring(strong(clues(as( to(whether( the(bargaining(dynamic(described(earlier( is(
indeed(present:(did(the(capital(share(of(value(added(also(increase(substantially(for(these(
firms(since(1980?(
Before( investigating( the( link(between(CEO(and( the( labour( share(of( value(added,( a( few(
basic(trends(should(be(presented.(To(get(the(broadest(possible(view,(we(will(first(use(the(
widest( dataset( available,( the( combined( sources( of( the( Forbes( 800( from(1970( to( 1991(
and(Execucomp(since(1992.(Thus(we(are(able(to(say(that(in(1970(all(CEOs(in(the(Forbes(
800( every( single( one( was( among( the( top( 1%( wage( incomes( in( the( United( States12.(
Indeed,( all( but( 1( was( among( the( top( 0.5%( income( earners.( Most( CEOs( (65%)( found(
themselves( in( the( top( 0.01%( to( top( 0.01%( in( 1970.( Even( when( looking( at( the(
distribution(of( income(from(all(source((except(capital(gains)13,(88%(of(CEOs( in( the( top(
0.1%( earners( and( 27%( in( the( top( 0.01%.( We( can( therefore( say( with( certainty( that(
already(in(1970,(CEOs(of(major(companies(were(among(the(very(highest(earners(in(the(
country.(
From(1992(onwards,( the(Execucomp(data( includes( top( company(executives( as(well( as(
CEOs.(On(average(companies(reported(just(over(5(executives(in(1992.(In(this(year,(70%(
of( these( executives( were( between( the( top( 0.5%( to( 0.01%( of( the( wage( income(
distribution,(and(10%(of(executives(were(in(the(top(0.01%.(In(the(absence(of(information(((((((((((((((((((((((((((((((((((((((((((((((((((((((((12(Pay(is(total(compensation(including(bonus,(stocks,(stock(options(and(deferred(compensation.(All(references(to(top(income(shares(from(now(on(will(be(for(top(wage(incomes(excluding(capital(gains.(13(C.f.(Appendix.(

Michael(Pursey( M2(APE(Masters(Thesis( Supervisor:(T.(Piketty((
19((
on(nonGCEO(executives( from(1970,( it( is(difficult( to(say(whether( this(represents(a( large(
shift.( But( unless( the( compensation( distribution(was( especially( flat( at( board( level,( it( is(
likely(that(the(boards(as(whole(were(getting(much(better(representation(at(the(top(of(the(
income(distribution(in(1992(than(1970.(
FastGforward(to(2011(and(the(proportion(of(executives(earning(salaries(placing(them(in(
the(top(0.01%(doubled(as(mentioned(previously.(Among(CEOs(the(proportion(was(over(
40%,( a( ratio( substantially( greater( than( the( Forbes( data( from( 1970( for( a( sample( over(
twice(the(size.(Looking(again(at(the(68%(of(all(executives(were(in(the(top(0.1%(of(wage(
earners,(this(meant(that(a(large(number(had(made(the(jump(from(earning(merely(enough(
to(be( in(the(top(0.5%(in(1992(to(the(top(0.1%(by(201114.(Clearly(then,(more(and(more(
CEOs(are(receiving(salaries(placing(them(at(the(very(top(of(the(income(distribution,(and(
they(are(bringing(their(fellow(board(members(up(the(distribution(with(them.(These(facts(
alone(are(testimony(to(the(increasing(inequality(within(the(labour(share.(
Indeed(we(can(get(a(picture(of(how(the(overall(labour(share(has(evolved(with(respect(the(
bottom(99%.(Using(the(NIPA(labour(share(data(presented(earlier,(it(is(straightforward(to(
scale( the( raw(data(using(Piketty(&( Saez’( yearly(data( on( the(wage( income(distribution.(
Doing(so(shows(how(comparatively( lower(wage(earners(have(seen(their(share(of(value(
added( fall( twice( as( much( as( the( overall( labour( share.( Given( the( trends( exposed( by(
Piketty(&(Saez,(this(is(hardly(surprising.(Since(that(the(executives(whose(pay(is(included(
in(our( sample( represent(but( a( top( fraction(of( the( top(1%,(we(will( struggle( to(obtain(a(
strictly( equivalent(population( at( the(microGlevel.(Nevertheless,( a( similar( concentration(
might(be(expected(to(exist(in(the(very(top(echelon(of(listed(corporations.((
((((((((((((((((((((((((((((((((((((((((((((((((((((((((14(74%(of(the(Execucomp(executives(were(among(the(top(0.5%(wage(earners(in(1992.(

Michael(Pursey( M2(APE(Masters(Thesis( Supervisor:(T.(Piketty((
20((
(
We(now(move(to(the(sample(of(firms(from(Compustat(for(which(we(have(both(executive(
pay(data(and(overall(staff(expenses,(whose(size(varies(from(200(to(300(over(the(period(
from( 1970( to( 2011.( Computing( the( ratio( of( CEO( pay( to( overall( staff( expenses( for( the(
period,(and(adding(the(ratio(of(total(executive(pay(to(staff(expenses(from(1992(onwards,(
we(obtain(the(following(graph:(
(
Before( the( recent( crisis,( CEO( pay( had( increased( nineGfold( since( 1970( relative( to( their(
firms’( total( staff( expenses.( And( over( the( shorter( period( since( 1992,( the( proportion( of(
total(compensation(going(to(executives(had(tripled.(These(figures(are(very(much(in(line(
56.0%(
58.0%(
60.0%(
62.0%(
64.0%(
66.0%(
68.0%(
70.0%(
72.0%(
74.0%(
76.0%(
1970( 1975( 1980( 1985( 1990( 1995( 2000( 2005( 2010(
Labour(Share(in(Corporate(Business(Value(Added(&(Bottom(99%(Labour(Share((based(on(Piketty4Saez(wage(income(data)(
((Compensation(of(employees(
Compensation(of(bottom(99%(employees((estimate)(
0.00%(
0.15%(
0.30%(
0.45%(
0.60%(
0.75%(
0.90%(
1.05%(
1.20%(
1.35%(
1.50%(
1970( 1975( 1980( 1985( 1990( 1995( 2000( 2005( 2010(
Executive4CEO(share(of(Staff(Expenses(
CEO(&(Executive(Pay(vs(Staff(Expenses(
CEO(Pay/Staff(Expenses(
Executive(Pay/Staff(Expenses(

Michael(Pursey( M2(APE(Masters(Thesis( Supervisor:(T.(Piketty((
21((
with( the( evolution( of( the( overall( income( distribution.( However,( there( are( significant(
difficulties( when( directly( comparing( the( PikettyGSaez( income( distribution( figures( and(
the( firmGlevel( data.( Indeed,( the( income( distribution( figures( pertain( to( households( –(
meaning(in(many(cases(the(earnings(come(from(two(people.(Our(data(on(executive(pay(is(
at( the( individual( level.( Furthermore,( the( overall( labour( compensation( figures( used( in(
income(distribution(analyses(–(the(denominator(–(are(for(domestic(income.(At(firm(level,(
the(figure(available(to(us(is(global(payroll.(Looking(at(the(NIPA(data(for(corporate(value(
added,(employee(compensation(in(foreign(affiliates(with(US(parents(was(at(least(10%(of(
domestic(payroll( in(2010.( It( is( reasonable( to(expect( that( the( listed( firms( in(Compustat(
represent(a(large(fraction(of(US(multinationals,(making(the(ratio(of(foreign(to(domestic(
payroll( much( higher( for( our( sample.( Superimposing( the( wage( income( distribution’s(
evolution(on(the(graph(above,(these(differences(appear(clearly:(
(
The( two( trends( follow( each( other( quite( closely,( although( the( percentage( level( of(
corporations’(wage(bill(going(to(executives(is(lower(than(the(economy(as(a(whole.(These(
executives(counted(for(0.015%(to(0.030%(of(total(employees(over(the(period((0.020%(in(
2011).( At( first( glance,( one(might( expect( the( executives’( share( of( staff( expenses( to( be(
higher( than( the( countrywide(average,(both(given( their(numbers(and( the(weight(of( the(
firms(they(manage.(Furthermore,(a(larger(fraction(of(executives((20%)(working(for(firms(
that(declare(staff(expenses(earned(above(the(threshold(for(membership(of(the(top(0.01%(
wage(earners(in(the(country,(compared(to(the(wider(Execucomp(dataset.(
The(lower(level(for(top(earners’(share(of(payroll(relative(to(the(income(distribution(could(
be(explained(by(the(methodological(differences(outlined(above.(For(instance,(it(does(not(
0.00%(
0.50%(
1.00%(
1.50%(
2.00%(
2.50%(
1970( 1975( 1980( 1985( 1990( 1995( 2000( 2005( 2010(
Executive4CEO(share(of(Staff(Expenses(
CEO(&(Executive(Pay(vs(Staff(Expenses(
CEO(Pay/Staff(Expenses(
Executive(Pay/Staff(Expenses(
Top(0.01%(wage(income(share(
Michael(Pursey( M2(APE(Masters(Thesis( Supervisor:(T.(Piketty((
22((
seem(unreasonable(to(assume(that(executives(form(households(with(wellGpaid(partners,(
reconciling( the( curves( somewhat.(But( looking(at( the( composition(of(our( sample,( given(
that( these( figures( are( raw( numbers,( we( might( wonder( whether( the( oversampling( of(
financial( firms(could(also(be(at(play.( Indeed,( looking(at(anecdotal(evidence(such(as( the(
recent(requirement(in(several(countries(for(banks(to(declare(their(top(bonus(recipients,(
financial(firms(could(be(unusual(in(that(executives(are(not(always(the(highest(earners(at(
their( firms.( Thus( star( traders( and( salesmen( have( also( obtained( a( large( share( and(
increasing(share(of(staff(compensation(and(value(added.(These(other(potential(members(
of(the(top(0.01%(earners(do(not(feature(in(our(firmGlevel(executive(pay(data.(
From(the(perspective(of(our(bargaining(story,(the(role(of(these(other(top(earners(should(
also(be( significant.( Indeed,( the( share(of( capital( in(value(added( increased(even(more( in(
the( financial( sector( than( in( the( whole( economy( over( the( last( 30( years.( Hence( the(
difference( between( the( raw( and( weighted( factor( share( graphs( computed( over( the(
Compustat( staff( expenses( sample( as( reported( in( the( appendix.( Workers( with( direct(
influence(on(the(relative(increase(in(capital(income,(whether(in(management(or(directly(
reporting( to( management,( are( well( placed( to( capture( a( share( of( the( increase( at( the(
expense( of( colleagues( further( down( the( production( chain.( Again,( investors( may( not(
worry( too(much(about( the(size(of( the(piece( taken(out(by(high(earners(as( long(as( their(
slice(of(the(pie(is(increasing(even(more.(((((((((((
To( be( sure( that( firms’( top( earners( in( our( sample,( such( as( executives( and( CEOs,( are(
gaining(at(the(expense(of( the(rest(of( their(colleagues,(we(must(show(that( income(gains(
are(disproportionate(at(the(top.(Looking(at(the(evolution(of(average(wages(and(executive(
compensation(for(the(sample,(this(becomes(obvious:(

Michael(Pursey( M2(APE(Masters(Thesis( Supervisor:(T.(Piketty((
23((
(
There(are(several(points(of(notes.(First(of(all,(mean(real(wages(in(the(sample(have(been(
relatively(stagnant,(with(gains(of(less(than(25%(from(1980(to(2011.(Second(and(baring(in(
mind( the( sample( effects( of( switching( from( the( Forbes( data( to( the( larger( Execucomp(
sample( in(1992,( the( rate(of( growth(of(CEO(pay(was( increasing( for(much(of( the(period(
from(1980(to(the(peak(just(before(the(crisis.(The(picture(also(shows(that(mean(CEO(pay(
increased( faster( than( mean( executive( pay,( thus( income( concentration( amongst( top(
earners(does(not(end(at(board(level.(
Another( way( of( looking( at( this( picture( would( be( to( look( the( evolution( between( top(
officers’( share( in( payroll( relative( to( everyone( else.( Given( that(we( only( have( access( to(
executive(pay(data(from(1992(and(bearing(in(mind(the(pay(inequality(increase(occurring(
even(at(board(level,(we(shall(restrict(ourselves(to(CEOs’(share(relative(to(the(rest(of(staff.(
This( also( has( the( advantage( that( while( fluctuating( slightly,( the( number( of( CEOs( per(
employee( in( our( sample( is( pretty( steady( over( the( period,( generally( hovering( around(
0.004%.(The(following(graph(thus(roughly(represents(the(top(0.004%(vs.(99.996%(wage(
earners( in(our(sample.(Although( the(share( taken(by( the(CEO( is(small,( it( is( surprisingly(
large(given(the(tiny(number(of(CEOs.(It(has(also(increased(remarkably(over(the(20(years(
especially,(even(accounting(for(the(effect(from(changing(data(sources(in(1992.(
(500((((
(1,500((((
(2,500((((
(3,500((((
(4,500((((
(5,500((((
(6,500((((
(7,500((((
(8,500((((
(9,500((((
(50,000((((
(100,000((((
(150,000((((
(200,000((((
(250,000((((
(300,000((((
(350,000((((
(400,000((((
(450,000((((
(500,000((((
1970( 1975( 1980( 1985( 1990( 1995( 2000( 2005( 2010(
Mean(Executive(Pay(($,(thousands)(
Staff(Expense(per(Employee(($)(
Employee(&(CEO(mean(expense(
Staff(Expense/Employee((2011($)(Mean(CEO(Pay((2011($)(
Mean(Executive(Pay((2011($)(

Michael(Pursey( M2(APE(Masters(Thesis( Supervisor:(T.(Piketty((
24((
(
The( anecdotal( evidence( that( CEOs( may( be( bargaining( for( larger( shares( of( staff(
compensation( is( therefore( strong.( But( is( CEO( pay( directly,( at( firm( level,( related( to(
increases(in(the(capital(share?(Looking(at(the(sample(of(firms(for(which(we(have(CEO(pay(
and(are(able(to(compute(factor(shares,(there(is(a(clear(relationship(between(increasing(
mean(CEO(pay(and(decreasing(labour(share.(One(must(continue(to(bear(in(mind(the(jump(
in(1992(which(is(due(to(switching(from(Forbes(to(Execucomp(data(for(CEO(pay,(but(this(
doesn’t(detract(from(the(correlation.((
(
0.00%(
0.20%(
0.40%(
0.60%(
0.80%(
1.00%(
99.00%(
99.20%(
99.40%(
99.60%(
99.80%(
100.00%(
1970( 1975( 1980( 1985( 1990( 1995( 2000( 2005( 2010(
CEO(Share(
Rest(of(Staff(Share(
CEO(Shares(in(Compensations(vs(Rest(of(Staff(
Rest(of(Staff(Share(in(Staff(Expenses(CEO(Pay(Share(in(Staff(Expenses(
(G((((
(2,000((((
(4,000((((
(6,000((((
(8,000((((
(10,000((((
(12,000((((
0%(
10%(
20%(
30%(
40%(
50%(
60%(
70%(
1970( 1975( 1980( 1985( 1990( 1995( 2000( 2005( 2010(
CEO(Pay((2011,(k$)(
Labor(Share(
CEO(Pay(vs(Labor(Share(in(Staff(Expenses(Sample(
Staff(expenses/Value(Added(
Mean(CEO(Pay((2011($)(
Michael(Pursey( M2(APE(Masters(Thesis( Supervisor:(T.(Piketty((
25((
Although(the(correlation(is(suggestive,(by(itself(this(graph(does(not(imply(any(bargaining(
effect(along(the(lines(discussed.(Indeed,(it(may(be(simply(the(result(of(CEO(pay(becoming(
better( aligned(with( investors’( income,( i.e.( the( capital( share.( In(which( case,( bargaining(
may( be( a( factor,( but( it( is( not( clear( that( CEOs( are( paid(more(when( they( decrease( the(
labour(share.(However,(a(simple(check(would(be(to(see(if(those(CEOs(that(are(better(paid(
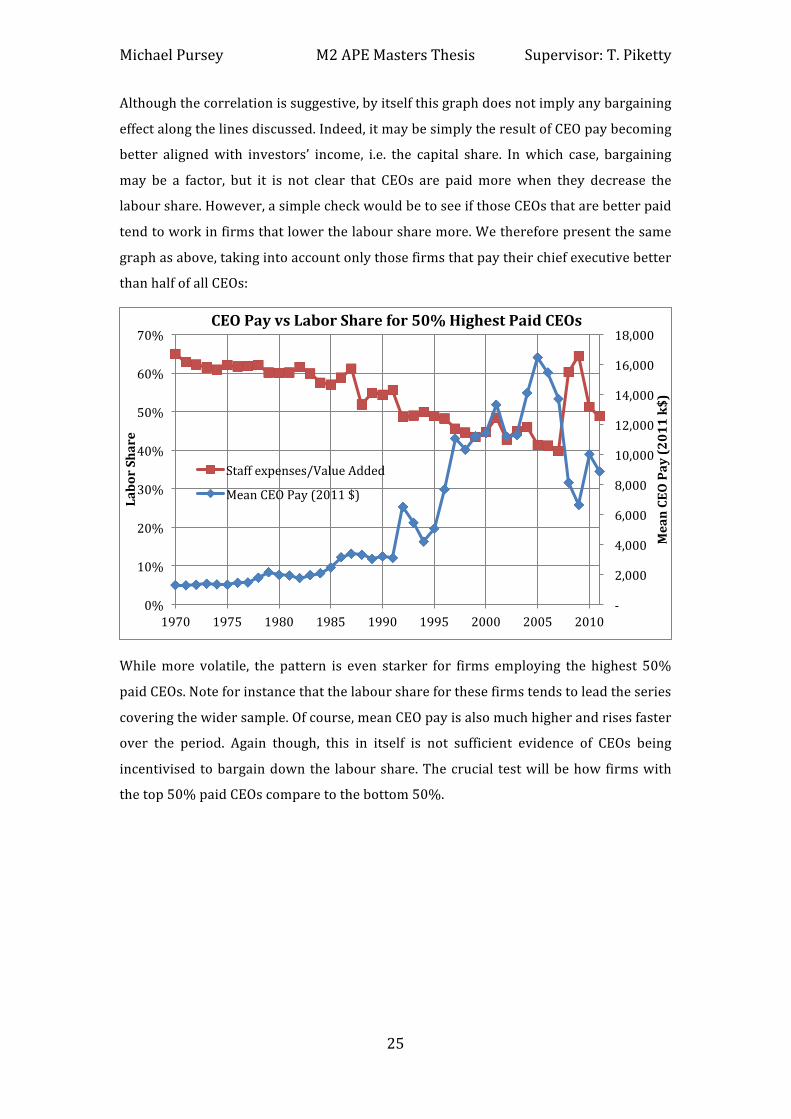
tend(to(work(in(firms(that(lower(the(labour(share(more.(We(therefore(present(the(same(
graph(as(above,(taking(into(account(only(those(firms(that(pay(their(chief(executive(better(
than(half(of(all(CEOs:((
(
While(more( volatile,( the( pattern( is( even( starker( for( firms( employing( the( highest( 50%(
paid(CEOs.(Note(for(instance(that(the(labour(share(for(these(firms(tends(to(lead(the(series(
covering(the(wider(sample.(Of(course,(mean(CEO(pay(is(also(much(higher(and(rises(faster(
over( the( period.( Again( though,( this( in( itself( is( not( sufficient( evidence( of( CEOs( being(
incentivised(to(bargain(down(the( labour(share.(The(crucial( test(will(be(how(firms(with(
the(top(50%(paid(CEOs(compare(to(the(bottom(50%.((
(G((((
(2,000((((
(4,000((((
(6,000((((
(8,000((((
(10,000((((
(12,000((((
(14,000((((
(16,000((((
(18,000((((
0%(
10%(
20%(
30%(
40%(
50%(
60%(
70%(
1970( 1975( 1980( 1985( 1990( 1995( 2000( 2005( 2010(
Mean(CEO(Pay((2011(k$)(
Labor(Share(
CEO(Pay(vs(Labor(Share(for(50%(Highest(Paid(CEOs((
Staff(expenses/Value(Added(
Mean(CEO(Pay((2011($)(

Michael(Pursey( M2(APE(Masters(Thesis( Supervisor:(T.(Piketty((
26((
((((
While(CEO(pay(for(the(bottom(50%(of(the(sample(still(rises(considerably(over(the(period,(
the( labour( share( does( not( show( the( same( negative( trend( as( in( the( top( ranked( CEO(
sample.( In( fact,( it( actually( seems( positively( correlated( in( some( portions( of( the( graph.(
Without(going(so(far(as(to(suggest(that(bargaining(effects(run(the(other(way(for(lesserG
paid( CEOs,( the( lack( of( discernable( pattern( is( very( much( in( line( with( what( we( might(
expect(if(CEOs(were(incentivised(to(lower(the(labour(share.(There(is(also(clear(evidence(
of(CEOs(capturing(a(larger(part(of(the(capital(share(in(all(the(samples(presented,(so(there(
are(likely(to(be(several(bargaining(games(going(on.(((
Another(way(of( testing(whether(our(hypothesis(holds(would(be(to(regress(CEO(pay(on(
companies’(labour(share(in(value(added.(It(will(be(important(to(controlling(for(indicators(
strongly(correlated(with(CEO(pay,(such(as(market(capitalisation,(CEO(age(and(tenure(and(
firm(size( in( the( form(of(revenues,(as(well(as( industry,(crucially.( In( the(spirit(of(Piketty,(
Saez(&(Stantcheva((2013),(as(well(as(running(the(regression(on(the(full(sample,(we(will(
split( the( sample( into( two( periods:( high( and( low( tax( periods.( Should( the( coefficients(
prove(significantly(different,(it(would(indicate(that(CEOs(potential(bargaining(efforts(are(
elastic(to(tax(cuts.(
The( main( result,( as( detailed( in( the( appendix,( shows( that( there( is( indeed( a( strong(
difference( between( the( coefficients( on( firm( level( labour( share( in( a( low( and( high( tax(
environment.(The(coefficient(is(significant(in(the(low(tax(environment,(but(insignificant(
or( weakly( significant( in( the( high( tax( environment,( with( the( result( robust( to( controls.(
Importantly,(the(sign(of(the(effect(is(as(expected,(with(reductions(in(the(employee(share(
(G((((
(200((((
(400((((
(600((((
(800((((
(1,000((((
(1,200((((
(1,400((((
(1,600((((
(1,800((((
(2,000((((
0%(
10%(
20%(
30%(
40%(
50%(
60%(
70%(
1970( 1975( 1980( 1985( 1990( 1995( 2000( 2005( 2010(
Mean(CEO(Pay((2011,(k$)(
Labor(Share(
CEO(Pay(vs(Labor(Share(for(50%(Lowest(Paid(CEOs((
Staff(expenses/Value(Added(Mean(CEO(Pay((2011($)(

Michael(Pursey( M2(APE(Masters(Thesis( Supervisor:(T.(Piketty((
27((
in( value( added( associated(with( an( increase( in( CEO( pay.( However,( the( yearly( effect( is(
quite(small,(with(a(1(percentageGpoint(fall(in(labour(share(accompanying(a($3(thousand(
pay(increase.((
Furthermore,( the(causality(of( the(relationship( is(debatable,(since(CEOs(may(be(earning(
more(due(to(an(increase(in(capital(income(that(only(incidentally(lowers(the(labour(share.(
It( might( therefore( be( that( the( bargaining( incentives( are( not( entirely( linked( to(
competition( with( other( firms( to( increase( the( capital( share.( Plausibly,( there( are( other(
necessary( conditions( for( CEOs( to( exploit( all( their( bargaining( channels,( such( as( poor(
corporate(governance(for(instance.(Thus(if(a(board(isn’t(held(accountable(to(its(investors,(
it( might( not( be( held( accountable( to( its( employees( either.( There( are( almost( certainly(
complex( interactions( with( other( institutions( as( well,( such( as( trade( unions( and(
liberalisation.( Nevertheless,( added( to( the( evidence( surveyed( previously,( it( is( hard( to(
reject(the(hypothesis(that(CEO(bargaining(is(associated(with(lower(factor(shares.(
5.(Conclusion(
This( paper( provides( a( variety( of( evidence( for( the( link( between( simultaneously( rising(
capital(shares(in(value(added(and(top(shares(in(labour(income.(While(the(data(surveyed(
is( imperfect( and( on( an( individual( basis( may( be( inconclusive,( the( entire( set( provides(
compelling(evidence(that(increasing(capital(shares(in(the(United(States(over(the(last(30(
years( are( strongly( linked( with( increasing( top( labour( shares.( Specifically,( CEOs( and(
executives,( who( have( a( strong( role( in( bargaining( with( workers( for( both( the( share( of(
value(added(and(the(distribution(of(the(labour(share,(are(increasing(their(income(shares(
proportionally( with( the( very( highest( income( earners( in( the( country.( The( role( of(
multinationals( is( especially( compelling,( since( factor( shares( in( foreign( affiliates( of( US(
parent( companies( exhibit( sharply( lower( levels( than( domestic( shares.( Given( the(
ownership( of( US( firms( is( still( very( domestic,( gains( in( value( added( from( off( shoring(
invariably(go(to(capital(owners.(
Furthermore,( although( we( were( able( to( correct( some( of( the( bias( linked( to( the( large(
presence( of( banks( among( firms( reporting( staff( expenses,( the( story( this( paper( tells( is(
inevitably( linked( to( developments( in( financial( institutions.( Indeed,( the( exceptional(
growth(of(the(sector(over(the(last(30(years(leading(up(to(the(current(crisis(made(finance(
a(large(diver(of(profit(growth,(reaching(a(peak(of(nearly(30%(of(all(US(corporate(profits(
early(in(the(last(decade.(This,(combined(with(the(capital(structure(of(banks(and(spill(over(
effects,( may( mean( that( much( of( the( rising( inequality( and( decline( in( factor( shares( is(

Michael(Pursey( M2(APE(Masters(Thesis( Supervisor:(T.(Piketty((
28((
intricately(linked(to(the(rise(of(finance.(Identifying(causality(is(a(challenge(here,(and(the(
crisis(may(lead(to(a(return(to(more(modestly(sized(sector,(blurring(the(picture.(
There(is(much(more(work(to(be(done(on(investigating(the(evolutions(of(factor(shares(and(
firmGlevel(income(distributions.(It(is(especially(important(to(compare(evolutions(in(other(
countries( to( the( US( case( outlined( here,( since( the( extent( to( which( the( changes( reflect(
globalization(is(not(entirely(clear.(Further(international(comparisons(would(also(help(in(
understanding( how( much( changes( in( taxation( are( behind( the( joint( decline( of( labour(
shares( and( rising( income( inequality.( Whichever( of( these( aspects( best( represents( the(
underlying(mechanisms( at(work,( it( is( likely( that( bargaining( plays( a( strong( role( in( the(
wider(dynamic.(

Michael(Pursey( M2(APE(Masters(Thesis( Supervisor:(T.(Piketty((
29((
Appendix(
(
(
0%
5%
10%
15%
20%
25%
1913
1918
1923
1928
1933
1938
1943
1948
1953
1958
1963
1968
1973
1978
1983
1988
1993
1998
2003
2008
Top
1% In
com
e S
hare
!!!
Top 1% US Pre-Tax Income Share, 1913-2011
Source: Piketty and Saez, 2003 updated to 2011. Series based on pre-tax cash market income including realized capital gains and excluding government transfers.
(G((((((
(1,000((((
(2,000((((
(3,000((((
(4,000((((
(5,000((((
(6,000((((
(7,000((((
(8,000((((
1960( 1965( 1970( 1975( 1980( 1985( 1990( 1995( 2000( 2005( 2010(
Sample(Sizes(Full(Compustat(Sample(Observations(Compustat(Staff(Expense(Sample(Observations(CEO(Pay(&(Staff(Expense(Sample(Observations(
Michael(Pursey( M2(APE(Masters(Thesis( Supervisor:(T.(Piketty((
30((
(
(
(
(
(
(
(
(
(
0(
200(
400(
600(
800(
1000(
1200(
1400(
1600(
1960( 1965( 1970( 1975( 1980( 1985( 1990( 1995( 2000( 2005( 2010(
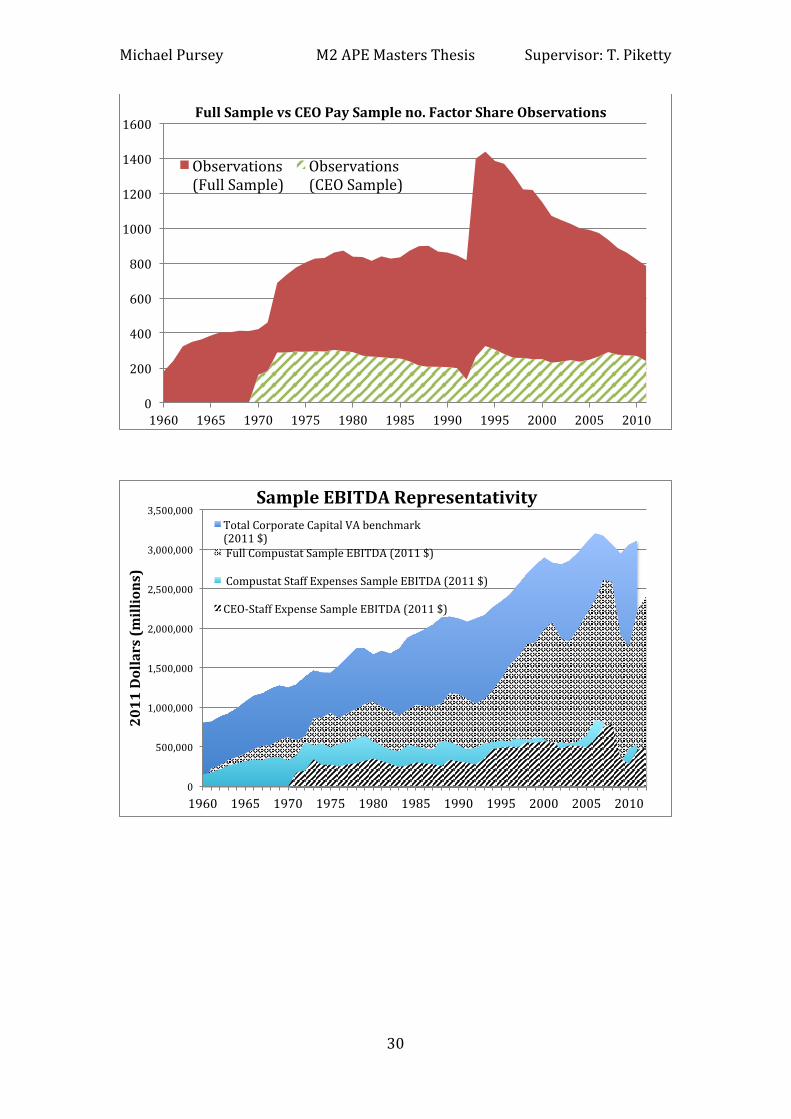
Full(Sample(vs(CEO(Pay(Sample(no.(Factor(Share(Observations(
Observations((Full(Sample)(
Observations((CEO(Sample)(
0(
500,000(
1,000,000(
1,500,000(
2,000,000(
2,500,000(
3,000,000(
3,500,000(
1960( 1965( 1970( 1975( 1980( 1985( 1990( 1995( 2000( 2005( 2010(
2011(Dollars((m
illions)(
Sample(EBITDA(Representativity(Total(Corporate(Capital(VA(benchmark((2011($)((Full(Compustat(Sample(EBITDA((2011($)(
(Compustat(Staff(Expenses(Sample(EBITDA((2011($)(
CEOGStaff(Expense(Sample(EBITDA((2011($)(
Michael(Pursey( M2(APE(Masters(Thesis( Supervisor:(T.(Piketty((
31((
(
(
(
(
30.0%(
35.0%(
40.0%(
45.0%(
50.0%(
55.0%(
60.0%(
65.0%(
70.0%(
1970( 1975( 1980( 1985( 1990( 1995( 2000( 2005( 2010(
Compustat(Factor(Shares((Industry(Weighted)(
Labor(Share(
Capital(Share(
35%(
40%(
45%(
50%(
55%(
60%(
65%(
1970( 1975( 1980( 1985( 1990( 1995( 2000( 2005( 2010(
Compustat(unweighted(factor(shares((
Total(Labor(Share(Total(Capital(Share(

Michael(Pursey( M2(APE(Masters(Thesis( Supervisor:(T.(Piketty(
(
32(
(
CEO(Top(Income(Group(Membership(for(Combined(Forbes(&(Execucomp(Data(
!! CEO!Pay!Above!Threshold!for!Top!Income!Group!(excl.!K!gains)!
Fiscal!Year!
N°!CEOs!in!Sample!
N°!CEOs!in!Top!1%!
%!CEOs!in!Top!1%!
N°!CEOs!in!Top!0.5%!
%!CEOs!in!Top!0.5%!
N°!CEOs!in!Top!0.1%!
%!CEOs!in!Top!0.1%!
N°!CEOs!in!Top!0.01%!
%!CEOs!in!Top!0.01%!
1970% 723! 722% 100%$ 718% 99%$ 636% 88%$ 196% 27%$1971% 766! 764% 100%$ 762% 99%$ 675% 88%$ 237% 31%$1972% 836! 832% 100%$ 829% 99%$ 739% 88%$ 302% 36%$1973% 829! 824% 99%$ 814% 98%$ 716% 86%$ 278% 34%$1974% 814! 813% 100%$ 801% 98%$ 662% 81%$ 206% 25%$1975% 803! 802% 100%$ 798% 99%$ 694% 86%$ 234% 29%$1976% 777! 776% 100%$ 776% 100%$ 684% 88%$ 269% 35%$1977% 778! 777% 100%$ 775% 100%$ 697% 90%$ 293% 38%$1978% 796! 796% 100%$ 796% 100%$ 727% 91%$ 320% 40%$1979% 795! 795% 100%$ 793% 100%$ 726% 91%$ 414% 52%$1980% 808! 808% 100%$ 805% 100%$ 740% 92%$ 341% 42%$1981% 787! 787% 100%$ 785% 100%$ 722% 92%$ 366% 47%$1982% 797! 797% 100%$ 796% 100%$ 730% 92%$ 267% 34%$1983% 791! 791% 100%$ 790% 100%$ 733% 93%$ 231% 29%$1984% 766! 765% 100%$ 764% 100%$ 713% 93%$ 199% 26%$1985% 766! 766% 100%$ 764% 100%$ 702% 92%$ 243% 32%$1986% 769! 769% 100%$ 767% 100%$ 731% 95%$ 295% 38%$1987% 765! 764% 100%$ 763% 100%$ 674% 88%$ 198% 26%$1988% 741! 739% 100%$ 735% 99%$ 590% 80%$ 98% 13%$1989% 784! 760% 97%$ 754% 96%$ 602% 77%$ 134% 17%$1990% 785! 773% 98%$ 768% 98%$ 605% 77%$ 162% 21%$1991% 752! 739% 98%$ 737% 98%$ 628% 84%$ 163% 22%$
(
( (

Michael(Pursey( M2(APE(Masters(Thesis( Supervisor:(T.(Piketty(
(
33(
(
!! CEO!Pay!Above!Threshold!for!Top!Income!Group!(excl.!K!gains)!cont.!
Fiscal!Year!
N°!CEOs!in!Sample!
N°!CEOs!in!Top!1%!
%!CEOs!in!Top!1%!
N°!CEOs!in!Top!0.5%!
%!CEOs!in!Top!0.5%!
N°!CEOs!in!Top!0.1%!
%!CEOs!in!Top!0.1%!
N°!CEOs!in!Top!0.01%!
%!CEOs!in!Top!0.01%!
1992% 433! 429% 99%$ 421% 97%$ 356% 82%$ 124% 29%$1993% 1157! 1150% 99%$ 1137% 98%$ 914% 79%$ 292% 25%$1994% 1551! 1531% 99%$ 1500% 97%$ 1123% 72%$ 296% 19%$1995% 1600! 1574% 98%$ 1534% 96%$ 1143% 71%$ 331% 21%$1996% 1651! 1620% 98%$ 1578% 96%$ 1130% 68%$ 336% 20%$1997% 1674! 1633% 98%$ 1579% 94%$ 1147% 69%$ 380% 23%$1998% 1731! 1688% 98%$ 1621% 94%$ 1153% 67%$ 354% 20%$1999% 1811! 1745% 96%$ 1656% 91%$ 1144% 63%$ 342% 19%$2000% 1792! 1736% 97%$ 1657% 92%$ 1122% 63%$ 355% 20%$2001% 1671! 1618% 97%$ 1536% 92%$ 1056% 63%$ 338% 20%$2002% 1675! 1618% 97%$ 1561% 93%$ 1134% 68%$ 394% 24%$2003% 1742! 1700% 98%$ 1653% 95%$ 1249% 72%$ 463% 27%$2004% 1752! 1722% 98%$ 1677% 96%$ 1329% 76%$ 517% 30%$2005% 1753! 1715% 98%$ 1662% 95%$ 1312% 75%$ 493% 28%$2006% 1867! 1821% 98%$ 1769% 95%$ 1376% 74%$ 534% 29%$2007% 2055! 1993% 97%$ 1917% 93%$ 1466% 71%$ 561% 27%$2008% 1974! 1908% 97%$ 1846% 94%$ 1390% 70%$ 439% 22%$2009% 1909! 1860% 97%$ 1805% 95%$ 1444% 76%$ 468% 25%$2010% 1856! 1818% 98%$ 1783% 96%$ 1530% 82%$ 582% 31%$2011% 1632! 1603% 98%$ 1575% 97%$ 1392% 85%$ 577% 35%$
Source:(Author’s(Calculation(based(on(Forbes((before(1992),(Execucomp((from(1992)(and(Piketty(&(Saez((2003,(updated)(( (
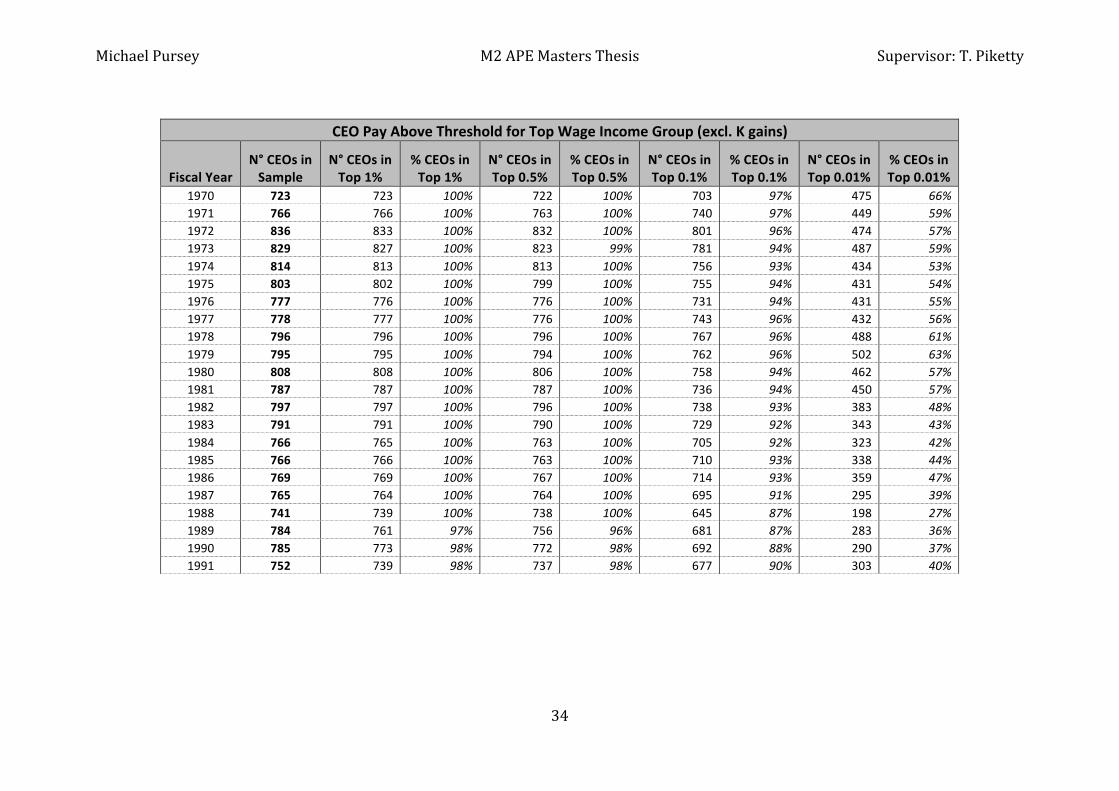
Michael(Pursey( M2(APE(Masters(Thesis( Supervisor:(T.(Piketty(
(
34(
(
CEO!Pay!Above!Threshold!for!Top!Wage!Income!Group!(excl.!K!gains)!
Fiscal!Year!N°!CEOs!in!Sample!
N°!CEOs!in!Top!1%!
%!CEOs!in!Top!1%!
N°!CEOs!in!Top!0.5%!
%!CEOs!in!Top!0.5%!
N°!CEOs!in!Top!0.1%!
%!CEOs!in!Top!0.1%!
N°!CEOs!in!Top!0.01%!
%!CEOs!in!Top!0.01%!
1970% 723! 723% 100%$ 722% 100%$ 703% 97%$ 475% 66%$1971% 766! 766% 100%$ 763% 100%$ 740% 97%$ 449% 59%$1972% 836! 833% 100%$ 832% 100%$ 801% 96%$ 474% 57%$1973% 829! 827% 100%$ 823% 99%$ 781% 94%$ 487% 59%$1974% 814! 813% 100%$ 813% 100%$ 756% 93%$ 434% 53%$1975% 803! 802% 100%$ 799% 100%$ 755% 94%$ 431% 54%$1976% 777! 776% 100%$ 776% 100%$ 731% 94%$ 431% 55%$1977% 778! 777% 100%$ 776% 100%$ 743% 96%$ 432% 56%$1978% 796! 796% 100%$ 796% 100%$ 767% 96%$ 488% 61%$1979% 795! 795% 100%$ 794% 100%$ 762% 96%$ 502% 63%$1980% 808! 808% 100%$ 806% 100%$ 758% 94%$ 462% 57%$1981% 787! 787% 100%$ 787% 100%$ 736% 94%$ 450% 57%$1982% 797! 797% 100%$ 796% 100%$ 738% 93%$ 383% 48%$1983% 791! 791% 100%$ 790% 100%$ 729% 92%$ 343% 43%$1984% 766! 765% 100%$ 763% 100%$ 705% 92%$ 323% 42%$1985% 766! 766% 100%$ 763% 100%$ 710% 93%$ 338% 44%$1986% 769! 769% 100%$ 767% 100%$ 714% 93%$ 359% 47%$1987% 765! 764% 100%$ 764% 100%$ 695% 91%$ 295% 39%$1988% 741! 739% 100%$ 738% 100%$ 645% 87%$ 198% 27%$1989% 784! 761% 97%$ 756% 96%$ 681% 87%$ 283% 36%$1990% 785! 773% 98%$ 772% 98%$ 692% 88%$ 290% 37%$1991% 752! 739% 98%$ 737% 98%$ 677% 90%$ 303% 40%$
(( (

Michael(Pursey( M2(APE(Masters(Thesis( Supervisor:(T.(Piketty(
(
35(
(
CEO!Pay!Above!Threshold!for!Top!Wage!Income!Group!(excl.!K!gains)!cont.!
Fiscal!Year!N°!CEOs!in!Sample!
N°!CEOs!in!Top!1%!
%!CEOs!in!Top!1%!
N°!CEOs!in!Top!0.5%!
%!CEOs!in!Top!0.5%!
N°!CEOs!in!Top!0.1%!
%!CEOs!in!Top!0.1%!
N°!CEOs!in!Top!0.01%!
%!CEOs!in!Top!0.01%!
1992% 433! 430% 99%$ 425% 98%$ 380% 88%$ 192% 44%$1993% 1157! 1153% 100%$ 1141% 99%$ 975% 84%$ 413% 36%$1994% 1551! 1538% 99%$ 1516% 98%$ 1256% 81%$ 498% 32%$1995% 1600! 1579% 99%$ 1552% 97%$ 1277% 80%$ 507% 32%$1996% 1651! 1627% 99%$ 1598% 97%$ 1318% 80%$ 524% 32%$1997% 1674! 1642% 98%$ 1613% 96%$ 1321% 79%$ 557% 33%$1998% 1731! 1700% 98%$ 1658% 96%$ 1332% 77%$ 514% 30%$1999% 1811! 1764% 97%$ 1716% 95%$ 1344% 74%$ 447% 25%$2000% 1792! 1745% 97%$ 1699% 95%$ 1294% 72%$ 429% 24%$2001% 1671! 1629% 97%$ 1591% 95%$ 1234% 74%$ 456% 27%$2002% 1675! 1629% 97%$ 1592% 95%$ 1286% 77%$ 509% 30%$2003% 1742! 1711% 98%$ 1677% 96%$ 1395% 80%$ 608% 35%$2004% 1752! 1730% 99%$ 1698% 97%$ 1455% 83%$ 670% 38%$2005% 1753! 1724% 98%$ 1695% 97%$ 1456% 83%$ 690% 39%$2006% 1867! 1833% 98%$ 1804% 97%$ 1552% 83%$ 744% 40%$2007% 2055! 2004% 98%$ 1958% 95%$ 1644% 80%$ 749% 36%$2008% 1974! 1919% 97%$ 1878% 95%$ 1591% 81%$ 656% 33%$2009% 1909! 1867% 98%$ 1835% 96%$ 1596% 84%$ 696% 36%$2010% 1856! 1824% 98%$ 1799% 97%$ 1643% 89%$ 813% 44%$2011% 1632! 1604% 98%$ 1588% 97%$ 1462% 90%$ 790% 48%$
Source:(Author’s(Calculation(based(on(Forbes((before(1992),(Execucomp((from(1992)(and(Piketty(&(Saez((2003,(updated)(
( (

Michael(Pursey( M2(APE(Masters(Thesis( Supervisor:(T.(Piketty(
(
36(
(
Executive(Top(Income(Group(Membership(for(Execucomp(Data(
!! Executive!Pay!Above!Threshold!for!Top!Income!Group!(excl.!K!gains)!
Fiscal!Year!
N°!Executives!in!Sample!
N°!Executives!in!Top!1%!
%!Executives!in!Top!1%!
N°!Executives!in!Top!0.5%!
%!Executives!in!Top!0.5%!
N°!Executives!in!Top!0.1%!
%!Executives!in!Top!0.1%!
N°!Executives!in!Top!0.01%!
%!Executives!in!Top!0.01%!
1992% 8045! 7104% 88%$ 5932% 74%$ 2860% 36%$ 517% 6%$1993% 9821! 8780% 89%$ 7573% 77%$ 3805% 39%$ 704% 7%$1994% 10689! 9444% 88%$ 8046% 75%$ 3934% 37%$ 643% 6%$1995% 11147! 9742% 87%$ 8275% 74%$ 4163% 37%$ 767% 7%$1996% 11696! 10111% 86%$ 8459% 72%$ 4113% 35%$ 816% 7%$1997% 12063! 10419% 86%$ 8663% 72%$ 4191% 35%$ 966% 8%$1998% 12656! 10561% 83%$ 8701% 69%$ 4202% 33%$ 920% 7%$1999% 12214! 10266% 84%$ 8430% 69%$ 3953% 32%$ 940% 8%$2000% 11542! 9806% 85%$ 8136% 70%$ 3998% 35%$ 1056% 9%$2001% 11384! 9680% 85%$ 8015% 70%$ 3784% 33%$ 854% 8%$2002% 11559! 10074% 87%$ 8491% 73%$ 4154% 36%$ 904% 8%$2003% 11817! 10506% 89%$ 9070% 77%$ 4819% 41%$ 1103% 9%$2004% 10904! 9984% 92%$ 8922% 82%$ 5071% 47%$ 1163% 11%$2005% 9388! 8689% 93%$ 7834% 83%$ 4599% 49%$ 1044% 11%$2006% 10965! 9718% 89%$ 8538% 78%$ 4949% 45%$ 1138% 10%$2007% 11806! 10387% 88%$ 9082% 77%$ 5164% 44%$ 1212% 10%$2008% 11263! 9936% 88%$ 8662% 77%$ 4490% 40%$ 817% 7%$2009% 10598! 9606% 91%$ 8571% 81%$ 4793% 45%$ 850% 8%$2010% 10000! 9372% 94%$ 8674% 87%$ 5397% 54%$ 1087% 11%$2011% 8561! 8180% 96%$ 7653% 89%$ 5006% 58%$ 1072% 13%$
(Source:(Author’s(Calculation(based(on(Execucomp(and(Piketty(&(Saez((2003,(updated)(
( (

Michael(Pursey( M2(APE(Masters(Thesis( Supervisor:(T.(Piketty(
(
37(
(
!! !! Executive!Pay!Above!Threshold!for!Top!Wage!Income!Group!(excl.!K!gains)!
Fiscal!Year!
N°!Executives!in!Sample!
N°!Executives!in!Top!1%!
%!Executives!in!Top!1%!
N°!Executives!in!Top!0.5%!
%!Executives!in!Top!0.5%!
N°!Executives!in!Top!0.1%!
%!Executives!in!Top!0.1%!
N°!Executives!in!Top!0.01%!
%!Executives!in!Top!0.01%!
1992% 8045! 7337% 91%$ 6404% 80%$ 3442% 43%$ 837% 10%$1993% 9821! 9035% 92%$ 7997% 81%$ 4483% 46%$ 1125% 11%$1994% 10689! 9761% 91%$ 8589% 80%$ 4955% 46%$ 1241% 12%$1995% 11147! 10111% 91%$ 8849% 79%$ 5088% 46%$ 1337% 12%$1996% 11696! 10562% 90%$ 9231% 79%$ 5363% 46%$ 1445% 12%$1997% 12063! 10840% 90%$ 9524% 79%$ 5447% 45%$ 1559% 13%$1998% 12656! 11203% 89%$ 9645% 76%$ 5418% 43%$ 1413% 11%$1999% 12214! 10847% 89%$ 9445% 77%$ 5245% 43%$ 1257% 10%$2000% 11542! 10326% 89%$ 8975% 78%$ 5010% 43%$ 1312% 11%$2001% 11384! 10149% 89%$ 8786% 77%$ 4874% 43%$ 1198% 11%$2002% 11559! 10417% 90%$ 9151% 79%$ 5255% 45%$ 1254% 11%$2003% 11817! 10765% 91%$ 9581% 81%$ 5860% 50%$ 1571% 13%$2004% 10904! 10235% 94%$ 9382% 86%$ 6088% 56%$ 1686% 15%$2005% 9388! 8902% 95%$ 8303% 88%$ 5651% 60%$ 1679% 18%$2006% 10965! 10086% 92%$ 9187% 84%$ 6281% 57%$ 1811% 17%$2007% 11806! 10747% 91%$ 9733% 82%$ 6439% 55%$ 1772% 15%$2008% 11263! 10291% 91%$ 9342% 83%$ 5897% 52%$ 1360% 12%$2009% 10598! 9805% 93%$ 9001% 85%$ 5960% 56%$ 1418% 13%$2010% 10000! 9498% 95%$ 8932% 89%$ 6379% 64%$ 1690% 17%$2011% 8561! 8233% 96%$ 7849% 92%$ 5849% 68%$ 1668% 19%$
(Source:(Author’s(Calculation(based(on(Execucomp(and(Piketty(&(Saez((2003,(updated)(
(
( (
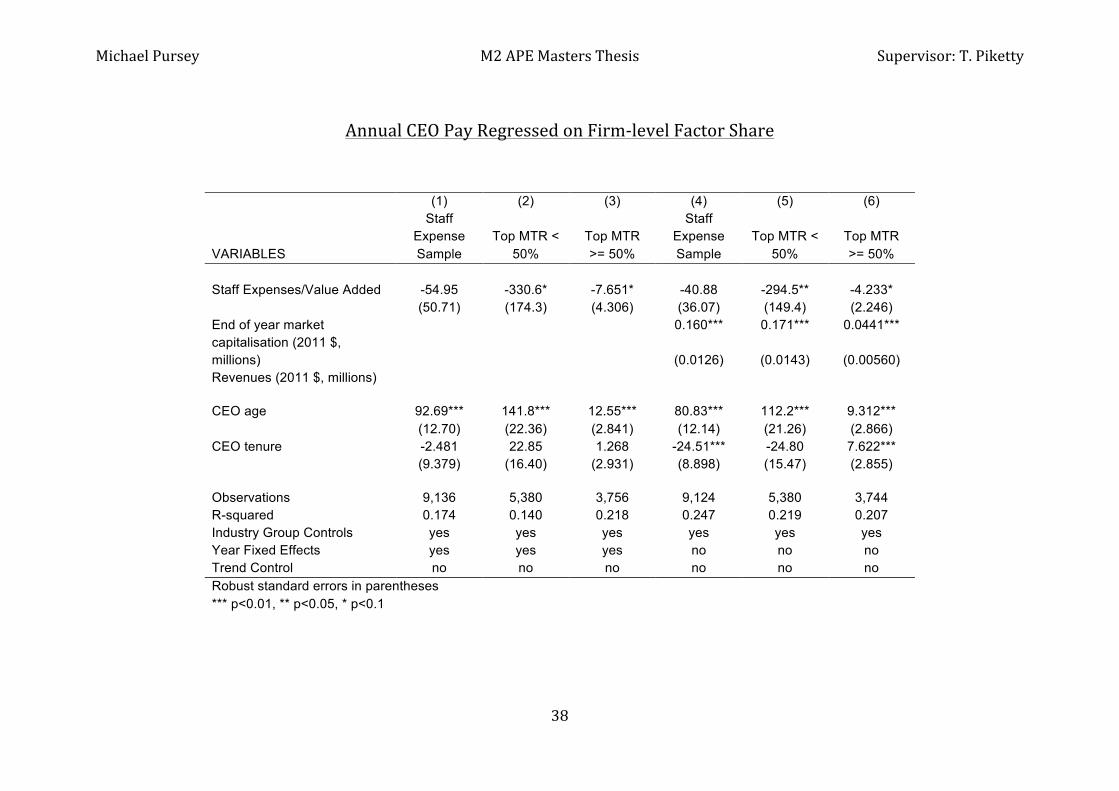
Michael(Pursey( M2(APE(Masters(Thesis( Supervisor:(T.(Piketty(
(
38(
(
Annual(CEO(Pay(Regressed(on(FirmWlevel(Factor(Share(
(
(1) (2) (3) (4) (5) (6)
VARIABLES
Staff Expense Sample
Top MTR < 50%
Top MTR >= 50%
Staff Expense Sample
Top MTR < 50%
Top MTR >= 50%
Staff Expenses/Value Added -54.95 -330.6* -7.651* -40.88 -294.5** -4.233*
(50.71) (174.3) (4.306) (36.07) (149.4) (2.246)
End of year market capitalisation (2011 $, millions)
0.160*** 0.171*** 0.0441***
(0.0126) (0.0143) (0.00560)
Revenues (2011 $, millions)
CEO age 92.69*** 141.8*** 12.55*** 80.83*** 112.2*** 9.312***
(12.70) (22.36) (2.841) (12.14) (21.26) (2.866)
CEO tenure -2.481 22.85 1.268 -24.51*** -24.80 7.622***
(9.379) (16.40) (2.931) (8.898) (15.47) (2.855)
Observations 9,136 5,380 3,756 9,124 5,380 3,744 R-squared 0.174 0.140 0.218 0.247 0.219 0.207 Industry Group Controls yes yes yes yes yes yes Year Fixed Effects yes yes yes no no no Trend Control no no no no no no Robust standard errors in parentheses
*** p<0.01, ** p<0.05, * p<0.1
(
( (

Michael(Pursey( M2(APE(Masters(Thesis( Supervisor:(T.(Piketty(
(
39(
(
Annual(CEO(Pay(Regressed(on(FirmWlevel(Factor(Share((continued)(
( (7) (8) (9) (10) (11) (12) (13) (14) (15)
VARIABLES
Staff Expense Sample
Top MTR < 50%
Top MTR >= 50%
Staff Expense Sample
Top MTR < 50%
Top MTR >= 50%
Staff Expense Sample
Top MTR < 50%
Top MTR >= 50%
Staff Expenses/Value Added -41.68 -296.8** -5.716* -33.70 -267.5** -5.718* -38.89 -289.5* -6.125*
(36.49) (150.6) (3.344) (31.78) (135.2) (3.088) (36.23) (158.0) (3.455)
End of year market capitalisation (2011 $, millions)
0.144*** 0.151*** 0.0185*** 0.137*** 0.142*** 0.0208*** 0.145*** 0.151*** 0.0228*** (0.0150) (0.0180) (0.00504) (0.0150) (0.0181) (0.00489) (0.0150) (0.0180) (0.00490)
Revenues (2011 $, millions) 0.0259** 0.0322** 0.0288*** 0.0276*** 0.0366** 0.0251*** 0.0236** 0.0312* 0.0242***
(0.0104) (0.0163) (0.00475) (0.0105) (0.0163) (0.00461) (0.0103) (0.0163) (0.00451)
CEO age 80.96*** 113.7*** 7.647*** 78.85*** 113.5*** 8.026*** 79.90*** 114.7*** 8.399***
(12.14) (21.39) (2.806) (12.07) (21.45) (2.604) (12.11) (21.39) (2.692)
CEO tenure -25.69*** -26.73* 7.715** -21.27** -21.23 5.787** -24.57*** -22.62 6.093**
(8.929) (15.47) (3.089) (8.772) (15.42) (2.928) (8.923) (15.44) (2.907)
Observations 9,124 5,380 3,744 9,124 5,380 3,744 9,124 5,380 3,744 R-squared 0.248 0.220 0.245 0.264 0.234 0.297 0.251 0.221 0.287 Industry Group Controls yes yes yes yes yes yes yes yes yes Year Fixed Effects no no no yes yes yes no no no Trend Control no no no no no no yes yes yes Robust standard errors in parentheses
*** p<0.01, ** p<0.05, * p<0.1
(

Michael(Pursey( M2(APE(Masters(Thesis( Supervisor:(T.(Piketty((
40((
References(
A.B.$ Atkinson$ –$ Factor( shares:( the( principal( problem( in( political( economy?( Oxford'Review'of'Economic'Policy,'Volume'25,'Number'1,'2009,'pp.3–16'
S.$Bentolila$&$G.$Saint$Paul$–$Explaining(movements(in(the(labor(share(–(2003'
B.S.$Bernanke$&$ $R.S$Gürkaynak$–$Is(Growth(Exogenous?(Taking(Mankiw,(Romer(and(Weil(Seriously.(NBER'Macroeconomics'Annual'2001,'Volume'16(
D.$Card$&$J.E.$DiNardo$>$SkillLBiased(Technological(Change(and(Rising(Wage(Inequality:(Some(Problems(and(Puzzles.(SOLE'2001'Invited'Talk!
P.$Gomme$&$P.$Rupert$–$Measuring(Labour’s(Share(of(Income.(Federal'Reserve'Bank'of'Cleveland,'Policy'Discussion'Papers,'no.'7,'November'2004'
R.$ A.$ Freeman$ >$Accounting( for( the( SelfL( Employed( in( Labour( Share( Estimates.(OECD'Science,'Technology'and'Industry'Working'Papers'2011/04'
M.$S.$Feldstein$–$Did(wages(reflect(growth(in(productivity?(NBER'Working'Paper'13953'
X.$ Gabaix$ &$ A.$ Landier$ –$Why( has( CEO( pay( increase( so(much?(Quarterly' Journal' of'Economics,'2007'
D.$Gollin(–(Getting(Income(Shares(Right.'Journal'of'Political'Economy,'2002,'vol.'110,'no.2'
P.$Gottschalk$&$T.$M.$ Smeeding$–(CrossLNational(Comparisons(of(Earnings(&(Income(Inequality.(Journal'of'Economic'Literature,'vol.'35,'no.2'(Jun.'1997),'633[687(
R.$S.$Goldfarb$&$T.C.$Leonard$–(Inequality(of(What(among(whom?:(Rival(conceptions(of(distribution( in( the( 20th( century.( Research' in' the' History' of' Economic' Thought' and'Methodology'Volume'23[A,'79[123'L.$Karabarbounis$&$B.$Neiman(L(The(Global(Decline(of(the(Labour(Share.(NBER'working'paper(19136(
J.$ M.$ Porterba$ –The( Rate( of( Return( to( Corporate( Capital( and( Factor( Shares:( New(Estimates( Using( Revised( National( Income( Accounts( and( Capital( Stock( Data.( NBER'working'paper'6263'
A.B.$ Krueger$ –$ Measuring( Labour’s( Share.( American' Economic' Review' Papers' &'Proceedings,'May'1999.'
M.$ Guerriero$ –( The( labour( share(of( income(around( the(world:( evidence( from(a(panel(dataset.(Development'Economics'and'Public'Policy'Working'Paper'Series'WP'No.'32/2012'
T.$ Piketty$ &$ E.$ Saez$ –$ Income( Inequality( in( the( United( States,( 1913L1998.(Quarterly'Journal'of'Economics'Vol.'CXVIII'February'2003'Issue'1.'Updated'2011.(
T.$Piketty,$E.$Saez$&$S.$Stantcheva$–$Optimal(Taxation(of(Top(Labour(Incomes:(A(Tale(of(Three(Elasticities.(American'Economic'Journal:'Economic'Policy'2013,'forthcoming(
'
(