Fund Performance Presentation as of December 2009 Suranaree University of Technology

1
HVAC Systems
Introduction
Heating, Ventilating and Air Conditioning (HVAC) , generally means the provision of an acceptable thermal environment within buildings. It includes heating, cooling, humidifying, dehumidifying, filtering, and distribution of air at suitable conditions for the maintenance of human comfort or for the undertaking of a particular process. The HVAC system may also be responsible for providing fresh outdoor air to dilute interior airborne contaminants such as odors from occupants, volatile organic compounds emitted from interior furnishings, chemicals used for cleaning, etc. (Heikel & Miller,2011)
Theory
Fresh air consists about 23% oxygen and 76% nitrogen by mass. The remainder is composed of small quantities of other gases and vapors, and of these the most important is water vapor. The vapor content of the atmosphere is loosely referred to as the Humidity. Although the water vapor content is usually very small, less than 2 % by mass of mixture but it has a considerable effect on air properties. Therefore, air can be assumed as a mixture of dry air and water vapor. A condition or state of air can be fixed only knowing 3 intensive thermodynamic properties. Total pressure of the air is the one that can be measured easily by barometer. Fortunately, Thailand is approximately at mean sea level, the standard atmospheric pressure of 101.3 kPa can be used. Therefore, leaves only other 2 intensive properties required. In practice, dry bulb temperature is easily measured by thermometer. Wet bulb temperature is also easily measured by thermometer wetted with water.
Humidity
Humidity is a measurement of the amount of water vapor in the air. The amount of water vapor in the air can be quantified in two different ways (Met office,2017):
Relative humidity
Relative Humidity (RH) is the most common measure of humidity. It measures how close the air is to being saturated - that is how much water vapor there is in the air compared to how much there could be at that temperature. Warmer air can hold more water vapor because there is more energy available. If the RH of the air is 100% then it is fully saturated.
100mvRH xmg
, %
Where mv is mass of steam in a given atmosphere
mg is mass of steam to saturate the atmosphere at the same temperature
In warm temperatures, air with very high RH is very uncomfortable as the saturated air affects our body's cooling mechanism. The air cannot easily contain any more water as a vapor and so cannot effectively evaporate the sweat from our skin.

2
In cool temperatures, air with very high RH can make us feel cooler. This is because there is more water vapor close to our skin and since water is a much better conductor than dry air, the cold temperature of the air is conducted to our skin, making us feel cooler
Specific or Absolute humidity
Specific humidity and the mixing ratio (ω) measure the actual amount of water vapor in the air as a weight in grams. They are very similar but the specific humidity is the weight of water vapor for every kilogram of air (including water vapor) whereas the mixing ratio is the weight of water vapor for every kilogram of dry air (not including water vapor).
mvma
, kgv/kga
Where mv is mass of water vapor, kgv
mv is mass of dry air, kga
Apparatus
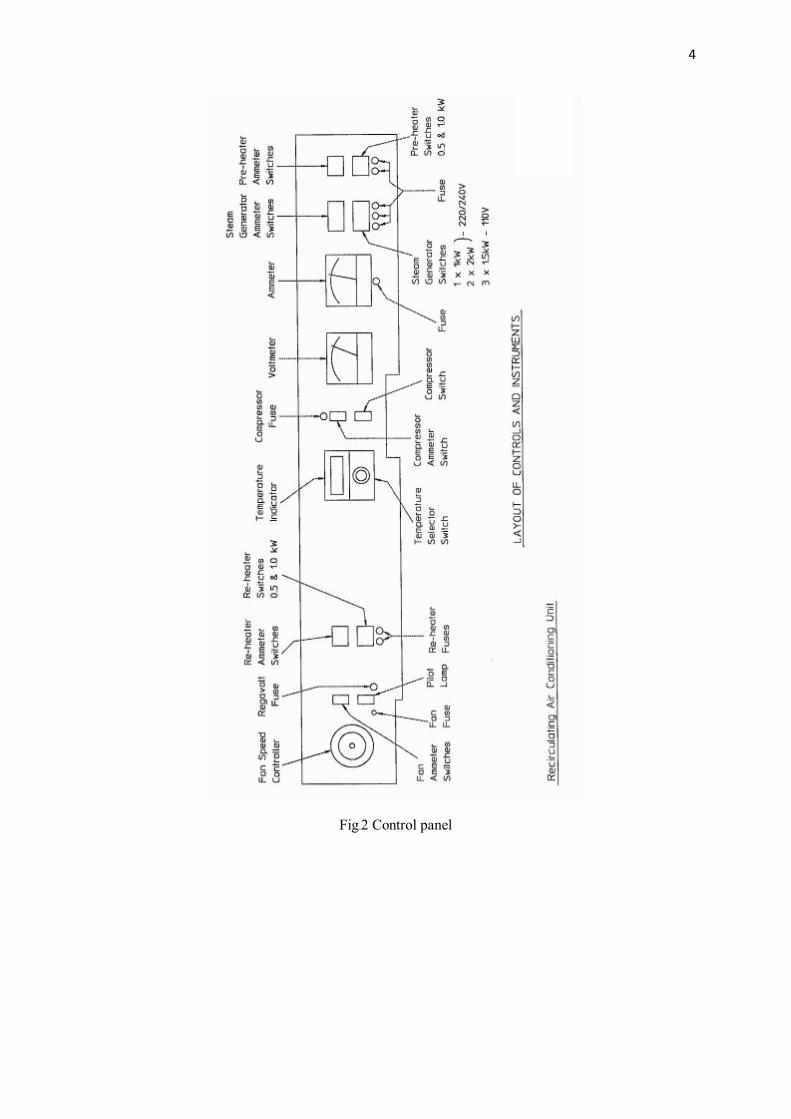
Figure 1 shows the apparatus for the air condition process. Figure 2 shows the control panel.

3
Fig.1 Recirculating air conditioning unit
4
Fig.2 Control panel

5
Test procedure
Turn on the axial flow fan.
At the air measuring intake orifice, Adjust the manometer until they are level. The “zero’ of the manometer should be checked at intervals during a test, since a change of temperature will affect its setting.
Mass flow rate of air 0.0757 Zma
, kg/s
Where Z is the intake orifice differential pressure in mm H2O
a is the specific volume of the air at the orifice in m3 /kg (from the psychrometric chart)
For the heating process
At the pre-heater: Adjust the heater to heat the air to the designed condition.
For the humidification process
Turn on the steam generator (boiler) to produce the steam. When humidification is required, the rate of steam injector should not exceed that which can be absorbed by the air.
If it is found that mist is seen some distance downstream of the steam distributor, either
i) reduce the heat input to the boiler, or ii) increase the air flow rate, or iii) increase the air temperature by switching on more pre-heat.
For the cooling and dehumidification process
Turn on the air conditioning unit. Satisfactory results are more likely to be achieved if the following points are noted:
(i) When it is intended to demonstrate de-humidification, the air should be fairly humid (say >65%) at Station C. If necessary, steam may be injected.
(ii) The cooler has a large surface area on which the condensation takes place. Due to this, an appreciable time elapses before condensate is discharged from the drain at the same rate as it is precipitated.
(iii) The change of moisture content of the air is easily determined from the product of the air mass flow rate and the change of specific humidity. Agreement between the change of moisture content of the air and the drainage rate will be obtained after a sufficient period time under the steady condition.
Air conditioning processes
Air conditioning processes include heating in order to increase temperature where in the moisture content (humidity ratio) of the air remains constant, humidification with steam in order to increase the moisture content of the air with some increase in temperature, cooling normally will be with dehumidification, evaporative cooling, adiabatic mixing of two or more air stream, and cooling tower processes. Humidification is a process that results in an increase in the amount of moisture in the air.
Dehumidification, on the other hand, results in a decrease in the moisture content of the air. These

6
processes are used to condition the air in building in order to provide comfortable surrounding for the occupants, and maintain the environmental control necessary for a variety of commercial and industrial processes.
1. Heating
Heating process is used to increase the dry bulb temperature of air without adding or subtracting moisture. In other words, the humidity ratio (ω) of the air remains unchanged during the process, and the process can therefore be represented by a horizontal line on the psychrometric chart.
Fig.3 Heating process
2. Steam Humidification
Problems associate with low relative humidity resulting from heating can be eliminated by humidifying the heated air. This is accomplished by passing the air through a steam humidifying section. The path for a typical humidification process in psychrometric chart slopes up to the right, indicating that the humidity ratio is highly increased during the process. There is also a small increase in dry bulb temperature.

7
Fig.4 Steam humidification process
3. Cooling and Dehumidification
Normally the temperature of the refrigerant in the air conditioner evaporator or cooling coil is much lower than the entering air dew point. Dehumidification will be automatically accomplished by cooling. Therefore, air leaving the evaporator should be saturated ( 100% Relative humidity) .
However, in actual there are few percentages of the air passing through the evaporator with unsaturated condition. This is the reason that the leaving air appears unsaturated (Relative humidity less than 100%) while condensate is clearly seen.

8
Fig.5 Cooling and dehumidification process
4. Adiabatic Mixing of Air Streams
The mixing is usually achieved by simply merging two air streams into a single stream. The air streams are assumed to have different dry bulb temperatures and humidity ratios. The heat transfer to the surroundings during the process is small, so that the process is termed adiabatic mixing. The mixture air stream leaves with a dry bulb temperature and a humidity ratio that are between corresponding values for the two entering air streams. When two air streams at two different states (states 1 and 2) are mixed, adiabatically, the state of the mixture (state 3) will lie on the straight line connecting state 1 and 2 on the psychrometric chart. (Chulalongkorn University, 2017)
Fig.6 Adiabatic Mixing of Air Streams

9
Experiment assessment
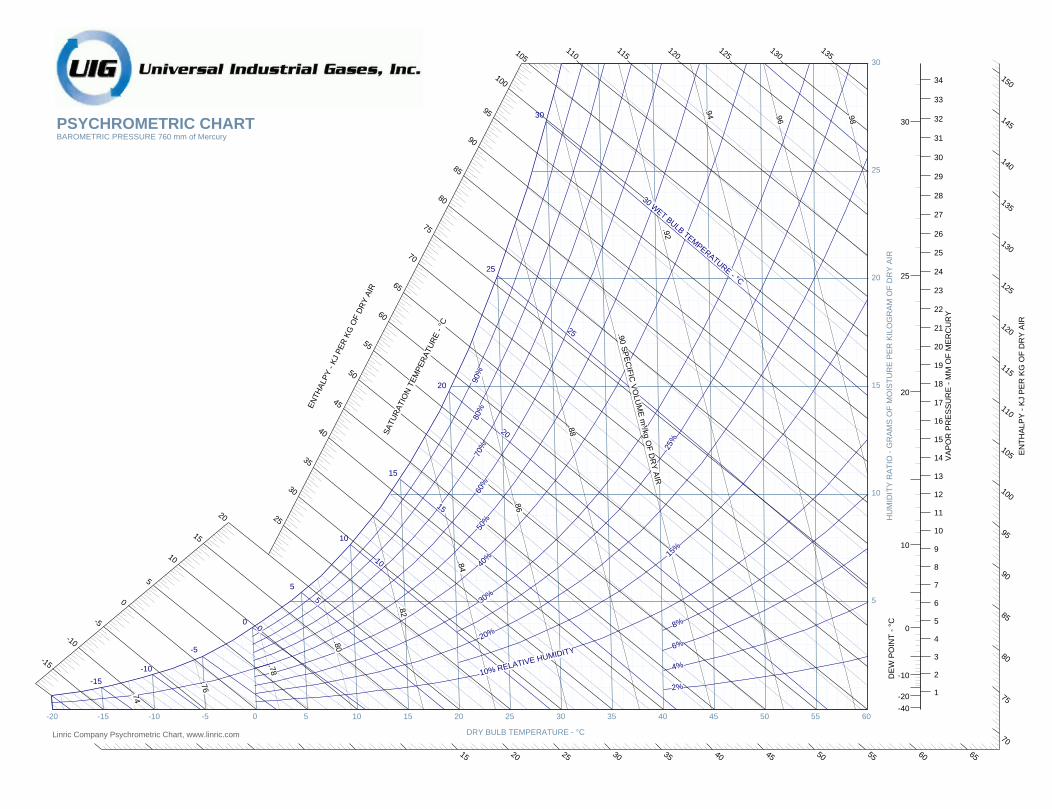
After the experiments, show the processes on the psychrometric chart. All the processes in this experiments unit may be treated as steady flow processes with insignificant change of kinetic and potential energy. Thus, for any portion of the unit treated as an open system,
. . . .Q W m h m he e i i
Or . . .
( )Q W m h hie
where,
.Q is the heat transfer rate (positive if to the system)
.w is the work transfer rate (electrical or mechanical, positive if from the system)
.m is mass flow rate. he and hi are the specific enthalpy of the fluids leaving and entering, respectively.
10
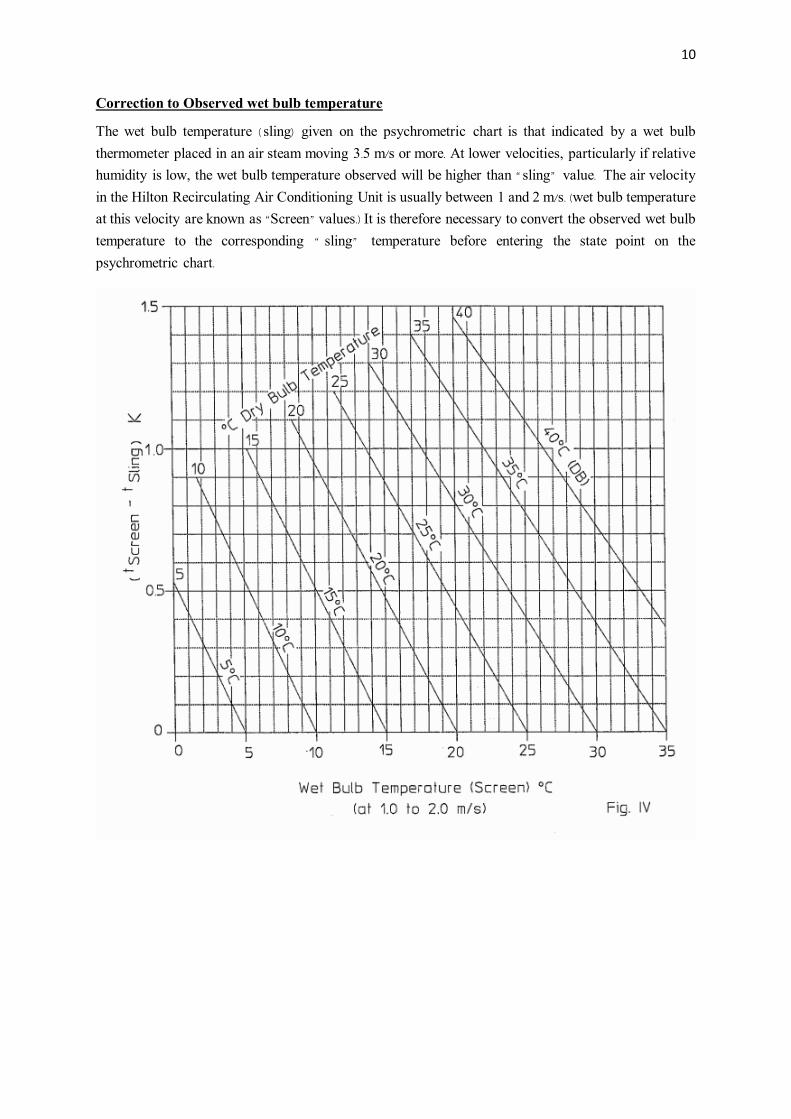
Correction to Observed wet bulb temperature
The wet bulb temperature ( sling) given on the psychrometric chart is that indicated by a wet bulb thermometer placed in an air steam moving 3.5 m/s or more. At lower velocities, particularly if relative humidity is low, the wet bulb temperature observed will be higher than “sling” value. The air velocity in the Hilton Recirculating Air Conditioning Unit is usually between 1 and 2 m/s. (wet bulb temperature at this velocity are known as “Screen” values.) It is therefore necessary to convert the observed wet bulb temperature to the corresponding “ sling” temperature before entering the state point on the psychrometric chart.

11
Observation Sheet
Test reference 1 2 3 4 Circulation % % % %
Station Temp.( C)
A Intake
B Mixing
C Steam injection
D Cooling
E Heating
R134a Temp. NO.12 ( C) R134a Temp. NO.13 ( C) R134a Flow rate (kg/h) Voltage (V) Heater Current (A) Boiler Current (A) Compressor Current (A) Fan Current (A) Condensate rate (kg/s) R134a Evaporator pressure (bar) Orifice differential, intake (mm H2O) Orifice differential, In duct (mm H2O)

12
Reference
Heikel, M. R., & Miller. AIR CONDITIONING. In A-to-Z Guide to Thermodynamics, Heat and Mass Transfer, and Fluids Engineering. Begellhouse. https://doi.org/10.1615/AtoZ.a.air_conditioning
Met office. (n.d.). Humidity - Met Office. Retrieved March 19, 2017, from http://www.metoffice.gov.uk/learning/learn-about-the-weather/weather-phenomena/humidity
Chulalongkorn University, Department of Mechanical Engineering. Air Conditioning Processes.
Retrieved from http://fmeabj.lecturer.eng.chula.ac.th/2183-
261%20HP/Course%20Materials/Orientation%20Slides%20and%20Lab%20Instructions/Lab%20Instruction/2183-261%20-%202558%20-%20SCP%20-%20Air%20Conditioning.pdf
-20 -15 -10 -5 0 5 10 15 20 25 30 35 40 45 50 55 60
DRY BULB TEMPERATURE - °C
5
10
15
20
25
30
15 20 25 30 35 40 45 50 55 60 65
70
75
80
85
90
95
100
105
110
110
115
115
120
120
125
125
130
130
135
135
140
145
150
EN
TH
AL
PY
- K
J P
ER
KG
OF
DR
Y A
IR
-15
-10
-5
0
5
10
15
20 25
30
35
40
45
50
55
60
65
70
75
80
85
90
95
100
105
EN
TH
ALP
Y - K
J P
ER
KG
OF D
RY
AIR
SA
TU
RA
TIO
N T
EM
PE
RA
TU
RE
- °
C
-15
-10
-5
0 0
5
5
10
10
15
15
20
20
25
25
30 WET BULB TEM
PERATURE - °C
30
1 5%
25%
2%
4 %
6 %
8 %
1 0 % R E L A T I V E H U M I D I T Y
2 0 %
3 0 %
40%
50%
60%
70%
80%
90%
.74
.76
.78
.80
.82
.84
.86
.88
.90 S
PE
CIF
IC V
OLU
ME
m³/kg
OF
DR
Y A
IR.9
2
.94 .9
6
.98
HU
MID
ITY
RA
TIO
- G
RA
MS
OF
MO
IST
UR
E P
ER
KIL
OG
RA
M O
F D
RY
AIR
PSYCHROMETRIC CHARTBAROMETRIC PRESSURE 760 mm of Mercury
Linric Company Psychrometric Chart, www.linric.com
1
2
3
4
5
6
7
8
9
10
11
12
13
14
15
16
17
18
19
20
21
22
23
24
25
26
27
28
29
30
31
32
33
34
VA
PO
R P
RE
SS
UR
E -
MM
OF
ME
RC
UR
Y
-40
-20
-10
0
10
20
25
30
DE
W P
OIN
T -
°C