m i d AiO.ZLA' MOLECULAR PHYLOGENY AND EVOLUTION OF ...
173
3~7? mid AiO.ZLA' MOLECULAR PHYLOGENY AND EVOLUTION OF THE AMERICAN WOODRATS, GENUS NEOTOMA (MURIDAE). DISSERTATION Presented to the Graduate Council of the University of North Texas in Partial Fulfillment of the Requirements For the Degree of DOCTOR OF PHILOSOPHY By John Valentine Planz Denton, Texas August, 1992
Transcript of m i d AiO.ZLA' MOLECULAR PHYLOGENY AND EVOLUTION OF ...
3~7? m i d
AiO.ZLA'
MOLECULAR PHYLOGENY AND EVOLUTION OF THE
AMERICAN WOODRATS, GENUS NEOTOMA
(MURIDAE).
DISSERTATION
Presented to the Graduate Council of the
University of North Texas in Partial
Fulfillment of the Requirements
For the Degree of
DOCTOR OF PHILOSOPHY
By
John Valentine Planz
Denton, Texas
August, 1992
Planz, John V., Molecular Phvlogenv and Evolution of the American
Woodrats. Genus Neotoma fMuridaeX Doctor of Philosophy (Biology), August,
1992, 164pp., 5 tables, 21 figures, references, 146 titles.
The evolutionary relationships of woodrats (Neotoma) were elulcidated
through phylogenetic analyses of mitochondrial DNA restriction site and allozyme
data. DNA samples from eleven nominal species from the genus Neotoma and
two outgroup taxa, Ototylomys phyttotis and Xenomys nelsoni, were cleaved using a
suite of 17 Type II restriction endonucleases. Mitochondrial DNA restriction
profiles were visualized following electrophoresis of restriction digests via methods
of Southern transfer and hybridization with 3 2 P- and digoxigenin-labeled mtDNA
probes. Restriction mapping resulted in the identification of 37 unique mtDNA
haplotypes among the woodrat taxa examined. Proteins representing 24
presumptive structural gene loci were examined through starch gel electrophoresis.
Binary-coded allozyme data and allozyme frequency data were analyzed using
PAUP and FREQPARS, respectively. Phylogenetic analyses of the mtDNA
restriction site data incorporated three different character type assumptions:
unordered binary characters, Dollo characters, and differentially weighted
unordered characters employing the STEPMATRIX option of PAUP. Proposed
phylogenies for Neotoma are based on majority-rule consensus trees produced
using bootstrap procedures. Phylogenetic analyses of the woodrat data sets
revealed a distinct dichotomy among populations of white-throated woodrats
(N. albigula) suggesting the presence of cryptic species within that taxon. MtDNA
and allozyme data support the specific status of N. devia as distinct from N. lepida,
and additionally reveal the presence of a third cryptic species referable to N.
intermedia among the desert woodrats. Phylogenetic analyses of the genetic data
also suggest subgeneric status for the desert woodrats, which is in agreement with
evidence from morphology. The genetic data revealed a sister group relationship
between N. stephensi and samples of N. mexicana, suggesting the placement of N.
stephensi into the N. mexicana species-group. Neotoma fuscipes and N. cinerea
formed a monophyletic lineage basal to the remaining members of the subgenus
Neotoma which supports the assignment of N. fuscipes to the subgenus Teonoma
with N. cinerea. Although stringent, Dollo parsimony methods produced the best
supported phylogenies among the species of Neotoma. The STEPMATRIX
approach was unable to resolve species relationships within species-groups but
clearly delineated the higher taxonomic levels between species-groups and
subgenera.
ACKNOWLEDGEMENTS
I would like to thank my committee members, Drs. Thomas L. Beitinger, Robert C. Benjamin, Gerard A. O'Donovan, and Duane A. Schlitter for their patience, assistance, and cooperation with the various phases of this project. I also wish to extend special thanks to Dr. Benjamin for sharing his knowledge of molecular biology methodology and his willingness to provide laboratory supplies when they were in short supply. Most of all, I wish to extend my thanks to Dr. Earl G. Zimmerman, whose patience and support while serving as my major professor allowed me to expand this project to the level it has achieved. His moral support and encouragement in the lab and field, especially during difficult times, were crucial to the success of this project.
The completion of this project would not have been possible without the assistance of many colleagues over the past five years. Drs. Sarah George, William Kilpatrick, Terry Yates, Robert Baker, and Robert Dowler provided additional tissue samples of Neotoma and other taxa used in this study. G. Lance Brooks, Darrin R. Akins, Cheryl Lewis, William Gannon, Cheryl Watts, Jesus Maldonado, Ely Garzae, and Drs. R. Edward DeWalt, J. Bruce Moring, Chris McAllister, David Hafner and David Huckaby assisted in the field collection specimens. Sincere thanks are extended to Theresa S. DeWalt, whose companionship and hard work made collection trips and long nights in the lab both successful and enjoyable.
Darrin Akins also provided technical advice and obtained the cloned mitochondrial genome of Mus domesticus from Evan Hermel of Southwestern Medical Center, which was used as a probe in this study. Thanks are extended to Candice Workman, Lesley Duesman, and Latasha Williams for assistance in the laboratory.
Special thanks are also extended to Cliff Tyner (Long X Ranch), G. Fry, and C. Russell for allowing access to their lands, and the Game and Fish Departments of Texas, Arizona, New Mexico, Colorado, California, Utah, West Virginia, Oklahoma, and Kansas for granting permits for the collection of specimens.
Portions of this work were supported by grants from the Theodore Roosevelt Memorial Fund of the American Museum of Natural History, the North American Mammal Research Fund of The Carnegie Museum of Natural History, and financial contributions from my parents, Hans L. and Anna Planz, to whom this work is dedicated.
in
TABLE OF CONTENTS
Page
LIST OF TABLES v
LIST OF FIGURES vi
CHAPTER
I. Introduction 1
II. Methods 24
III. Results 38
IV. Discussion 65
V. Conclusions 90
APPENDIX I 93
APPENDIX II 101
APPENDIX III 104
APPENDIX IV 117
APPENDIX V 120
APPENDIX VI 127
APPENDIX VII 134
LITERATURE CITED 145
IV
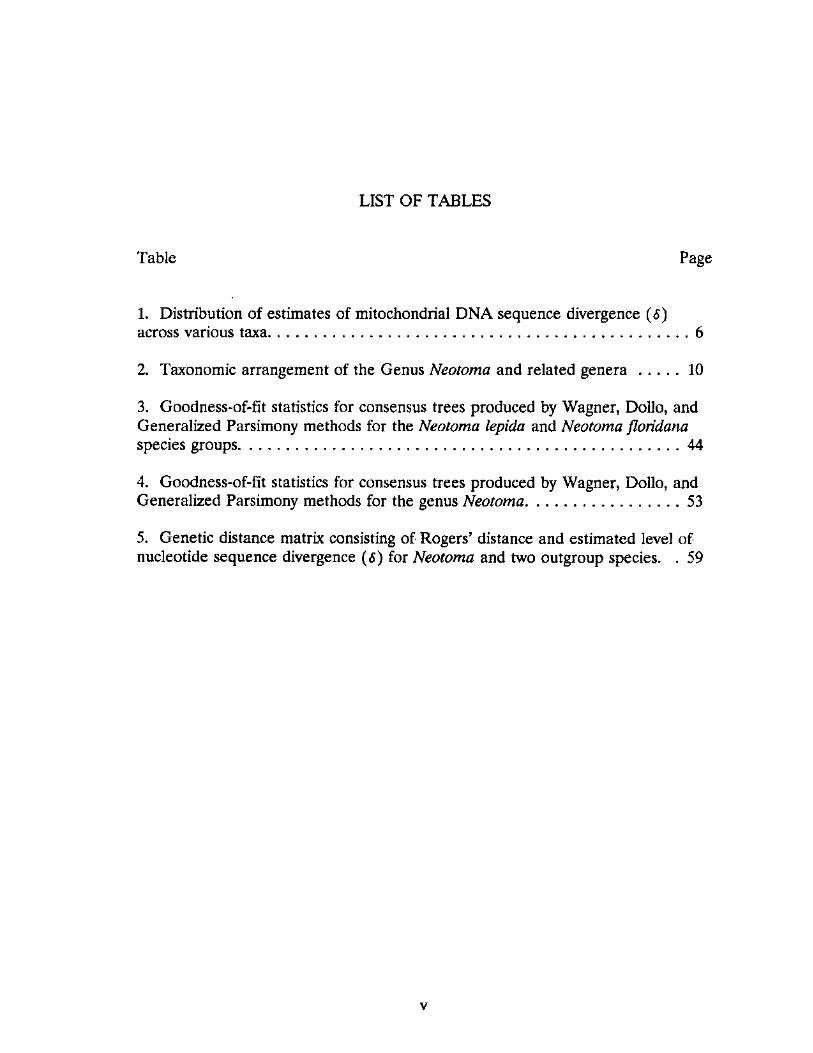
LIST OF TABLES
Table Page
1. Distribution of estimates of mitochondrial DNA sequence divergence (6) across various taxa 6
2. Taxonomic arrangement of the Genus Neotoma and related genera 10
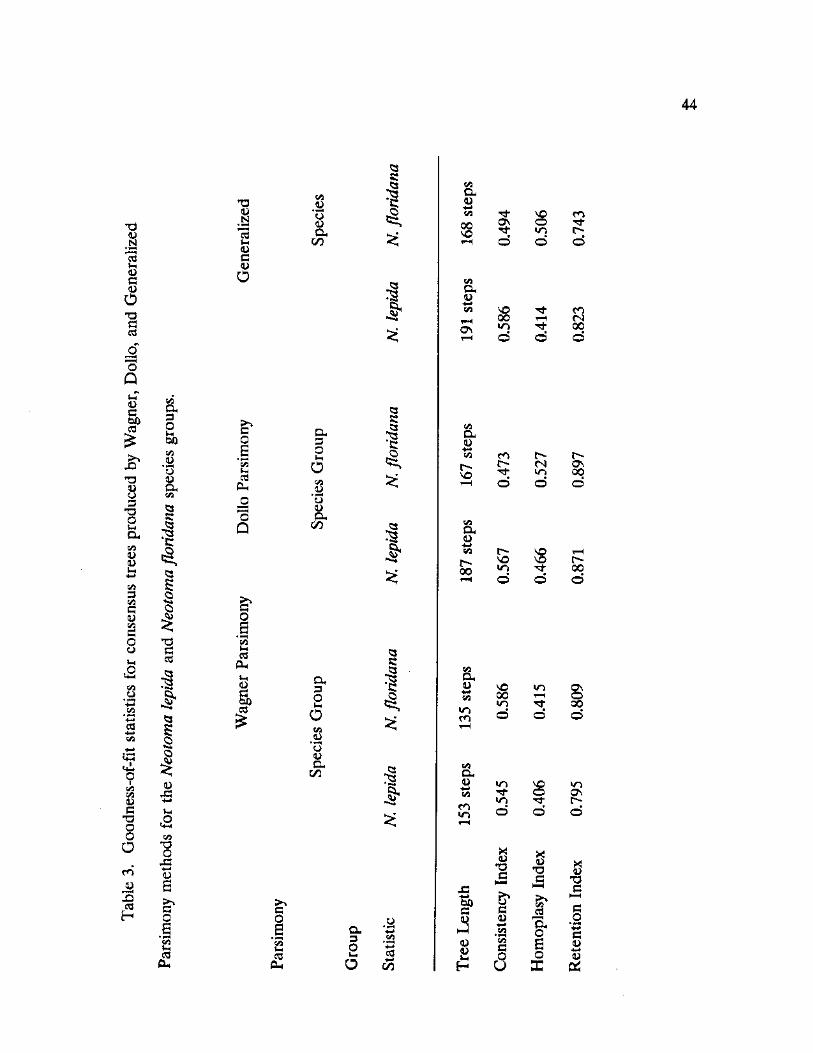
3. Goodness-of-fit statistics for consensus trees produced by Wagner, Dollo, and Generalized Parsimony methods for the Neotoma lepida and Neotoma floridana species groups 44
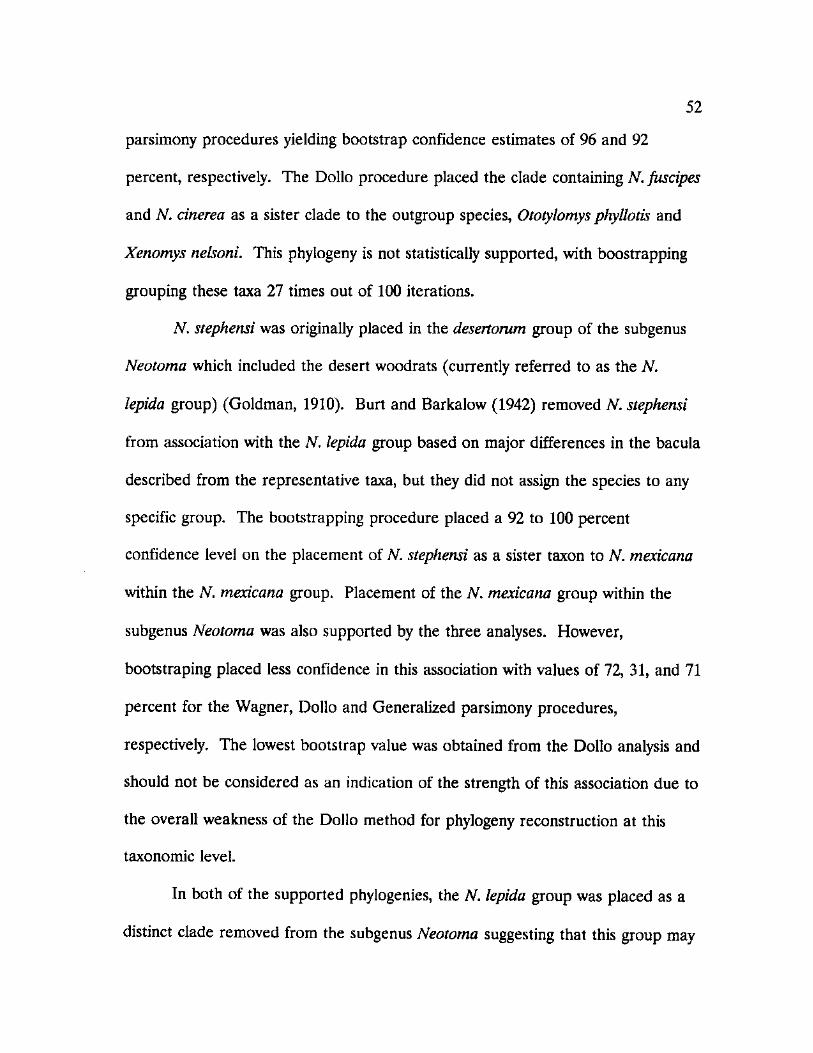
4. Goodness-of-fit statistics for consensus trees produced by Wagner, Dollo, and Generalized Parsimony methods for the genus Neotoma 53
5. Genetic distance matrix consisting of Rogers' distance and estimated level of nucleotide sequence divergence (5) for Neotoma and two outgroup species. . 59
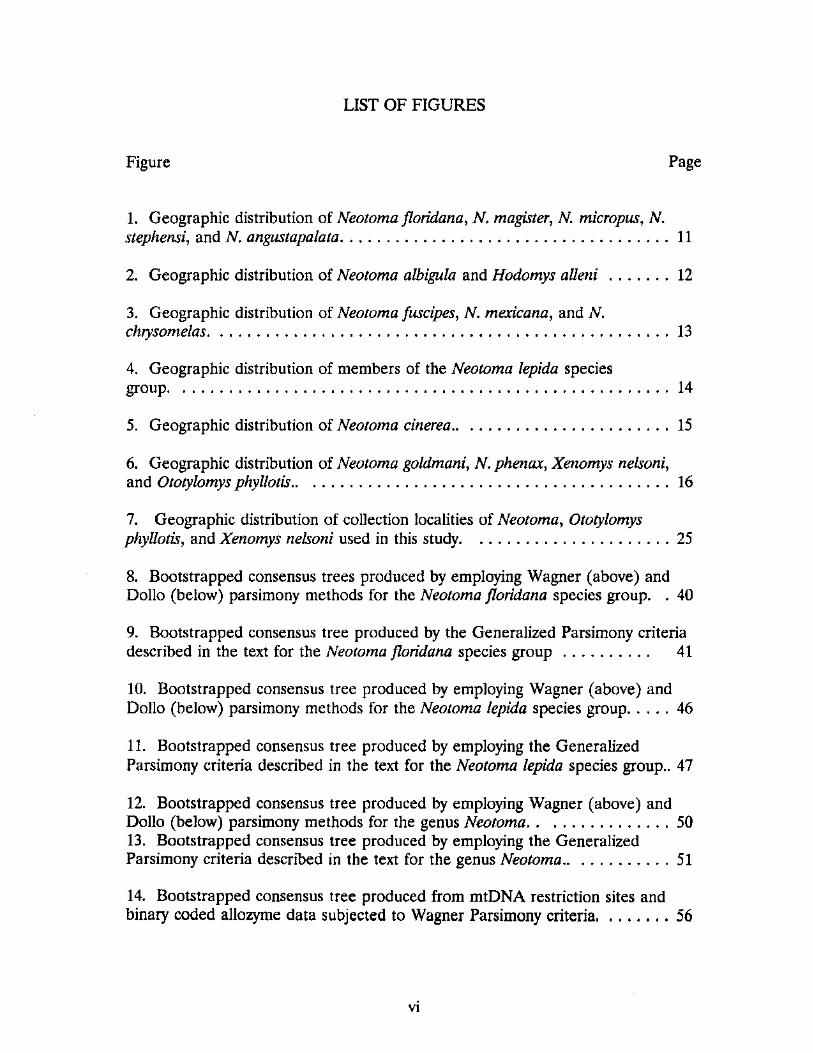
LIST OF FIGURES
Figure Page
1. Geographic distribution of Neotoma floridana, N. magister, N. micropus, N. stephensi, and N. angustapalata 11
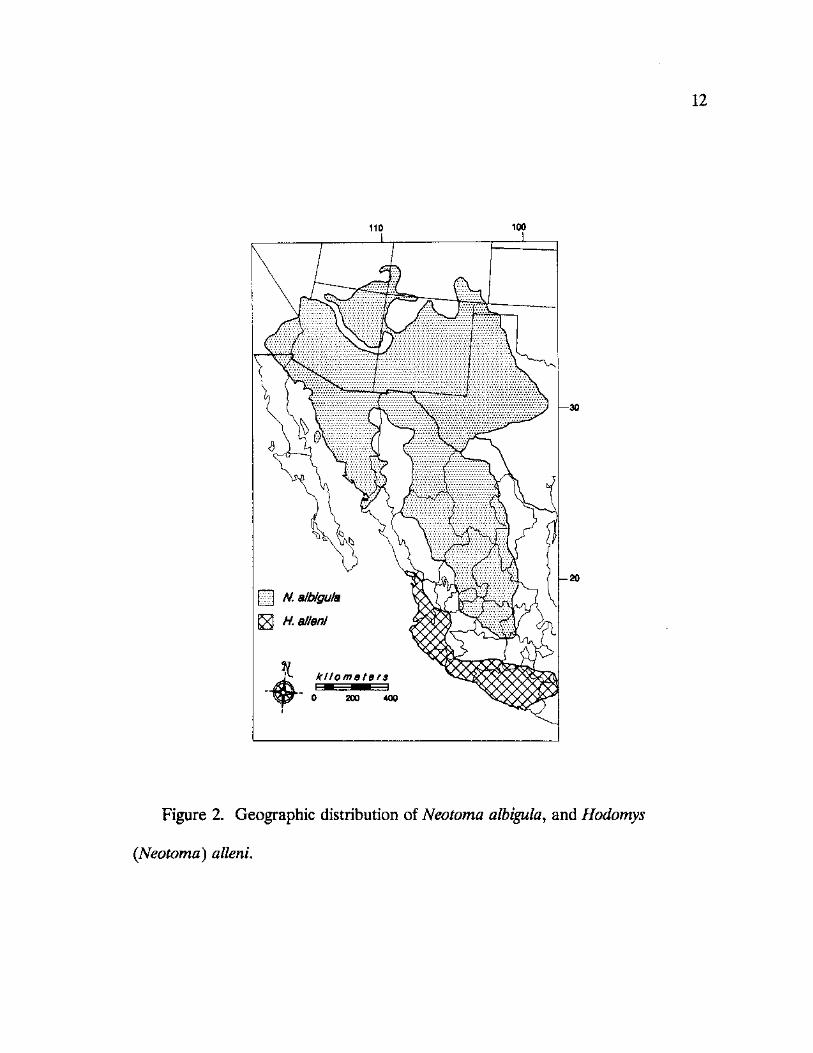
2. Geographic distribution of Neotoma albigula and Hodomys alleni 12
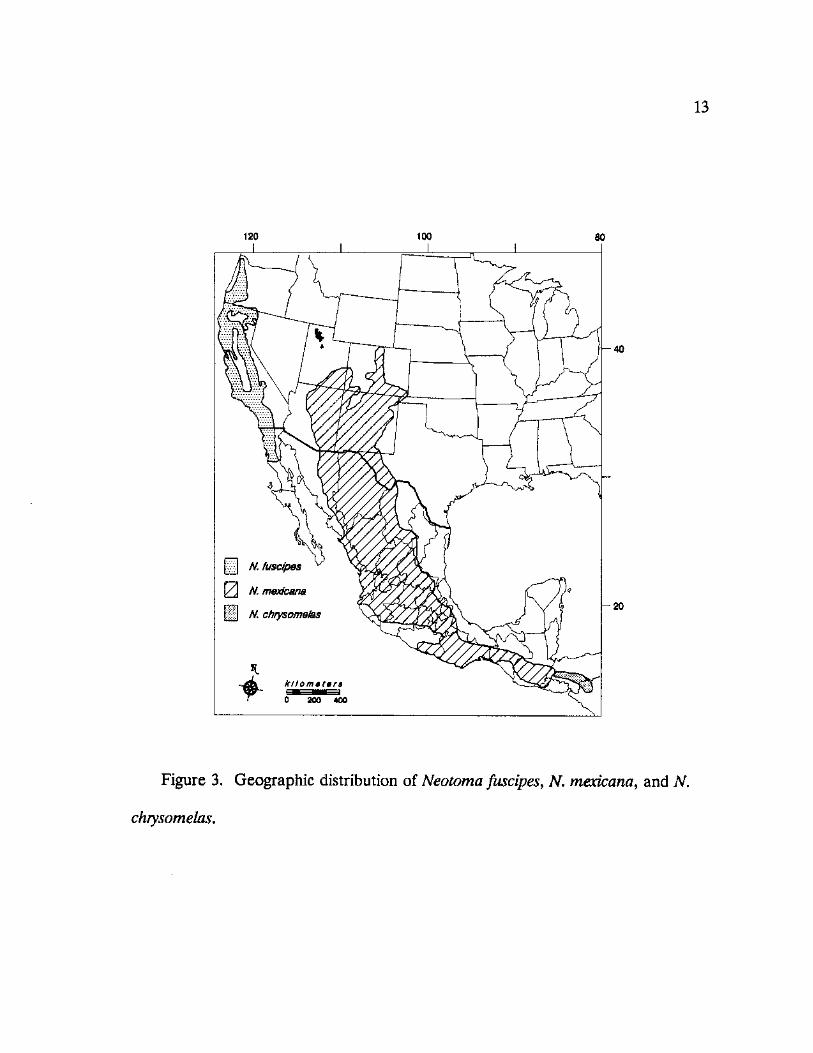
3. Geographic distribution of Neotoma fuscipes, N. mexicana, and N. chtysomelas 13
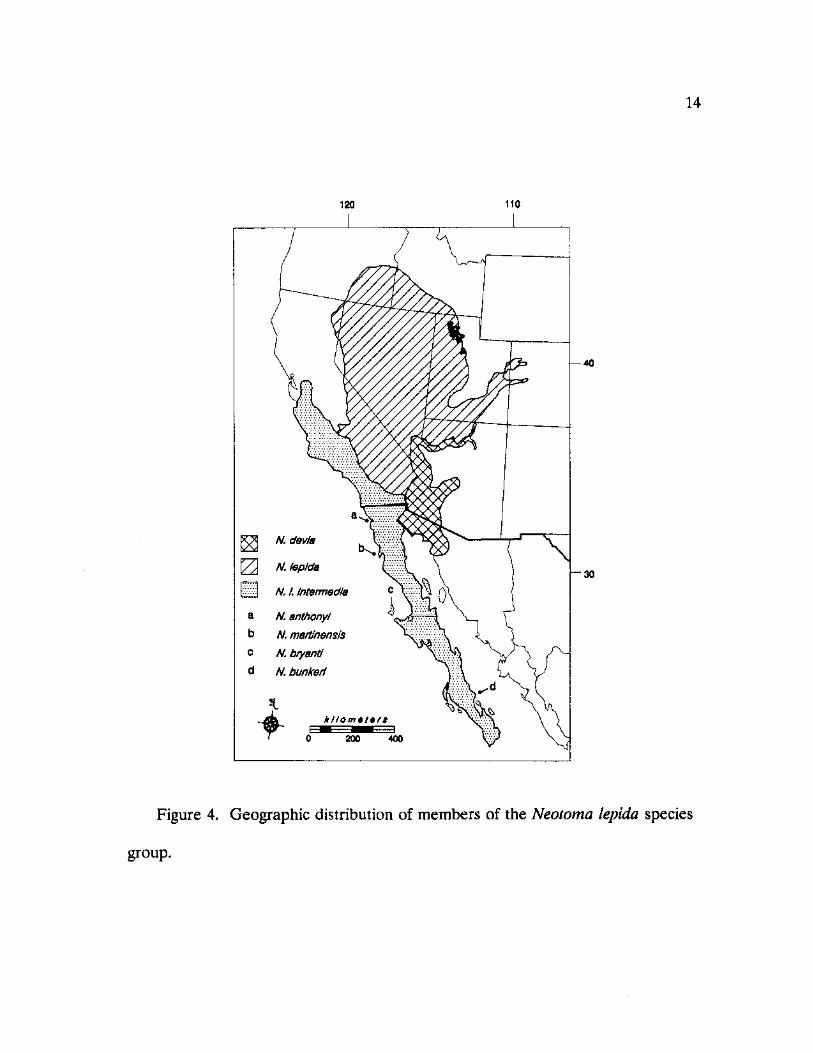
4. Geographic distribution of members of the Neotoma lepida species group 14
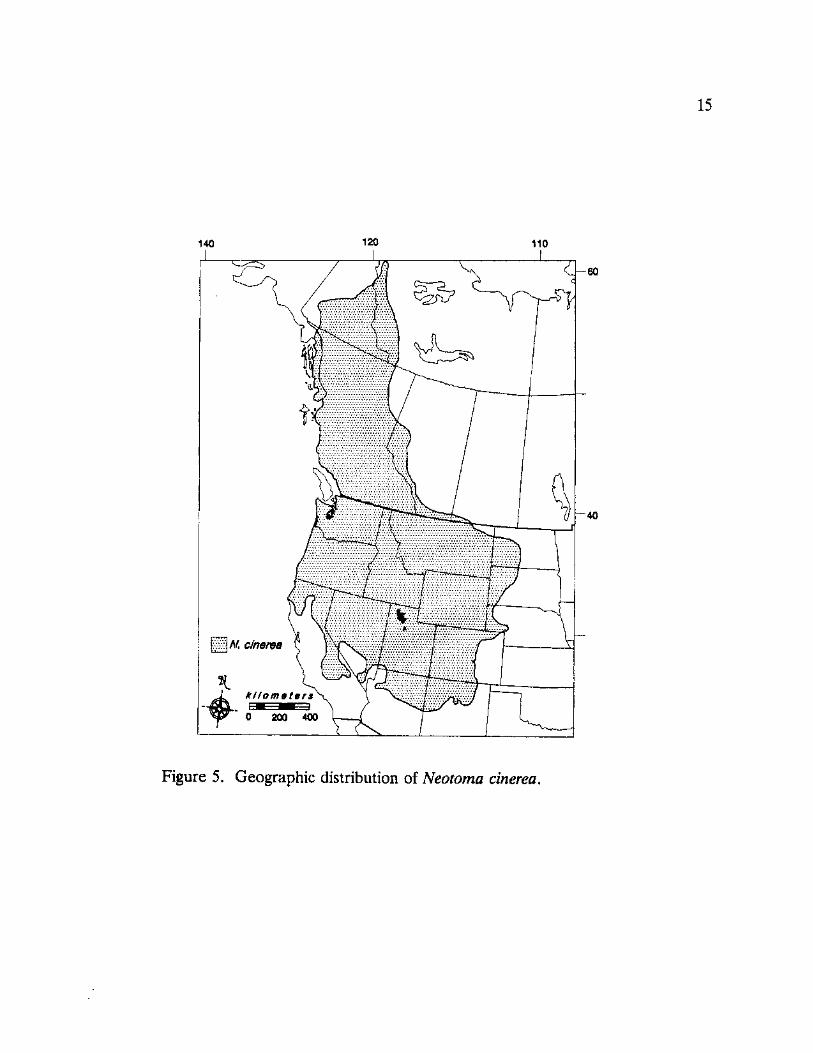
5. Geographic distribution of Neotoma cinerea 15
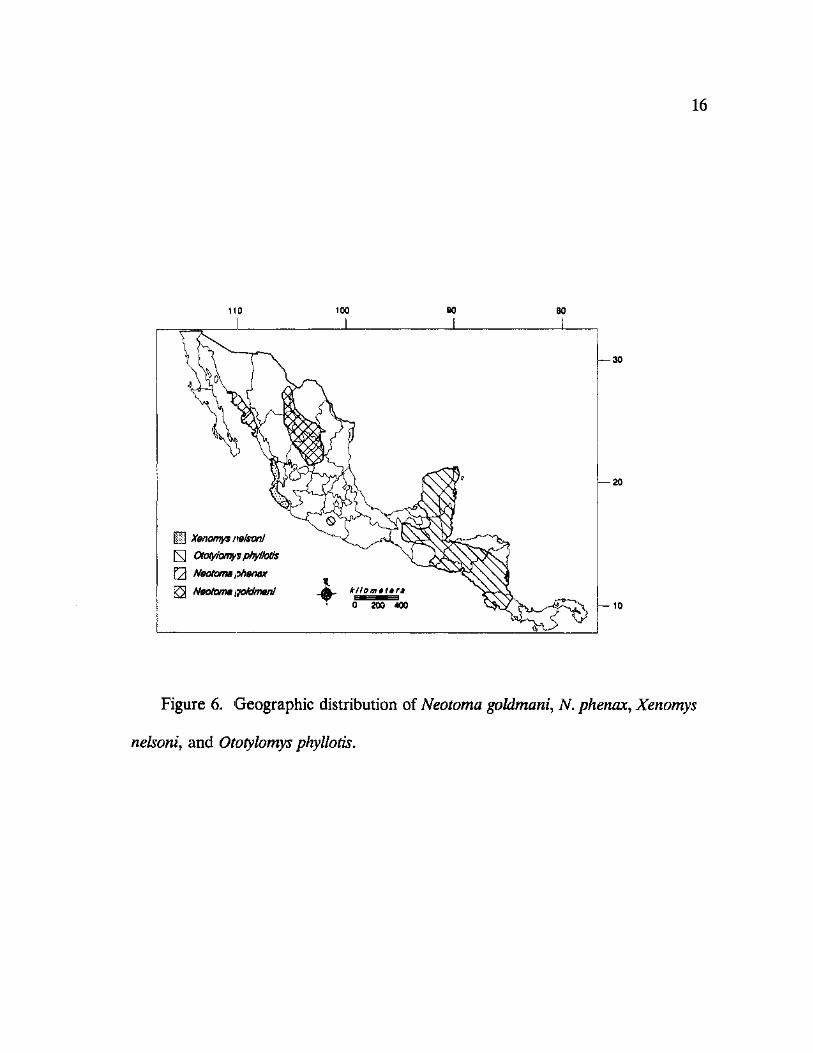
6. Geographic distribution of Neotoma goldmani, N. phenax, Xenomys nelsoni, and Ototylomys phyllotis 16
7. Geographic distribution of collection localities of Neotoma, Ototylomys phyllotis, and Xenomys nelsoni used in this study 25
8. Bootstrapped consensus trees produced by employing Wagner (above) and Dollo (below) parsimony methods for the Neotoma floridana species group. . 40
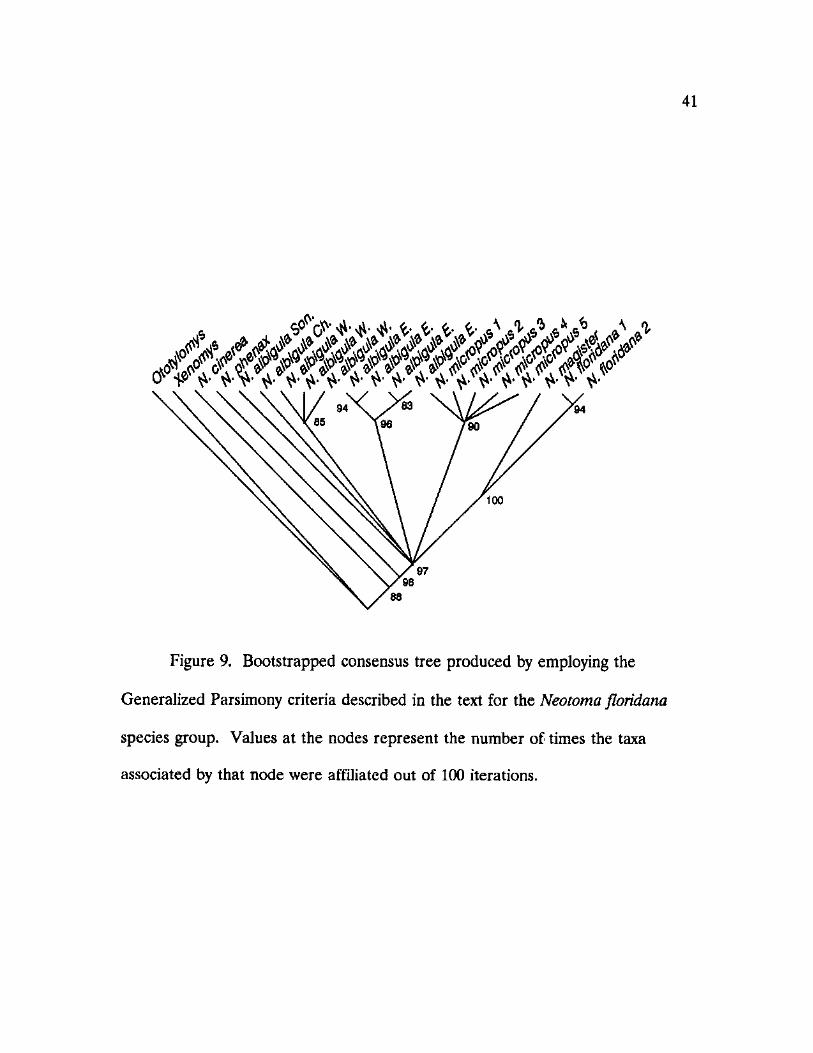
9. Bootstrapped consensus tree produced by the Generalized Parsimony criteria described in the text for the Neotoma floridana species group 41
10. Bootstrapped consensus tree produced by employing Wagner (above) and Dollo (below) parsimony methods for the Neotoma lepida species group 46
11. Bootstrapped consensus tree produced by employing the Generalized Parsimony criteria described in the text for the Neotoma lepida species group.. 47
12. Bootstrapped consensus tree produced by employing Wagner (above) and Dollo (below) parsimony methods for the genus Neotoma 50 13. Bootstrapped consensus tree produced by employing the Generalized Parsimony criteria described in the text for the genus Neotoma 51
14. Bootstrapped consensus tree produced from mtDNA restriction sites and binary coded allozyme data subjected to Wagner Parsimony criteria 56
VI
15. Bootstrapped Wagner consensus tree (above) produced from binary coded allele data, FREQPARS cladogram produced from allele frequency data (below) 57
16. Phenogram produced from UPGMA cluster analysis of allozyme data for 14 Neotoma taxa and two outgroup species 60
17. Phenogram produced from UPGMA cluster analysis of 14 Neotoma taxa and two outgroup species using the estimated level of nucleotide sequence divergence 62
18. Phenogram produced under least squares criteria for 14 Neotoma taxa and two outgroup species using the estimated level of nucleotide sequence divergence 63
19. Proposed ancestral drainage pattern of the Rio Grande River during the late Pliocene through early Pleistocene 71
20. Proposed variations in the drainage pattern of the Rio Grande River in the vicinity of the Franklin Mountains during the Pleistocene 73
21. Geographic location of critical fossil sites for the Neotoma lepida species group referred to in text 85
vn
CHAPTER I
INTRODUCTION
Background.- An ultimate goal in the study of organismal diversity is an
understanding of the speciation process. Traditionally, the vast majority of
organisms to which the designation of "species" has been applied stem from
comparisons of morphological similarity. The organization of these taxa into
schemes of higher taxonomy, i.e. species-groups, subgenera, and genera, has
therefore relied on characteristics that may be subject to convergence, which may
be environmentally or stocastically mediated, and did not take into account the
genetic heritability of the traits in question (Templeton, 1981). With the advance
of current techniques and analytical procedures, the evolutionary change
accompanying the speciation process can be studied using several unique and
often independent characters. A number of genetic markers have been employed
in a variety of studies which attempt to correlate genetic changes with population
demographics and speciation events (Avise, 1976; Avise et al., 1983; Patton and
Sherwood, 1983; Jansen et al., 1990; Mindell and Honeycutt, 1990). Thus, at this
time, the genetic consequences of the speciation process can be studied from
levels of chromosomal morphology, alterations in structural nuclear genes,
mitochondrial DNA polymorphism, and DNA sequence analysis. Each of these
1
2
procedures has traditionally been employed independently. By applying these
approaches in concert to a model group whose species are at various levels of
differentiation, concordance among the various stages of evolution and genetic
differentiation can be measured.
One of the most thoroughly employed techniques is the analysis of
structural gene variability by allozyme electrophoresis (Selander et al., 1971).
Studies of nuclear gene products have been used to visualize the conversion of
intra- to interspecific variability accompanying the speciation process among taxa
of insects, teleost fish, reptiles, mammals, and birds (Ayala et al., 1975; Avise and
Smith, 1974; Zimmerman et al., 1978; Zimmerman and Nejtek, 1977; Smith and
Zimmerman, 1976). From these studies, it has been found that genetic distance
generally increases as higher levels of differentiation are reached, however,
it is evident that the degrees of divergence are not consistent among animal taxa
nor within specific groups. For instance, among rodent taxa, interspecific levels of
genetic distance range from 0.036 among semispecies of ground squirrels,
(Spermophilus, Cothran et al., 1977) to 0.64 for voles of the genus Clethrionomys
(Tegelstrom, 1987; 1988). A variety of factors, including effectiveness of
geographic and reproductive barriers, population demographics, and mode by
which speciation events occur, all play unique roles in determining the degree of
genetic distinctiveness among related species.
Recently, genetic markers of cytoplasmic origin, such as mitochondrial
DNA (mtDNA) and chloroplast DNA (cpDNA), have found rapid acceptance in
3
both intra- and interpopulation studies (Avise et al., 1987; Jansen et al., 1990).
The mitochondrial genome of mammals consists of a covalently closed, circular
DNA molecule, 16.3 to 19.2 kbp in length, coding for 13 proteins, two rRNAs, and
22 tRNAs (Brown, 1985). The gene content of mtDNA varies little among
multicellular animals (Rastl and Dawid, 1979). MtDNA evolves primarily by
nucleotide substitution in parts of the control region (D-loop) and at codon
positions that do not cause amino acid replacement (Brown, 1983). Substitutions
do not appear to be random, since there is a strong bias for transitions over
transversions among closely related taxa (Brown et al., 1982). A useful feature of
mtDNA is its rapid rate of molecular evolution compared to that of the nuclear
genome. Brown et al. (1982) estimated the mtDNA genes of hominoid primates
evolve five to ten times faster than single copy nuclear genes. However the rates
determined for primates cannot be used as indicative of other mammals due to a
graded decrease in evolutionary rate in the descent of the simian primates (Bailey
et al., 1991). Increased rates of mtDNA evolution are also reported in
rodents and frogs (Moritz et al., 1987). However, lower rates (two times for
Drosophila) and an equal rate (for sea urchins) have been reported (Solignac et
al., 1986; Smith, 1988). MtDNA is maternally inherited, and as a consequence it
offers great benefits as a genetic marker. While nuclear DNA can introgress
through male or female mediated hybridization between species or populations,
mtDNA is transmitted only by the female (Avise and Lansman, 1983).
The value of mtDNA as a phylogenetic tool can further be exemplified by
4
its sensitivity to two prominent factors in speciation: population subdivision and
population growth (Avise et al., 1988). In subdivided or rapidly expanding
populations, localized retention of variable mtDNA genotypes will aid in
establishing polymorphism among the resultant daughter species/populations. The
degree of mtDNA polymorphism within a species is reflected by the degree of
gene flow resulting from dispersal between subdivided populations.
To date, work has been done relating the structuring of the mtDNA
genome of populations, closely related species, and hybrid populations (Table 1).
The inclusion of mtDNA into a suite of characters for a phylogenetic analysis
contributes an independent genetic system that, while linked to the nuclear
genome due to split production of gene products integral to the electron transport
chain and ATP synthesis, evolves at its own unique rate and lacks the complicated
features of introns, repetitive DNA, and recombination found in the nuclear
genome. Although chromosomal and allozymic methods target the nuclear
genome, they are uncoupled with regard to the level of evolution and information
they can provide. The strictly maternal mode of inheritance of the mitochondrial
genome also contributes greatly to the sorting processes needed for establishing
lineages (Neigel and Avise, 1986).
Characteristics of the mitochondrial genome lead to the proposal of several
possible outcomes for a speciation event, dependent upon the geographic origin of
samples of the gene pool involved in the speciation event and the degree of
isolation provided by a vicariance barrier. If random populations within a parent
5
species are isolated by a speciation event, the population of mtDNA within the
daughter species would exhibit paraphyletic status for an extended number of
generations. However, if there is some degree of geographic sorting and
differentiation of individuals at the extremes of the parental range, monophyletic
status is achieved in relatively fewer generations (Neigel and Avise, 1986).
Testing of theoretical concepts such as these that have been obtained by computer
simulations relies on studies which employ several independent genetic markers
across a broad range of taxonomic levels. Studies, such as those on Drosophila
(Solignac et al.,1986; Latorre et al., 1988), Lepomis (Avise and Saunder, 1984),
Onychomys (Riddle, 1990), and Peromyscus species groups (De Walt et al,
submitted; Avise et al., 1983, Zimmerman et al., 1978) have addressed the level of
single generation daughter species formation. Additional studies on levels of
genetic differentiation between named species-groups and higher levels of
organization which reflect possible evolutionary affinities would increase
understanding of the long term changes in the overall genome accompanying
speciation during the development of a species assemblage, in addition to
formulating a phylogenetic test of existing taxonomic arrangements.
A common point of difficulty encountered in addressing phylogenetic issues,
with regard to taxonomy, revolves around species concepts and the definition of
species and other nomenclatoral categories. The most popularly held of the
modern species concepts is the biological species concept. Biological species, as
defined by Mayr (1969), are "groups of interbreeding natural populations that are
Table 1. Distribution of estimates of mitochondrial DNA sequence
divergence (S of Nei and Li, 1979) across various taxa.
Taxa S Source
Intraspecific
Geomys pinetis 0.034 Avise et al., 1979
Rattus 0.05-0.09 Baverstock et al., 1983
Peromyscus sp. 0.002-0.059 Avise et al., 1983
Odocoileus virginiana 0.014 Carr et al., 1986
Clethrionomys glareolus 0.008-0.01 Tegelstrom, 1988
C. rutilus 0.127 Tegelstrom, 1988
Lepomis macrochirus 0.075 Avise and Saunder, 1984
L. cyanellus 0.014 Avise and Saunder, 1984
Artibius jamaicensis 0.004 Pumo et al., 1988
A. j. jamaicensis -
A. j. schwartzi 0.092-0.105 Pumo et al., 1988
Ursus americanus 0.012 Zimmerman, unpubl.
Interspecific
Mus sp. 0.05-0.14 Ferris et al., 1983
Rattus sp. 0.16 Baverstock et al., 1983
Lepomis sp. 0.206* Avise and Saunder, 1984
Clethrionomys sp. 0.139 Tegelstrom, 1988
Peromyscus sp. 0.02-0.16 Avise, 1986
Apodemus sp. 0.10 Tegelstrom, 1988
Spermophilus sp. 0.028-0.075 MacNeil and Strobeck, 1987
Drosophila sp. 0.02-0.097 Solignac et al., 1986
* This value represents a median value due to the biasing effect values of >. 1.0 have on an arithmetic mean.
reproductively isolated from other such groups". This concept relies heavily on
demic gene flow as a cohesive factor for maintainance of specific boundaries, but
is inflexible with regard to cases of secondary contact and chance hybridization,
which would be judged as evidence for incomplete speciation. Although very
useful, the biological species concept lacks a structural framework with which
closely related taxa can be examined with regard to their evolutionary
relationships.
During this study the evolutionary species concept will be the foundation
for assessing specific rank and designation. The evolutionary species concept
(Simpson, 1961) can be regarded as an appropriate bridge principle (Hempel,
1966) in the study of evolutionary process with regard to pattern of descent.
Wiley (1978) defines an evolutionary species as "a single lineage of ancestor-
descendant populations which maintains its identity from other such lineages and
which has its own evolutionary tendencies and historical fate." A corollary of this
concept states that a phylogenetic tree is actually composed of evolutionary
8
species, and that all terminal taxa and linkages between terminal taxa are species
(Wiley, 1981). This concept, however, also dictates that species must be
reproductively isolated from each other, such that they maintain separate
identities, tendencies, and fates. This requirement again brings up the difficulties
when secondary contact and hybridization are encountered. Simpson (1961),
however, clarifies the context in which hybridization should be taken with regard
to the evolutionary species concept: "the important question is not whether two
species hybridize, but whether two species do or do not lose their distinct
ecological and evolutionary roles. If, despite some hybridization, they do not
merge, then they remain separate species in the evolutionary perspective."
The term cryptic species will be used throughout this manuscript in
replacement of the terminology "sibling species" introduced by Mayr (1942).
Cryptic species are morphologically similar or identical species that represent
reproductively isolated gene pools that may or may not be closely related
evolutionarily. The term "sibling" has a connotation referring to closely related
taxa, possibly to be confused with "sister species" or "sister groups" which refers to
species that hypothetically share a genealogical common ancestor.
Neotoma as a model of speciation.- American woodrats of the Genus
Neotoma provide an excellent model for the study of genetic differentiation
accompanying the speciation process. The genus has been divided into five
subgenera, Neotoma, Hodomys, Homodontomys, Teonoma, and Teonopus,
comprising twenty-one recognized taxa (Goldman, 1910; Hall, 1981; Ryckman et
9
al., 1981) (Table 2). Within the subgenus Neotoma, there are several "species-
groups" and nominal taxa which are comprised of species and populations at
various levels of differentiation, from reproductively isolated forms to those which
are largely allopatric but hybridize in narrow zones of contact (Birney, 1976;
Huheey, 1972). The other four subgenera represent monotypic forms.
Woodrats are considered to be members of the cosmopolitan rodent family
Muridae, belonging to the New World subfamily Sigmodontinae (Carlton, 1980).
The earliest fossil record of Neotoma is from the middle Hemphillian (Late
Miocene), approximately 6.6 million years ago (Dalquest, 1983). Neotoma ranges
over much of North and Central America, with the center of its distribution lying
in northern Mexico (Carleton, 1980) (Figure 1-6). Although the group is thought
to have had a South American origin, two taxa have ranges extending north into
New England and the Yukon Territory {Neotoma magister and Neotoma cinerea,
respectively). The southernmost limit of the genus is in Nicaragua, represented by
N. chrysomelas (Hall, 1981). The majority of species are associated with more
xeric desert/grassland and montane biomes. Woodrats tend to be dietary
generalists when associated with plant communities of high species diversity
(Vaughan, 1990). When associated with plant communities of low species
diversity, they tend to be dietary specialists, as is the case when several woodrat
species are found in sympatry (Dial and Czaplewski, 1990).
Woodrats are medium sized, long-tailed rodents attaining adult weights of
approximately 100-400g. The molariform teeth are prismatic and flat-crowned,
10
Table 2. Taxonomic arrangement of the Genus Neotoma and related
genera (Carleton, 1980; Goldman, 1910; Hall, 1981; Ryckman et al., 1981).
(• denotes taxa included in this study).
subgenus Neotoma
-floridana species-group — - mexicana species-group ~
Neotoma floridana • Neotoma mexicana
Neotoma magister Neotoma chrysomelas
Neotoma micropus -- unassigned species -
Neotoma albigula Neotoma goldmani
Neotoma varia • Neotoma stephensi
Neotoma nelsoni • Neotoma fuscipes
Neotoma palatina subgenus Teonoma
Neotoma angustapalata • Neotoma cinerea
lepida species-group -- subgenus Teonopus
Neotoma lepida • Neotoma phenax
Neotoma devia
Neotoma anthonyi Hodomys alleni
Neotoma bryanti • Xenomys nelsoni
Neotoma bunkeri Ototylomys phyllotis
Neotoma martinensis
11
£•] N. magister
| | N. ffoddana
M mtcropus
• N. steptensf
N. anQustfpaiata kUomettra 0 200 400
-40
20
Figure 1. Geographic distribution of Neotoma floridana, N. magister, N.
micropus, N. stephensi, and N. angustapalata.
12
N. aid/gum
H. alien f
kilometers
0 200 400
-30
- 2 0
Figure 2. Geographic distribution of Neotoma albigula, and Hodomys
(Neotoma) alleni.
13
*
N. fusc/pes
N. mexicana
N. chrysomefas
kilometers
0 200 400
Figure 3. Geographic distribution of Neotoma fuscipes, N. mexicana, and N.
chrysomelas.
14
f
a
b c
d
— 40
N. devia
N. iep/da
N. /. intermedia
N. anthonyi
N. martinensis
N. bryanti
N. bunkeri
— 30
kffometers
200 400
Figure 4. Geographic distribution of members of the Neotoma lepida species
group.
15
N. c/nerea
J-l kifometers
0 200 400
Figure 5. Geographic distribution of Neotoma cinerea.
16
H Xenomys nelson!
£3 Ototyfomys phyHotis
Q Neotoma phemix
j<3 Neotoma goktmanf kifomifrs 0 200 400
Figure 6. Geographic distribution of Neotoma goldmani, N. phenax, Xenomys
nelsoni, and Ototylomys phyllotis.
17
and the caecum is well inflated, features that would be expected in rodents
associated with a fibrous diet of low nutritional value (Fitch and Rainey, 1956;
Vorhies and Taylor, 1940). Pelage is typically soft and ranges in coloration from
pale buff among desert dwellers to dark russet among inhabitants of more mesic
or semitropical habitats (Hall, 1981; Vaughan, 1990). Woodrats are long lived in
comparison to other small rodents, with lifespans of three to five years being
reported (Feldman, 1935; Finley, 1958; Fitch and Rainey, 1956; Linsdale and
Tevis, 1951). The group, as a whole, is noted for its construction of conspicuous
dens ranging in size from a small accumulation of sticks and debris among rocks
or cacti to large collections of material several cubic meters in volume. These
dens serve as buffers against temperature extremes and safe refuge from
predators (Finley, 1958; Vaughan, 1990). Dens may be accumulations of material
deposited over several generations of a species or of alternating species occupying
the den over time (Dial and Czaplewski, 1990; Finley, 1958, 1990). These
middens have been examinrd extensively by paleoecologists due to the well
preserved fossil plant and animal materials obtainable from them (Spaulding,
1990, 1983; Thompson and Hattori, 1983, 1990; Van Devender, 1973, 1990a,
1990b).
The systematics of the genus Neotoma has received some attention throughout
the 1900's, originating with Goldman's (1910) revision of the genus. Several
putative taxa have since been synonomyzed once more precise information on
species ranges became available. Most of the systematics of the group is based on
18
external phenotypic and cranial characteristics, but several attempts have been
made to add new characters which would better segregate the sometimes
confusing taxa. Most notably used were the male accessory organs, the baculum,
and glans penis (Burt and Barkalow, 1942; Hooper, 1960). Due to the nature of
these structures and the link that has been made in their importance as
mechanisms of reproductive isolation, the current systematic arrangement of the
genus is based on these characters (Carleton, 1980).
Within the subgenus Neotoma, there has been increased interest recently in
establishing proper evolutionary histories for the members of the N. floridana and
N. lepida species groups. Members of the former group have been addressed with
craniometric and allozymic studies (Anderson, 1969; Birney, 1973; Zimmerman
and Nejtek, 1977). Three species in this group, N. floridana, N. micropus, and N.
albigula, are reported to represent the classic definition of semispecies proposed
by Mayr (1963). They appear to have been isolated in the past and have recently
established secondary contact in parts of their ranges. Hybridization between N.
micropus and N. albigula has been reported at locations at the northern limits of
both species' ranges in southeastern Colorado and western Oklahoma (Birney,
1976; Huheey, 1972). However, over most of their ranges where these two species
are sympatric, they appear to maintain their genetic integrity by habitat
separation.
Neotoma floridana has been reported to hybridize with N. micropus at a single
locality in northern Oklahoma where the two species are sympatric (Birney, 1973;
19
Spencer, 1968). Birney (1976) describes this as a case of stasipatric distribution
(Key, 1968), where impaired fecundity of hybrids rather than ecological
competition is the major factor preventing broad species overlap. However, at a
sympatric locality in south-central Texas, Dalbey (1980) found no evidence of
hybridization between these two species.
Within the N. floridana group, there has recently been considerable debate as
to the status of the northeastern subspecies, N. f . magister. Goldman (1910)
recognized this taxon as a species belonging to the "pennsylvanica" group of the
subgenus Neotoma. His separation of this group from the N. floridana group has
often been interpreted to mean that they are distantly related. Based on bacular
and craniometric studies, N. magister was relegated to subspecific status under N.
floridana (Burt and Barkalow, 1942; Schwartz and Odum, 1957). However,
attempts to mate this subspecies with other subspecies in N. floridana were
unsuccessful, leading Birney (1976) to suspect that N. f . magister and N. floridana
are cryptic species that maintain separate gene pools. Recently, Hayes (1990)
studied allozymes, morphology, and mtDNA of N. floridana from eastern North
America and found significant differences between N. f . magister and other
members of N. floridana, supporting the validity of N. magister as a valid species.
The taxonomy of woodrats in the Neotoma lepida group has also been
addressed recently. Chromosomal studies of N. lepida revealed a 2N = 52
karyotype for the species, with marked variability in the autosomal arm number in
populations east and west of the Colorado River in Arizona and California
20
(Mascarello and Hsu, 1976). Variations in allozymes, differentially stained
chromosomes, penile morphology, and cranial characters are concordant,
indicating the two chromosomal races represent cryptic species. In comparisons of
the bacula and glans penes, N. I intermedia, a western coastal subspecies,
possesses significantly different characters compared to those of inland desert
woodrats (Mascarello, 1978; D. Huckaby, pers. comm.). Although allozymic
markers verified the distinctness of this form, Mascarello (1978) did not address
the issue in his study. The evidence provided by this karyotypic and allozymic
study, however, has been questioned based on a morphometric analysis of these
taxa in Arizona (Hoffmeister, 1986).
Various levels of speciation represented by the Genus Neotoma have yet to be
studied. As demonstrated above, the evolutionary history of even the most well
studied forms remains questionable. The relationships of other well differentiated
species such as N. stephensi and N. mexicana to other members of the subgenus
Neotoma have yet to be clarified, as are the relationships of several endemic
island forms to their presumed mainland counterparts. On a larger scale, the
validity of and relationships among the five subgenera within the genus Neotoma,
along with their position within the family Muridae, has received only minor
attention (Carleton, 1980).
OBJECTIVES
The objective of this study is to determine the degree of nuclear and mtDNA
21
differentiation among members of the genus Neotoma and use the resultant data
base in a phylogenetic analysis of the group. From this data base, the degree of
genetic change accompanying the speciation process can be estimated across
several levels of organization, i.e., between subspecies, semispecies, cryptic species,
members of species-groups, and between species-groups and subgenera within the
genus. By considering as many of the species as possible within an assemblage
such as Neotoma, the genetic changes accompanying speciation can be correlated
with cladogenesis of the several levels of organization presented by their
taxonomy. These data will be employed in a phylogenetic analysis to determine
the evolutionary relationships of the members of this group and with closely allied
members of the family Muridae, which will serve as outgroups. Four major null
hypotheses will be tested during this study (see Materials and Methods for
specifics).
Hypothesis 1: Differentiation of the mitochondrial genome is not concordant with
that found in the nuclear genome. This hypothesis will be rejected if levels of
differentiation of the nuclear genome differ significantly from restriction site
differentiation of the mtDNAs of the various species. This will be accomplished
by converting mitochondrial restriction site and allozymic data into matrices of
genetic distance measurements which can be analyzed statistically.
Hypothesis 2: No relationship exists between the degree of differentiation of the
mitochondrial genome and levels of speciation. Hypothesis 2 will be rejected if
levels of mtDNA sequence divergence increase significantly in an orderly fashion
22
as pair-wise comparisons are made ranging from closely-related to more distantly
related taxa. Should this hypothesis be rejected and a pattern of increasing
sequence divergence be found as higher taxonomic levels of organization are
crossed, a careful examination of the phylogenies which result from cladistic and
phenetic analyses of the data and a study of the fossil record will be employed to
develop a time frame for the evolutionary separations of the various groups and
species. A reasonable estimate of the unique rate of molecular evolution with
regard to the mitochondrial genome can be developed from which estimated times
of divergence of the mitochondrial genomes can be compared against the fossil
record and biogeographical events which may have been responsible for lineage
splitting.
Hypothesis 3: Rates of differentiation of the nuclear and mitochondrial genomes
do not differ. Hypothesis 3 will be rejected if significant deviations between the
rates of differentiation of the nuclear and mitochondrial genomes are detected
among the various taxa. These results can be compared to data already published
on hominoid primates (Brown et al., 1982; Smouse and Li, 1987), other
vertebrates, and invertebrates (reviewed in Moritz et al., 1987).
Hypothesis 4: Rates of mtDNA differentiation do not differ among the taxa in
this assemblage. Hypothesis 4 will be rejected if significant differences in log-
likelihood values based on time-depth estimates are found among comparisons of
the clades described by the phylogenetic analysis. Heterogeneity in the rates of
mtDNA evolution between the various taxa of Neotoma could obscure proper
23
lineage relationships. Felsenstein (1985) demonstrated that if events of parallel
evolution occur in greater number than unique or nonreversible changes,
parsimony analyses can suggest incorrect topologies as the number of characters is
increased.
In addition, the monophyletic status of the members of the genus Neotoma
will be tested by outgroup analysis with members of closely related taxa. The
phylogenetic relationships among the members of the genus Neotoma derived
from this analysis will be tested against phylogenies presented from strictly
morphological studies (Carleton, 1980; Hoffmeister, 1986).
CHAPTER II
METHODS
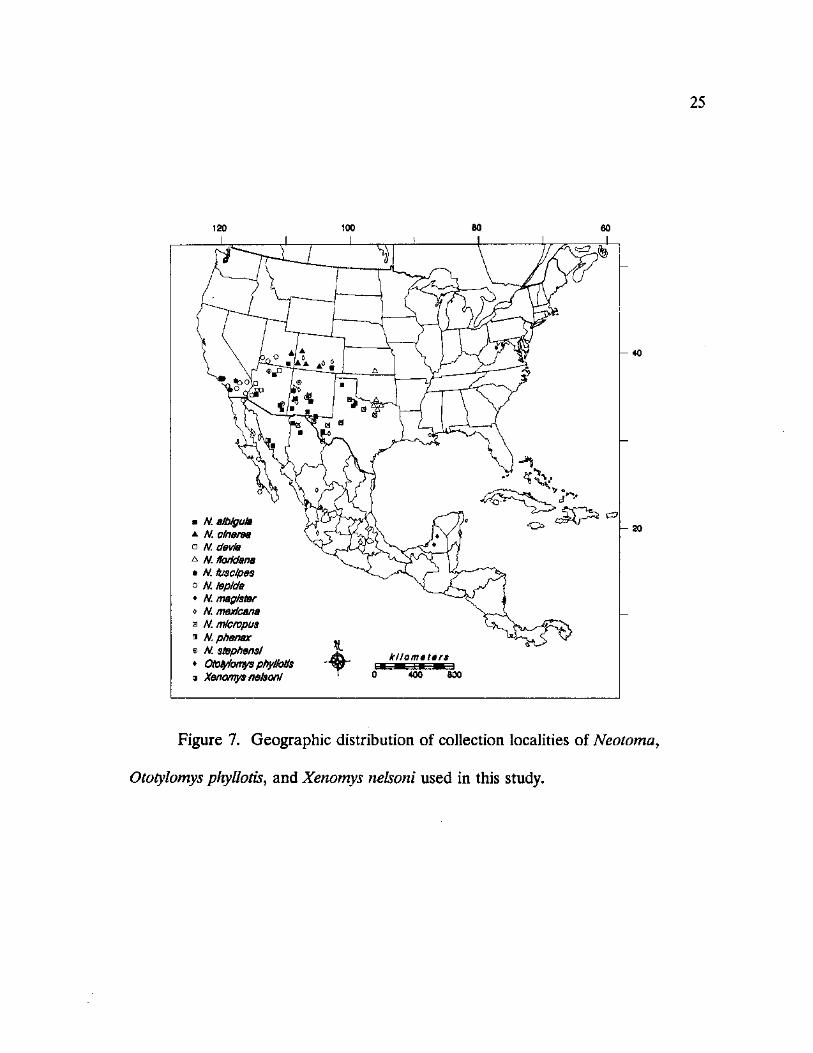
Collection of specimens.-Woodrats (n=257), representing 11 of the 21 named
species of Neotoma (see Table 2), were collected throughout their ranges (Figure
7) using Sherman™ and Tomahawk™ livetraps following the guidelines for
acceptable field methods approved by the American Society of Mammalogists
(Committee, 1987). Additionally, tissue samples of 51 individuals representing
eight species of Neotoma, three samples of Xenomys nelsoni, and five samples of
Ototylomys phyttotis were obtained through the assistance of several collectors.
Specific locality, sample size, and specimen information are provided in Appendix
I.
Animals were prepared as standard museum skin and skull, skin and
skeleton, full skeletons or fluid preserved specimens and will be deposited in the
mammal collection of the Carnegie Museum of Natural History, Pittsburgh, PA
(CM). Additional specimens are deposited at the following institutions: Museum
of Southwestern Biology, University of New Mexico (MSB), The Museum, Texas
Tech University (TTU), Los Angeles County Museum (LACM), Angelo State
Natural History Collection (ASNHC), and University of Vermont (UV). Heart,
liver, kidney, and muscle tissues were removed and placed in liquid nitrogen until
24
25
N. aibigula a N. cinema • N. devia A N. florktana
N. fusdpes o N. • N. magister o N. mexfcana a N m/cropus • N. phenax © N. Stephens! • Ototyfomys phyl/otfs <$ Xenomys nelson!
kilometers
0 400 800
Figure 7. Geographic distribution of collection localities of Neotoma,
Ototyfomys phyllotis, and Xenomys nelsoni used in this study.
26
they could be stored in an ultracold freezer (-80° C) prior to DNA isolation.
Karyotypes of selected individuals and populations were prepared following a
modification of the technique of Lee and Elder (1980) (Appendix II). Accessory
collections, such as parasites, preserved glans penes, karyotypes, and tissue
samples were retained for later use or sent to corroborating specialists.
Mitochondrial DNA was extracted according to four different procedures
throughout the course of this study, dependent on the type of sample available,
and the amount and purity of mtDNA required.
Isolation of mtDNA.--During the early phase of the study, mtDNA was
isolated following the procedure developed by Zimmerman et al. (1988)
(Appendix III). Standard sucrose gradient methodology was used to isolate a
relatively pure mitochondrial fraction. The mitochondrial suspension was treated
with DNAase I to reduce background contamination caused by nuclear DNA.
Following incubation and pelleting of the mitochondria, the action of DNAase was
arrested by treating the mitochondria with Proteinase K and SDS (sodium dodecyl
sulphate). Extraneous proteins were extracted through a series of treatments with
buffered phenol, phenolxhloroform, chloroform, and hydrated ethyl ether. The
mtDNA was then ethanol precipitated and used in subsequent restriction enzyme
digests. Fragment profiles from these digests were visualized by electrophoresis in
0.7% and 1% agarose gels. Gels were stained in ethidium bromide (0.5 Mg/ml) for
15 min. Excessive fluorescence was removed from the gel medium by destaining
27
in 1 mM MgS04 for up to one hour. Resultant gels were visualized under
ultraviolet light (300 nm) and photographed with Polaroid T-55 film. This
technique was employed when several samples from a population were being
tested to determine levels of intraspecific polymorphism.
Purified mtDNA for restriction mapping was isolated employing a
modification of the techniques of Lansman et al. (1981) (Appendix IV). The
procedure involved homogenization of the tissue and isolation of a fairly purified
mitochondrial fraction. The mitochondria were then lysed and subjected to
cesium chloride (CsCl) density gradient ultra-centrifugation which separated the
covalently closed, circular mtDNA from nuclear DNA (nDNA), RNA, protein,
and glycogen. The DNA was visible under UV illumination as fluorescent bands,
and the bands of mtDNA were removed with a hypodermic needle. For samples
of rare or difficult-to-obtain species, the nuclear DNA was also retained. The
DNA was prepared for restriction analysis by removing the ethidium bromide
through 1-butanol extractions, followed by dialysis against TE (0.01 M Tris-HCl,
0.5 mM EDTA, pH 8.0) to remove the CsCl (Maniatis et al., 1982).
A rapid alkaline-lysis technique, adapted from the procedures of Tamura
and Aotsuka (1988) (Appendix V) was implemented when small quantities of
mtDNA from several individuals from a population were under investigation to
determine species identities from populations suspected of containing sympatric
individuals of cryptic species.
Total genomic DNA was isolated for mtDNA analysis from samples of
28
Xenomys nelsoni following a modification of Maniatis, et al. (1982) (Appendix VI).
These samples consisted of approximately 0.3 g of muscle tissue for which other
isolation techniques are inappropriate.
Restriction analvsis.--The following 17 restriction endonucleases, purchased
from Stratagene (La Jolla, CA), New England Biolabs (Beverly, MA), and Gibco
BRL (Gaithersburg, MD), were used in the analysis: Apa I, Ava I, Bam HI, Bgl I,
Bgl II, Bsp 106, BstE II, ZfcfN I Dra I, Eco RI, Eco RV, Hinc II, Kpn I, Pst I, Pvu
II, Sal I, and Stu I. Single and double restriction digestions were carried out on
approximately 0.05 /xg of DNA in a total volume of 100 jliI, according to the
manufacturer's recommended temperature and buffer composition.
Following digestion, the mtDNA was precipitated in three volumes of ethanol
and 30 /il of 3 M sodium acetate, pH 5.2 (Maniatis et al., 1982) and dried in vacuo
in a Savant Speed Vac™ (Savant Instruments, Inc., Farmingdale, NY). Following
reconstitution with sterile H 2 0 and carrier dye (0.25% bromophenol blue, 0.25%
xylene cyanol, 15% Ficoll-type 400 in water) (Maniatis et al., 1982), the mtDNA
fragments were separated by molecular weight using agarose gel electrophoresis.
Electrophoresis was carried out on 0.7%, 1.0%, or 1.2% agarose gels (Gibco BRL,
Gaithersburg, MD) overnight at 32 volts or for approximately 6 hours at 65 volts
in 1 X TBE (0.089 M Trisma, 0.089 M Boric acid, 0.002 M EDTA, pH 8.0).
Three different size standards were used throughout the study to obtain estimates
of DNA fragment sizes. Lambda phage DNA digested with Hind III, a Hind
29
III/Eco RI double digest, and a DNA Analysis Marker System (Gibco BRL,
Gaithersburg, MD; cat. no. 4401SA) was run on each gel as a molecular weight
standard.
Visualization of mtDNA.--MtDNA fragments were visualized through
modifications of Southern hybridization (Southern, 1975) with recommendations
by DuPont (Boston, MA) for their GeneScreenP/ws™ nylon (Appendix VII).
Denatured DNA was transferred onto Magna NT™ nylon (Micron Separations
Inc.) and then immolilized by UV (254 nm) crosslinking.
Evan Hermel (Southwestern Medical University, Dallas, Texas) kindly
provided the cloned mitochondrial genome of Mus domesticus (New Zealand
Black Strain) which was used as a mtDNA probe. The mtDNA genome is
contained in four pUC18 plasmids, with mtDNA fragment sizes of approximately
7.2, 5.0, 2.7, and 1.0 kilobase (kb) pairs. Purified recombinant DNA was isolated
according to the technique described by Tanaka and Weisblum (1975) (Appendix
VIII).
During the course of the study, two different probe labeling procedures
were employed. Initially, the four mtDNA probes, along with the molecular size
standard, were labeled with 32P-dCTP, 3000 Ci/mmol (DuPont, Boston, MA) in a
random primed labeling reaction (Boehringer-Mannheim, Germany) (Appendix
IX) . During the latter part of the study, The Genius™ non-radioactive
Digoxigenin labeling system (Boehringer-Mannheim, Germany) was employed
30
(Appendix IX). The Genius™ system, in conjunction with Lumiphos™ 530
(Lumigen, Inc., Detroit, MI) provided a safer and more rapid method of
visualizing DNA restriction fragments with equal or greater sensitivity than that
obtained using 32P-labeled probes. In both cases, hybridization was carried out
overnight at 65° C in a shaking waterbath or Hybridizer™ Hybridization Oven
(Techne, Inc., Princeton, NJ). Filters were then washed and prepared for
visualization, as outlined in Appendix IX for the specific method being employed.
The filters were then exposed to x-ray film (X-OMAT AR, Eastman Kodak
Company, Rochester, NY) from 2-48 hours depending on probe system used.
Filters visualized with 32P-labeled probes employed a Cronex™ Quanta III
intensifier (DuPont, Boston, MA) to improve band visualization.
Restriction site mapping.~The restriction sites produced by each enzyme for a
mtDNA sample were mapped with regard to position relative to one another
based on the results of double restriction digests. Restriction site positions were
denoted based on a conserved Bgl I site which was designated as "0.0". Fragments
of approximately 0.25 kilobase pairs (kbp) were resolved with the techniques
employed. Due to limitations in the accuracy of determining fragment sizes,
restriction site positions were determined within an estimated range of 0.2 kbp.
Restriction sites were considered to be homologous on the different maps if the
sites mapped within a 0.2 kbp region for the taxa in question. Side-by-side
comparisons of double restriction digests for different species were used when
31
necessary to confirm the homology of map positions.
Allozvme electrophoresis.-Tissues (liver and muscle) were ground in
double-distilled water, centrifuged at 1,000 x g for 10 min. and stored at -80° C.
Starch gels are prepared as 12% suspensions of hydrolyzed starch (1.25:1; Sigma
Chemical Company, St. Louis, MO: Electrostarch Company, Madison, WI).
Electrophoretic techniques followed Selander, et al. (1971), Ayala, et al. (1974),
and Bohlin and Zimmerman (1982).
Proteins representing 24 presumptive structural gene loci were examined as
follows: superoxide dismutase (E.C. 1.15.1.1; SOD), two peptidases, alanine-1-
leucine (E.C. 3.4.11 or 13; P-ALL-1, P-ALL-2 and 1-valyl-l-leucine P-VLL-1, P-
VLL-2), malic enzyme (E.C. 1.1.1.40; ME-1, ME-2), esterase (E.C. 3.1.1.1 ;EST-1,
EST-2, EST-3), a-glycerophosphate dehydrogenase ( E.C. 1.1.1.8; a-GPD-1),
xanthine dehydrogenase (E.C. 1.2.1.37; XDH-1), lactate dehydrogenase (E.C.
1.1.1.27; LDH-1 and LDH-2), phosphoglucomutase (E.C. 2.7.5.1; PGM-1, PGM-2),
6-phosphogluconate dehydrogenase (E.C. 1.1.1.44; 6-PGD), isocitrate
dehydrogenase (E.C. 1.1.1.42; IDH-1 and IDH-2), malate dehydrogenase (E.C.
1.1.1.37; MDH-1 and MDH-2), sorbitol dehydrogenase (E.C. 1.1.1.14; SDH-1),
creatine kinase (E.C. 2.7.3.2; CK-1, CK-2), and hexokinase (E.C. 2.7.11; HK-1).
Alleles were designated alphabetically in order of decreasing mobility, with the
most anodally migrating allele designated "A". In multi-locus systems, the most
anodally migrating protein was designated 1, the second most 2, etc.
32
Computations of allelic frequencies and genetic variation measures were
made using BIOSYS-1 (Swofford and Selander, 1981). Rogers' (1972) genetic
distance was calculated for all paired combinations of populations and species to
determine genetic similarities among Neotoma. A phenogram summarizing
genetic similarities was constructed using the unweighted pair-group method
(UPGMA) clustering procedure using NTSYS-pc (Rohlf, 1988).
Phvlogenetic analysis of data.-Restriction sites generated by the
seventeen restriction endonucleases were coded as presence/absence data and
subjected to phylogenetic analysis using PAUP Version 3.0 (D. L. Swofford,
University of Illinois). Restriction sites can be assigned to three catagories in a
cladistic sense: autapomorphic sites representing sites unique to a single
population or species, pleisiomorphic sites occurring in all populations or species,
and synapomorphic sites present in more than two of the populations representing
shared derived characters. Autapomorphic characters are of value in studies
addressing population structure, but in systematic analyses they only contribute to
increasing branch lengths of cladograms. Invariant, pleisiomorphic characters
convey no information regarding the pattern of cladogenesis. In all analyses
presented here, uninformative autapomorphic and pleisiomorphic characters were
ignored in the data set.
Three different character-type schemes were employed to determine which
analysis and its underlying assumptions are the most appropriate for analyzing this
33
mtDNA data set. Standard analyses were run which considered the restriction
sites as freely reversible Wagner characters. Under this scenario, a gain or loss of
a restriction site has an equal probability of occurrence. This scheme has been
the traditional method employed in phylogenetic analyses dealing with a broad
array of character forms (Wiley, 1981).
Dollo parsimony criteria were also invoked to determine if alternate
phylogenies would be developed if differential character weighting schemes were
employed. Dollo parsimony has been recommended for restriction site data due
to the asymmetry in the probabilities of losing existing restriction sites versus
gaining a new site at a specific location (DeBry and Slade, 1985). Thus, under a
Dollo parsimony scheme, a restriction site is allowed to arise only once during the
course of evolution, however it may be lost as many times as neccessary such that
monophyletic arrangements of the taxa are achieved.
A "Generalized Parsimony" approach was also employed in the data
analyses of the restriction site data. By using the STEPMATRIX option of
PAUP, restriction site gains were given a higher weight than site losses, such that
parallel loss and gain-loss events are preferred over parallel gains and loss-regains
(Templeton, 1983). This procedure avoids some of the prohibitions employed in
strict Dollo parsimony methods (DeBry and Slade, 1985). The forward
transformation 0 = = > 1 was weighted at a factor 3.0, while reversions,
1 = = > 0, were assigned a weight of 1.0. These weighting coefficients correspond
to character weighting schemes suggested for restriction site data by Swofford
34
(1991) and Albert et al. (1991).
Several standard options were selected for use in the PAUP analyses of the
data. Each phytogeny reconduction was performed using the HEURISTICS
option with TREE BISECTION-RECONNECTION (TBR) branch swapping and
ACCTRAN optimization. Heuristic tree searches begin by obtaining the initial
tree by stepwise addition until all taxa have been included. The tree is then
subjected to branch swapping which attempts to find the shortest trees. The TBR
swapping procedure bisects the tree yielding two disjointed subtrees and then
reconnects the subtrees by joining a pair of branches, each from one tree.
ACCTRAN optimization maximizes character-states by preferring reversals to
parallelisms (Swofford and Maddison, 1987). The order taxa input into all tree
building analyses including the bootrapping procedures was varied to avoid
possible bias introduced by the inadvertent association of groups of taxa.
Confidence limits were determined on the various phytogeny
reconstructions by employing the BOOTSTRAP algorithm (Felsenstein, 1985).
This process involved resampling the data set, with replacement, producing a
series of new data sets each of the same size as the original data set. Different
characters were eliminated from each resampling routine, with other characters
being represented more than once. The newly derived data sets were then
analysed cladistically using the three procedures descibed above. Bootstrapping
was conducted in conjunction with the standard options described previously and
produced a majority-rule consensus tree for each analysis. Bootstrap parameters
35
employed throughout the analyses consisted of a random number seed of 2441
and 100 iterations. The output of this analysis produced a listing of how many
times out of 100 replications a particular clade was produced in the analysis. This
method resulted in a robust measure of the level of confidence that can be placed
on a phytogeny produced in the particular analysis.
Three Goodness-of-Fit statistics were calculated by PAUP for each
phylogenetic tree produced in the analyses. These measures are generally
functions of the level of resolution of the consensus tree. The Consistency Index
(CI), ranging from near 0 to 1, provides a measure of how well a particular tree
explains the data, with trees that describe their respective data sets best scoring
closer to 1 (Kluge and Farris, 1969). The Homoplasy Index (HI) calculated by
PAUP is the Homoplasy Excess Ratio Maximum (HERM) developed by Archie
(1989). This index ranges from 0 to 1, with values of 1 representing data sets that
are devoid of identical character transformations evolving independently
(homoplasy). Farris (1989) developed a Retention Index (RI) which describes
how well a character set fits the consensus tree produced. Data sets which fit the
resultant cladogram poorly have retention indices approaching 0. Uninformative
characters contribute an undefined component to the retention index.
Until recently, the use of cladistics to construct phylogenetic trees from
electrophoretic data has been controversial, since there are no generally accepted
methods of data transformation for allele frequencies as continuous characters
(Buth, 1984; Swofford and Berlocher, 1987). For the allozyme data, character
36
coding which treated the presence or absence of each allele as a binary character
was employed. This data set was then subjected to Wagner parsimony analysis
using PAUP employing the same options described for the earlier analyses. These
data were also analysed using the approach of Swofford and Berlocher (1987)
(FREQPARS) which accounts for the frequencies of the various alleles. This
method appears to negate the difficulties of various other parsimony methods of
constructing cladograms from electrophoretic data.
Phenetic analysis of data.-Distance matrices were constructed consiting of
pairwise comparisons of the estimated level on nucleotide sequence divergence (6
of Nei and Tajima, 1983) for the mitochondrial genome, and Rogers Modified
Distance for the allozyme data set for the 13 taxa included in this study.
Phenograms were constructed using the unweighted pair-group method (UPGMA)
clustering procedure of NTSYS-pc (Rohlf, 1988).
A statistical test for the presence of a molecular clock was conducted by
subjecting the 6 matrix obtained from the mitochondrial DNA restriction sites to
two analyses, FITCH and KITSCH, of the PHYLIP program (Felsenstein, 1986).
FITCH fits a tree using the Fitch-Margoliash method allowing the branch lengths
to be unconstrained. KITSCH, by contrast, assumes that an evolutionary clock is
in effect, holding the branch lengths from the root to each terminal taxon equal,
which, in effect, means that the expected amount of evolution in any lineage is
proportional to the elapsed time (Felsenstein, 1986). Both analyses yielded sum
37
of squares estimates for the phylogenies which were used to calculate an F
statistic. A statistically significant F value would suggest the presence of a
molecular clock.
Congruence of mitochondrial and nuclear genome differentiation was tested
by subjecting the distance matrices produced by the phenetic analysis (Table 5) to
Mantel Analysis (Mantel, 1967) with a matrix correlation coefficient (approximates
a Normalized Mantel Statistic Z) greater than 0.9 representing significant
correlation.
CHAPTER III
RESULTS
General.-Thirty-seven unique mitochondrial haplotypes were found among
the thirteen woodrat taxa analyzed. Mitochondrial DNA restriction mapping
produced a total of 192 characters across all taxa, 141 representing
synapomorphies and 51 representing phylogenetically uninformative characters
(autapomorphies). Approximately 38 restriction sites were mapped for each
species or species variant identified. Appendix VII contains the data matrix
generated from the restriction site mapping procedure and includes a table of
mtDNA restriction sites identifying the location of each site and the corresponding
restriction endonuclease.
Phvlogenetic analysis of the Neotoma floridana species-group.-Four
nominal taxa, N. floridana, N. magister, N. micropus, and N. albigula, included in
the N. floridana species group (see Table 2) were subjected to cladistic analysis
using Ototylomys phyllotis and Xenomys nelsoni as outgroups. Also included were
samples of N. phenax and N. cinerea in a preliminary investigation into the
relationship of subgenera in the cladogenic pattern of speciation of Neotoma.
Seventeen unique mitochondrial haplotypes were observed among N. floridana, N.
38
39
micropus, N. albigula, and N. magister (samples 1-16, and 31 in Appendix VI).
Bootstrapped consensus trees produced by PAUP under the three
character-type criteria were concordant (Figures 8 and 9). Members of the N.
floridana species group formed a well supported clade on each tree, with
bootstrap estimates ranging from 95 to 100 percent. Although Wagner and Dollo
parsimony methods produced consistant trees, the robustness of the bootstrap
estimates derived from the Wagner consensus tree were lower, as a whole, than
those obtained from the Dollo analysis. Tree topologies differed between the
Wagner and Dollo methods primarily in the placement of two distinct N. albigula
clades. The Generalized Parsimony method produced a polytomous grouping of
the entire N. floridana group with little resolution regarding species phylogenies.
Within the N. floridana group, there was a consistent dichotomy between
populations of the white-throated woodrat, N. albigula. The two forms, hereafter
referred to as eastern and western N. albigula, represent populations of white-
throated woodrats from east or west of the Rio Grande River, respectively.
Specimens referable to the two distinct haplotypes, collected on opposite sides of
the river in Sierra and Socorro Counties, New Mexico, and in the vicinity of El
Paso, Texas, confirmed the absence of introgression between the two
mitochondrial haplotypes. Within the clade containing eastern N. albigula, a
dichotomy was found between samples referable to two subspecies, N. a. warreni
and N. a. albigula. Populations of N. albigula sampled from Chihuahua and
Sonora, Mexico are placed on individual branches seperated from the clades
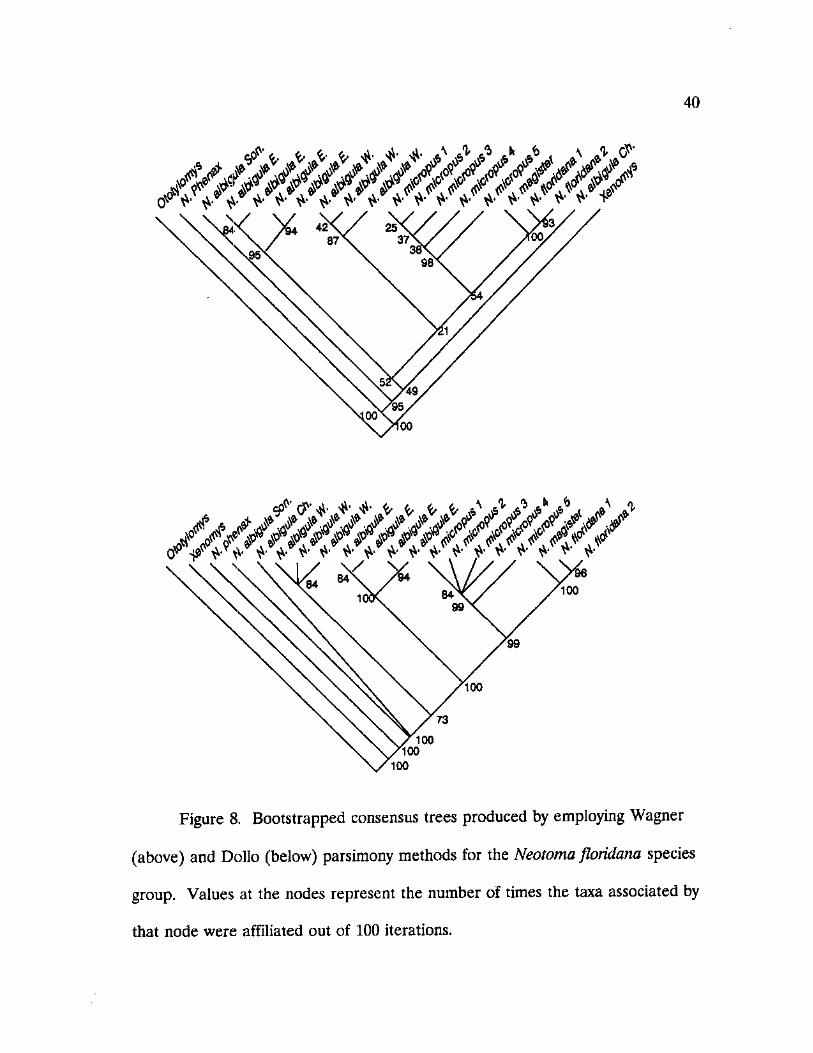
40
100 100
100
Figure 8. Bootstrapped consensus trees produced by employing Wagner
(above) and Dollo (below) parsimony methods for the Neotoma floridana species
group. Values at the nodes represent the number of times the taxa associated by
that node were affiliated out of 100 iterations.
41
w w w w w
Figure 9. Bootstrapped consensus tree produced by employing the
Generalized Parsimony criteria described in the text for the Neotoma floridana
species group. Values at the nodes represent the number of times the taxa
associated by that node were affiliated out of 100 iterations.
42
containing the eastern or western N. albigula groupings in all three analyses
performed. Dollo parsimony methods placed the two samples in an unresolved
clade outside of the clade containing western N. albigula.
Five unique haplotypes were found among populations of N. micropus
representing the highest level of intraspecific variation observed in this study. The
N. micropus clade grouped together at high levels of confidence ranging from 90
to 99 percent depending on the bootstrap analysis performed. The N. micropus
clade was collapsed by both the Dollo and Generalized Parsimony methods, and
confidence in the branching pattern was nonsignificant in the Wagner analysis.
A clade containing N. floridana and N. magister was formed in 100 percent
of the bootstrap replications in all three analyses. Samples of N. floridana from
Texas, Oklahoma, and Kansas formed a separate clade excluding N. magister in
93-96 percent of the bootstrap replications. Neotoma micropus was placed as a
sister taxon to the clade containing N. floridana and N. magister in both the
Wagner and Dollo Parsimony analyses.
Goodness-of-fit statistics were calculated for the three consensus trees
(Table 3), and, based on overall measures of fit, the Dollo phylogeny
reconstruction is the most robust representation of the data. The Dollo method
produced a cladlogram with the highest Homoplasy (HI=0.527) and Retention
(RI=0.897) indices,. Although homoplasy is high in this data set at approximately
43 percent, the stringent character assumptions of the Dollo method may
effectively reduce the impact of homoplasious data in the phylogeny
43
reconstruction. This is especially true with a group of closely related taxa such as
the N. floridana species group, assuming that there has been insufficient time for
very much convergent evolution. The constraint on convergent site gains with
regard to restriction map data, however, may cause certain taxa to be linked by
chance if such gains occur due to the differential probabilities of these changes in
specific enzyme recognition sequences (Templeton, 1983).
Phvlogenetic analysis of the N. lepida species group.-Fifteen populations
belonging to two nominal taxa, N. lepida and N. devia, included in the N. lepida
species group (see Table 3), were subjected to cladistic analysis using Ototylomys
phyllotis and Xenomys nelsoni as outgroups. Also included were samples of N.
phenax and N. cinerea in a preliminary investigation into the relationship of
subgenera in the cladogenic pattern of speciation of Neotoma. Ten unique
mitochondrial DNA haplotypes were observed among the 15 populations
examined (samples 17-26 in Appendix VI).
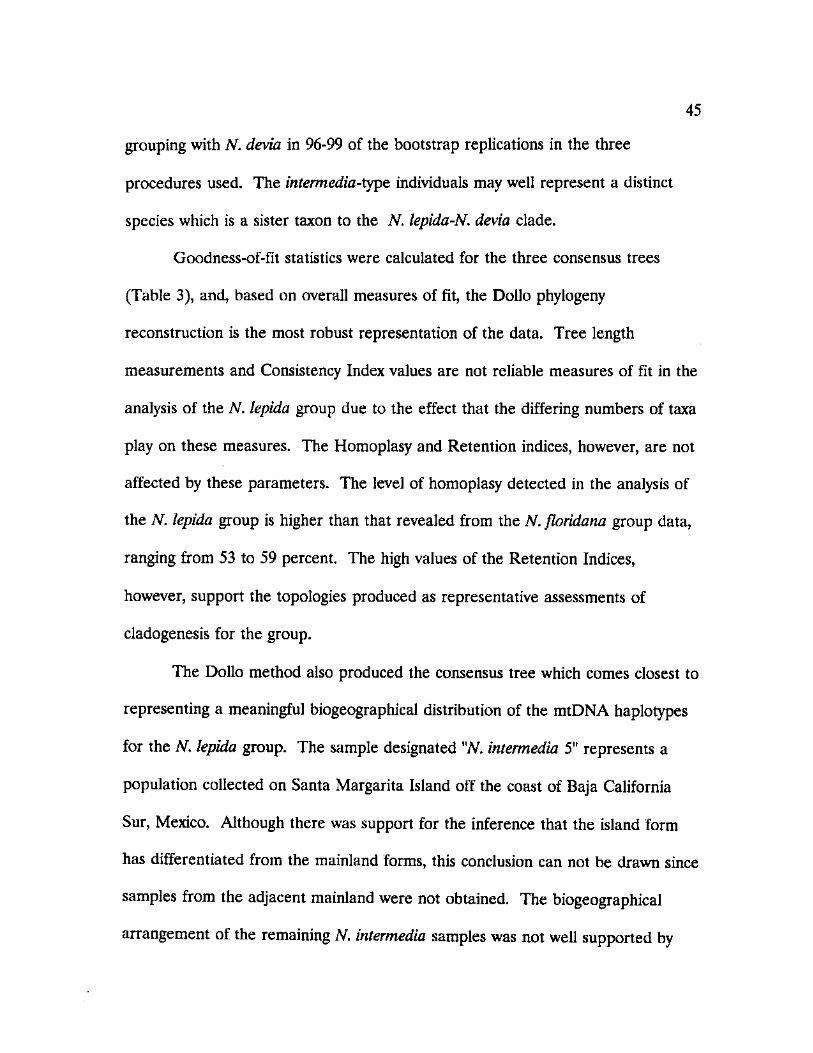
Members of the N. lepida group formed a significant clade with concordant
topologies in all three analyses employed (Figures 10 and 11). Bootstrap
estimates of 98 to 100 percent were obtained for the group using 100 bootstrap
iterations. A significant dichotomy was revealed between populations of N. lepida.
The western U. S. coastal and Baja California populations, referred to here as the
intermedia-type, form a discrete clade removed from remaining populations of N.
lepida. The remaining populations of N. lepida form a sister taxon to N. devia,
44
• o <u N
•i-H 13 f-H <D G <D
o
T3 G cd
0 Q
of G taO
1 Jd* x> CD o 3
O Vh a CO <D
CO P V) a <u CO G O o
CO u
cd +-» CO +->
a
CO GO <D G
T3 O o
O
t o
3 £
CO Ou P O Wh 550
<D 0 <u c x CO Q
I • a . 5S
1
I T3 G cd
! Q
I I CD
43
CO TD O
XJ o3 a & o
T3 <D
. a
2 <t> G <U
o
g * o 6 •fH CO VH cd
Oh
O Q
£ 0
6 "
1/5 >-4 cd
CU *-« 0)
1
CO <D O <D a
CO
a, 3 O M
o CO s o <u Cu
oo
c u D
o O CO <D o <U a GO
cd PL,
C3* o 0
cd Oh
* S ;
t
S3 Si
i I c*<
J ?
<3 e
I
I
o Cu 3 . 2
P S
00 o
CO CX <D
S
a <D
as
*t v c CO Q\ o Tt-Tfr i n d o o
SO ^ t co 00 rH i n 00 d o d
CO a a)
r ^ so
CO P4 <u +-• CO
X
CO t ^ r - C4 as
* n 00 d o d
r - so rH V© so r -i n T f 00 o d d
CO a , <u
i n t o
CO a * <D
CO i n
4=} *
CD <D
* n o
i n as rH © 00
o ©
i n s i n as
* n i > o o d
8 T3 G
M
S
CO G O
o
8 T3
£ cd
a o 6 o X
8 XJ G
HH G .2 *+3 G a> <u Pi
45
grouping with N. devia in 96-99 of the bootstrap replications in the three
procedures used. The intermedia-type individuals may well represent a distinct
species which is a sister taxon to the N. lepida-N. devia clade.
Goodness-of-fit statistics were calculated for the three consensus trees
(Table 3), and, based on overall measures of fit, the Dollo phylogeny
reconstruction is the most robust representation of the data. Tree length
measurements and Consistency Index values are not reliable measures of fit in the
analysis of the N. lepida group due to the effect that the differing numbers of taxa
play on these measures. The Homoplasy and Retention indices, however, are not
affected by these parameters. The level of homoplasy detected in the analysis of
the N. lepida group is higher than that revealed from the N. floridana group data,
ranging from 53 to 59 percent. The high values of the Retention Indices,
however, support the topologies produced as representative assessments of
cladogenesis for the group.
The Dollo method also produced the consensus tree which comes closest to
representing a meaningful biogeographical distribution of the mtDNA haplotypes
for the N. lepida group. The sample designated "N. intermedia 5" represents a
population collected on Santa Margarita Island off the coast of Baja California
Sur, Mexico. Although there was support for the inference that the island form
has differentiated from the mainland forms, this conclusion can not be drawn since
samples from the adjacent mainland were not obtained. The biogeographical
arrangement of the remaining N. intermedia samples was not well supported by
46
\ rt <X • * /
/ / / / / / / / / / / / / /
/ J $
Figure 10. Bootstrapped consensus tree produced by employing Wagner
(above) and Dollo (below) parsimony methods for the Neotoma lepida species
group. Values at the nodes represent the number of times the taxa associated by
that node were affiliated out of 100 iterations.
47
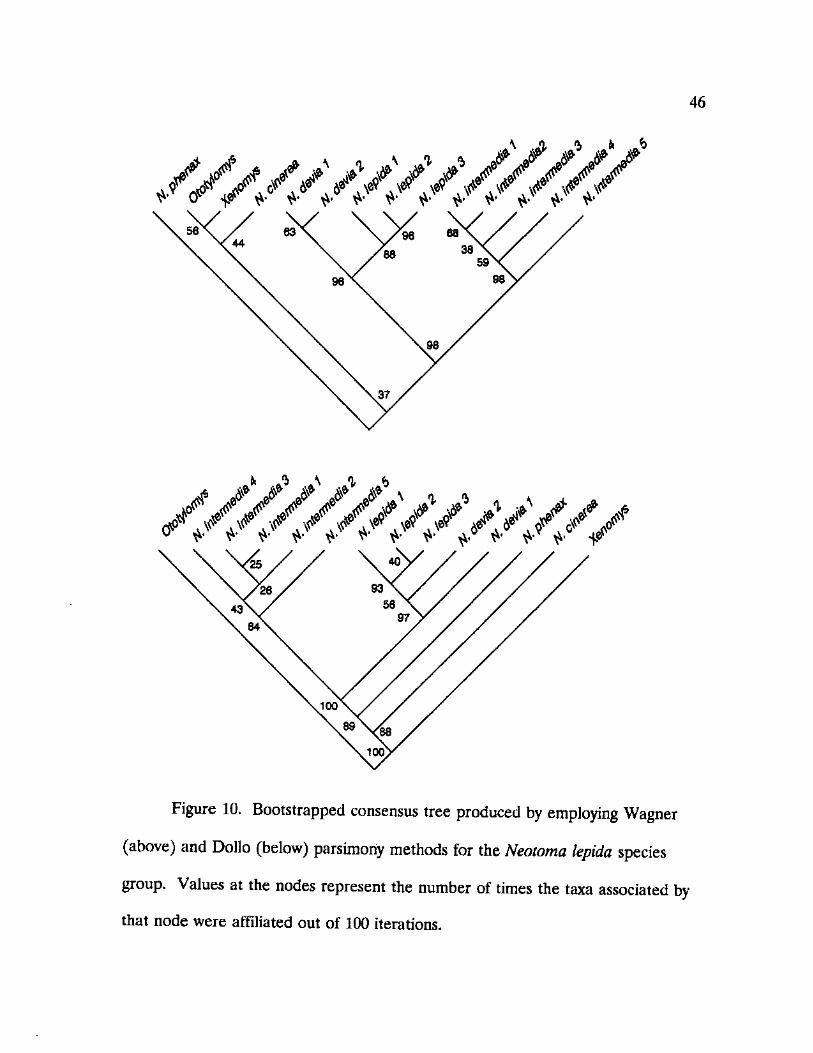
Figure 11. Bootstrapped consensus tree produced by employing the
Generalized Parsimony criteria described in the text for the Neotoma lepida
species-group. Values at the nodes represent the number of times the taxa
associated by that node were affiliated out of 100 iterations.
48
the bootstrap consensus trees produced by any of the methods.
The Generalized Parsimony analysis of the N. lepida group also included
taxa from the subgenus Neotoma, N. mexicana, N. stephensi, and N. fuscipes, in a
preliminary assessment of the validity of the inclusion of the N. lepida group in
this subgenus. Members of the subgenus Neotoma, N. mexicana and N. stephensi,
formed a clade associated with N. phenax of the subgenus Teonopus, which was
removed from members of the N. lepida group. Members of the N. floridana
group were purposely omitted from this analysis to reduce the possibility of
confusion caused by homoplasy. These taxa were included in later analyses
conducted on the entire genus. Neotoma fuscipes was placed in a clade with N.
cinerea of the subgenus Teonoma.
Phvloeenetic assessment of the Genus Neotoma.-The relationships of the
subgenera and species groups within the genus Neotoma were cladistically
analyzed using mtDNA restriction site data and allozyme data. The latter were
coded with alleles serving as binary characters and using FREQPARS which
utilized allele frequencies (Swofford and Berlocher, 1987). The mtDNA
restriction site and binaiy coded allozyme data sets were also combined in a final
analysis to generate a phylogeny for the group. Fourteen OTU's were created
from the set of 35 mtDNA haplotypes found among the eleven nominal woodrat
taxa by collapsing nonsignificant or zero branch lengths. This procedure, in effect,
49
masks intraspecific variability without affecting species level resolution. Ototylomys
phyllotis and Xenomys nelsoni served as outgroups for the analysis.
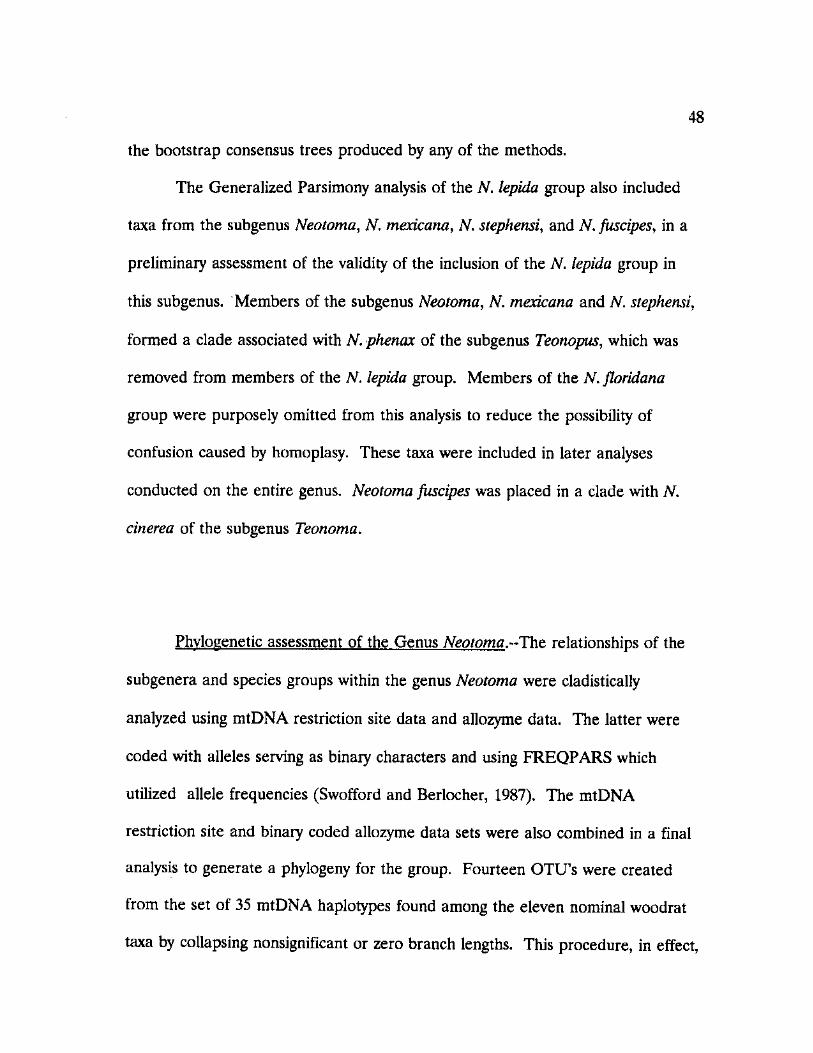
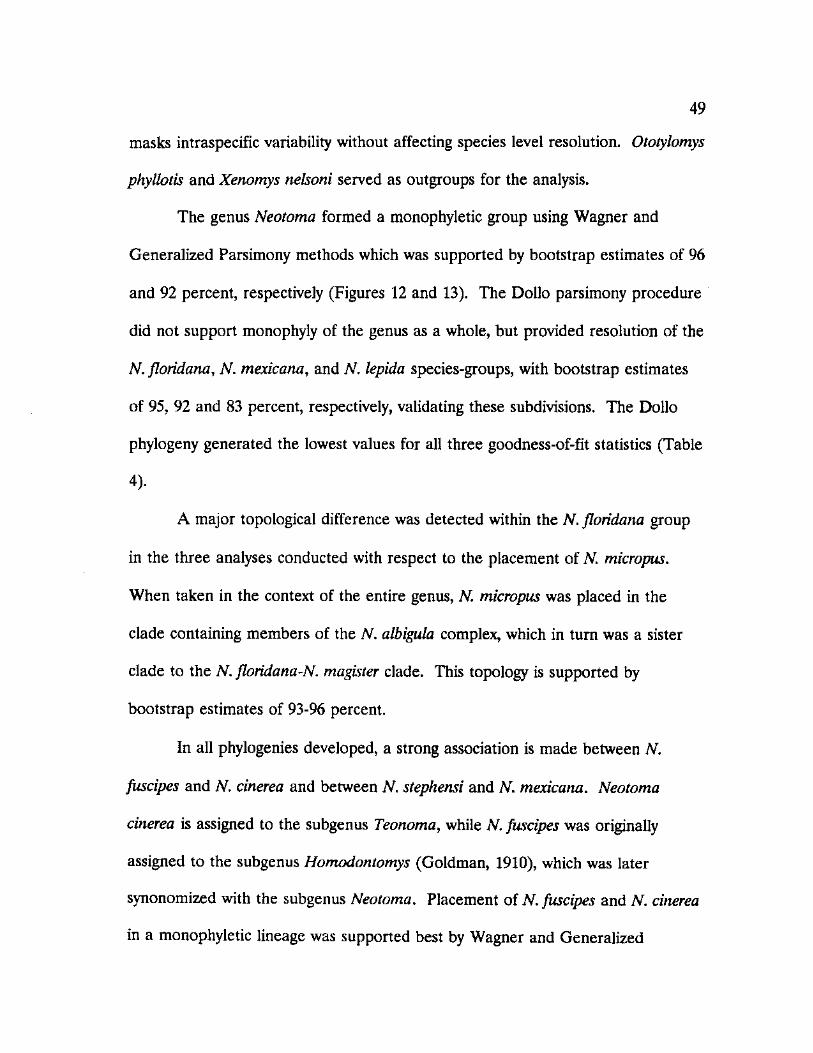
The genus Neotoma formed a monophyletic group using Wagner and
Generalized Parsimony methods which was supported by bootstrap estimates of 96
and 92 percent, respectively (Figures 12 and 13). The Dollo parsimony procedure
did not support monophyly of the genus as a whole, but provided resolution of the
N. floridana, N. mexicana, and N. lepida species-groups, with bootstrap estimates
of 95, 92 and 83 percent, respectively, validating these subdivisions. The Dollo
phylogeny generated the lowest values for all three goodness-of-flt statistics (Table
4).
A major topological difference was detected within the N. floridana group
in the three analyses conducted with respect to the placement of N. micropus.
When taken in the context of the entire genus, N. micropus was placed in the
clade containing members of the N. albigula complex, which in turn was a sister
clade to the N. floridana-N. magister clade. This topology is supported by
bootstrap estimates of 93-96 percent.
In all phylogenies developed, a strong association is made between N.
fuscipes and N. cinerea and between N. stephensi and N. mexicana. Neotoma
cinerea is assigned to the subgenus Teonoma, while N. fuscipes was originally
assigned to the subgenus Homodontomys (Goldman, 1910), which was later
synonomized with the subgenus Neotoma. Placement of N. fuscipes and N. cinerea
in a monophyletic lineage was supported best by Wagner and Generalized
50
f f f f f >
i , A
Figure 12. Bootstrapped consensus tree produced by employing Wagner
(above) and Dollo (below) parsimony methods for the genus Neotoma. Values at
the nodes represent the number of times the taxa associated by that node were
affiliated out of 100 iterations.
51
/AAKKKf////S////
Figure 13. Bootstrapped consensus tree produced by employing the
Generalized Parsimony criteria described in the text for the genus Neotoma.
Values at the nodes represent the number of times the taxa associated by that
node were affiliated out of 100 iterations.
52
parsimony procedures yielding bootstrap confidence estimates of 96 and 92
percent, respectively. The Dollo procedure placed the clade containing N. fuscipes
and N. cinerea as a sister clade to the outgroup species, Ototylomys phyUotis and
Xenomys nekoni. This phylogeny is not statistically supported, with boostrapping
grouping these taxa 27 times out of 100 iterations.
N. stephensi was originally placed in the desertorum group of the subgenus
Neotoma which included the desert woodrats (currently referred to as the N.
lepida group) (Goldman, 1910). Burt and Barkalow (1942) removed N. stephensi
from association with the N. lepida group based on major differences in the bacula
described from the representative taxa, but they did not assign the species to any
specific group. The bootstrapping procedure placed a 92 to 100 percent
confidence level on the placement of N. stephensi as a sister taxon to N. mexicana
within the N. mexicana group. Placement of the N. mexicana group within the
subgenus Neotoma was also supported by the three analyses. However,
bootstraping placed less confidence in this association with values of 72, 31, and 71
percent for the Wagner, Dollo and Generalized parsimony procedures,
respectively. The lowest bootstrap value was obtained from the Dollo analysis and
should not be considered as an indication of the strength of this association due to
the overall weakness of the Dollo method for phylogeny reconstruction at this
taxonomic level.
In both of the supported phylogenies, the N. lepida group was placed as a
distinct clade removed from the subgenus Neotoma suggesting that this group may
53
*a <D N •i—i 2 0) g D O "O G cd
O Q
o 6 ss Cd Pl, *0 D ,N 13 Vh <d a <u O
QO a <u CM <r> ca
§8 o
r-ro 00
<u a SO cd
£ js* T3 (D O G "D O f-< cu W5 <U <D +-i </i P </> G <L> wa G O o (-4 £ V5
tO V-» .59 HM cd 4-* C/5
00 va U a T3 O O O
oj
<3 s a
I C/5 S3 G CU 60 <U jc
a T3 O 45 a3 a eT o a cd 0*
£ O a cd d<
O Q
CT 0 a s V* cd CU t-» <D 1 £
o *1—1 4-» •S9 *4-* cd +-» CO
CA a <u CO CM CJ
CM CM Tt 00 CM CM *T) r-o d d
C/J a. <D Tf <N
r- r- *o as as H vo lO 00 d d o
C?
a) <u
8 -a G HH G <U va G O u
5 13 G 1—4 cd
"EL o S o K
I I—H G O *+3 G <U aS BS
54
represent a discrete subgenus. This assessment can be made due to the
placement of N. phenax of the subgenus Teonopus as a sister taxon to the
monophyletic group containing members of the subgenus Neotoma. The
association of N. phenax with the subgenus Neotoma is strong, with bootstrap
levels of 89 and 91 percent reported for the Wagner and Generalized Parsimony
methods. The phylogeny presented by the Dollo analysis, however, places N.
phenax as a separate clade well removed, albeit weakly, from the subgenus
Neotoma. Due to the stringency imposed by the Dollo assumptions, a small
proportion of the data set which consists of rare restriction sites shared with other
taxa, such as members of the N. lepida clade and possibly the N. cinerea-N.
fuscipes clade, would effectively remove N. phenax from association with the
subgenus Neotoma.
A full character matrix consisting of mtDNA restriction sites and binary
coded allozyme data was subjected to a phylogenetic analysis using Wagner
Parsimony criteria and bootstrap confidence level determination. The resultant
consensus cladogram (Figure 14) provides a topology consistent with cladograms
produced by Wagner and Generalized Parsimony methods on the mtDNA set
alone. The topology, however, does not agree with those produced through
Wagner analysis on binary coded allele data or allozyme frequency data analyzed
with FREQPARS (Figure 15). Although the randomization and resampling
procedures of the bootstrap analysis should remove any bias rendered by either
character form, the ratio of 141 mtDNA characters : 55 allozyme characters after
55
combined data set.
Phenetic analysis of the genus Neotoma.-Of the 25 presumptive gene
products resolved electrophoretically, three (PGM-2, MDH-2, CK-1) were
monomorphic for the same allele in all specimens examined. Of the remaining 22
putative gene loci, 14 varied within species (EST-1, EST-2, ALL-2, a-GPD-1,
VLL-1, VLL-2, 6-PGD-l, PGM-1, IDH-1, IDH-2, ME-2, CK-2, XDH-1, SDH-1),
and eight varied only among species (EST-2, ALL-1, MDH-1, ME-1, LDH-1,
LDH-2, HK-1, SOD-1) the latter three loci contributing an unique allele only in
Ototylomys phyllotis (Appendix VI).
Phenetic analysis of Rogers' genetic distance (Table 5, Figure 16) yielded
two main clusters. A large cluster containing the members of the genus Neotoma,
but excluding N. fuscipes, was divided into two subclusters. A small subcluster
containing N. floridana and N. magister was separated from the remaining taxa at
a genetic distance of 0.54. The larger subcluster was subdivided into a grouping
containing members of the N. albigula complex, including N. micropus, another
grouping containing N. stephensi, N. mexicana, and N. cinerea, and a single branch
with only N. phenax. Placement of N. micropus with members of the N. albigula
complex was concordant with the results of the mtDNA restriction site analysis of
the entire genus. However, the placement of N. cinerea among members of the
subgenus Neotoma was unsupported by other evidence.
A small cluster containing members of the N. lepida group was separated
from the remaining members of the genus with a genetic distance of 0.59.
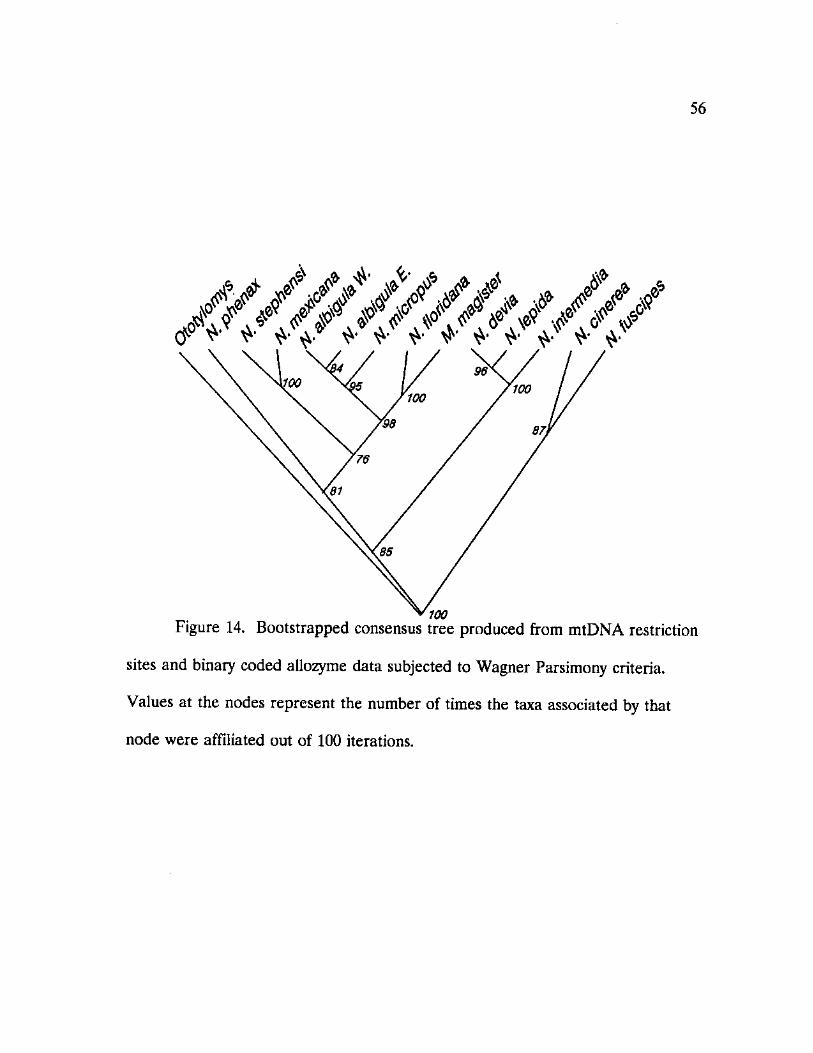
56
¥/////£&.//// (f ^ ^ w ^
Figure 14. Bootstrapped consensus tree produced from mtDNA restriction
sites and binary coded allozyme data subjected to Wagner Parsimony criteria.
Values at the nodes represent the number of times the taxa associated by that
node were affiliated out of 100 iterations.
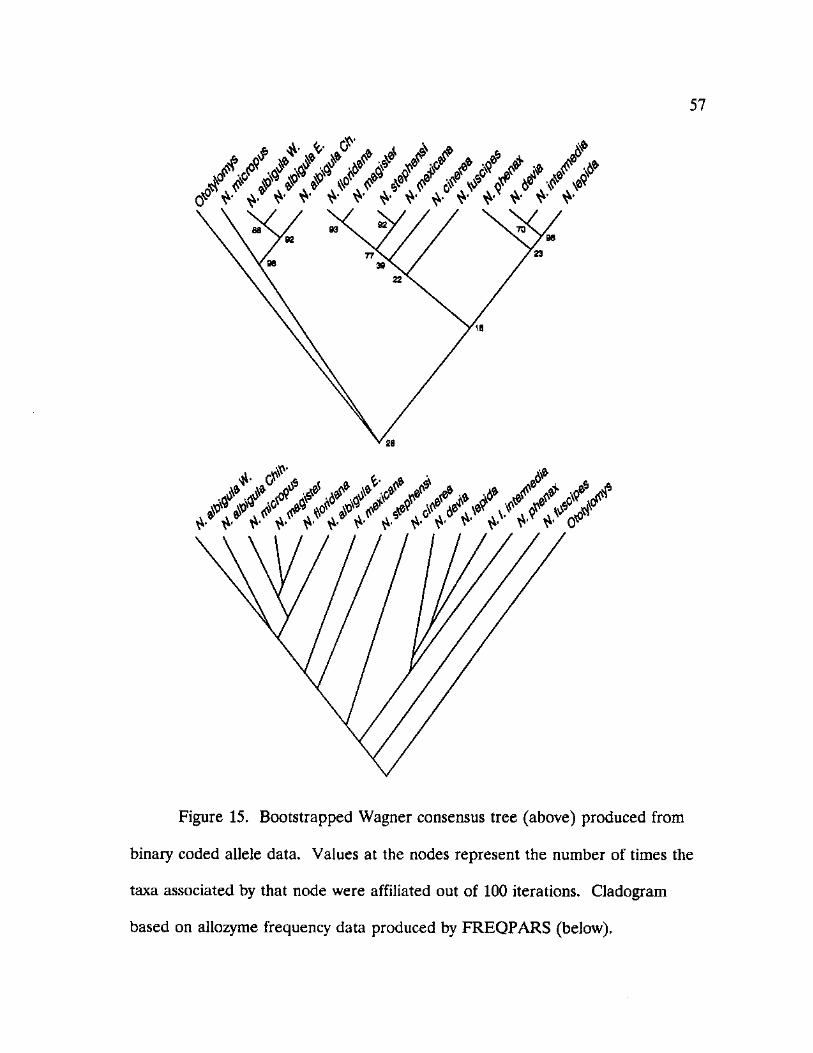
57
/ / / / / / / / / / / A ' / / (f ^ ^ ^ ^ ^ f *• *•
KKKKKKKK&&KK&
Figure 15. Bootstrapped Wagner consensus tree (above) produced from
binary coded allele data. Values at the nodes represent the number of times the
taxa associated by that node were affiliated out of 100 iterations. Cladogram
based on allozyme frequency data produced by FREQPARS (below).
58
Differentiation within the N. lepida group reported by the allozyme analysis does
not conform to the pattern developed in the mtDNA restriction site analysis but
does coincide with the karyotypic evolution reported by Mascarello (1978).
Neotoma fucipes was placed on an independent branch, its relationship being
unresolved by the UPGMA analysis.
Phenetic analysis of the estimated level of nucleotide sequence divergence
(<5 of Nei and Tajima, 1983; Table 5) based on pairwise comparisons of mtDNA
restriction sites shared between nominal taxa and well differentiated populations
of the genus Neotoma shows strong topological concordance with the cladograms
produced from mtDNA restriction site data (Figure 17).
The overall structure of the phenogram describes two clusters, one
containing members of the N. lepida group, and the other containing the
remainder of the genus and the two outgroup taxa, Ototylomys phyllotis and
Xenomys nelsoni. The N. lepida group cluster is removed from the remaining taxa
at an estimated sequence divergence of approximately 25 percent. The placement
of this species cluster well outside that of the remaining taxa is in agreement with
the Dollo parsimony analysis on the mtDNA restriction site data. However,
inclusion of Ototylomys phyllotis and Xenomys nelsoni within the subgenus Neotoma
cluster is inconsistant with the cladistic analysis.
Measures of sequence divergence support the placement of N. phenax
closer to members of the subgenus Neotoma. Within the subgenus Neotoma
cluster, two discrete subclusters were produced at a level of sequence divergence
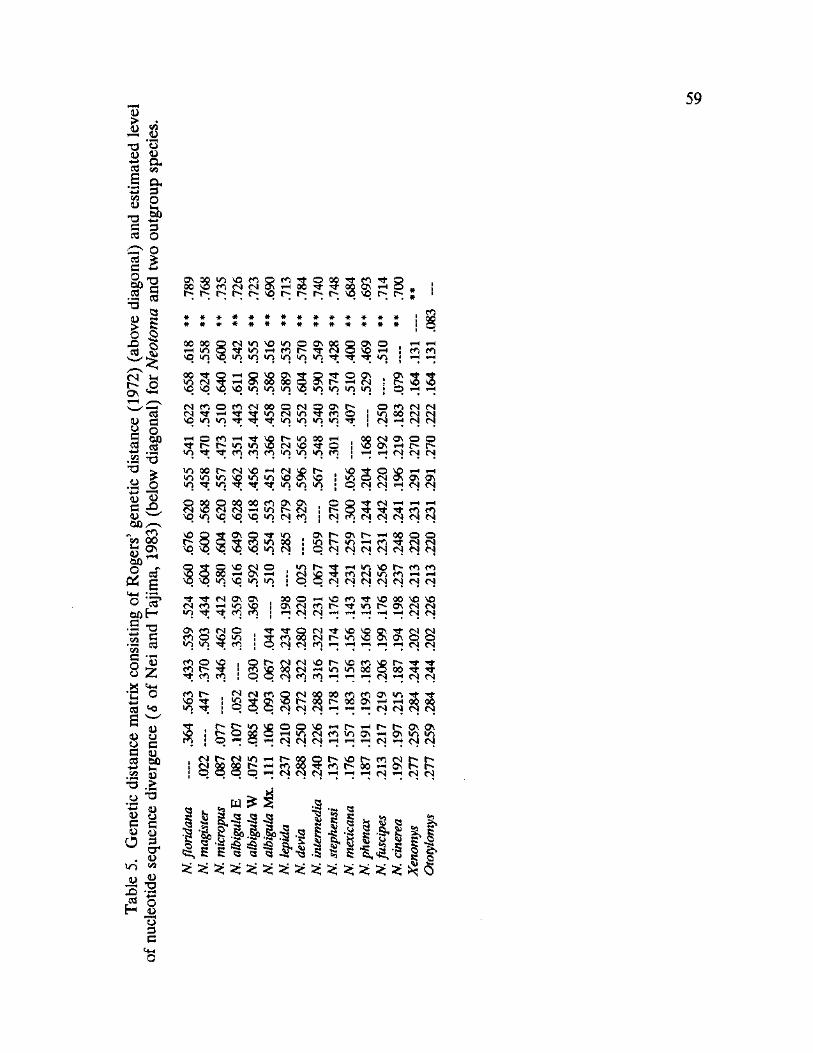
g •
fo CO
TD O a & . 1 Oh
3 o bO 3 O
(ZS 0)
T3 a cd O O s £
bO cd
i • s o <3
a
I
s s s s a s l> t>» I> Is-
2 3 3 3 r- r- r-$ 2 8 so r-
00 oo *"H in VO to <sj m so m o on oo Tf m *H c3 in in in in in in rt
Si ° ^ in
! I
m ro
59
CM Vh l> p a \ <+*
8 G H o 5
.S3 ' 6 ^ * . a 5 oJ 13 c A D w
5X)r> * ^0 5/3 00 ft 8>
e5
O cd b o H
.5 TJ £ g *£ 03
o « o Z
cd
•e ca <o
o G g <u cd bo
•Is S T3 .> O "O *3 ^ D o G G £ 5
O 3 w or
. <u in 5/5
<u
00 <<t in <N SO so in m in
( s m o m c s o o o c s c s j T f ^ H ^ ^ i n c s m . v o * n i n T T " T ' « t i n * n i n i n
o i - o o \ * h H M *n in in *n
%
g s s o *•"* *•*
O W (S M m oo ra fsj H M M
H O O H Tf "i* r- r- >n «n in rt m m h »n x H n o ^ o in *n in m
00 N 0\ O O \Q OS rHI |> J> *—* *-4 <N| fM <S
m oo in «n OOt^NVOHfSVOt^ , SO ^ O ^ *"H • n i n s o « n i n s o o \ s o w} o ts o\ a\ a\ ^ f i n ^ T f T f i n i n i n > o N «s h n M
00 00 m r3 in o oo o CsJ VO (M . vo m so \o so in
as a\ i> <M ra rr> o <N 5 .
CS (N fS| *H 1—4 t>H
£ SO g\ q "t *n ^ ^ m so vo in a
as t*» ON in h »n h ^ O N N N N N N N
00 O O N N
Q ^ O so <NI O yo Q 00 h 0\ H *n so in *n
Tf rf (N ON OS M f i H in ^ W") Tf Tf en (7j as <r> r4 o . m o so >n in in ro <
<r> o cn i> . en ro
m t>
t ^ ^ ^ H i n v o r - e n c n 0(N(NfNj(NfSCsJ<N
00 o ^ VO fO a\ (N m rf *—< <N <N *"H i-H
Tf CO <N N VO cm in fT) t-H *-H
rr so 00 SO vo <n on cm <m *H tH <N <N
H H H (S) (\|
5? r n ^ D o o N H i n i n o o o o o 3
SO ^ in ^ , (N 8
(N s I S (S fsj
oo ro rn as m oo on ^ t-i H H H N N
r-5 2
^ o o so t** cs» (M
as as S i Q
<s r- <M in H h o **• a
o r ^ v o r - f ^ r N j t ^ r ^ ^ f n r ^ o o » - i O N r ^ t ^
1» tu
l - S ^ s
| - & i , A . 8 » . & 3 . s ^ - s „ OS »C
Ǥ, 5 5 "3 "3 *8 Jff
-5 *tt g Q '55 b . - . | i
i - S §
c2 o H JLJ
13 3 G
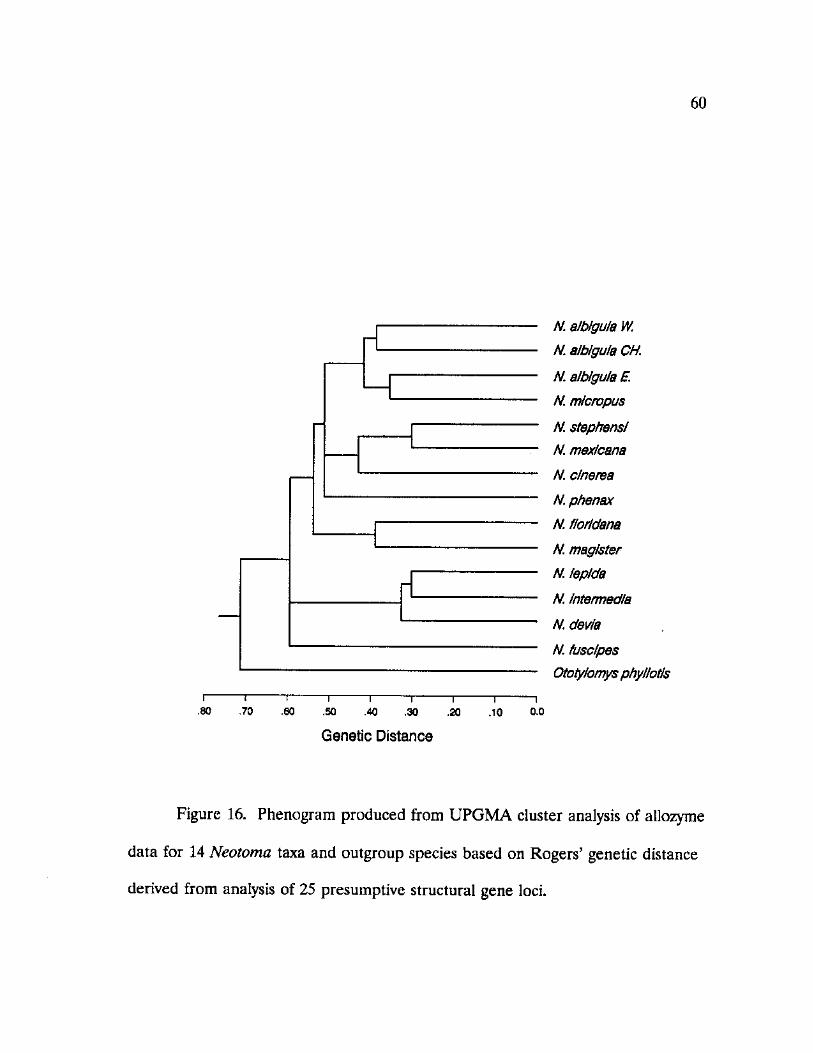
I .80
T " .70 .60 .50
- T -
.40 ~r -
.30 I
.20 -r~ .10
Genetic Distance
N. albigula W.
N. albigula CH.
N. albigula £
N. m/cropus
N. stephensl
N. mexicana
N. clnerea
N. phenax
N. florldana
N. mag/ster
N. leplda
N. Intermedia
N. devia
N. fusel pes
Ototy/omys phyllotis
o.o
60
Figure 16. Phenogram produced from UPGMA cluster analysis of allozyme
data for 14 Neotoma taxa and outgroup species based on Rogers' genetic distance
derived from analysis of 25 presumptive structural gene loci.
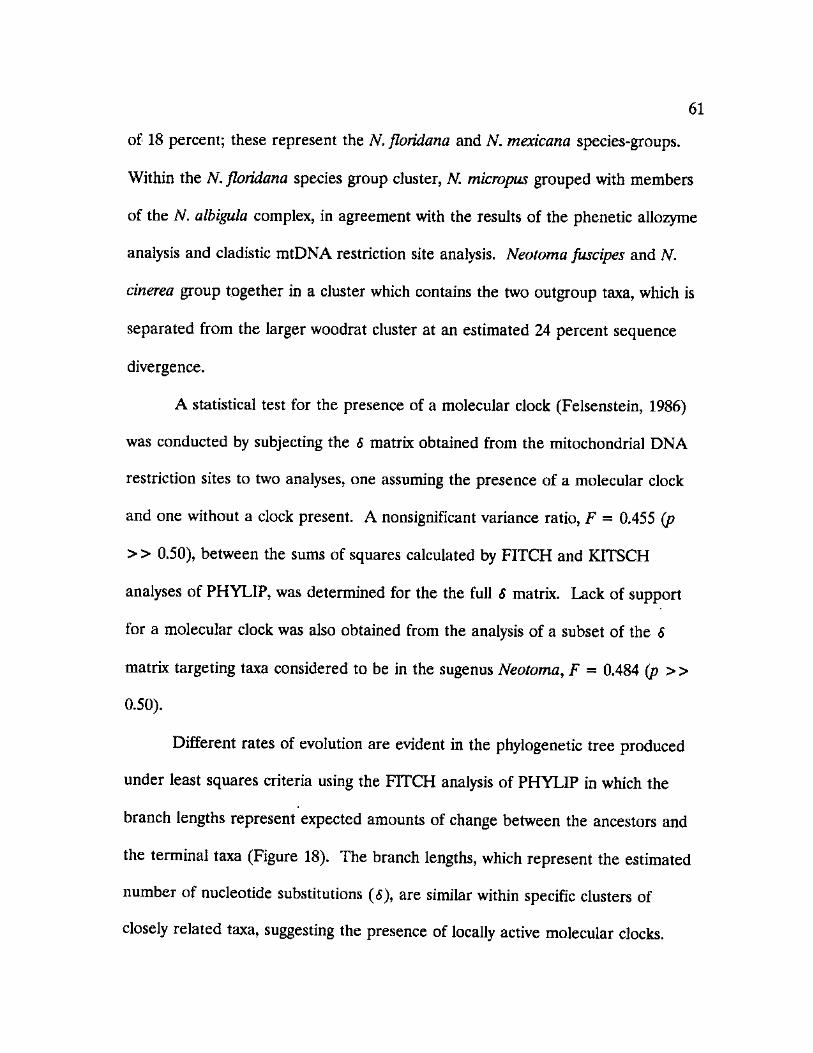
61
of 18 percent; these represent the N. floridana and N. mexicana species-groups.
Within the N. floridana species group cluster, N. micropus grouped with members
of the N. albigula complex, in agreement with the results of the phenetic allozyme
analysis and cladistic mtDNA restriction site analysis. Neotoma fuscipes and N.
cinerea group together in a cluster which contains the two outgroup taxa, which is
separated from the larger woodrat cluster at an estimated 24 percent sequence
divergence.
A statistical test for the presence of a molecular clock (Felsenstein, 1986)
was conducted by subjecting the S matrix obtained from the mitochondrial DNA
restriction sites to two analyses, one assuming the presence of a molecular clock
and one without a clock present. A nonsignificant variance ratio, F = 0.455 (p
> > 0.50), between the sums of squares calculated by FITCH and KITSCH
analyses of PHYLIP, was determined for the the full S matrix. Lack of support
for a molecular clock was also obtained from the analysis of a subset of the S
matrix targeting taxa considered to be in the sugenus Neotoma, F = 0.484 (p »
0.50).
Different rates of evolution are evident in the phylogenetic tree produced
under least squares criteria using the FITCH analysis of PHYLIP in which the
branch lengths represent expected amounts of change between the ancestors and
the terminal taxa (Figure 18). The branch lengths, which represent the estimated
number of nucleotide substitutions (6), are similar within specific clusters of
closely related taxa, suggesting the presence of locally active molecular clocks.
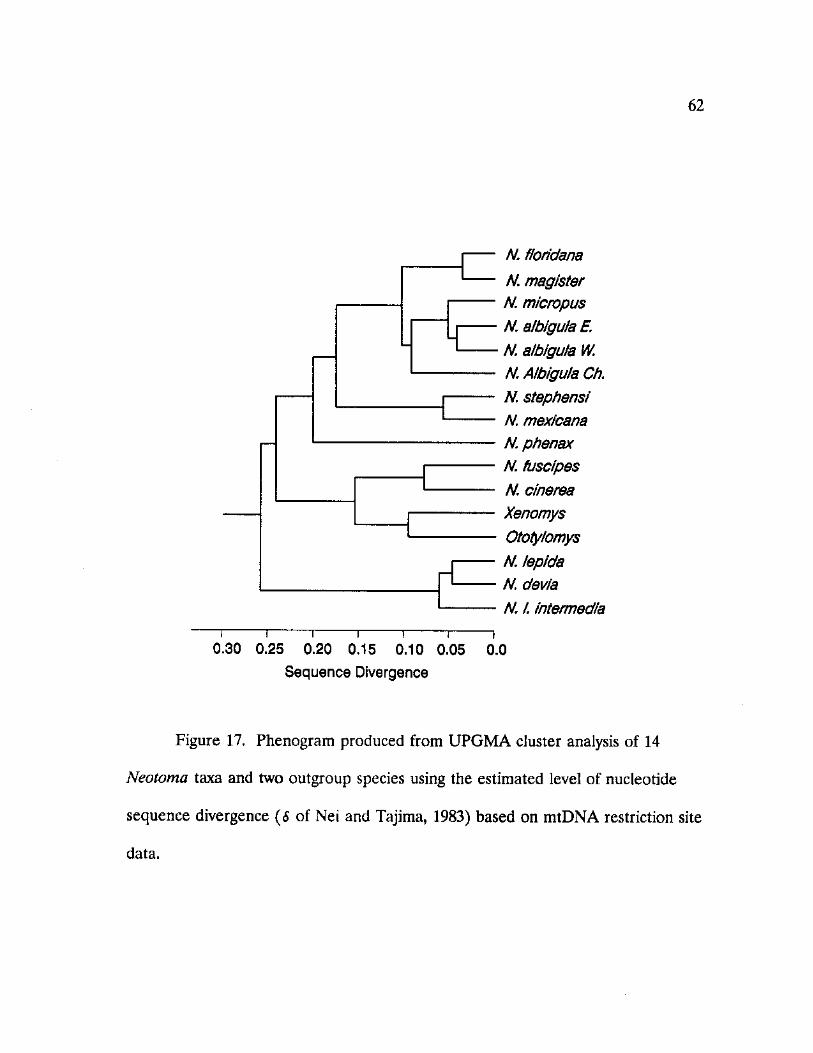
62
i i 0.30 0.25 0.20 0.15
Sequence Divergence
N. floridana
N. magister N. micropus N. albigula £ N. albigula W. N. Albigula Ch. N. stephensi N. mexicana N. phenax N. fuscipes N. cinerea Xenomys Ototylomys N. /epic/a N. devia N. /. intermedia
n i 1 0.10 0.05 0.0
Figure 17. Phenogram produced from UPGMA cluster analysis of 14
Neotoma taxa and two outgroup species using the estimated level of nucleotide
sequence divergence (5 of Nei and Tajima, 1983) based on mtDNA restriction site
data.
63
g I ui <o —
3^5 IB < ^ 5
3:
$
0}
Q) , i | i n
.o * % e
co 2: 2:
.<0 •o <3) 1 .C
§ < 5 flB <D 73
I
1
!W 52 <D .Q. O J 2 .
S * © .c o 2:
o "<x>
8 C O <D CO P> § a
•3 § o • y CO
h" # CM
O o
£ l l I t l a
bO .s "S p CO <D #o V a C/5 a p
i P O £ w £ s "O §
cd
I
<2 cd • tm4 w* <U +-» •c o 09 <D V-h cd P cr <z» cd £> i—t <D T3 G P
T3 <D o 3 ID 2 a. s cd t-< 00 o a <u 43
cu
00 rH
2 p
.£P
cd +-» cd T3 <U
a o * i"H o 'C CO <D t-i
z Q +-» s a o T3 <D co cd 43 CO 00 as
cd a « P—4 *c? H •O a cd *5 £ <+-<
o
<D O G <D £?
is
<U o G <D P cr d> C/3 <D 3 O J2 73 P G <4-4 O 13 jt> •a <u +-» cd s * V) <L> <D 43
JS *53 o CO
cd t-H X3 <D M cd CO 43 +•* too G <D
43 O G 2
03
64
Major branch length and, hence, rate differences were observed on branches
leading to major clusters of taxa, such as the N. lepida group, N. mexicana group,
or N. phenax, which supports the contention of cohesivness among taxa grouped
into higher taxonomic catagories, i.e. subgenera, and species-groups. Members of
the N. lepida group are well removed topologically and separated by considerable
distance from members of the subgenera Neotoma and Teonopus, again suggesting
that this group is a distinct subgenus. Within the subgenus Neotoma cluster, there
is support for the designation of two major species groups, the N. floridana and N.
mexicana species groups.
Mantel Analysis conducted on the independent distance matrices compiled
from the allozyme and mtDNA restriction site data (Table 5) resulted in a
significant correlation, r = 0.907 (^[random Z > observed Z] =0.004), between the
matices. This high degree of relationship between the data sets infers that
concordant patterns of evolution can be expected from the analysis of both
mtDNA and allozyme data for this group of organisms. Differences observed in
the topological models developed from these data sets are artifacts or peculiarities
of the specific data sets or pairs of taxa being compared.
CHAPTER IV
DISCUSSION
Relationships within the N. floridana species-group and factors contributing
to present distributions.-The levels of differentiation presented here between
members of the N. floridana species group fall within the ranges that have been
reported for other mammalian taxa using comparable approaches (see Table 1.,
Table 5., Zimmerman et al., 1978). The estimated level of sequence divergence
between N. floridana and N. magister found here (2.2%) is less than half of that
reported by Hayes (1990) for these two taxa (5.2%). The discrepancy between
these two estimates may be coincidental with the location of specimens examined
in this study, choice of restriction enzymes employed, or the calculation of this
estimate by Hayes. Hayes reported 5.2% as a maximum estimate of sequence
divergence between N. floridana and N. magister, with "weighted" averages of
sequence divergence between the two taxa ranging between 3.2 - 4.8%. A sample
from Kansas was represented within the lower range of these values which biases
the magnitude of discrepency with regard to the present study. Hayes (1990) was
unable to determine the relationship of N. magbter to the subclades of putative N.
floridana, with one of the possible arrangements suggesting a close relationship
between N. magbter and western populations of N. floridana.
65
66
Relationships between other members of the N. floridana species group (N.
floridana, N. micropus, and N. albigula) are not as straightforward. In mtDNA
analyses based solely on members assigned to this species group, N. micropus was
placed as a sister taxon to the N. floridana-N. magister clade, in agreement with
earlier allozyme and immunoelectrophoretic studies (Birney, 1973; Zimmerman
and Nejtek, 1977; Shipley, et al., 1989). When these taxa were analysed in the
context of the entire genus, N. micropus was placed in the clade containing the
members of the N. albigula complex, which in turn was a sister clade to the N.
floridana-N. magister clade. This arrangement was supported by the allozyme data
presented herein as well.
Difficulty in the placement of N. micropus may be in part due to the large
intraspecific polymorphism present in the species. High levels of chromosomal
polymorphism was reported for N. micropus, a characteristic not reported for
other members of the genus (Baker and Mascarello, 1969; Baker et al., 1970).
Zimmerman and Nejtek (1977), however, reported N. micropus as having the
lowest proportion of polymorphic loci per population but highest individual
heterozygosity of the three species of Neotoma they analysed. Five unique
mtDNA haplotypes were found in this study, representing the highest degree of
mitochondrial polymorphism reported for this genus. Although estimated levels of
sequence divergence (5) between the five N. micropus haplotypes ranged from
0.002 to 0.011, the pattern of cladogenesis produced for these haplotypes did not
present a meaningful biogeographic pattern. Polymorphism within N. micropus
67
may have been the result of random fragmentation caused by habitat restrictions
during the most recent glacial advances during the Wisconsin ( Van Devender, et
al., 1987) which allowed for differentiation among the isolated populations but was
insufficient to result in reproductive isolation. Fragmentation of this nature
increases the degree of polymorphism among mtDNA lineages resulting in a
paraphyletic condition existing for an extended number of generations following
reunion of the isolated populations (Neigel and Avise, 1986; Riddle and
Honeycutt, 1990).
Hybridization revealed by morphological, allozyme, and karyotypic data
between N. micropus and N. albigula has been reported at locations at the
northern limits of both species' ranges in southeastern Colorado and western
Oklahoma (Birney, 1976; Huheey, 1973). Hybrids were also collected at three
localities in the Texas panhandle and one location in the Davis Mountains (Long-
X Ranch, Jeff Davis Co., TX) during this study. However, over larger parts of
their ranges where these two species are sympatric, their genetic integrity appears
to be maintained by habitat separation. Neotoma micropus occurs primarily in flat,
semi-arid plains in plant associations of yucca-, cactus-, or mesquite-grassland
(Schmidly, 1977; Dalbey, 1980). Although N. albigula can often be found in
similar habitats, especially in the western-most parts of its range, it is most
commonly found in rocky habitats and arroyos associated with juniper and yucca
(Finley, 1958; Huheey, 1972; Schmidly, 1977).
Neotoma floridana appears to hybridize with N. micropus at a single locality
68
in northern Oklahoma where the two species are sympatric (Birney, 1973;
Spencer, 1968) and has been induced to hybridize in the laboratory (Birney, 1973).
Birney (1976) described this observation as a case of stasipatric distribution (Key,
1968), where impaired fecundity of hybrids rather than ecological competition is
the major factor preventing broad species overlap. At a sympatric locality in
south-central Texas, Dalbey (1980) failed to support any evidence for hybridization
between these two species. Based on these lines of evidence, greatest support is
placed in associating N. micropus with the N. albigula complex. Due to the lack of
significant hybridization and introgression, as reported here and by Huheey (1972),
the specific integrity of both species should be maintained.
The sharp dichotomy between the forms of N. albigula has not previously
been reported. The estimated level of sequence divergence between the eastern
and western N. albigula clades of 3% is comparable to the values presented for
the cryptic species N. floridana and N. magister and other closely related species
(Table 1).
Zimmerman and Nejtek (1977) reported polymorphism at several allozyme
loci between populations of N. albigula, which, when taken into a geographic
perspective, suggested a limitation of gene flow between some of the populations
sampled. The presence of alternate allelic forms at six loci (Appendix VI) and
two distinct mtDNA haplotypes in the region of El Paso, Texas, indicates this
region is an area of sympatry between the two genetic forms.
Geographically, the eastern and western N. albigula forms are separated
69
along the Rio Grande River in New Mexico, with the exception of the area of El
Paso, Texas, where both forms are found sympatrically. In northern New Mexico
and Colorado, the two forms appear to be restricted by the San Juan Mountains
of the continental divide to the west, and the Sangre de Cristo Range to the east
of the Rio Grande. White-throated woodrats are absent from the San Luis Valley
of southcentral Colorado and adjacent northern New Mexico (Finley, 1958;
Armstrong, 1972; Findley et al., 1975). It is feasible, that the Rio Grande River
may have been an early factor contributing to the segregation of the eastern and
western N. albigula forms following an episode of geographic isolation initiated by
changing climatic patterns during the Pleistocene (Flint, 1971; Hays et al., 1976).
The Rio Grande River and its basin consisted of deep fissure canyons and
large pluvial lakes at various times throughout the Pleistocene (Baldridge and
Olsen, 1989; Flint, 1971). The actual course of the river and position of the river
bed have changed several times in the river's history since the Pliocene. During
the late Pliocene through early Pleistocene, the primary drainage of the river's
headwaters in Colorado and northern New Mexico was deflected into the Pecos
River drainage from a point south of the Sangre de Cristo Mountains, feeding into
the ancestral Rio Grande at the present day Amistad Reservoir (Figure 19).
Drainage from the more southerly mountains in New Mexico flowed through the
Rio Grande floodplain draining into large pluvial lakes in northern Chihuahua
(Belcher, 1975). During this period, the Rio Conchos served as a major drainage
of the Sierra Madre Occidental and regions of the Mexican Plateau, leading into
70
the ancestral Rio Grande at present day Ojinaga, Chihuahua (Belcher, 1975).
The Rio Grande-Pecos-Rio Concho river assemblage may have acted as a
partial barrier to a northerly dispersal of N. albigula forms, if regions of the
southern Bolson de Mapimi and Mexican Plateau served as isolating refugia
during full glacial advances. These regions reportedly consisted of habitats ranging
from papershell pinyon and juniper to Chihuahuan desert scrub during the
Wisconsin, with N. albigula reported as the most abundant contributor to fossil
woodrat middens in the area (Van Devender, 1990; Van Devender and Burgess,
1985). Meyer (1973) concluded that the vegetation of this region has been stable,
with little change along the mountain slopes. Fossil middens recorded pinyon-
juniper-oak woodlands for the Hueco Mountains region of Texas suggesting
relatively stable climates in this area for at least 30,000 years (Van Devender,
1990; Van Devender et al, 1987).
During later periods of the Pleistocene, the opening of the canyon at El
Paso allowed the river to flow in its present course towards the confluence with
the Rio Conchos. At various times during the Pleistocene, however, the
southward course of the river was deflected between the eastern and western sides
of the Franklin Mountains north of El Paso (Belcher, 1975) (Figure 20). It is
feasible to suggest that the presence of both the eastern and western N. albigula
forms in the El Paso area is a result of fluctuations in the course of Rio Grande
with respect to its orientation with the Franklin Mountains. This form of
transplantation across a partial barrier has been suggested as a mechanism for
71
kilometers
Figure 19. Proposed ancestral drainage pattern of the Rio Grande River
during the late Pliocene through early Pleistocene.
72
other mammals (Kennerly, 1963; Russell, 1968).
The genetic data for the distinct forms of N. albigula are supported by
numerous morphological studies conducted over the past 20 years. Multivariate
analyses performed on cranial measurements from large, geographically diverse
samples of N. albigula yielded broad ranges of variability attributed to geographic
variation (Birney, 1976; Rogers and Schmidly, 1981). A priori sorting of localities,
with respect to mitochondrial haplotypes obtained from specimens used in this
study, allowed for a reevaluation of the geographic variation reported by Rogers
and Schmidly (1981), attributing most of the variation they observed to a genetic
dichotomy.
In the area near El Paso, Texas, habitat differences between the two N.
albigula forms and the sympatric N. micropus were observed. Neotoma micropus,
as stated previously, occurs on mesquite-grassland plains, as did individuals having
the western N. albigula mtDNA haplotype. No evidence of hybridization or
mtDNA introgression was detected among the twenty-six specimens sampled from
this area. The presence of N. albigula in this habitat is concordant with its typical
habitat in Arizona (Vorhies and Taylor, 1940). The sympatric relationship
between these two species has been reported previously for this area (Schmidly,
1977). Of the twenty-six specimens collected on the mesquite-grassland in this
study, only five were N. micropus. This agrees with the report of Ederhoff (1971),
that N. albigula was abundant in this habitat, while N. micropus was rare. Also it
possibly suggests that some level of competition exists between the western N.
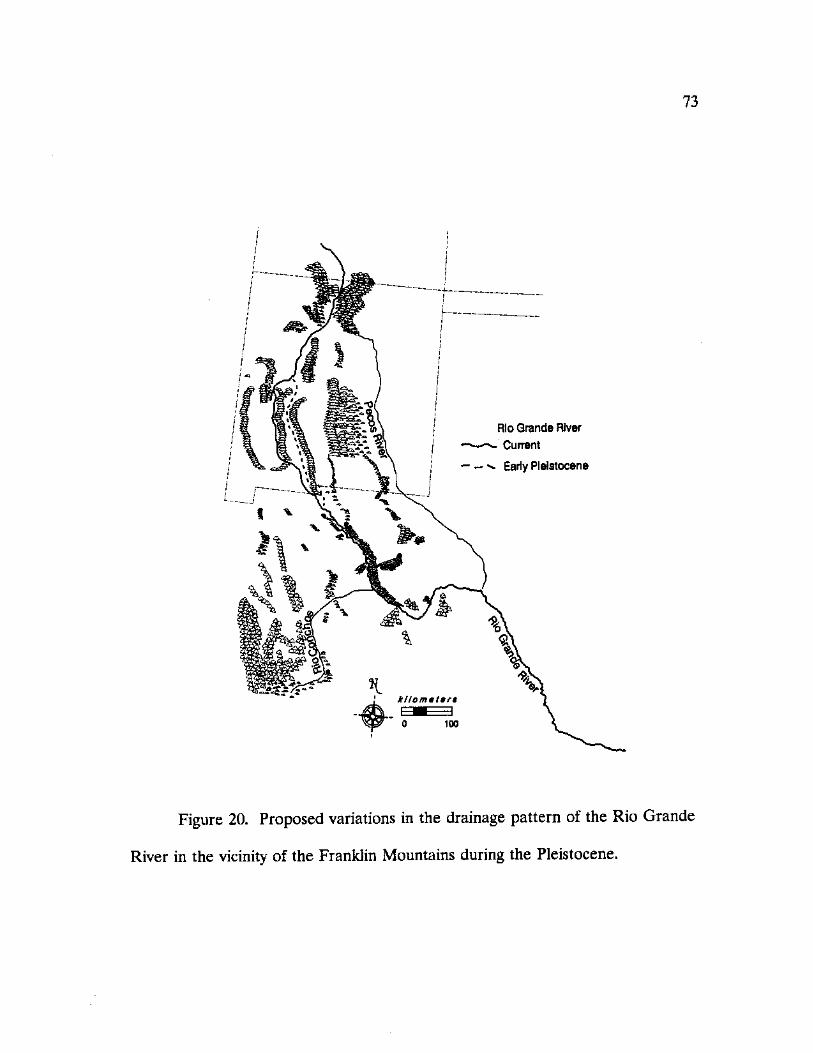
73
Rio Grande River Current
Early Pleistocene
klfomeCrs
Figure 20. Proposed variations in the drainage pattern of the Rio Grande
River in the vicinity of the Franklin Mountains during the Pleistocene.
74
albigula form and N. micropus. East of the El Paso area, N. micropus is abundant,
and the western N. albigula form is absent. Six samples of the eastern N. albigula
mtDNA haplotype were collected along a rocky arroyo in the foothills of the
Franklin Mountains north of El Paso, however, samples of N. micropus were not
collected at this locality. The presence of N. micropus in the grassland region of
the Rio Grande floodplain may be a positive factor contributing to the
maintainance of microallopatry between the eastern and western N. albigula forms
in New Mexico.
The distribution of the eastern and western mtDNA haplotypes is also in
concordance with fossil data presented by Harris (1984) for New Mexico and
Chihuahua. Diagnostic measurements of the ml segregate by locality among the
fossil materials, while a Holocene reference sample shows broad variability. Fossil
information from the El Paso, Texas area, dated as stadial or early Holocene,
reveals intermediate distributions among the measurements, suggesting that both
forms of N. albigula were present in this region at the close of the Pleistocene.
In addition to the two forms of N. albigula discussed above, samples
collected from northwestern Chihuahua and western Sonora introduce additional
variation. Twenty-two N. albigula and three N. micropus were collected near
Janos, Chihuahua, in primarily mesquite-grassland habitat. The majority of the N.
albigula were collected among boulders of an isolated rock outcropping located on
the plains. The N. albigula from this locality and one specimen captured north of
75
Guaymas, Sonora, formed a distinct subclade usually associating with the western
mtDNA haplotype of N. albigula (Figures 12 and 13) when analysed in the context
of the entire genus. Analysis of the N. floridana species group independently,
however, resulted in the placement of these two populations as separate clades,
basal to the entire species group. An estimated percent sequence divergence
ranging from 4.4 - 6.7% with the western and eastern N. albigula haplotypes,
respectively, poses a question regarding the distinctiveness of these forms. This
level of divergence is higher than that reported between the two N. albigula forms
and N. floridana and N. magister. Although the Chihuahuan sample is referable to
N. a. albigula, it differs markedly from samples collected approximately 100 km
north in New Mexico and Arizona. The Sonoran sample, referable to N. a.
venusta, associates most closely with the Chihuahuan sample, not with N. a.
venusta samples from western Arizona.
The degree of differentiation among the populations of N. albigula
described here was not appparent in the previous taxonomic treatment of this
group by Hall and Genoways (1970) based solely on mensural characteristics.
Anderson (1969) first described a rearrangement in the distribution and taxonomy
of N. albigula from Chihuahua acknowledging the existence of two distinct forms
meeting along the Rio Conchos in northeastern Chihuahua. Specimens east of the
Rio Conchos, were allocated to N. a. durangae which Anderson (1969; 1973)
stated was clearly intermediate to N. a. albigula and N. micropus. The distribution
of N. micropus in Chihuahua is limited to regions of the Rio Grande floodplain
76
and mesquite grasslands north and west of the Rio Conchos. The sympatric
association of the N. albigula-type woodrats from northwestern Chihuahua with N.
micropus is concordant with the association described between N. mkropus and
the western N. albigula form. A collection of N. micropus from near Janos,
Chihuahua, suggests a possible range extention southwesterly by N. micropus since
the time of Anderson's survey work during the late 1950's and 1960's (Anderson,
1972). Westward expansion by N. micropus likely will be limited by the Sierra
Madre Occidental, as it forms the southern extensions of the Rocky Mountains in
southwestern New Mexico.
Ecologically, records of N. albigula from east of the Rio Conchos in
Chihuahua (Anderson, 1969), Coahuilla (Baker,1956), and San Luis Potosi
(Dalquest, 1953) report this form to be found in association with rocky outcrops
and caves and in vegetative associations ranging from cactus and mesquite to oak
and yellow pine (Baker, 1956). Neotoma micropus is not found in close association
with the white-throated woodrats in these regions. The ecological scenario in
northeastern Mexico corresponds closely to the relationship found between the
eastern N. albigula form and N. micropus in the southwestern United States.
Although specimens from the northeastern states of Mexico were not available for
inclusion in this study, ample evidence is present to suggest that the populations of
N. albigula found east and south of the Rio Conchos-Rio Grande confluence in
Mexico should be assigned to the same species as the eastern N. albigula form.
The distinctiveness of N. a. warreni described by Rogers and Schmidly
77
(1981) is supported by the mtDNA data presented here. Neotoma a. warreni,
represented by specimens collected from the Texas panhandle and southeastern
Colorado, formed a distinct subclade associated with members of the eastern N.
albigula group (Figures 8 & 9). Close examination of the distribution of the
respective mtDNA haplotypes is warranted to properly determine if a contact
zone exists between the two forms.
Relationships within the N. lepida species-group and factors contributing to
present distributions.-The desert woodrats of the N. lepida species group formed
a discrete monophyletic group independent of remaining members of the subgenus
Neotoma to which they have traditionally been assigned. The distinctiveness of
this group, however, is not restricted to the mtDNA and allozyme data presented
herein. Studies of the baculum (Burt and Barkalow, 1942) revealed a marked
divergence in structure of N. lepida-type bacula from the remaining members of
the genus Neotoma, not only in terms of its dimensions, but also in the presence
of a curved baculum, which is unique to the desert woodrats, leading these authors
to suggest that subgeneric recognition for the N. lepida group may be in order.
Although Hooper (1960:10) agreed with the suggestion of Burt and Barkalow
(1942:290) in his treatise on the glans penes of members of the genus Neotoma
and allied genera, he did not pursue the matter further. In an extensive,
morphologically based phylogenetic analysis of the Neotomine-Peromyscine
rodents, Carleton (1980) also reported that N. lepida was patristically highly
78
differentiated from other Neotoma, but not to the extent that Hodomys alleni
exhibited, which he considered generically distinct from Neotoma. Although
recognizing the problem existed, Carleton (1980) was not able to comment on the
differentiation within the N. lepida group, since his study material was restricted to
samples from Baja California and California referrable to the N. I. intermedia-type.
Chromosomal studies of N. lepida revealed a 2N = 52 karyotype for the
species, with marked variability in the autosomal arm number in populations east
and west of the Colorado River in Arizona and California (Mascarello and Hsu,
1976). Variations in allozymes, differentially stained chromosomes, penile
morphology, and cranial characters analysed by Mascarello (1978) indicated two
chromosomal races representing cryptic species occurred on opposite sides of the
Colorado River. Mascarello (1978) elevated N. I. devia to specific rank, assigning
desert woodrat populations east and south of the Colorado River in Arizona to
this species, whose status is currently accepted (Vaughan, 1990).
The specific status of N. devia, however, has been questioned based on a
morphometric analysis of desert woodrat populations in Arizona and eastern
California (Hoffmeister, 1986). One of Hoffmeister's (1986:411) main criticisms
concerned the lack of specimens from northern portions of Arizona and adjacent
Utah in Mascarello's (1978) analysis. My analysis included specimens from the
Little Colorado River area in Coconino Co., Arizona, south of the Grand Canyon,
and areas of Arizona and southwestern Utah north of the Colorado River, in
addition to localities east and west of the Colorado River in western Arizona and
79
adjacent California. The results of mtDNA and allozyme analyses of these
specimens are in concordance with the findings of Mascarello (1978). Desert
woodrats east and south of the Colorado River in Arizona are referable to N.
devia. Genetic subdivision within N. devia, based on the mtDNA analysis, does
agree in part with Hoffmeister's (1986) recognition of a subspecific distinction in
desert woodrats in southwestern Arizona. Specimens from Yuma and Mohave
counties, Arizona, differed from Coconino Co. specimens of N. devia with an
estimated sequence divergence (S) of 0.008. Although the exact range and zone
of contact between these two haplotypes was not addressed by this study, I
recommend that N. lepida auripila, as designated by Hoffmeister (1986), be
retained as a subspecies of N. devia, with the approriate taxonomy being N. devia
auripila.
The bacula and glans penes of western coastal and Baja California
populations, referred to as N. /. intermedia-type, possess significantly different
characters compared to those of inland desert woodrats (Mascarello, 1978; D.
Huckaby, pers. comm.). Although allozymic markers verified the distinctiveness of
this form, Mascarello (1978) did not address the issue in his study. The degree of
differentiation between the intermedia-type and inland N. lepida, as determined by
the mtDNA and allozyme data presented here, are of sufficient magnitude to
suggest that the intermedia-type represents a distinct species which is a sister taxon
to a clade containing N. lepida and N. devia (Figure 10 and 11).
The estimated levels of sequence divergence (6) between N. lepida and N.
80
devia based on mtDNA restriction site analysis was 2.5 percent, a level consistent
with that reported for other cryptic species within the genus Neotoma (Table 5).
Populations of N. intermedia differ from the other two desert woodrat species by
an average estimated sequence divergence of 6.2 percent, which is similar to the
degree of divergence seen between other woodrat species and well defined species
of Peromyscus (De Walt, 1991) and Onychomys (Riddle and Honeycutt, 1990).
The pattern of differentiation within the N. lepida group reported by the
allozyme analysis does not conform to the consensus pattern developed in the
mtDNA restriction site analysis but does coincide with the karyotypic evolution
reported by Mascarello (1978). Phylogenetic analysis of the allozyme data yielded
two topologies dependant on the method of analysis employed. Wagner
Parsimony analysis resulted in a topology for the N. lepida group in which N. devia
and N. intermedia occur on a clade that has N. lepida as a sister taxon. Analysis of
the same data set using FREQPARS provided a cladogram in which N. lepida and
N. intermedia occur together on a clade with N. devia as a sister taxon (Figure 15).
This phylogenetic representation is concordant with the phenetic analysis of the
allozyme data using UPGMA clustering (Figure 16).
The discrepency between the results of the allozyme and mtDNA analyses
may be an artifact related to the uncoupled nature of evolution between the
nuclear and mitochondrial genomes. The relatively robust degree of mtDNA
sequence divergence between N. intermedia and the other two desert woodrats
would suggest that the separation of populations leading to the N. intermedia stock
81
from ancetral N. lepida-type woodrats occurred prior to the speciation event which
separated N. devia from the remaining N. lepida stock. This scenario is supported
by morphological evidence which provides a distinct division between the N.
intermedia-type and N. lepida-typt glandes (Mascarello, 1978; D. Huckaby, pers.
comm.). A later subdivision of the proto-AT. lepida stock giving rise to the present
N. lepida and N. devia would allow karyotypic, allozyme, and mtDNA evolution to
occur in isolation, resulting in distinctive karyotypic modification, possibly resulting
in genie rearrangement in N. devia, while N. lepida retained karyotypic and some
degree of allozymic similarity with N. intermedia. The degree of mtDNA evolution
between these two species is consistant with that recorded for the other
arrangements of cryptic species among Neotoma.
Varying levels of support for this scenario can be extracted from the fossil
and paleoecological records. Woodrat middens have been used extensively by
paleoecologists to determine changes in floristic assemblages in southwestern
North America induced by the cycles of glacial advance-retreat during the
Pleistocene (Spalding et al., 1990; Van Devender, 1985; 1987; 1990; Mead et al.,
1983; Wells, 1976). Although the botanical material obtained from fossilized
woodrat excretia and middens has been thoroughly analysed, considerable neglect
has been paid to the Neotoma fossils also present in the materials.
The lower Colorado River Valley may have provided a complete or
periodic barrier to the gene flow in desert woodrats at various times throughout
the Pleistocene. This area, reported to be the most arid region in North America,
82
remained as a relatively arid region throughout the Pleistocene and served as a
desert core region for xerophytic plant species such as Larrea divaricata, whose
sparse distribution characterizes the area today (Cole, 1986). The arid lowlands
surrounding the head of the Sea of Cortez would have been greatly expanded
during such periods of the Pleistocene when sea levels decreased by approximately
120 meters. The Colorado River itself may have served as an initial barrier to
vicariant distribution and may have been responsible for the segregation of N.
intermedia from early N. lepida-stock. The modern Colorado River drainage
pattern became established during the latter part of the Pliocene and has
continued to the present (Wilson, 1967). Early drainage patterns of the ancestral
Colorado River did not include the southerly draining component which currently
separates Arizona and California. However the xeric entrenchment of this region
was extreme following the establishment of the current drainage pattern (Wilson,
1967).
Plant assemblages determined from woodrat midden materials suggest
communities to the north and east of the lower Colorado Valley resembled more
typically Great Basin and Mohave assemblages, including pinyon-juniper on
mountain ranges, while the majority of the Sonoran succulents and subtropical
plants were limited to refugia further south in Sonora (Van Devender, 1987). The
absence of these succulents and an increased area of aridity in the Colorado
Valley, dating from the Wisconsin through Holocene, suggests the presence of
effective vicariance that barriers alternately segregated desert woodrat populations
83
several times throughout the Pleistocene.
The direct fossil record of the N. lepida group is sketchy. Neotoma lepida
(sensu lato) has been reported in the fossil record from Arizona at more than
30,000 YBP (Mead et al., 1983). Records from the Picacho Peak area in
southeastern California date from the early Holocene (Cole, 1986). Specimens
from Nevada and New Mexico are reported from the mid-Rancholabrean (Kurten
and Anderson, 1980). Midden samples from near Catavina, Baja California
(Figure 21) record the presence of N. lepida (N. intermedia ?) from the mid-
Pleistocene (Wells, 1976). An interesting record of N. lepida is reported by Harris
(1984) from Jiminez Cave in southeastern Chihuahua (Figure 21). This record,
being far removed from any modern N. lepida population, is of late Pleistocene
origin, possibly suggesting a Wisconsin refugium for desert woodrats in the
Chihuahuan desert. The question to be addressed, however, is: Which species of
desert woodrat is represented by the sample? Harris (1984) reports that a
modern reference sample of "N. lepida" from California and Baja California differs
significantly in ml length from the Chihuahuan sample. This result is not
surprising since his reference sample would be referable to N. intermedia, which
has other diagnostic mensural characteristics that differ from other members of
the N. lepida group. No significant difference was found in ml length between
modern samples of N. lepida and N. devia collected in this study (mean = 2.98
mm, range 2.72-3.12, n = 17), however, the careful examination of additional
specimens of these species may uncover a distinction. A conscientious effort on
84
the part of paleontologists is needed to reevaluate the Neotoma fossils obtained
from the abundant midden sites to clarify the evolutionary history for the N. lepida
and other woodrat species.
Intrageneric relationships within the Genus Neotoma and an evaluation of
taxonomic subdivisions within the group.-Monophvletic status for the genus
Neotoma was supported by the mtDNA and allozyme analyses. The relationships
among the taxa, however, differ in several aspects from the taxonomic
arrangements suggested by Goldman (1910), Burt and Barkalow (1942), Hooper
(1960), and Hall (1981). The mtDNA cladogenesis for species of Neotoma
corresponds in some cases to subgeneric alignments proposed from data based on
differentially stained chromosomes (Koop et al., 1985) and phylogenetic
relationships based on morphological characters (Carleton, 1980).
Neotoma fuscipes and N. cinerea formed a monophyletic lineage removed
from members of the subgenus Neotoma. The relationship of N. fuscipes,
currently a member of the nominate subgenus, to members of Neotoma or
Teonoma was denied by Goldman (1910), who isolated N. fuscipes in the subgenus
Homodontomys. Burt and Barkalow (1942) later synonymized Homodontomys with
Neotoma, but retained the subgenus Teonoma for N. cinerea on the basis of
bacular specialization.
Neotoma fuscipes and N. cinerea are united by two unique chromosomal
synapomorphies (Koop et al., 1985) and five distintive morphological features
(Carleton, 1980). These two species differ with regard to diploid chromosomal
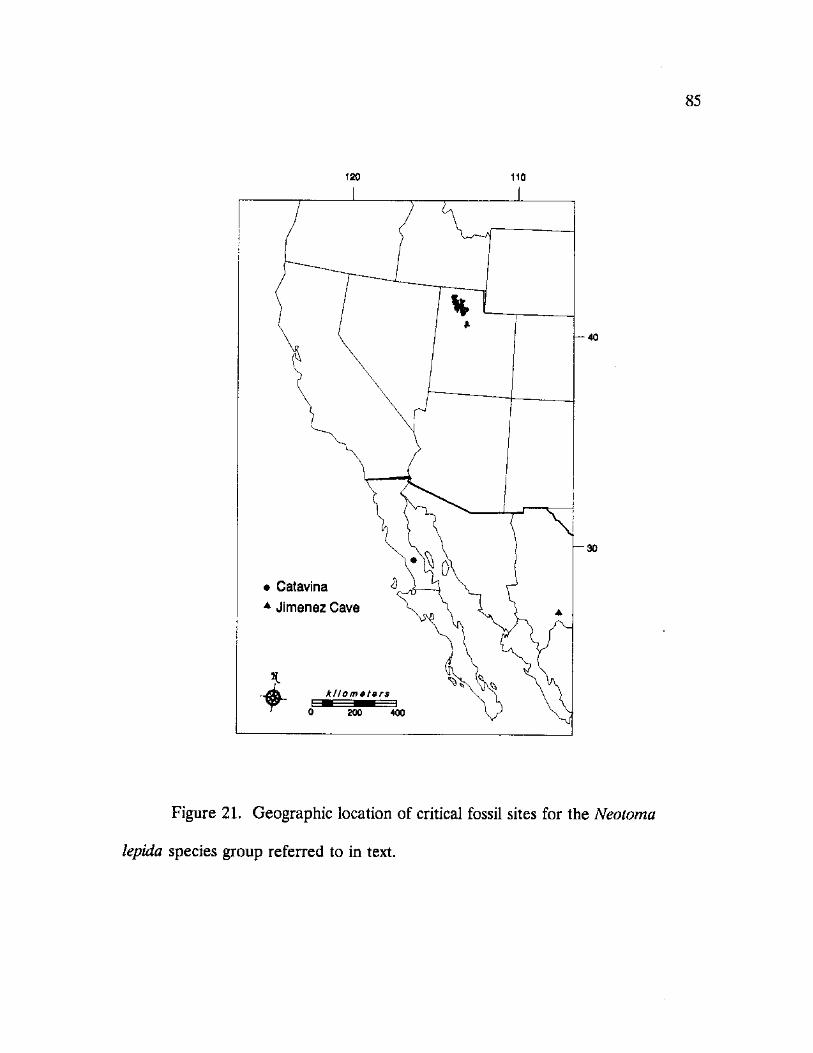
85
4 -
Catavina ^
Jimenez Cave
kilometers
0 200 400
-40
— 30
Figure 21. Geographic location of critical fossil sites for the Neotoma
lepida species group referred to in text.
86
number (2N=56 for N. fuscipes and 2N=54 for N. cinerea) from the typical
2N=52 reported for most other species of Neotoma (Baker and Mascarello, 1969;
Lee and Elder, 1977). Estimated degree of sequence divergence (6) based on
mtDNA data between the two species was 7.9 percent, a level comparable to the
amount of differentiation between the N. floridana and N. albigula species
complexes, but greater than values between closely related cryptic species and
sister taxa (Table 5).
Phenetic analysis of the mtDNA data presents a different, but explainable,
relationship between N. fuscipes and N. cinerea and the remaining taxa (Figure
17). Neotoma fuscipes and N. cinerea group together in a subcluster containing the
outgroup taxa (Ototylomys phyllotis and Xenomys nelsoni) for the cladistic analysis.
The phenogram is in agreement with the cladograms produced from phylogenetic
analysis of restriction site maps suggesting a basal relationship of N. fuscipes and
N. cinerea to the remaining members of the genus Neotoma. The relatively close
sequence relationship between the four taxa in this subcluster probably reflects the
retention of several pleisiomorphic characters that have been lost by the remaining
species of Neotoma.
Koop et al. (1985) presented two alternative suggestions concerning the
taxonomic treatment of N. cinerea and N. fuscipes: placement of N. cinerea into
the subgenus Neotoma or placement of both N. cinerea and N. fuscipes into the
subgenus Teonoma. The low level of resolution provided by the chromosomal
analysis prevented the authors from making any definitive taxonomic conclusions.
87
Based on the results of the allozyme and mtDNA analyses presented herein,
chromosomal analysis of Koop et al. (1985), and morphological evidence provided
by Carleton (1980), the arrangement of N. fuscipes in the subgenus Teonoma with
N. cinerea is warranted. The placement of N. cinerea into the subgenus Neotoma
is not supported based on the phylogenetic position that N. cinerea and N. fuscipes
hold with regard to other subgenera within the genus and unique morphological
and genetic characters which distinguish this group.
The placement of N. stephensi in association with N. mexicana is somewhat
surprising. Neotoma stephensi was originally placed in the desertorum group of the
subgenus Neotoma, which included the desert woodrats (currently referred to as
the N. lepida group) (Goldman, 1910). Burt and Barkalow (1942) removed N.
stephensi from association with the N. lepida group based on major differences in
the bacula described from the representative taxa, but did not assign the species
to any specific group. The status of N. stephensi was reviewed in studies of the
baculum (Hoffmeister and de la Torre, 1959) and morphology of the glans
(Hooper, 1960), and subspecies underwent taxonomic revision by Hoffmeister and
de la Torre (1960). These studies resulted in the suggestion that N. stephensi
should be placed between N. mexicana and N. phenax (Hooper, 1960).
Phylogenetic and phenetic analyses of allozymes and mtDNA restriction sites are
concordant with the suggestion of Hoffmeister and de la Torre (1959) and Hooper
(1960), placing N. stephensi as a sister taxon to N. mexicana. Cladistic analysis of
the chromosomes of these two species and N. phenax was unable to provide any
88
resolution concerning the position of these taxa with regard to other members of
the subgenus Neotoma (Koop et al., 1985). The mtDNA analysis, however, is in
agreement with the placement of N. phenax close to N. mexicana and N. stephensi.
Neotoma phenax is placed as a sister taxon to the clade containing the members of
the subgenus Neotoma, with the most basal members of that clade represented by
N. mexicana and N. stephensi. The retention of the monotypic subgenus Teonopus
with N. phenax as its sole species is recommended on the basis of the genetic data
presented herein and morphologic and karyotypic distinctions reported previously
(Merriam 1903; Burt and Barkalow, 1942; Baker and Mascarello, 1969).
The degree of genetic and morphological differentiation from other species
groups within the subgenus Neotoma exhibited by the members of the N. lepida
group warrants the recognition of a distinct subgenus for these taxa. The desert
woodrats form a discrete clade that is positioned basally to members of the
subgenus Neotoma and N. phenax, but not as distantly removed as are N. cinerea
and N. fuscipes. Collaborative research currently underway should result in a
taxonomic revision of this group of woodrats and additional information
concerning the species' limits and geographic ranges of its members.
The allozyme data, analysed phenetically and cladistically, are not
concordant (Figures 15 and 16). Agreement is also lacking between either of
these analyses and results of the mtDNA restriction sites data analyses. Major
topological discrepancies between the allozyme analyses primarily involve the
placement of N. phenax, N. fuscipes, and N. cinerea. Phenetic analysis of Rogers'
89
genetic distance results in N. fuscipes being placed on an independant branch, with
N. cinerea occurring in a subcluster with N. mexicana and N. stephensi. Neotoma
phenax is also placed on an independent branch but is associated with members of
the N. albigula complex, N. mexicana species-group, and N. cinerea. Although the
resultant topologies produced by the phenetic analyses show some measures of
similarity to the cladograms produced from the phylogenetic analyses, the use of
clustering methods using measures of genetic distance to infer phylogenies is not
justified since the assumption of an evolutionary clock cannot be assumed for
these taxa (Michener and Sokal, 1957; Felsenstein, 1984).
Cladistic analysis of the allozyme data set resulted in N. phenax being
placed in a clade with the N. lepida group. The placement of N. cinerea and N.
fuscipes differs between FREQPARS and Wagner Parsimony analyses (Figure 15).
FREQPARS placed N. fuscipes in its a clade branching basally to the remaining
Neotoma taxa, with N. cinerea on a branch sharing a common ancestor with
members of the subgenus Neotoma but excluding the N. lepida group. Wagner
Parsimony places N. fuscipes and N. cinerea on a clade containing N. floridana, N.
magister, N. mexicana, and N. stephensi. However bootstrap estimates for this
topology are nonsignificant, suggesting little credence should be placed in the
topology produced by this method (Figure 15).
CHAPTER V
CONCLUSIONS
Summary of taxomomic suggestions for the genus Neotoma.-Based on the
phytogenies developed using allozyme and mtDNA characters in this study, and
information concerning fossil, morphological, and genetic relationships among
members of the genus Neotoma, several suggestions relevant to the taxonomy and
evolutionary relationships of these organisms can be made.
Individuals currently assigned to N. albigula may well be represented by at
least two cryptic species. Populations of white-throated woodrats found to the
east and north of the Rio Grande River and east of the Rio Conchos in Mexico
represent a distinct species possibly referrable to N. leucodon Merriam. A strong
conviction for this taxonomic rearrangement cannot be made until critical
specimens from north eastern Mexico are examined. Populations currently
assigned to N. a. warreni would retain subspecific status under this proposed taxon.
The status of white-throated woodrats from western Chihuahua and Sonora is still
questionable. Degrees of genetic differentiation reported in this study between
samples of white-throated woodrats from western Mexico and populations from
Arizona, New Mexico, and Utah exceed the levels of differentiated exhibited by
other woodrat taxa and other rodent species assemblages reported in the
90
91
literature. Taxonomic considerations for this complex cannot be made at this
time. Firm geographic distributions of the genetically differentiated forms have
not been obtained to sufficiently describe biogeographic patterns that may be
responsible for incipient speciation in this group.
Based on the broad spectrum of evidence presented, the desert woodrats of
the N. lepida species-group represent a distinct lineage of at least subgeneric
status. Nomenclatoral consideration will be presented in a revisionary publication
on this group currently in preparation. Within this assemblage, the desert
woodrats of Baja California, Mexico and the coastal deserts of California
represent a distinct species, well differentiated from the inland, Mohave Desert /
Great Basin form, N. lepida. This species is assignable to N. intermedia Rhoads.
Neotoma stephensi should be considered as a member of the N. mexicana
species group. Although the vast majority of the range of N. mexicana was not
sampled during this study, some level of differentiation is evident between the
northern populations occurring in the United States and isolated populations in
more southern Mexico (Jalisco). Further study of the N. mexicana complex is
warranted especially at the southern terminus of the species' range in Central
America to assess the genetic continuity of this taxon and its relationship with N.
chrysomelas, also assigned to this species group.
Based on the results of the allozyme and mtDNA analyses presented
herein, chromosomal analysis of Koop et al. (1985), and morphological evidence
provided by Carleton (1980), the arrangement of N.fuscipes in the subgenus
92
Teonoma with N. cinerea is warranted. These taxa share a clade which is
positioned basally to the remaining members of the nominate genus. Although
the evidence provided by the various data sets is strong, a more stringent test of
the relationship between N. cinerea and N. fuscipes, and their evolutionary ties to
the other Neotoma would be possible if samples of Hodomys alleni and Nelsonia
neotomodon could be included.

APPENDIX I
SPECIMENS EXAMINED
93
94
APPENDIX I
SPECIMENS EXAMINED
(Museum acronyms described in Chapter II)
Neotoma micropus
TEXAS: Cottle Co., 12 mi. N Paducah (34°10'N 100°18'W) (1) CM.
El Paso Co., 6.75 mi N, 26.5 mi. E El Paso, 3950 ft. (31°51'N
106°03'30"W) (5) CM.
Foard Co., 3 mi. N Crowell (34°03'N 99°44'W) (1) CM.
Hood Co., 19.3 mi. SE Granbury (C. Russell Ranch) (4) CM; 17.5 mi. SE
Granbury (Fort Spunky) (1) CM.
Jack Co., 8 km SW Jacksboro (33°07'N 98°15'W) (10) CM.
Jeff Davis Co., 4.5 mi. S, 7.5 mi. E Kent (Long-X Ranch) (31°00'N
104°05'W) (2) CM.
Johnson Co., 4 km E Nemo (Fry Ranch) (4) CM.
Palo Pinto Co., 1 mi. W Palo Pinto (1) CM.
Taylor Co., 1.1 mi.S, 3.7 mi. W Merkel (32°37'N 100°05'W) (4) CM; 2.5mi. N,
1.8 mi. E Merkel (32°32'N 99°59'W) (.1) CM; 3 mi. N Merkel (32°31'N
10Q°01'W) (12) CM.
NEW MEXICO: Soccoro Co., Seviletta National Wildlife Refuge (21) MSB.
95
MEXICO: Est. Chihuahua, 3 km S, 14 km E Pancho Villa, west of Loma los
Ratones, 1500m (30°50'N 108°30'W) (2) MSB.
Neotoma albigula (sensu lato)
ARIZONA: Cochise Co., 3 mi. N, 1 mi. E Portal, 4600 ft. (31°57'N
109°07'30"W) (11) CM; 5mi. N Portal, 4600 ft. (31°59'N
109°07'30"W) (5) CM.
Coconino Co., 25 mi. NE Flagstaff, 5000 ft. (J) CM; 38 km N, 23 km E
Flagstaff, Coconino National Forest, 4500 ft. (2) CM.
Graham Co., Coronado National Forest, 21.5 mi. N, 5.5 mi. E Wilcox,
4200 ft. (32°33'N 109°45'W) (9) CM.
Mohave Co., 9 km S, 30 km W Kingman (near Oatman), 3000 ft.
(35°07'N 114°23'W) (3) CM.
COLORADO: Los Animas Co., Pinyon Canyon Maneuver Site, 16 mi. E
Thatcher, 4600 ft. (8) CM.
NEW MEXICO: Catron Co., 0.25 mi. S, 2.5 mi. W Mogollon, Gila National
Forest, 6800 ft. (33°23'N 108°50'W) (7) CM.
Dona Ana Co., 18 km W Newman (32°01'N 106°30'W) (4) CM.
Grant Co., Gila National Forest, 32km S, 18 km W Silver City, 6100 ft.
(32°30'N 108°30'W) (6) CM.
Sierra Co., 8 mi E Truth or Consequences (3) CM.
Socorro Co., 34 mi. S, 20 mi. W Socorro, R4W,T9S Sec 16 (2) MSB; 32mi. 5
26 mi. W Socorro, R5W, T8S Sec 4 (5) MSB.
96
TEXAS: El Paso Co., 6.75 mi. N, 26.5 mi. E El Paso, 3950 (31°51'N
106°03'30"W) (4) CM; 7.8 mi. N, 28 mi. E El Paso, (31°52'30"N
106°03'30"W) (3) CM; 8.5 mi. N, 28 mi. E El Paso, (31°53'N
106°02'30"W) (6) CM.
Foard Co., 3 mi. N Crowell (34°03'N 99°44'W) (1) CM.
Hardeman Co., Copper Breaks State Park, 13.2 mi. S, 1 mi. E Quanah
(34°07'N 99°44'W) (10) CM.
Jeff Davis Co., Long-X Ranch, 3 mi. S, 5 mi. E Kent (1) CM.
Moore Co., 9.5 mi. S, 18 miE Dumas (35°44'N 101°40'W) (1) CM.
Randall Co., Palo Duro Canyon State Park, 2.5 mi. S, 15.6 mi. E Canyon
(34°56'N 101°39'W) (8) CM.
UTAH: San Juan Co., Comb Wash, 4 mi. S, 10 mi. W Blanding (7) CM.
MEXICO: Est. Chihuahua, 3 km S, 14 km E Pancho Villa, west of Loma los
Ratones, 1500m (30°50'N 108°30'W) (10) MSB; 6 mi. SW V.
Ahumada (3) UV.
Est. Sonora, 1 mi. NNW San Carlos (1) MSB.
Neotoma albigula/micropus Hybrids
TEXAS: Foard Co,., 3 mi. N Crowell (34°03'N 99°44'W) (JVP 1846) (1) CM.
Jeff Davis Co., Long-X Ranch, 3 mi. S, 5 mi. E Kent (JVP 1937) (1) CM.
Moore Co., 9.5 mi. S, 18 mi E Dumas (JVP1695) (i) CM.
Neotoma floridana
KANSAS: Butler Co., 1 mi. W Potwin along Whitewater River (2) CM.
97
OKLAHOMA: Marshall Co., 3.6 mi. S, 2.3 mi- E Kingston (3) CM.
TEXAS: Cooke Co., 0.7 mi. S, 3.9 mi. E Valley View, 650 ft. (32° 29'N
97°06'W) (17) CM.
Dallas Co., 5.6 mi. SW Dallas (2) CM.
Denton Co., 2 mi. N, 2.8 mi. W Aubrey (33°20'N 97°02'W) (5) CM; 2.8 mi.
N, 6.5 mi. E Sanger, 630 ft. (33°23'30"N 97° 03'W) (7) CM.
Neotoma magister
WEST VIRGINIA: Hampshire Co., Nathaniel Mountain Public Hunting and
Fishing Area, 7.5 mi. S, 8.7 mi. W Augusta, 2880 ft. (39°H'N
78°47'30"W) (2) CM.
Hardy Co., 4 mi. N, 0.7 mi. E Bean Settlement, 3010 ft. (39°10'30"N
78°49'W) (7) CM.
Neotoma mexicana
COLORADO: Archuleta Co., 1.5 mi. S, 2 mi. W Chromo, 7500 ft. (37°05'N
106°50'W) (2) CM.
Costilla Co., 1 mi. S, 2 mi. W San Luis, 8000 ft. (37°15'N.
105°27'W) (5) CM.
Las Animas Co., Pinyon Canyon Maneuver Site, 1.2 mi. S, 20.4 mi. E
Thatcher, 5000 ft. (37°36'N 103°45'W) (5) CM.
NEW MEXICO: Catron Co., 0.25 mi. S, 2.5 mi. W Mogollon, Gila National
Forest, 6800 ft. (33°23'N 108°50'W) (5) CM; 1.5 mi. N, 0.75 mi. E
Luna, 7200 ft. (33°51'N 108°50'W) (8) CM.
98
TEXAS: Jeff Davis Co., Long-X Ranch, 8.2 mi. S, 7.8 mi. E Kent, 5620 ft.
(30°58'N 104°08'W) (4) CM.
MEXICO: Est. Durango, 18 mi. W Durango, 7000 ft. (2) UV.
Est. Jalisco, 8 mi. W Cocula, 5800 ft. (2) UV.
Neotoma pkenax
MEXICO: Est. Sonora, 8 mi NNW San Carlos, 500 ft. (28°20'N
111°10'W) (2) MSB.
Neotoma cinerea
COLORADO: Archuleta Co., 1.5 mi. S, 2 mi. W Chromo, 7500 ft. (37°05'N
106°50'W) (2) CM.
Conejos Co., Rio Grande National Forest, 12 mi. W Antonito, 8700 ft.
(37°04'N 106°12'W) (5) CM.
Costilla Co., 1 mi. S, 2 mi. W San Luis, 8000 ft. (37°15'N
105°27'W) (1) CM.
UTAH: Grand Co., Castle Valley, 12 mi. NE Moab (2) CM.
Neotoma stephensi
ARIZONA: Coconino Co., 25 mi. NE Flagstaff, 5000 ft. (<5) CM.
NEW MEXICO: Catron Co., 0.25 mi. S, 2.5 mi. W Mogollon, Gila National
Forest, 6800 ft. (33°23'N 108°50'W) (2) CM; 1.5 mi. N, 0.75 mi. E
Luna, 7200 ft. (33°51'N 108°50'W) (2) CM.
Neotoma devia
ARIZONA: Coconino Co., 25 mi. NE Flagstaff, 5000 ft. (4) CM; 38 km N, 23 km E
99
Flagstaff, Coconino National Forest, 4500 ft. (2) CM; 2 mi. S,
7 mi. E Marble Canyon (2) CM.
Mohave Co., 9 km S, 30 km W Kingman (near Oatman), 3000 ft.
(35°07'N 114°23'W) (3) CM.
Yuma Co., 50 km S, 7 km E Quartzsite, 3600 ft. (33°13'N
114°10'W) (4) CM.
Neotoma lepida
CALIFORNIA: Imperial Co., 7 mi. S, 3 mi. W Palo Verde, 270 ft. (33°27'N
114°45'W) (3) CM.
Riverside Co., 4 km N, 4.5 km W Desert Hot Springs, 1600 ft.
(33°59'N 116°32'45"W) (2) CM.
San Bernardino Co., 3 km N, 3 km W Yucca Valley, 4000 ft. (340ll'N
116°W) (2) CM; Cima Volcanic Fields, 7 km S, 28.5 km E
Baker (20) LACM.
UTAH: Cane Co., 32 mi. NNW Bigwater (2) CM.
Garfield Co., 8 mi. E Escalante (2) CM.
Washington Co., 13 km N, 6 km W St. George, 4000 ft. (37°12'N
113°38'W) (2) CM; 8 km S, 13 km E Hurricane, 4500 ft.
(37°06N 113°09'W) (5) CM.
Neotoma intermedia
CALIFORNIA: Los Angeles Co., Rancho Palos Berdes, Palo Verde Hills, 1/8 mi. E
of Marineland entrance, 135 ft. (7) LACM.
100
Riverside Co., 13 km S, 3 km W Palm Desert,elev 4000 ft. (Base of
Sugarloaf Mtn.) (33°35'N 116°26'W) (2) CM.
MEXICO: Est. Baja California, 90 km S Mexicali (31°52'N 115°10'W) (5) CM.
Est. Baja California Sur, 12 km S Santa Rosalia, 1000 ft. (27°14'N
115°10'W) (4) CM; Isla Santa Margarita, 2 km N, Naval Base (5) CM.
Neotoma fuscipes
CALIFORNIA: Orange Co.,2 mi. N, 16 mi. E El Toro, Trabuco Canyon
(2)LACM.
San Bernardino Co., 1 km W Morongo Valley, Dry Morongo Creek,
2800 ft. (34°03'N 116°37'W) (2) CM.
Ventura Co., Los Padres National Forest, Pine Mountain, T6N R24W NE
1/4 Sec 1 (2) LACM; Los Padres National Forest, 1/4 mi. W Blue
Point Campground (3) LACM.
Xenomys nelsoni
MEXICO: Est. Jalsico, 6 km E Chamela (J) TTU; 5 km S Chamela (J) TTU; 6
km SE Chamela (1) TTU.
Ototylomys phyllotis
MEXICO: Est. Campeche, 10 km N El Refugio (3); 18 km S X-Kanha (2)
ASNHC.

APPENDIX II
KARYOTYPING PROCEDURES
101
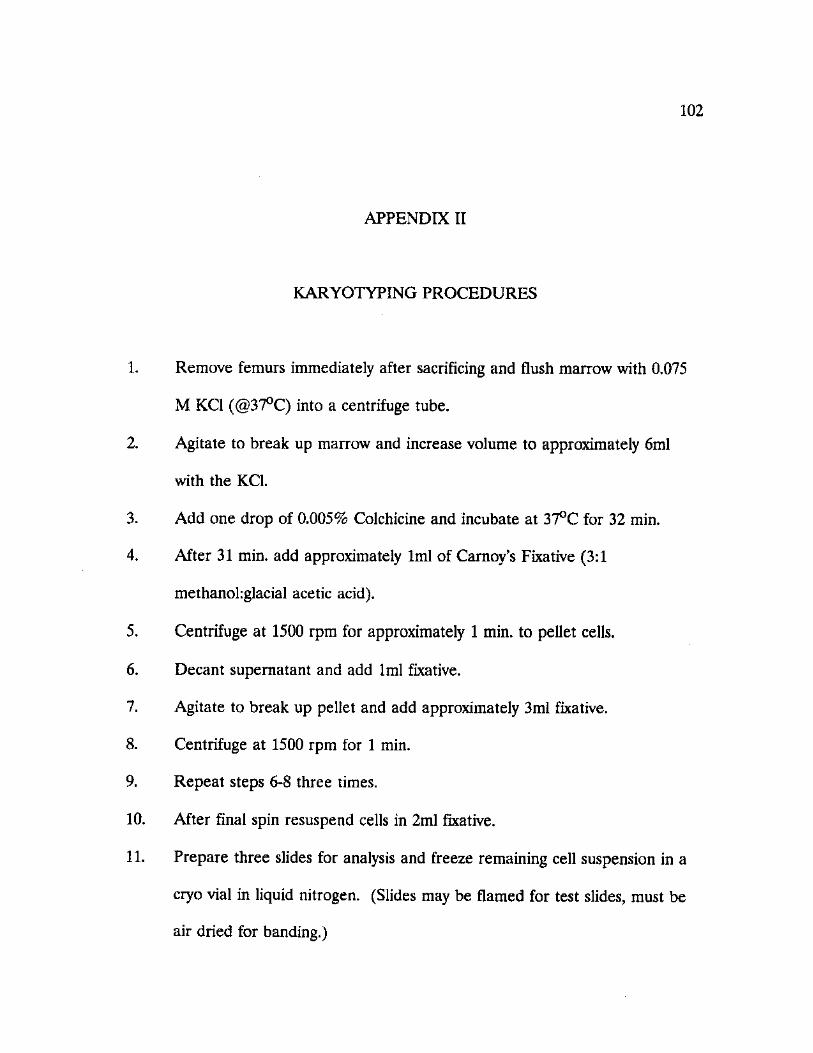
102
APPENDIX II
KARYOTYPING PROCEDURES
1. Remove femurs immediately after sacrificing and flush marrow with 0.075
M KC1 (@37°C) into a centrifuge tube.
2. Agitate to break up marrow and increase volume to approximately 6ml
with the KC1.
3. Add one drop of 0.005% Colchicine and incubate at 37°C for 32 min.
4. After 31 min. add approximately 1ml of Carnoy's Fixative (3:1
methanol:glacial acetic acid).
5. Centrifuge at 1500 rpm for approximately 1 min. to pellet cells.
6. Decant supernatant and add 1ml fixative.
7. Agitate to break up pellet and add approximately 3ml fixative.
8. Centrifuge at 1500 rpm for 1 min.
9. Repeat steps 6-8 three times.
10. After final spin resuspend cells in 2ml fixative.
11. Prepare three slides for analysis and freeze remaining cell suspension in a
cryo vial in liquid nitrogen. (Slides may be flamed for test slides, must be
air dried for banding.)
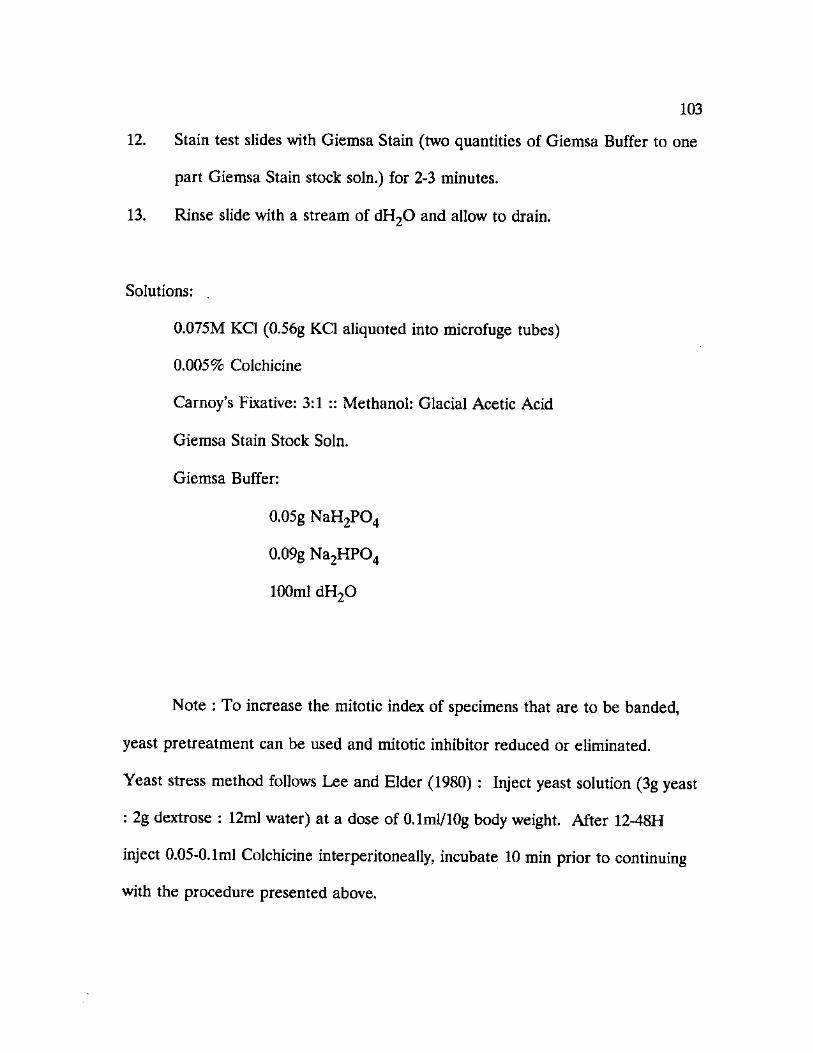
103
12. Stain test slides with Giemsa Stain (two quantities of Giemsa Buffer to one
part Giemsa Stain stock soln.) for 2-3 minutes.
13. Rinse slide with a stream of dH20 and allow to drain.
Solutions:
0.075M KC1 (0.56g KC1 aliquoted into microfuge tubes)
0.005% Colchicine
Carnoy's Fixative: 3:1 :: Methanol: Glacial Acetic Acid
Giemsa Stain Stock Soln.
Giemsa Buffer:
0.05g NaH2P04
0.09g Na2HP04
100ml dH2Q
Note : To increase the mitotic index of specimens that are to be banded,
yeast pretreatment can be used and mitotic inhibitor reduced or eliminated.
Yeast stress method follows Lee and Elder (1980) : Inject yeast solution (3g yeast
: 2g dextrose : 12ml water) at a dose of O.lml/lOg body weight. After 12-48H
inject 0.05-0. lml Colchicine interperitoneally, incubate 10 min prior to continuing
with the procedure presented above.
APPENDIX III
MITOCHONDRIAL DNA ISOLATION TECHNIQUES
104
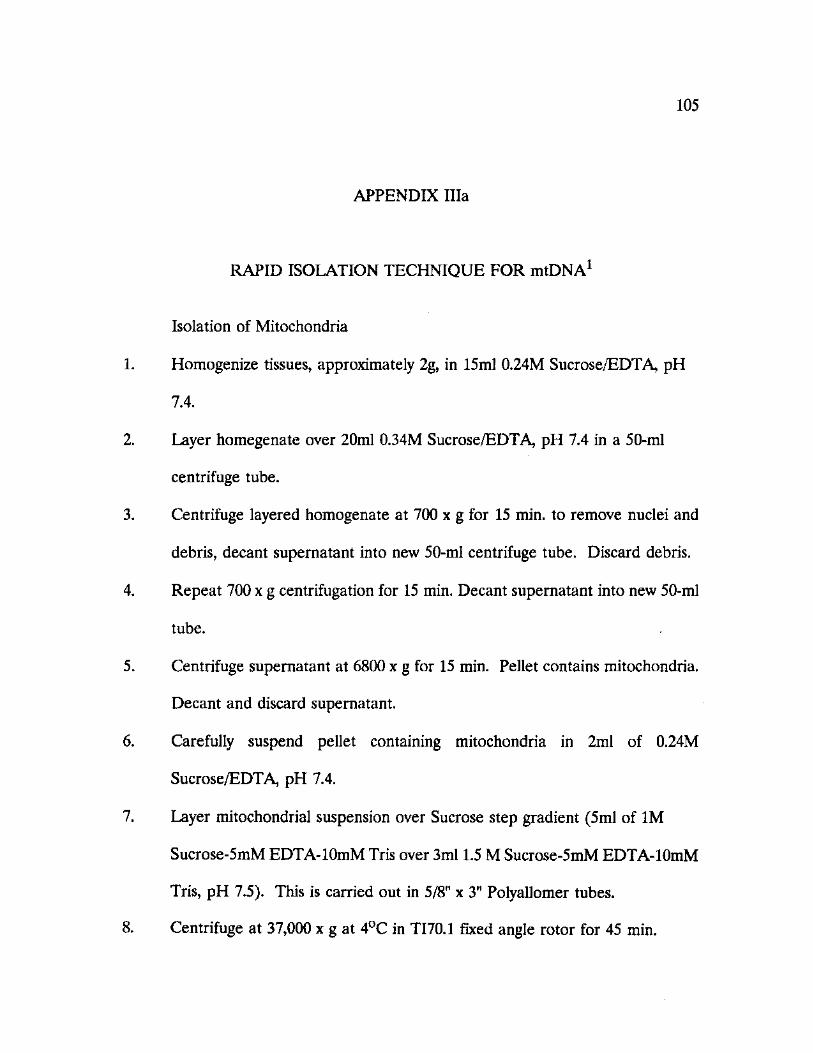
105
APPENDIX Ilia
RAPID ISOLATION TECHNIQUE FOR mtDNA1
Isolation of Mitochondria
1. Homogenize tissues, approximately 2g, in 15ml 0.24M Sucrose/EDTA, pH
7.4.
2. Layer homegenate over 20ml 0.34M Sucrose/EDTA, pH 7.4 in a 50-ml
centrifuge tube.
3. Centrifuge layered homogenate at 700 x g for 15 min. to remove nuclei and
debris, decant supernatant into new 50-ml centrifuge tube. Discard debris.
4. Repeat 700 x g centrifugation for 15 min. Decant supernatant into new 50-ml
tube.
5. Centrifuge supernatant at 6800 x g for 15 min. Pellet contains mitochondria.
Decant and discard supernatant.
6. Carefully suspend pellet containing mitochondria in 2ml of 0.24M
Sucrose/EDTA, pH 7.4.
7. Layer mitochondrial suspension over Sucrose step gradient (5ml of 1M
Sucrose-5mM EDTA-lOmM Tris over 3ml 1.5 M Sucrose-5mM EDTA-lOmM
Tris, pH 7.5). This is carried out in 5/8" x 3" Polyallomer tubes.
8. Centrifuge at 37,000 x g at 4°C in TI70.1 fixed angle rotor for 45 min.
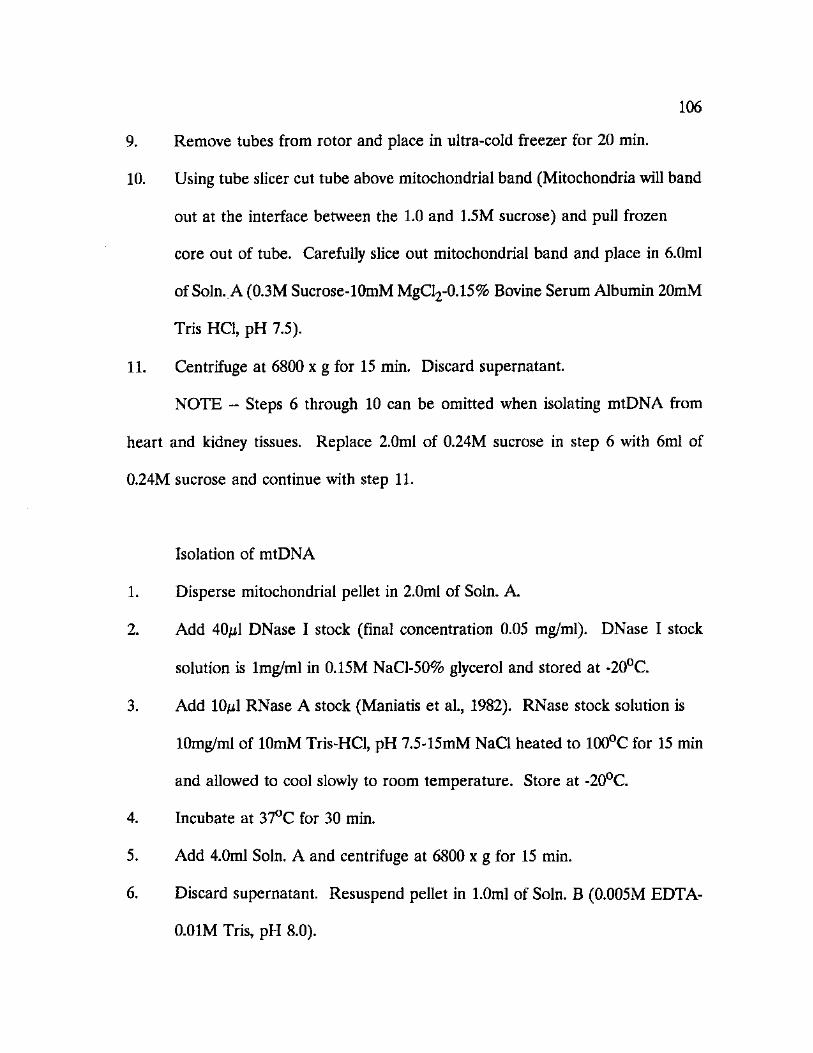
106
9. Remove tubes from rotor and place in ultra-cold freezer for 20 min.
10. Using tube slicer cut tube above mitochondrial band (Mitochondria will band
out at the interface between the 1.0 and 1.5M sucrose) and pull frozen
core out of tube. Carefully slice out mitochondrial band and place in 6.0ml
of Soln..A (0.3M Sucrose-lOmM MgCl2-0.15% Bovine Serum Albumin 20mM
Tris HC1, pH 7.5).
11. Centrifuge at 6800 x g for 15 min. Discard supernatant.
NOTE - Steps 6 through 10 can be omitted when isolating mtDNA from
heart and kidney tissues. Replace 2.0ml of 0.24M sucrose in step 6 with 6ml of
0 .24 . sucrose and continue with step 11.
Isolation of mtDNA
1. Disperse mitochondrial pellet in 2.0ml of Soln. A.
2. Add 40^1 DNase I stock (final concentration 0.05 mg/ml). DNase I stock
solution is lmg/ml in 0.15M NaCl-50% glycerol and stored at -20°C.
3. Add lOjul RNase A stock (Maniatis et al., 1982). RNase stock solution is
lOmg/ml of lOmM Tris-HCl, pH 7.5-15mM NaCl heated to 100°C for 15 min
and allowed to cool slowly to room temperature. Store at -20°C.
4. Incubate at 37°C for 30 min.
5. Add 4.0ml Soln. A and centrifuge at 6800 x g for 15 min.
6. Discard supernatant. Resuspend pellet in 1.0ml of Soln. B (0.005M EDTA-
0.01M Tris, pH 8.0).
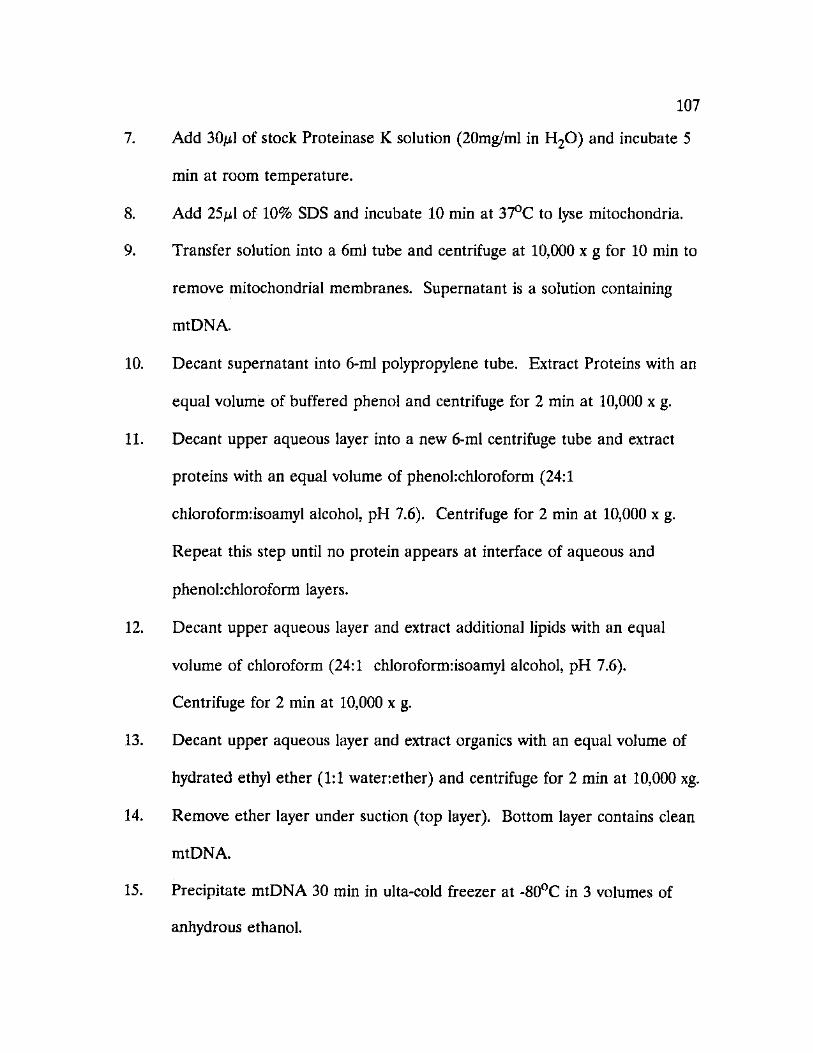
107
7. Add 30/Ltl of stock Proteinase K solution (20mg/ml in H 2 0) and incubate 5
min at room temperature.
8. Add 25jul of 10% SDS and incubate 10 min at 37°C to lyse mitochondria.
9. Transfer solution into a 6ml tube and centrifuge at 10,000 x g for 10 min to
remove mitochondrial membranes. Supernatant is a solution containing
mtDNA.
10. Decant supernatant into 6-ml polypropylene tube. Extract Proteins with an
equal volume of buffered phenol and centrifuge for 2 min at 10,000 x g.
11. Decant upper aqueous layer into a new 6-ml centrifuge tube and extract
proteins with an equal volume of phenolxhloroform (24:1
chloroform:isoamyl alcohol, pH 7.6). Centrifuge for 2 min at 10,000 x g.
Repeat this step until no protein appears at interface of aqueous and
phenolxhloroform layers.
12. Decant upper aqueous layer and extract additional lipids with an equal
volume of chloroform (24:1 chloroform:isoamyl alcohol, pH 7.6).
Centrifuge for 2 min at 10,000 x g.
13. Decant upper aqueous layer and extract organics with an equal volume of
hydrated ethyl ether (1:1 water:ether) and centrifuge for 2 min at 10,000 xg.
14. Remove ether layer under suction (top layer). Bottom layer contains clean
mtDNA.
15. Precipitate mtDNA 30 min in ulta-cold freezer at -80°C in 3 volumes of
anhydrous ethanol.
108
16. Centrifuge at 10,000 rpm for 20 min to pellet mtDNA.
17. Decant ethanol and wash pellet with 1ml 70% ethanol to remove residual
salts.
18. Carefully remove 70% ethanol under suction and vacuum evaporate
ethanol in vacuo.
19. Resuspend pellet in an appropriate amount of TE Buffer and store frozen
at 20°C until used for restriction analysis.
RECIPES
0.24M Sucrose/ ImM EDTA. pH 7.4
85.6g Sucrose
0.373g EDTA
800ml H 2 0
Adjust pH with NaOH to 7.4 and dilute to 1 liter.
0.34M Sucrose/ ImM EDTA. pH 7.4
116.4g Sucrose
0.373g EDTA
800ml H 2 0
Adjust pH with NaOH to 7.4 and dilute to 1 liter.
109
Solution A (0.3M Sucrose-lOmM MgCl2-0.15% BSA-20mM Tris)
20.54g Sucrose
0.40g MgCl2
0.30g BSA
0.48g Tris
160ml H2O
Adjust pH to 7.5 with HC1 and dilute to 200ml.
Solution B (U005M EDTA-0.01M Tris)
0.37g EDTA
0.24g Tris
160ml H 2 0
Adjust pH to 8.0 with HC1 and dilute to 200ml.
Condensed from Zimmerman et al. (1988)
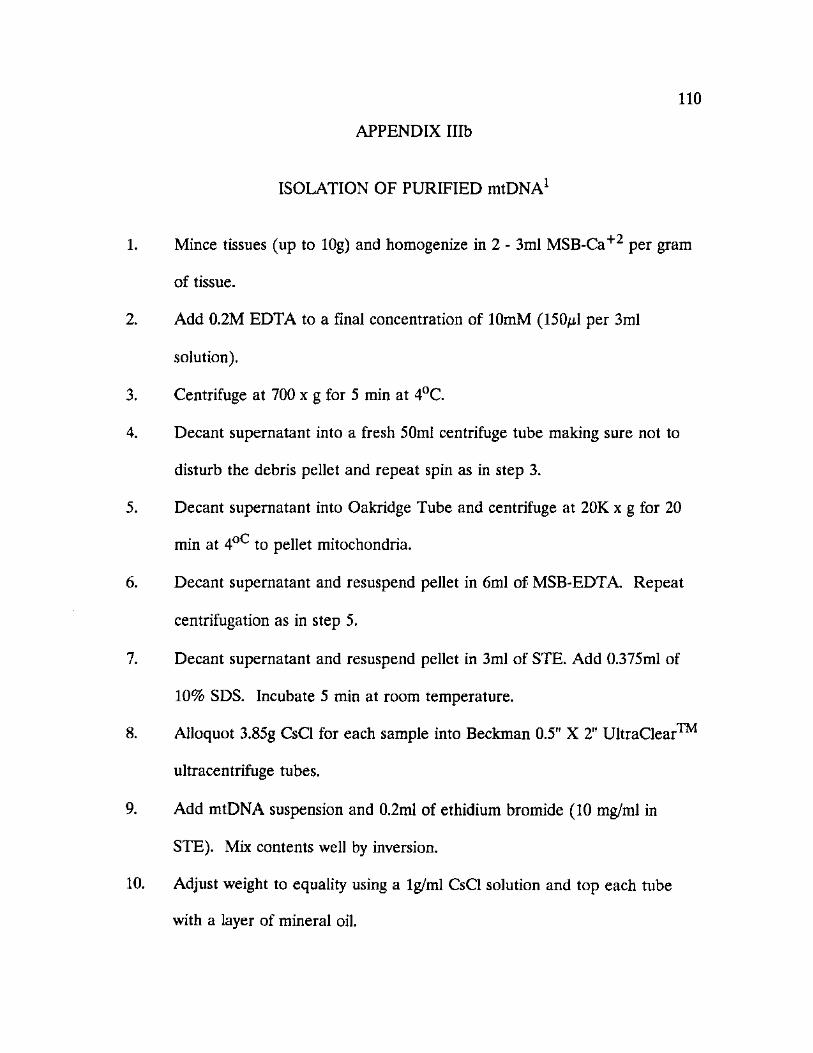
110
APPENDIX Illb
l ISOLATION OF PURIFIED mtDNA
1. Mince tissues (up to lOg) and homogenize in 2 - 3ml MSB-Ca+2 per gram
of tissue.
2. Add 0.2M EDTA to a final concentration of lOmM (150/il per 3ml
solution).
3. Centrifuge at 700 x g for 5 min at 4°C.
4. Decant supernatant into a fresh 50ml centrifuge tube making sure not to
disturb the debris pellet and repeat spin as in step 3.
5. Decant supernatant into Oakridge Tube and centrifuge at 20K x g for 20
min at 4o C to pellet mitochondria.
6. Decant supernatant and resuspend pellet in 6ml of MSB-EDTA Repeat
centrifugation as in step 5.
7. Decant supernatant and resuspend pellet in 3ml of STE. Add 0.375ml of
10% SDS. Incubate 5 min at room temperature.
8. Alloquot 3.85g CsCl for each sample into Beckman 0.5" X 2" UltraClear™
ultracentrifuge tubes.
9. Add mtDNA suspension and 0.2ml of ethidium bromide (10 mg/ml in
STE). Mix contents well by inversion.
10. Adjust weight to equality using a lg/ml CsCl solution and top each tube
with a layer of mineral oil.
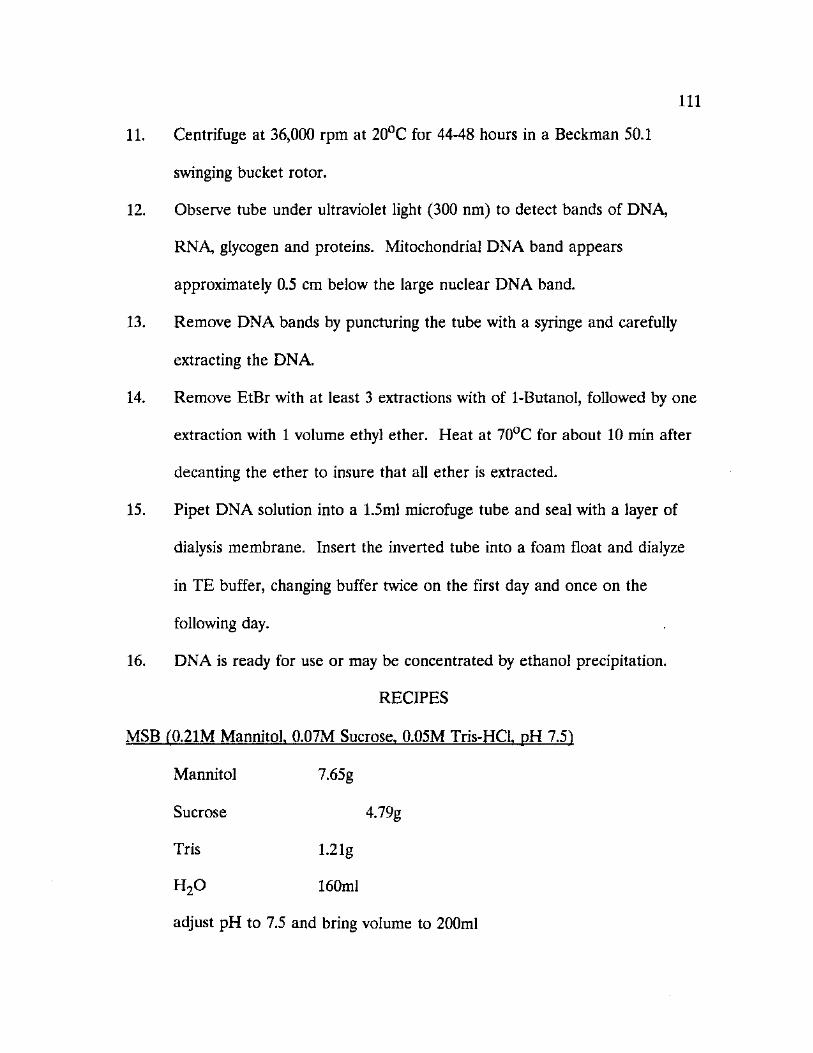
I l l
11. Centrifuge at 36,000 rpm at 20°C for 44-48 hours in a Beckman 50.1
swinging bucket rotor.
12. Observe tube under ultraviolet light (300 nm) to detect bands of DNA,
RNA, glycogen and proteins. Mitochondrial DNA band appears
approximately 0.5 cm below the large nuclear DNA band.
13. Remove DNA bands by puncturing the tube with a syringe and carefully
extracting the DNA.
14. Remove EtBr with at least 3 extractions with of 1-Butanol, followed by one
extraction with 1 volume ethyl ether. Heat at 70°C for about 10 min after
decanting the ether to insure that all ether is extracted.
15. Pipet DNA solution into a 1.5ml microfuge tube and seal with a layer of
dialysis membrane. Insert the inverted tube into a foam float and dialyze
in TE buffer, changing buffer twice on the first day and once on the
following day.
16. DNA is ready for use or may be concentrated by ethanol precipitation.
RECIPES
MSB IU21M Mannitol. 0.07M Sucrose. 0.05M Tris-HCl. pH 7.51
Mannitol 7.65g
Sucrose 4.79g
Tris 1.21g
H 2 0 160ml
adjust pH to 7.5 and bring volume to 200ml
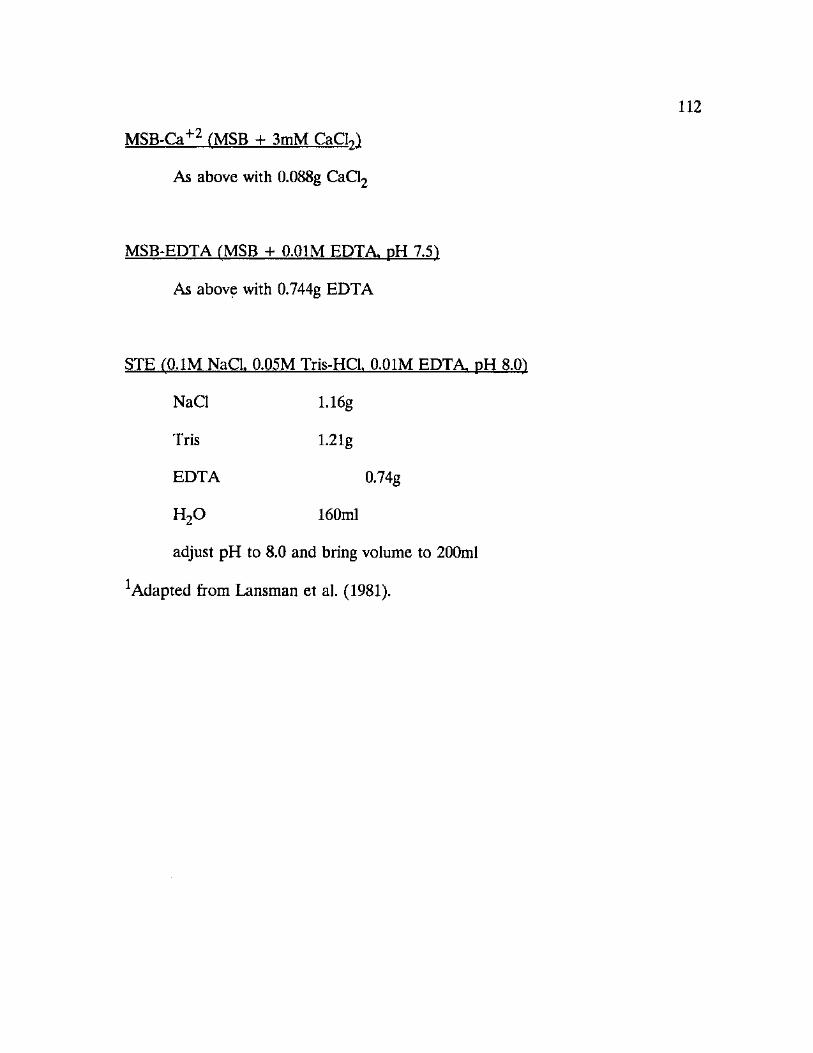
112
MSB-Ca+2 fMSB + 3mM CaCM
As above with 0.088g CaCl2
MSB-EDTA rMSB + 0.01M EDTA. pH 7.51
As above with 0.744g EDTA
STE r O . l M N a d 0.05M Tris-HCl. Q.01M EDTA. pH 8.01
NaCl 1.16g
Tris 1.21g
EDTA 0.74g
H 2 0 160ral
adjust pH to 8.0 and bring volume to 200ml
Adapted from Lansman et al. (1981).
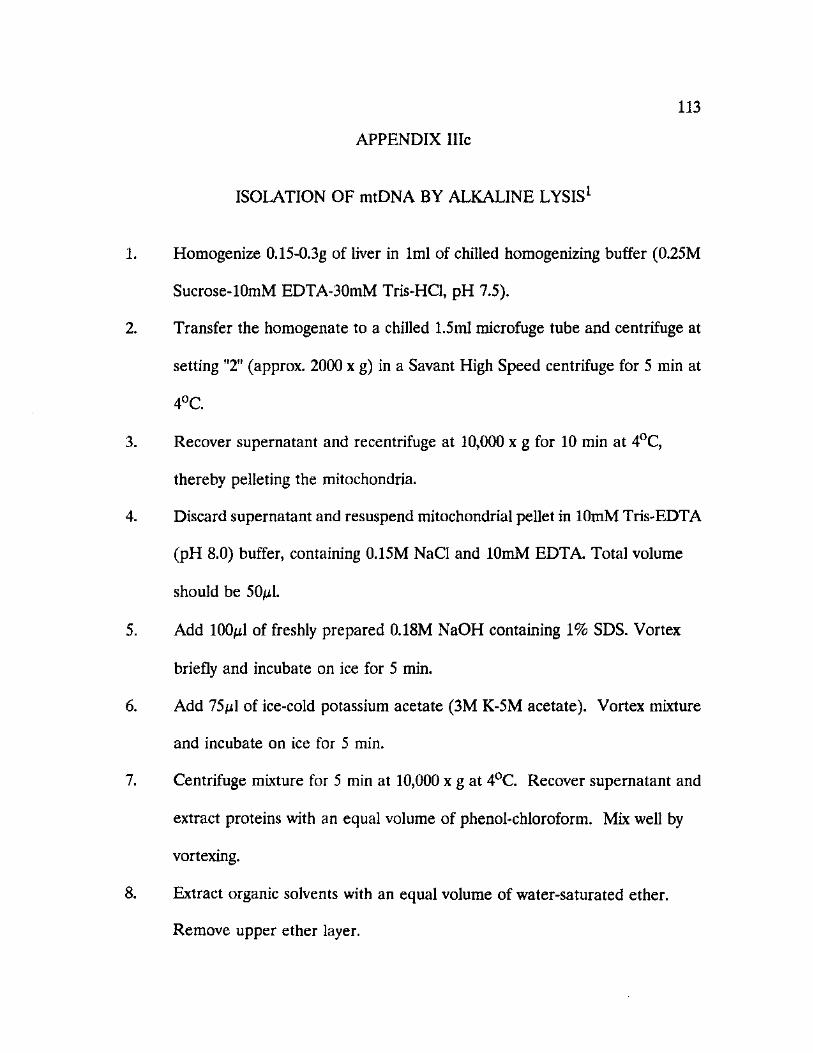
113
APPENDIX IIIc
ISOLATION OF mtDNA BY ALKALINE LYSIS1
1. Homogenize 0.15-0.3g of liver in 1ml of chilled homogenizing buffer (0.25M
Sucrose-lOmM EDTA-30mM Tris-HCl, pH 7.5).
2. Transfer the homogenate to a chilled 1.5ml microfuge tube and centrifuge at
setting "2" (approx. 2000 x g) in a Savant High Speed centrifuge for 5 min at
4°C.
3. Recover supernatant and recentrifuge at 10,000 x g for 10 min at 4°C,
thereby pelleting the mitochondria.
4. Discard supernatant and resuspend mitochondrial pellet in lOmM Tris-EDTA
(pH 8.0) buffer, containing 0.15M NaCl and lOmM EDTA. Total volume
should be 50/il.
5. Add lOOjiil of freshly prepared 0.18M NaOH containing 1% SDS. Vortex
briefly and incubate on ice for 5 min.
6. Add 75jul of ice-cold potassium acetate (3M K-5M acetate). Vortex mixture
and incubate on ice for 5 min.
7. Centrifuge mixture for 5 min at 10,000 x g at 4°C. Recover supernatant and
extract proteins with an equal volume of phenol-chloroform. Mix well by
vortexing.
8. Extract organic solvents with an equal volume of water-saturated ether.
Remove upper ether layer.
114
9. Add 2-3 volumes of anhydrous ethanol and centrifuge for 15 min at room
temperature and 10,000 x g.
10. Decant ethanol and wash resulting DNA pellet with 1ml of 70% ethanol.
Centrifuge at 10,000 x g for 5 min to repellet the DNA. Discard 70% ethanol.
Dry pellet briefly (2 min) in vacuo.
11. Resuspend pellet in 15-20/xl of TE buffer. If DNA is to be stored, treat with
ljul of DNase-free RNase prior to storage.
Adapted from Tamura, K. and T. Aotsuka (1988).
115
APPENDIX Illd
ISOLATION OF TOTAL GENOMIC DNA
1. Mince tissue very fine using a scalpel or razor blade.
2. Transfer tissue into 1ml of Solution B (0.005M EDTA-0.01M Tris, pH 8.0) in
a 15ml conical centrifuge tube. Vortex the mixture briefly, 5 seconds, then
wash down the sides of the tube with 1ml of Soln. B.
3. Add 30jul of 20% SDS and 70/ul of Proteinase K (20 mg/ml in H20).
4. Incubate for 5 hours in a shaking waterbath at 50°C.
5. Centrifuge at 3000 x g for 10 min to sediment any undigested particles.
6. Decant supernatant into a 6-ml polypropylene tube. Extract Proteins with an
equal volume of buffered phenol and centrifuge for 2 min at 10,000 x g.
7. Decant upper aqueous layer into a new 6-ml centrifuge tube and extract
proteins with an equal volume of phenolxhloroform (24:1 chloroform:isoamyl
alcohol, pH 7.6). Centrifuge for 2 min at 10,000 x g. Repeat this step until no
sediment appears at interface of aqueous and phenolxhloroform layers.
8. Decant upper aqueous layer and extract additional lipids with an equal volume
of chloroform (24:1 chloroform:isoamyl alcohol, pH 7.6). Centrifuge for 2
min at 10,000 x g.
9. Decant upper aqueous layer and extract organics with an equal volume of
hydrated ethyl ether (1:1 watenether) and centrifuge for 2 min at 10,000 x g.
10. Remove ether layer under suction (top layer). Heat at 70°C for about 10 min
116
after decanting the ether to insure that all ether is extracted.
11. Precipitate DNA with an equal volume of 1-Propanol in -80°C for 30 min.
Centrifuge for 20 min at 10,000 x g at 4°C to recover DNA.
12. Wash DNA pellet with 70% ethanol and dry in vacuo for 5 min.
13. Resuspend pellet in 1ml of sterile H 2 0 or TE and store frozen until used for
restriction analysis.

APPENDIX IV
SOUTHERN TRANSFER
117
APPENDIX IV
SOUTHERN TRANSFER
1. Electrophorese DNA that has been cut with restriction enzymes an 0.7, 1.0
or 1.2% agarose gel. (65v = 5.5 to 6 hrs., 32v = 1 1 hrs. for 1.0% gels)
2. Cut wells off of the gel and trim if neccessary. Mark size standard lane by
clipping the anodal corner of the gel at the with a razor blade.
3. Place gel in Denaturation soln. (0.4M NaOH, 0.6M NaCl) on shaker at
room temp, for 30 min.
4. Soak gel in Neutralization soln. (1.5M NaCl, 0.5M Tris, pH 7.5) on shaker
at room temperature for 30 min.
5. Cut the nylon transfer membrane (Magna NT™, MSI, Inc.) to the size of
the gel and cut corner to match marking on gel. Wet nylon in ddH20 and
then soak in 10X SSC for approximately 1 min.
6. Layer three sheets of blotting paper (Whatman 3MM) which are cut 7cm
longer than the gel on a platform so that the ends contact a reservoir of
10X SSC. Place the gel such that it will be oriented DNA side up on the
platform.
7. Place the nylon membrane on the gel making sure to align the origin of the
gel with the edge of the membrane. Carefully remove any bubbles by
rolling a glass rod over the filter. Place three to five layers of blotter paper
cut to the size of the gel on top of the filter making sure to remove all air
118

119
and bubbles. Layer approximately six inches of blotting pads or paper
towels on top. Place a glass plate over the stack. Weight the assembly
with a 500-1000ml flask of water and allow it to blot overnight.
8. Remove the paper towels and blotter paper. Label the DNA-side of the
membrane with pencil or permanent ink.
9. Crosslink the DNA onto the membrane by exposing it to UV (254nm) light
for 3 min at a distance of 10cm.
APPENDIX V
LABELING OF PROBES AND HYBRIDIZATION
120
APPENDIX V
LABELING OF PROBES AND HYBRIDIZATION
Preparation of probes (32P-dCTP and Digoxigenin labeling)
1. Prepare probe or oligonucleotide for labeling (i.e. with mtDNA probes in
pUC 18 digest from l-3^g of probe with Hinf II for 30 min to linearize
plasmid with insert).
2. To prepared probe add 2/zl of hexanuclucleotide primers and 2/il of dNTP
mixture and adjust volume to a total of 19/zl. For 32P-dCTP labeling, dNTP
mixture lacks dCTP. Radioactive nucleotide must be added independently.
3. Heat-denature mixture for 10 min at 98°C and then place immediately on
ice.
4. Spin down mixture briefly and add 1/xl Klenow enzyme, mix well then spin
down briefly.
5. Incubate at 37°C for at least 45 min to allow random priming reaction to
effectively label probes.
6. Probes can now be diluted and stored for later use (dilute to 75^1).
Radioactively-labelled probes must be measured on a liquid scintillation
counter such that proper amounts of probe can be used during
hybridizations.
121
122
Hybridization with 32P-dCTP-labelled probes
1. Preheat hybridization solution (see below) to 65oC for 10-15 min. Add
0.58g NaCl and heat for an additional 10-15 min at 65°C.
2. Place membrane in a thermal sealable hybridization bag and seal the edge.
Make a .small hole in the corner and pipet the hybridization soln. (10-15ml)
into the bag. Remove as much of the air as possible and reseal the corner.
Incubate at 65°C in shaking water bath for 30 min.
3. Prepare the probe mixture as follows:
To 500/xl of TE, add 100/il of salmon sperm DNA (lOOjug/ml) and the
equivalent of 106 counts per min. of each probe. Denature the probes at
95°C for 10 min and place immediately on ice until used.
4. Using a syringe, inject the probe mix into the hybridization bag, remove all
air bubbles, and reseal.
5. Hybridize at 65°C in a shaking water bath overnight.
6. Decant the radioactive hybridiztion solution into an approved liquid waste
container and perform three 5-min washes on the membranes in
approximately 500ml of 2X SSC at room temperature with mild agitation.
7. Wash the membrane once in 500ml of 2X SSC, 1% SDS in a 65°C in a
shaking water bath for 30 min.
8. Rinse the nmembranes breifly with 2X SSC, blot the filter with a piece of
absorbent paper, and then place in a resealable plastic bag. Do not allow
the nylon to dry completely if planning to reprobe.
123
9. Detect DNA restriction patterns by autoradiography. Expose film for 24
hrs. to 10 days, depending on the quantity of DNA used, using an
intensifier screen at -80°C.
** For alternate washing schemes see Micron Separations Inc. information manual
Probe removal
1. Wash membranes in 0.4N NaOH at 42°C for 30 min.
2. Wash for 30 min in probe removal soln. (0.1X SSC, 0.1% SDS, 0.2M Tris-
HC1, pH 7.5).
3. Check membrane with a minimonitor to determine if any radioactivity
remains. If necessary, repeat steps 1 and 2.
4. Prehybridize and hybridize membranes as before.
Hybridization Solution
7ml H 2 0
2ml 50% dextarn sulfate
lml 10% SDS
Add 0.58g NaCl prior to use.
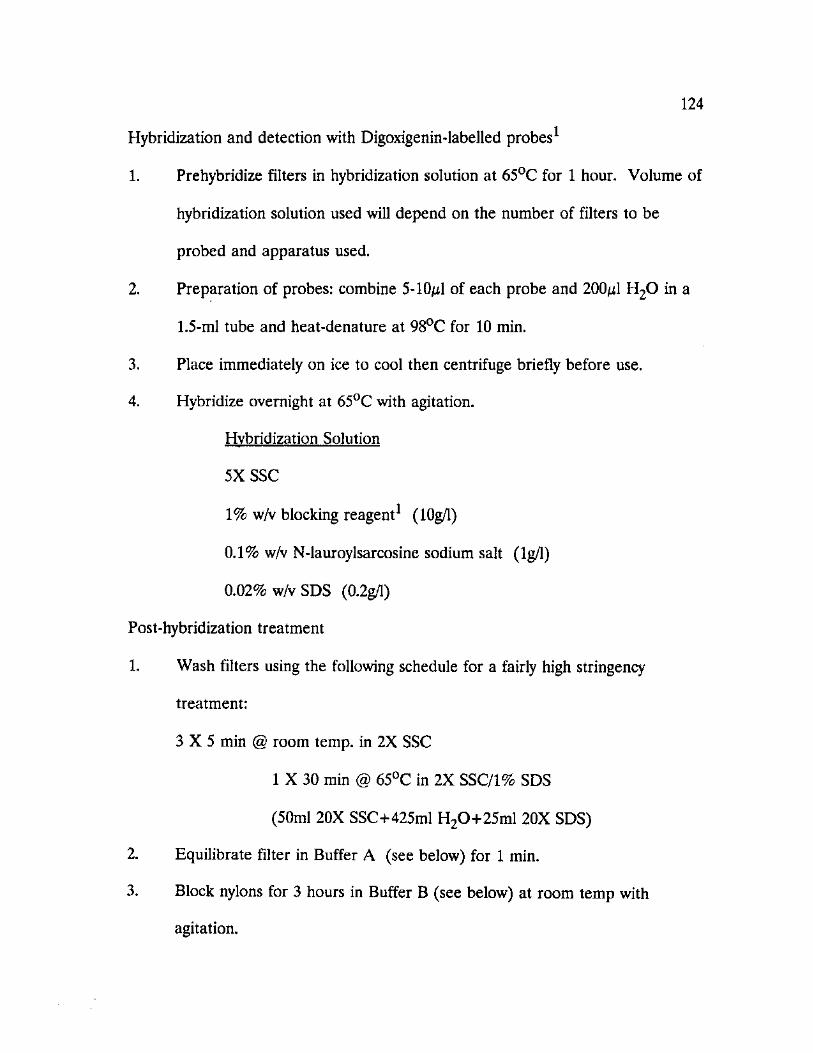
124
Hybridization and detection with Digoxigenin-labelled probes1
1. Prehybridize filters in hybridization solution at 65°C for 1 hour. Volume of
hybridization solution used will depend on the number of filters to be
probed and apparatus used.
2. Preparation of probes: combine 5-10/xl of each probe and 200^1 H 2 0 in a
1.5-ml tube and heat-denature at 98°C for 10 min.
3. Place immediately on ice to cool then centrifuge briefly before use.
4. Hybridize overnight at 65°C with agitation.
Hybridization Solution
5XSSC
1% w/v blocking reagent1 (10g/l)
0.1% w/v N-lauroylsarcosine sodium salt (lg/1)
0.02% w/v SDS (0.2g/l)
Post-hybridization treatment
1. Wash filters using the following schedule for a fairly high stringency
treatment:
3 X 5 min @ room temp, in 2X SSC
1 X 30 min @ 65°C in 2X SSC/1% SDS
(50ml 20X SSC+425ml H20+25ml 20X SDS)
2. Equilibrate filter in Buffer A (see below) for 1 min.
3. Block nylons for 3 hours in Buffer B (see below) at room temp with
agitation.

125
4. Dilute anti-DIG/AP conjugate 1:5000 (i.e. 12jul Vial 8 + 60ml Buffer B).
5. Incubate filter for 1 hour or more in anti-DIG soln at room temp while
agitating.
6. Wash filter 2 X 15 min in Buffer A at room temp while shaking.
7. Equilibrate filter in Buffer C (see below) for 2 min.
BUFFER A
12.1 lg Tris
8.77g NaCl
900ml H 2 0
pH 7.5 dilute to 1L
BUFFER B (2% w/v Blocking Agent in Buffer A)
200ml Buffer A
4g Blocking Agent
BUFFER C
12.11g Tris
5.85g NaCl
10.17g MgCI2
pH 9.5 adjust to 1L
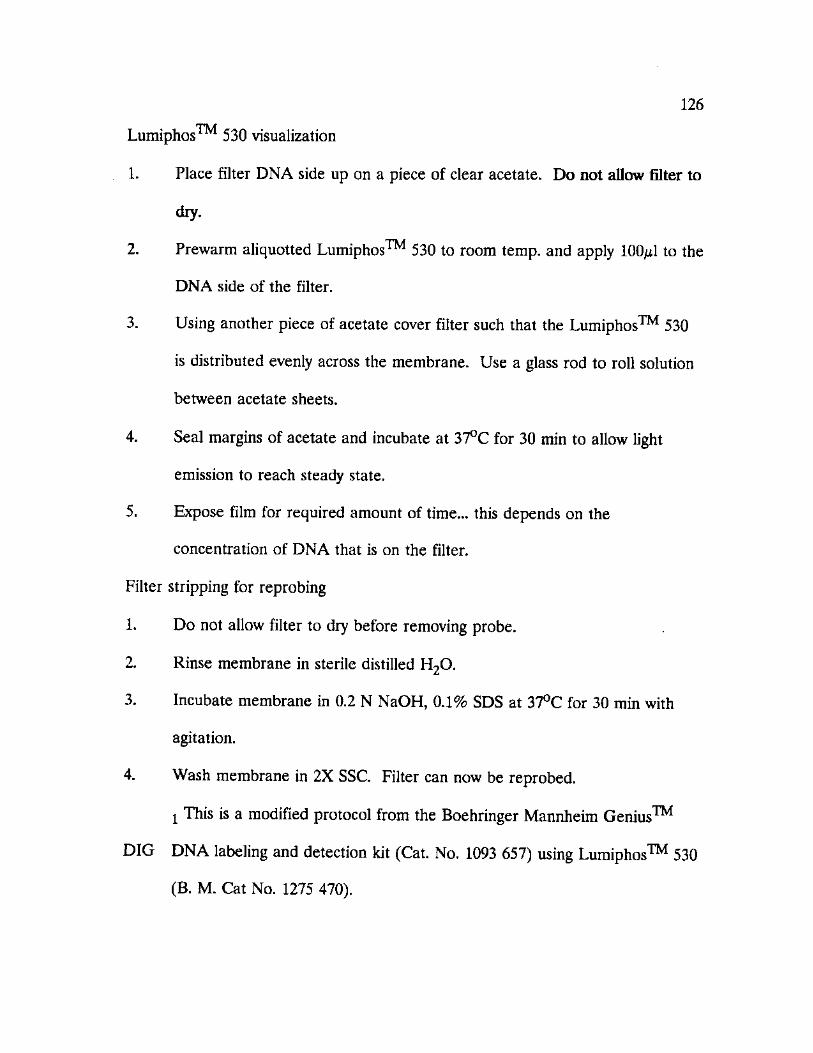
126
Lumiphos™ 530 visualization
1. Place filter DNA side up on a piece of clear acetate. Do not allow filter to
dry.
2. Prewarm aliquotted Lumiphos™ 530 to room temp, and apply 100/xl to the
DNA side of the filter.
3. Using another piece of acetate cover filter such that the Lumiphos™ 530
is distributed evenly across the membrane. Use a glass rod to roll solution
between acetate sheets.
4. Seal margins of acetate and incubate at 37°C for 30 min to allow light
emission to reach steady state.
5. Expose film for required amount of time... this depends on the
concentration of DNA that is on the filter.
Filter stripping for reprobing
1. Do not allow filter to dry before removing probe.
2. Rinse membrane in sterile distilled H 20.
3. Incubate membrane in 0.2 N NaOH, 0.1% SDS at 37°C for 30 min with
agitation.
4. Wash membrane in 2X SSC. Filter can now be reprobed.
I This is a modified protocol from the Boehringer Mannheim Genius™
DIG DNA labeling and detection kit (Cat. No. 1093 657) using Lumiphos™ 530
(B. M. Cat No. 1275 470).
APPENDIX VI
ALLELE FREQUENCIES FOR NEOTOMA SAMPLED
127
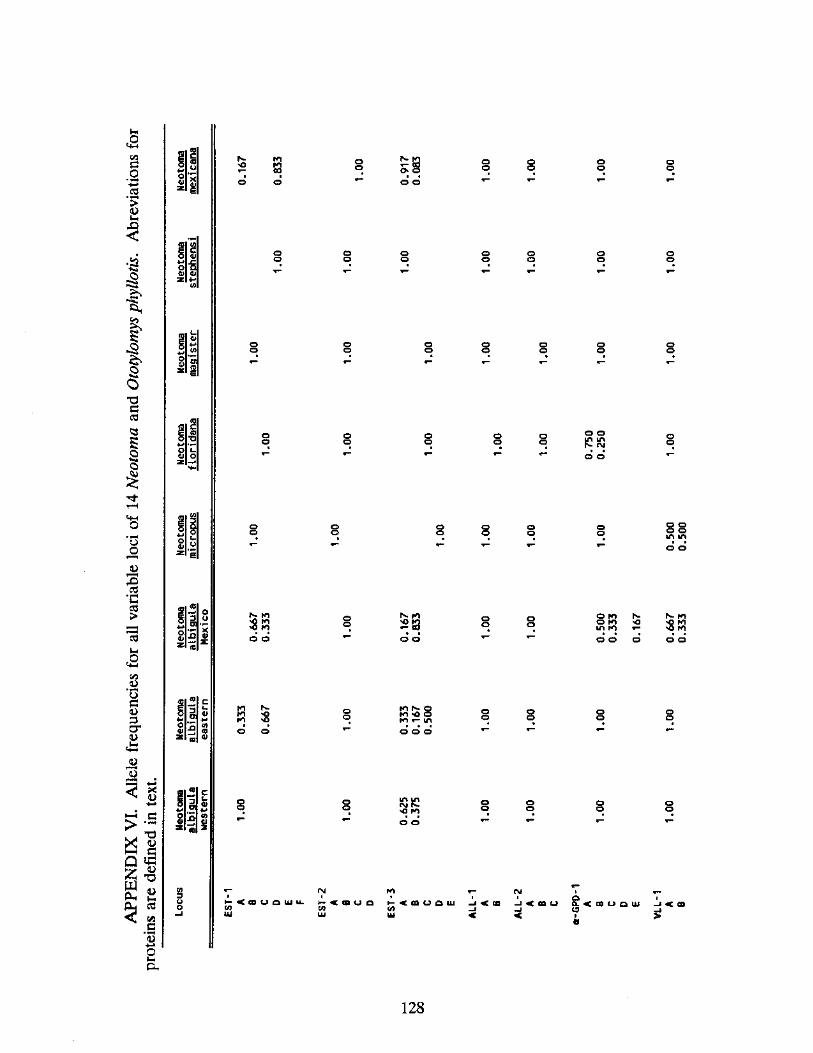
u a a
. o
c d
' E
i ! a 0
a 0 3
1 § O
0
< L >
1 >
13 Ut
c 2
C / 5
O a < D 3 c r < D
<4-4 jh 13
> X » — i Q £ U O h
8 • o
c u c
S 3
" O C D M a j
. s
o 1-4 c x
s i
0 ) < 0 S
CO > T 3
2 S
o o
h - 1 * — i O i © *
© o
o o
o o
o o
o o
o o §
h r K J v D >0 K»
K K » S 3
< S < 0 C E " D
O I i . f O o " D
O I a K l
• M *•* K l o a > j Q « < 0 O
3 E I D 4 1
i v 3
M N O m o o i * i * - i n
o o
< M s . o m §
o o
o o
o o
o o
o o
o o
o o " ~ l I A
. c u K! o o
o o o o m i n
O K » N - N . K l o to i n r o
> 0 T — "Q f O o o o
. © ©
o o
o o
* - < M H < C S U O U J l JU I — c / > C O
t ~ < c o o i w U i
_ » < c a - i <
CM
- I < O Q U <
a < m u Q U I - L i < m ( 9 — I « »
128
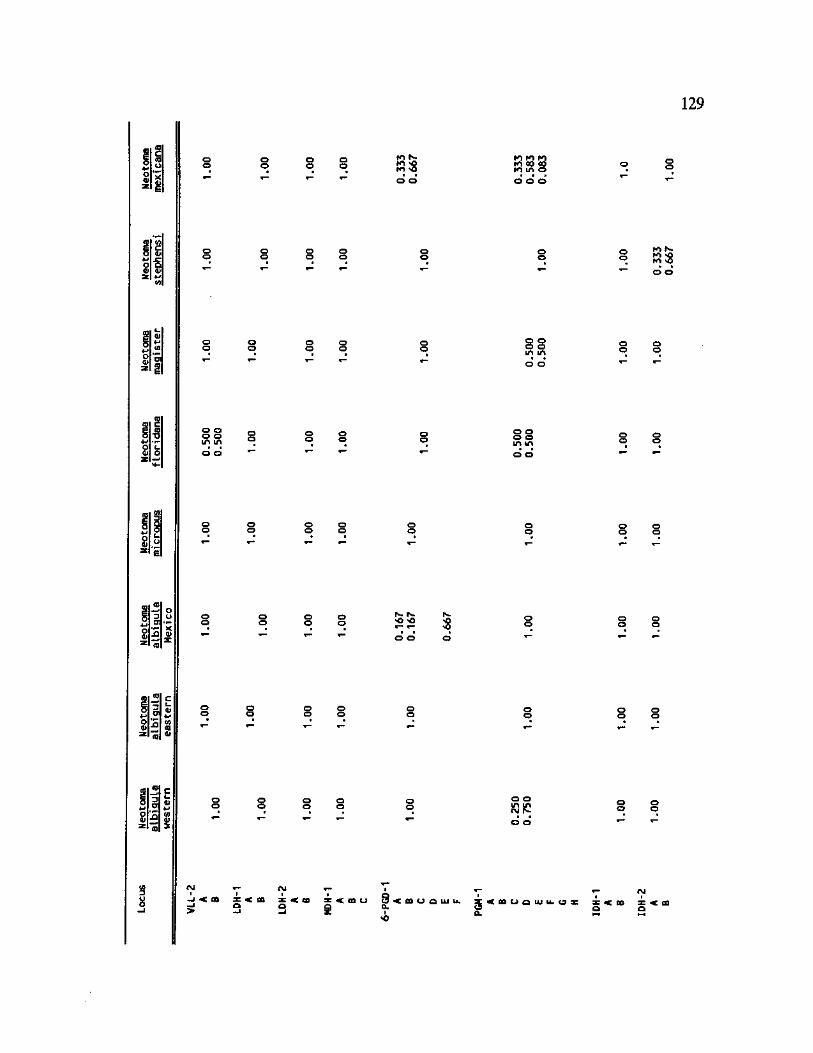
129
m r
1 •M
<D O
8. :
2 " * 8 <y
o © o o in in
o o
o o
o o
o o
o o o
o
s
o o
K* N-K> >Q
o o
o o
o o o © in in
§§ in in
o o
N- is-vO >0 5 O
o
o o o o
o o o
o o o in tn <M K
© o
o o
o o
o o
ro N-
O o
o o
o o
X < CD o
< COUQUJUL J < o b u q i Q.
: < GO
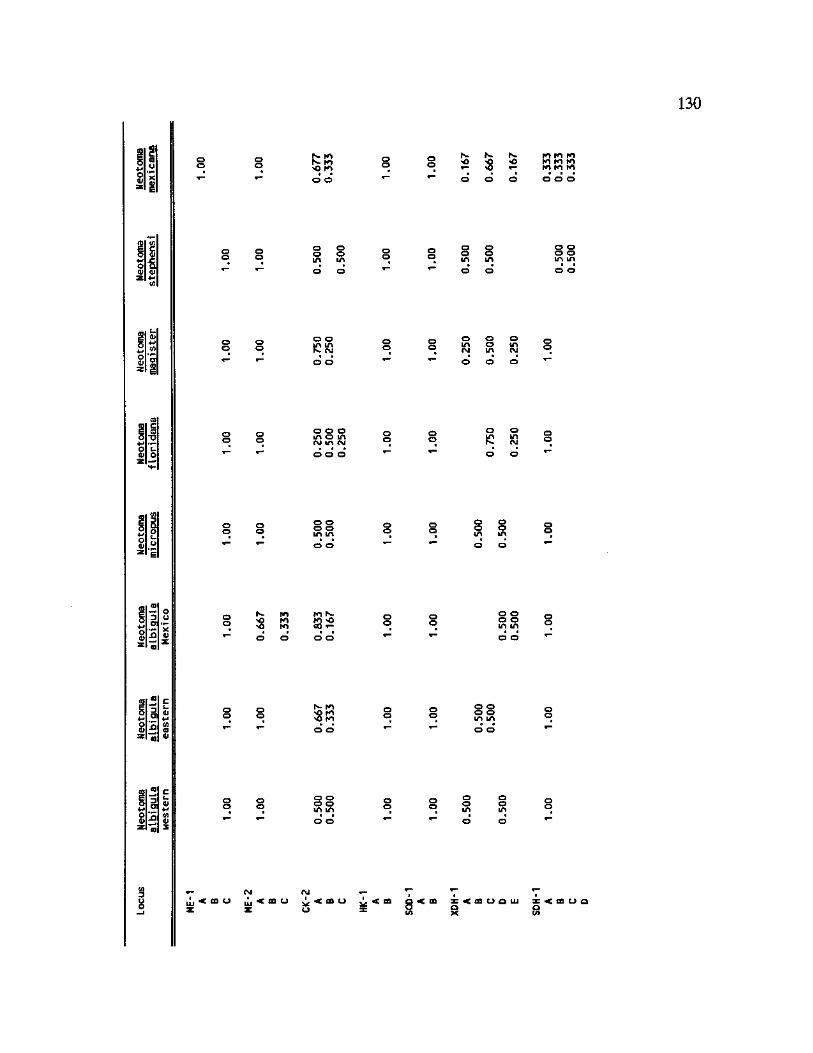
130
. L. s 4> s 4-» -M « o <u "5 z i
(0 n c c (0 o "O 4-» o «# o 3E
H-
3 CT .
5 m
» 5 : «
o o
o o
o o
o o
© o
o ©
N.
5 ro m
o o
N ro K? M vo ro
o o
o © N- N.
2 8
o o d d
o o o © in in
o o
o o
o o o o in in
o o d d
o o
tCKJ © o o
o o o in o <m in
o o o ©
o o o in o in cm in <M
o o
o o
o
te
d o © «— o
o o o o in in
o o
o o s
in
o o o
tn a s o
o o o
o o *— «—
N- K*
38 o o
o o
o o o o m in
O O *— r* d d
o o o o in in
o o
o o
o o m
o o «— « - o
K >o
o in CM
o in <M
o o o o in in
ki n ro fo ro ro Kl K> K»
o o o o in tn
o o
o o
o o
< CD < 00 Z < f f l U Q I
8
< C Q U Q
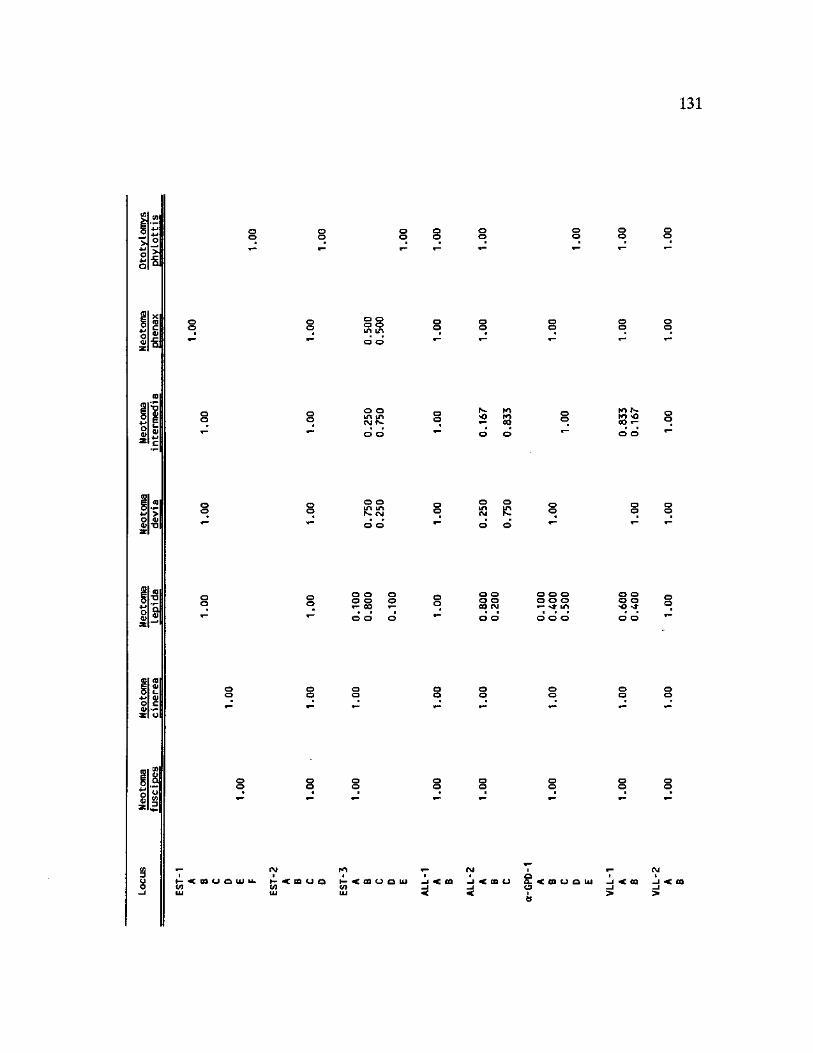
131
1 <0 +-» > o o a> "D ae
O O
o o
o o o o
o o o o in in
o o in in CM N.
o o in in N- <M
o o o o o o CO «-
o o o o
o o
o o
$5 Kl S
O O 8 2
O in f\j o 1C
o o o o 00 <M
o o o sf in o o o o >0 -sf
o o
H- < OQ O o h < CD O (A CO
(M m j < n u -J <
g . a is
-I < 00 -J < CO > >
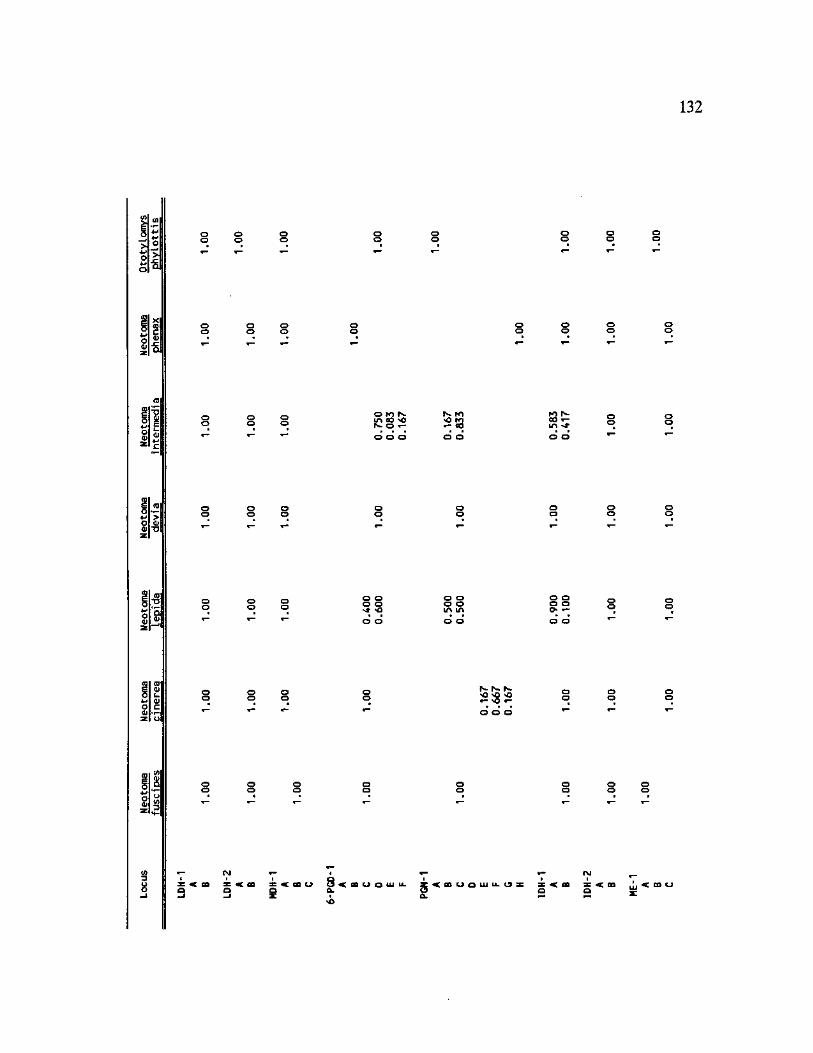
132
O >
O o
o o
X <0 c
o o
o © o o
o o
<11
c
O W N
tC § 5
N- fO
2 8 S t in >•*
o o
> 4) "D
O O
O O
C0| "O
a <U
o o o o Nt NO
o o o o IA Wk
o o o o o *-
!'5
o
3
O O
o o
o o
K is. is. nO o
o
§ 8 X < CD X < CD U Q Q
a < co u a i cl
vO
Z < c o u o u j u . O :
CL
: < co ill < co o
133
<0
1
£ CO 0)
Q c. +-* o c z o
3 O o
o o in in
o
o o
o o in o
o o o o
o o in o o in
o o o o
o o
o o
o o
rvj y < CD U
o o in s
in o
o o in o
o o
o o o o
o o o o
< 00 u O UJ z < c o u o 8
APPENDIX VII
CHARACTER STATE DATA, RESTRICTION SITE POSITIONS,
AND SPECIMEN LOCALITY CODES
134
APPENDIX VII
CHARACTER STATE DATA, RESTRICTION SITE POSITIONS,
AND SPECIMEN LOCALITY CODES
Character state matrix generated from restriction site analysis of 35 Neotoma OTUs and two outgroup taxa, Xenomys nelsoni and Ototylomys phyllotis. Specific restriction sites detailed in accompanying table.
CHARACTER
N. floridana 1 N. floridana 2 N. magister N. micropus 1 N. micropus 2 N. micropus 3 N. micropus 4 N. micropus 5 N. albigula El N. albigula E2 N. albigula E3 N. albigula E4 N. albigula W1 N. albigula W2 N. albigula W3 N. albigula Ml N. albigula M2 N. lepida 1 N. lepida 2 N. lepida 3 N. devia 1 N. devia 2 N. intermedia 1 N. intermedia 2 N. intermedia 3 N. intermedia 4 N. intermedia 5 N. mexicana 2 N. mexicana 3
10000010000001110010000100000010001010010011000100 10000010000001110010000100000010001010010011000100 10000010000001110010000100000010001010010011000100 10100010000001110010000100100010001000000010000000 10100010000001110010000100100010001000000010000000 10100010000001110010000100100010001010000010000000 10100010000001110010000100100010001000000010000000 10100010000001110010000100100010001000000010000000 10011010000001110010000100100000001010000010010000 10011010000001110010000100100000001010000010010000 10011010000001110010000100100000001000000010010000 10011010000001110010000100100000001000000010010000 10001010000001110010000100100000001000000011000000 10001010000001110010000100100000001000000011000000 10001010000001110010000100100000001000000011000000 10001010000001110000000101000000000000000011000000 10001011000001000011000100000000001000000010000000 10000011110100000000110001010000000100000011100000 10000011110100000000110001010000100100000011100000 10000011110100000000110001010000000100000011100000 10000011110100000000110001010000000000000001100000 10000011110100000000110001010000000100000001100000 10000011011100000000010001000000000001000001100000 10000011010100000000011001000000000001000000100000 10000011011100000000010001000000000001000001100000 10000011011100000000010001000000000001000001100000 10000011011100000000010001000000000001000001100000 10000011000011000110000000000000010000000010000100 10000011000001100110000000010000000000000010001100
135
136
N. stephensi N. phenax N. fuscipes 1 N. fuscipes 2 N. cinerea Xenomys Ototylomys N.floridana 1 N. floridana 2 N. magister N. micropus 1 N. micropus 2 N. micropus 3 N. micropus 4 N. micropus 5 N. albigula El N. albigula E2 N. albigula E3 N. albigula E4 N. albigula W1 N. albigula W2 N. albigula W3 N. albigula Ml N. albigula M2 N. lepida 1 N. lepida 2 N. lepida 3 N. devia 1 N. devia 2 N. intermedia 1 N. intermedia 2 N. intermedia 3 N. intermedia 4 N. intermedia 5 N. mexicana 1 N. mexicana 2 N. mexicana 3 N. stephensi N. phenax N. fuscipes 1 N. fuscipes 2 N. cinerea Xenomys Ototylomys
10000101000011000010000000000001000000000010001000 11000011000001000010000100011000000000100100000010 10000011000001000000000001000100011000100000000000 10000011000001000000000001000100011000100000000000 11000011000001000000001100000100000000101000000001 00000011100001000000001101000001000000100000000001 10000011000000001000100111000101000000100000000001 01100010000010000001000010000011000000100011000001 01100010000010000001000010000011000000100010000001 01000110000010000001000010001011000000100010100001 00100110010000000001000010001011001000100110000000 00100110010000000001000010001011001000100110000000 00100110010000000001000010001011001000100110000000 00100110010000000001000010001011001000100110000000 00100110010000000001000010001011001000100110000000 00100011010010000001000010101011000000100110000000 00100011010010000001000010101011000000100110000000 00100011010010000001000010101010000000100110000000 00100011010010000001000010101010000000100110000000 00100011010010000001000010101011000000100110000000 00100011010010000001000010001011000000100110000000 00100011010010000001000010001011000000100110000000 00100011001010000001000010001001000000100100000000 00100011000010000001000010101001000000100110000000 10010100001000000000100100001001000010100000000010 10010100001000000000100000001001000010100000000010 10010100001000000000100100001001000010100000000010 10000100001000000000100100011001000010100000000010 10010100001000000000100100011001000010100000000010 00010100101000000000100000010001000000100000000010 00010100101000000000100000010001000000100000000010 00010100101000000000100000010001000000100000000010 00010100101000000000010000010001000000100000000010 00010100101000000000100000010001000001000000000010 00000000000010000101001010001001100101100100000000 00000000000010000101001010001001100101100100000000 00000000000010000101000010001011100101100100000000 00001000000010000001000010001011000100100100000001 00100000101010100001000000001100000000100110000101 00000001000000011011010000001001110000000000010000 00000001010000011011010000001001110000000000011000 00000001000000011000000000001001010000000011000001 00000001000100000000000000001001000000001011000000 00000001000100000000000001000001000000010010000000
137
N. floridana 1 N. floridana 2 N. magister N. micropus 1 N. micropus 2 N. micropus 3 N. micropus 4 N. micropus 5 N. albigula El N. albigula E2 N. albigula E3 N. albigula E4 N. albigula W1 N. albigula W2 N. albigula W3 N. albigula Ml N. albigula M2 N. lepida 1 N. lepida 2 N. lepida 3 N. devia 1 N. devia 2 N. intermedia 1 N. intermedia 2 N. intermedia 3 N. intermedia 4 N. intermedia 5 N. mexicana 1 N. mexicana 2 N. mexicana 3 N. stephensi N. phenax N. fuscipes 1 N. fuscipes 2 N. cinerea Xenomys Ototylomys N. floridana 1 N. floridana 2 N. magister N. micropus 1 N. micropus 2 N. micropus 3 N. micropus 4
00000000001100000000000100100000010001000000001000 00000000001000000000000100100000010001000000001000 00000000001100000000000000100000010001000000001000 00000000001100000010100000100000010000100000000000 00000000001100000010100000100000010000100000000000 00000000001100000010100000100000010000100000001000 00000000001100000010100000100000010000100000000000 00000000001100000010100000100000010000100000000000 00000000001000000001100000000000010001000000000000 00000000001000000001100000000000010001000000000000 00000000001000000001100000000000010001000000000000 00000000001000000001100000000000010001000000000000 00000000001100000000100000100000010001010000000000 00000000001100000000100000100000010001010000000000 00000000001100000000100000100000010001010000000001 00000000001000000000100000100000010001000000000000 00000100001100000000100000000000010001000000000001 00100000100001000000000100010000010000000011010000 00100000101001000000000100010000010100010011010000 00100000100001000000000100010000010000000011010000 00100000000011000000000000010000000100010001010000 00100000000011000000000000010000010000000001010000 01000000001001001000000000010000000000000001000010 01000000001001001000000000000000000000000001000110 01000000001001001000000000010000000000000001000110 01000000001001001000000000010000000000000001000110 01000000001001001000000000010000010000000000000110 00100000001000010101000010000000011000000100001000 00100000001000010101000010000010011000000100001000 00010000001000010101000010000010011000000100001000 01100000001000010101000010001000010000000000001000 00000000010000000000000000000001010000001101000000 00001000001001000100011001000000111000000000000000 00001000001001000100011001000000111000000000000000 00000000001001010000001001000000011000000000000000 00000010001011100000000000000000110011000100100000 10000001001011000000000000000100100000000000100000 000000001000000001010000000000010010001000 000000001000000001010000000000010010001000 000100001100000001010000100000000010001000 100000011010000000010000010000001000101001 100000011010000000010000010000000000101001 100000011010000000010000000000001000101001 100000011010000000010000010000000000101001
138
N. micropus 5 N. albigula El N. albigula E2 N. albigula E3 N. albigula E4 N. albigula W1 N. albigula W2 N. albigula W3 N. albigula Ml N. albigula M2 N. lepida 1 N. lepida 2 N. lepida 3 N. devia 1 N. devia 2 N. intermedia 1 N. intermedia 2 N. intermedia 3 N. intermedia 4 N. intermedia 5 N. mexicana 1 N. mexicana 2 N. mexicana 3 N. stephensi N. phenax N. fuscipes 1 N. fuscipes 2 N. cinerea Xenomys Ototylomys
100000011010000000010000010000000000101001 110010011000000000000000010000001100100001 110010011000000000000000010000001100100001 110010011000000000000010000000001101100001 110010011000000000000010000000001101100001 100100111001000000010010010000001100100001 100100111001000000010010010000001100100001 100100111001000000010010010000001100100001 001000110001000000000010010000000101100000 100000110001000001000010010000001101100000 001100000000100001011000001010000100000100 001100000000100001011000001010000100000100 001100000000100001011000001010000100000100 001000000000100001011000001010000100000100 011010000000100001011000001010000100000100 001000000000100001011000001010000000000100 001000000000100001010000001010000000000100 001000000000100001011000001010000000000100 001000000000100001011000001010000000001100 000000000000100001011000001000000000000000 000000000000010000000010000000000100000010 000000000000010001000010000000000100000010 000000000000010001000010000000001100000010 000000000000010001000000000100000000000010 000000000000001001100110010001000100010100 100001111000000101000000001010000000100000 100001111000000101000000001010000000100000 100000100000000001000000001000000000000000 100100100000010001001011001000000100010100 100100100000000011000010000000100100000100
139
Character description of restriction site location mapped for a conserved Bgl I site which is character 1.
RACTER ENZYME MAP POSITION fkM 1 Bgl I 0.0 2 4va I 0.05 3 Dra I 0.20 4 Bam HI 0.30 5 Stu I 0.40 6 Eco RI 0.40 7 Bsp 106 0.60 8 Bst NI 0.70 9 Bam HI 0.80 10 Stu I 0.95 11 Ava I 0.95 12 Dra I 1.05 13 BstE II 1.00 14 Hinc II 1.00 15 Bst NI 1.20 16 Eco RV 1.50 17 Dra I 1.30 18 4va I 1.40 19 Apa I 1.60 20 Eco RI 1.50 21 Apa I 1.10 22 i/mc II 1.70 23 Dra I 1.90 24 Ava I 2.00 25 Pst I 1.90 26 Pvu II 2.20 27 Eco RV 2.50 28 Stu I 2.50 29 Dra I 2.50 30 BstE II 2.40 31 Bam HI 2.50 32 Dra I 2.80 33 Hinc II 2.95 34 Stu I 3.05 35 Bam HI 3.10 36 Eco RI 3.05 37 Ava I 3.40 38 Bgl I 3.40 39 Eco RI 3.30 40 Ava I 3.40
140
CHARACTER ENZYME MAP POSITION (kb) 41 Bst NI 3.70 42 Pst I 3.60 43 Stu I 3.80 44 Ava I 3.90 45 Bst NI 3.90 46 Bgl I 4.00 47 Bam HI 4.00 48 Eco RV 4.20 49 Eco RI 4.20 50 Apa I 4.25 51 Pvu II 4.30 52 Bst NI 4.40 53 Pvu II 4.50 54 Hinc II 4.40 55 Bst NI 4.70 56 Bam HI 4.70 57 Hinc II 4.80 58 Eco RV 4.90 59 Stu I 4.90 60 BstE II 5.10 61 Eco RV 5.30 62 Ava I 5.40 63 Eco RI 5.50 64 Kpn I 5.50 65 BstE II 5.80 66 Bst NI 5.70 67 Apa I 5.90 68 Stu I 5.90 69 Hinc II 6.00 70 Dra I 6.00 71 Bgl II 6.00 72 Eco RI 6.15 73 Pvu II 6.20 74 Stu I 6.30 75 Ava I 6.30 76 Dra I 6.50 77 Eco RI 6.40 78 Eco RI 6.60 79 Bam HI 6.80 80 Bst NI 7.00 81 Hinc II 7.30 82 Bst NI 7.30 83 Eco RV 7.40
141
CHARACTER ENZYME MAP POSH 84 Stu I 7.50 85 Eco RI 7.50 86 Hinc II 7.70 87 Eco RV 7.80 88 Stu I 7.90 89 Bgl II 8.00 90 Dra I 8.00 91 Apa I 8.10 92 Bam HI 8.20 93 Pst I 8.30 94 Eco RI 8.70 95 Eco RV 8.90 96 Hinc II 8.70 97 Eco RV 8.80 98 Bgl II 8.90 99 Hinc II 9.00 100 Bam HI 9.20 101 Apa I 8.85 102 Pvu II 9.60 103 BstE II 9.50 104 Stu I 9.40 105 Stu I 9.70 106 Eco RI 9.60 107 Kpn I 9.70 108 Bst NI 9.10 109 Bst NI 9.90 110 Bam HI 9.90 111 Eco RI 10.00 112 Eco RI 10.40 113 Ava I 10.00 114 Apa I 10.20 115 Hinc II 10.20 116 Bst NI 10.20 117 Stu I 10.40 118 Pvu II 10.60 119 Pst I 10.70 120 Hinc II 10.70 121 Dra I 10.80 122 Bst NI 10.90 123 Bam HI 11.00 124 Eco RV 11.20 125 Dra I 11.10 126 Hinc II 11.90
142
CHARACTER ENZYME MAP POSIT 127 Pvu II 11.20 128 Eco RI 11.40 129 Apa I 11.30 130 Ava I 11.50 131 BstE II 11.50 132 Stu I 10.80 133 Eco RV 11.60 134 Stu I 11.60 135 Hinc II 11.90 136 Eco RV 12.00 137 Bam HI 11.90 138 Pvu II 12.00 139 Apa I 12.00 140 Eco RV 12.10 141 Bsp 106 12.00 142 Eco RI 12.30 143 Bgl II 12.10 144 Dra I 12.40 145 Ava I 12.50 146 Hinc II 12.50 147 Bst NI 12.60 148 BstE II 12.70 149 Bsp 106 12.80 150 Bgl I 12.90 151 Dra I 13.00 152 Bam HI 13.00 153 Eco RV 13.00 154 Bst NI 13.30 155 Bam HI 13.05 156 Bam HI 13.60 157 Dra I 13.50 158 Stu I 13.60 159 Apa I 13.90 160 Eco RI 13.90 161 Eco RV 13.90 162 BstE II 14.00 163 Stu I 14.00 164 Bst NI 14.10 165 Ava I 14.10 166 Apa I 14.10 167 Bsp 106 14.10 168 BstE II 14.40 169 Pvu II 14.50
143
CHARACTER ENZYME MAP POSITION (kb)
170 Eco RI 14.60 171 Pvu II 14.80 172 Hinc II 14.70 173 Dra I 15.00 174 Pvu II 15.10 175 Apa I 15.18 176 Bst NI 15.20 177 Hinc II 15.30 178 Dra I 15.40 179 Bam HI 15.50 180 Bgl II 15.60 181 Bsp 106 15.50 182 Dra I 15.60 183 Bst NI 15.80 184 Dra I 15.90 185 Stu I 16.00 186 Bgl II 16.10 187 Hinc II 16.20 188 Eco RI 16.10 189 Bgl II 16.30 190 Bst NI 16.30 191 Dra I 16.40 192 Pst I 16.40
144
SPECIMEN LOCALITY CODES
N. floridana 1 N. floridana 2
N. micropus 1 N. micropus 2 N. micropus 3 N. micropus .4 N. micropus 5
N. albigula El N. albigula E2 N. albigula E3 N. albigula E4 N. albigula W1 N. albigula W2 N. albigula W3 N. albigula Ml N. albigula M2
N. lepida 1 N. lepida 2 N. lepida 3
N. devia 1 N. devia 2
all populations from Texas populations from Oklahoma and Kansas
Texas: Jack and Taylor cos. Texas: all remaining localities Mexico: Chihuahua Texas: Jeff Davis Co. New Mexico
Texas: Jeff Davis Co.; New Mexico: Sierra Co. New Mexico: Dona Ana Co. Colorado: Las Animas Co. Texas: Randall and Hardeman cos. Arizona: Coconino Co.; Utah: San Juan Co. Texas: El Paso Co. Arizona: Remaining localities; New Mexico Mexico: Chihuahua Mexico: Sonora
Utah: all localities California: San Bernardino Co.,Cima Volcanic Fields California: all remaining localities
Arizona: Coconino Co. Arizona: Mohave and Yuma cos.
N. intermedia 1 N. intermedia 2 N. intermedia 3 N. intermedia 4 N. intermedia 5
N. mexicana 1 N. mexicana 2 N. mexicana 3
N. fuscipes 1 N. fuscipes 2
Mexico: Baja California Sur, Santa Rosalia Mexico: Baja California Sur, Isla Santa Margarita California: Riverside Co. Sugarloaf Mtn. California: Los Angeles Co. Mexico: Baja California, Mexicali
Texas; Colorado; New Mexico Mexico: Durango Mexico: Jalisco
California: Orange and Ventura cos. California: San Bernardino Co.
LITERATURE CITED
Albert, V. A., B. D. Mishler, and M. W. Chase. In press. Character weighting for
restriction site data in phylogenetic reconstruction, with an example from
chloroplast DNA In Molecular sytematics in plants (P.Soltis, D. Soltis, and
J. Doyle, eds.). Chapman and Hall, New York.
Anderson, S. 1969. Taxonomic status of the woodrat, Neotoma albigula, in
southern Chihuahua, Mexico. Miscellaneous Publication of the University
of Kansas Museum of Natural History, 51:25-50.
Anderson, S. 1972. Mammals of Chihuahua Taxonomy and Distribution. Bulletin
of the American Museum of Natural History, 148(2): 151-410.
Archie, J. W. 1989. Homoplasy excess ratios: New indecies for measuring levels
of homoplasy in phylogenetic systematics and a critique of the consistency
index. Systematic Zoology, 38:253-269.
Armstrong, D. M. 1972. Distribution of mammals in Colorado. Monograph of
the Museum of Natural History,The University of Kansas, Number 3, 415
pp.
Avise, J. C. 1976. Genetic differentiation during speciation. Pp. 106-122, in
Molecular Evolution (F. J. Ayala, ed.). Sinauer Associates Inc.,
Sunderland, Massachusetts, 433 pp.
Avise, J. C. 1986. Mitochondrial DNA and the evolutionary genetics of higher
145
146
animals. Philosophical Transactions of the Royal Society of London,
312:325-342.
Avise, J. C. and R. A. Lansman. 1983. Polymorphism of mitochondrial DNA in
populations of higher animals. Pp. 147-164, in Evolution of Genes and
Proteins (M. Nei and R. K. Koehn, eds.). Sinauer Associates Inc.,
Sunderland, Massachusetts, 397 pp.
Avise, J. C. and N. C. Saunders. 1984. Hybridization and introgression among
species of sunfish (Lepomis): analysis by mitochondrial DNa and allozyme
markers. Genetics, 108:237-255.
Avise, J. C., and M. H. Smith. 1974. Biochemical genetics of sunfish. I.
Geographic variation and subspecific intergradation in the bluegill, Lepomis
macrochirus. Evolution, 28:42-56.
Avise, J. G, G Giblin-Davidson, J. Laerm, J. C. Patton, and R. A. Lansman.
1979. Mitochondrial DNA clones and matriarchal phylogeny within and
among geographic populations of the pocket gopher, Geomys pinetus.
Proceedings of the National Academy of Science, 76:6694-6698.
Avise, J. G, J. F. Shapira, S. W. Daniel, G F. Aquadro, and R. A. Lansman.
1983. Mitochondrial DNA differentiation during the speciation process in
Peromyscus. Molecular Biology and Evolution, 1:38-56.
Avise, J. G, J. Arnold, R. M. Ball, E. Bermingham, T. Lamb, J. E. Neigel, C. A.
Reeb, and N. C. Saunders. 1987. Intraspecific phylogeography: the
mitochondrial DNA bridge between population genetics and systematics.
Annual Review of Ecology and Systematics, 18:489-522.
147
Avise, J. C., R. M. Ball, and J. Arnold. 1988. Current versus historical
population sizes in vertebrate species with high gene flow: a comparison
based on mitochondrial DNA lineages and inbreeding theory for neutral
mutations. Molelcular Biology and Evolution, 5:331-344.
Ayala, F. J., M. L. Tracey, D. Hedgecock, and R. C. Richmond. 1975. Genetic
differentiation during the speciation process in Drosophila. Evolution,
28:576-592.
Ayala, F. J., M. L. Tracey, L. G. Barr, and J. G. Ehrenfeld. 1974. Genetic and
reproductive differentiation of the subspecies, Drosophila equinoxialis
caribbensis. Evolution, 28:24-42.
Bailey, W. J., D. H. A. Fitch, D. A. Tagle, J. Czelusniak, J. L. Slighton, and M.
Goodman. 1991. Molecular evolutuion of the Un-Globin gene locus:
Gibbon phylogeny and the hominoid slowdown. Molecular Biology and
Evolution, 8:155-184.
Baker, R. H. 1956. Mammals of Coahuila, Mexico. University of Kansas
Publications, Museum of Natural History, 9(7):125-335.
Baker, R. J. and J. T. Mascarello. 1969. Karyotypic analyses of the genus
Neotoma (Cricetidae, Rodentia). Cytogenetics and Cell Genetics, 8:187-
198.
Baker, R. J., J. T. Mascarello, and R. G. Jordan. 1970. Polymorphism in the
somatic chromosomes of Neotoma micropus Baird, the plains woodrat.
Experentia, 26:424-428.
148
Baldridge, W. S. and K. H. Olsen. 1989. The Rio Grande Rift. American
Scientist, 77:240-247.
Baverstock, P. R., M. Adams, L. R. Maxson, and T. H. Yosida. 1983. Genetic
differentiation among karyotypic forms of the black rat, Rattus. Genetics,
105:969-981.
Belcher, R. C. 1975. Geomorphic evolution of the Rio Grande. Baylor
University Press, Waco, Texas, 64 pp.
Birney, E. C. 1973. Systematics of three species of woodrats (Genus Neotoma) in
central North America. Miscellaneous Publication of the University of
Kansas Museum of Natural History, 58:1-173.
Birney, E. C. 1976. An assessment of relationships and effects of interbreeding
among woodrats of the Neotoma floridana species-group. Journal of
Mammalogy, 57:103-132.
Bloom, A. L. 1983. Sea level and coastal morphology of the United States
through the late Wisconsin glacial maximum. Pp. 215-229, in Late
Quaternary environments of the United States (S. C.Porter, ed.). Vol. 1.,
The late Pleistocene. University of Minnesota Press, Minneapolis, 427pp.
Bohlin, R. G., and E. G. Zimmerman. 1982. Genie differentiation of two
chromosome races of the Geomys bursarius complex. Journal of
Mammalogy, 63:218-228.
Brown, E. M. A. Prager, A. Wang, and A. C. Wilson. 1982. Mitochondrial DNA
sequences of primates: tempo and mode of evolution. Journal of
149
Molecular Evolution, 18:255-239.
Brown, W. M. 1983. Evolution of animal mitochondrial DNA. Pp. 62-88, in
Evolution of Genes and Proteins (M. Nei and R. K. Koehn, eds.). Sinauer
Associates, Inc., Sunderland, Massachusetts, 397pp.
Brown, W. M. 1985. The mitochondrial genome of animals. Pp. 95-130, in
Molecular Evolutionary Genetics (R. J. Maclntyre, ed.). Plenum Press,
New York, 366 PP.
Burt, W. H. and F. S. Barkalow, Jr. 1942. A comparative study of the baculum
of wood rats (Subfamily Neotominae). Journal of Mammalogy, 23:287-297.
Buth, D. G. 1984. The application of electrophoretic data in systematic studies.
Annual Reveiw of Ecology and Systematics, 15:501-522.
Carleton, M. D. 1980. Phylogenetic relationships in Neotomine-Peromyscine
rodents (Muroidea) and a reappraisal of the dichotomy within New World
Cricitinae. Miscellaneous Publication of the Museum of Zoology,
University of Michigan, 157:1-146.
Carr, S. M., S. W. Ballinger, J. N. Derr, L. H. Blankenship, and J. W. Bickham.
1986. Mitochondrial DNA analysis of hybridization between sympatric
white-tailed deer and mule deer in west Texas. Proceedings of the
National Academy of Science, 83:9576-9580.
Cole, K. L. 1986. The lower Colorado River Valley: a Pleistocene Desert.
Quaternary Research, 25:392-400.
150
Committee on Acceptable Field Methods in Mammalogy. 1987. Acceptable field
methods in mammalogy: Preliminary guidelines approved by the American
Society of Mammalogists. Journal of Mammalogy, 68: (supplement) 1-18.
Cothran, E. G., E. G. Zimmerman, and C. F. Nadler. 1977. Genie
differentiation and evolution in the ground squirrel subgenus Ictidomys
(Genus Spermophilus). Journal of Mammalogy, 58:610-622.
Dalbey, F. C. 1980. Parapatric distribution of Neotoma floridana and Neotoma
micropus in Southcentral Texas: an ecological and morphological study.
Unpublished M.S. thesis, Southwest Texas State University, San Marcos, 80 pp.
Dalquest, W. W. 1953. Mammals of the Mexican state of San Luis Potosi.
Louisiana State University Studies, Biological Science Series 1:1-112.
DeBry, R. W., and N. A. Slade. 1985. Cladistic analysis of restriction
endonuclease cleavage maps within a maximum-likelihood framework.-
Systematic Zoology, 34:21-34.
De Walt, T. S. 1991. Mitochondrial DNA restriction site analysis of the
phytogeny of the truei and boylii species groups of the rodent genus
Peromyscus (Cricetidae). Unpublished M. S. thesis, University of North
Texas, Denton, 91 pp.
DeWalt, T. S., E. G. Zimmerman, and J. V. Planz. In Press. Mitochondrial DNA
phytogeny of the species of the truei and boylii groups of the genus
Peromyscus. Journal of Mammalogy.
151
Dial, K. P. and N. J. Czapplewski. 1990. Do woodrat middens accurately
represent the animals' environments and diets. The Woodhouse Mesa
study. Chapter 4 Pp.43-58 in Packrat Middens : the last 40,000 years of
biotic change (J. L. Betancourt, T. R. Van Devender, and P. S. Martin,
eds.). University of Arizona Press, Tucson, 887 pp.
Ederhoff, L. T. 1971. The mammals of El Paso County, Texas, with notes on
vegetation. Unpublished M. S. thesis, University of Texas, El Paso, 130 pp.
Farris, J. S. 1989. The retention index and homoplasy excess. Systematic
Zoology, 38:406-407.
Feldman, H. W. 1935. Notes on two species of woodrats in captivity. Journal of
Mammalogy, 16:300-303.
Felsenstein, J. 1984. Distance methods for inferring phytogenies: a justification.
Evolution, 38:16-24.
• 1985. Confidence limits on phylogenies: an approach using the bootstrap.
Evolution, 39:783-791.
• 1986. PHYLIP (Phylogenetic Inference Package) (version 2.9).
University of Washington, Seattle.
Ferris, S. D., R. D. Sage, E. M. Prager, U. Ritte, and A. C. Wilson. 1983.
Mitochondrial DNA evolution in mice. Genetics, 105:681-721.
Findley, J. S., A. H. Harris, D. E. Wilson, and C. Jones. 1975. Mammals of New
Mexico. University of New Mexico Press, Albuquerque, 276 pp.
Finley, R. B., Jr. 1958. The woodrats of Colorado: distribution and ecology.
152
University of Kansas Publications, Museum of Natural History, 10:213-552.
. 1990. Woodrat ecology and behavior and the interpretation of
paleomiddens. Chapter 3 Pp. 28-42 in Packrat Middens : the last 40,000
years of biotic change (J. L. Betancourt, T. R. Van Devender, and P. S.
Martin, eds.). University of Arizona Press, Tucson, 887 pp.
Fitch, H. S. and D. G. Rainey. 1956. Ecological observations on the woodrat,
Neotoma floridana. University of Kansas Publication, Museum of Natural
History, 8(9):499-533.
Flint, R. F. 1971. Glacial and Quaternary geology. John Wiley and Sons, New
York, 288 pp.
Goldman, E. A. 1910. Revision of the wood rats of the genus Neotoma. North
American Fauna, 31:1-124.
Hall, E. R. 1981. The mammals of North America. Second ed. John Wiley and
Sons. New York. 1:1-600 + 90, 2:601-1181 + 90.
Hall, E. R., and H. H. Genoways. 1970. Taxonomy of the Neotoma albigula-
group of woodrats in central Mexico. Journal of Mammalogy, 51:504-516.
Harris, A. H. 1984. Neotoma in the Late Pleistocene of New Mexico and
Chihuahua. Special Publication of the Carnegie Museum of Natural
History, 8:164-178.
Hayes, J. P. 1990. Biogeographic, systematic, and conservation implications of
geographic variation in woodrats of the eastern United States.
Unpublished Ph. D. dissertation, Cornell University, Ithaca, New York, 151
153
pp.
Hays, J. D., J. Imbrie, and N. J. Shackleton. 1976. Variations in the earth's orbit:
Pacemaker of the Ice Ages. Science 194:1121-1132.
Hempel, C. G. 1966. Philosophy of natural science. Prentice-Hall, Inc.,
Englewood Cliffs, New Jersey, 244 pp.
Hoffmeister, D. F. 1986. Mammals of Arizona. University of Arizona Press,
Tucson, 602 pp.
Hoffmeister, D. F., and L. de la Torre. 1959. The baculum of the woodrat
Neotoma stephensi. Proceedings of the Biological Society of Washington,
72:171-172.
. 1960. A revision of the woodrat Neotoma stephensi. Journal of
Mammalogy, 41:476-491.
Hooper, E. T. 1960. The glans penis in Neotoma (Rodentia) and allied genera.
Occasional Papers of the Museum of Zoology, University of Michigan,
618:1-20.
Huheey, C. C. 1972. Sympatric hybridization of Neotoma albigula and Neotoma
micropus in southeastern Colorado: a study of karyology, blood proteins,
morphology, and ecology. Unpublished Ph.D. dissertation, University of
Illinois, Urbana, 66 pp.
Jansen, R. K., K. E. Holsinger, H. J. Micheals, and J. D. Palmer. 1990.
Phylogenetic analysis of cholorplast DNA restriction site data at higher
taxonomic levels: An example from the Asteraceae. Evolution, 44:2089-
154
2105.
Kennedy, T. E., Jr. 1963. Gene flow pattern and swimming ability of the pocket
gopher. Southwestern Naturalist, 8:85-88.
Key, K. H. L. 1968. The concept of stasipatric speciation. Systematic Zoology,
17:14-22.
Kluge, A. G., and J. S. Farris. 1969. Quantitative phyletics and the evolution of
anurans. Systematic Zoology, 18:1-32.
Koop, B. F., R. J. Baker, and J. T. Mascarello. 1985. Cladistical analysis of
chromosomal evolution within the genus Neotoma. Occasional Papers, The
Museum, Texas Tech University, 96:1-9.
Kurten, B. and E. Anderson. 1980. Pleistocene mammals of North America.
Columbia Univ. Press, New York, 442 pp.
Lansman, R. A., R. O. Shade, J. F. Shapira, and J. C. Avise. 1981. The use of
restriction endonucleases to measure mitochondrial DNA sequence
relatedness in natural populations. III. Techniques and potential
applications. Journal of Molecular Evolution, 17:214-226.
Latorre, A., E. Barrio, A. Moya, and F. J. Ayala. 1988. Mitochondrial DNA
evolution in the Drosophila obscura group. Molecular Biology and
Evolution, 5:717-728.
Lee, M. R. and F. F. B. Elder. 1977. Karyotypes of eight species of Mexican
rodents (Muridae). Journal of Mammalogy, 58:479-487.
• 1980. Yeast stimulation of bone marrow mitosis for cytogenetic
155
investigations. Cytogenetics and Cell Genetics, 26:36-40.
Linsdale, J. M., and L. P. Tevis. 1951. The Dusky-Footed Wood Rat. A record of
observations made on the Hastings Natural History Reservation. University
of California Press, Berkeley. 664 pp.
MacNeil, D. and C. Strobeck. 1987. Evolutionary relationships among colonies
of Columbian ground squirrels as shown by mitochondrial DNA. Evolution,
41: 873-881.
Maniatis, T., E. F. Fritsch, and J. Sambrook. 1982. Molecular Cloning. A
Laboratory Manual. Cold Springs Harbor Lab., Cold Spring Harbor, New
York, 545 pp.
Mantel, N. 1967. The detection of disease clustering and a generalized regression
approach. Cancer Research, 27:209-220.
Mascarello, J. T. 1978. Chromosomal, biochemical, mensural, penile, and cranial
variation in desert woodrats (Neotoma lepida). Journal of Mammalogy,
59:477-495.
Mascarello, J. T. and T. C. Hsu. 1976. Chromosome evolution in woodrats,
genus Neotoma (Rodentia: Cricetidae). Evolution, 30:152-169.
Mayr, E. 1942. Systematics and the origin of species. Columbia University Press,
New York, 436 pp.
. 1963. Animal species and evolution. Harvard University Press,
Cambridge, Massachusetts, 797 pp.
• 1969. Principles of systematic zoology. McGraw-Hill, New York, 309 pp.
156
Mead, J. I., Van Devender, T. R., and K. L. Cole. 1983. Late Quaternary small
mammals from Sonoran Desert packrat middens, Arizona and California.
Journal of Mammalogy, 64:173-180.
Merriam, C. H. 1903. Four new mammals, including a new genus (Teonopus),
from Mexico. Proceedings of the Biological Society of Washington, 16:79-
82.
Meyer, E. R. 1973. Late-Quaternary paleoecology of the Cuatro Cienegas basin,
Coahuila, Mexico. Ecology, 54:982-95.
Michner, C. D., and R. R. Sokal. 1957. A quantitative approach to the problem
of classification. Evolution, 11:130-162.
Mindell, D. P., and R. L. Honeycutt. 1990. Ribosomal RNA in vertebrates:
Evolution and phylogenetic applications. Annual Review of Ecology and
Systematics, 21:541-566.
Moritz, C., T. E. Dowling, and W. M. Brown. 1987. Evolution of animal
mitochondrial DNA: relevance for population biology and systematics.
Annual Review of Ecology and Systematics, 18:269-292.
Nei, M. and H. Li. 1979. Mathematical model for studying genetic variation in
terms of restriction endonucleases. Proceedings of the National Academy
of Science, 76:5269-5273.
Nei, M., and F. Tajima. 1983. Maximum likelihood estimation of the number of
nucleotide substitutions from restriction sites data. Genetics, 105:207-217.
Neigel, J. E. and J. C. Avise. 1986. Phylogenetic relationships of mitochondrial
157
DNA under various demographic models of speciation. Pp. 513-534, in
Evolutionary Processes and Theory (E. Nevo and S. Karlin, eds.).
Academic Press, New York, 789 pp .
Patton, J. L., and S. W. Sherwood. 1983. Chromosome evolution and speciation
in rodents. Annual Review of Ecology and Systematics, 14:139-158.
Pumo, D. E., E. Z. Goldin, B. Elliot, C. J. Phillips, and H. H. Genoways. 1988.
Mitochondrial DNA polymorphism in three Antillean Island populations of
the fruit bat, Artbeus jamaicensis. Molecular Biology and Evolution, 5:79-
89.
Rastl, E. and I. B. Dawid. 1979. Structure and evolution of animal mitochondrial
DNA. Pp. 395-407, in Extrachromosomal DNA (D. J. Cummings, P. Borst,
I. B. Dawid, S. M. Weissman, and C. F. Fox, eds.). Academic Press, New
York, 589 pp.
Riddle, B. R., and R. L. Honeycutt. 1990. Historical biogeography in North
American arid regions: an approach using mitochondrial-DNA phylogeny in
grasshopper mice (genus Onychomys). Evolution, 44:1-15.
Rogers D. S. and D. J. Schmidly. 1981. Geographic variation in the
white-throated woodrat (Neotoma albigula) from New Mexico, Texas, and
northern Mexico. Southwestern Naturalist, 26:167-181.
Rogers, J. S. 1972. Measures of genetic similarity and genetic distance. Studies
Genetics VII, University of Texas Publications, 7213:145-153.
Rohlf, F. J. 1988. NTSYS-pc. Numerical taxonomy and multivariate analysis
158
system. Version 1.40. Exeter Publishing, Ltd. Setauket, New York.
Russell, R. J. 1968. Revision of the pocket gophers of the genus Pappogeomys.
University of Kansas Publications, Museum of Natural History, 16(7):581-
776.
Ryckman, R. E., E. F. Archbold, and D. G. Bentley. 1981. The Neotoma group
in North and Central America: A checklist, literature review, and
comprehensive bibliography (Rodentia: Cricetidae: Cricetinae). Bulletin of
the Society of Vector Ecologists, 6:1-92.
Schmidly, D. J. 1977. The mammals of Trans-Pecos Texas, including Big Bend
National Park and Guadalupe National Park. Texas A&M University
Press, College Station, 225 pp.
Schwartz, A. and E. P. Odum. 1957. The woodrats of the eastern United States.
Journal of Mammalogy, 38:197-206.
Selander, R. K., M. H. Smith, S. Y. Yang, W. E. Johnson, and J. B. Gentry. 1971.
Biochemical polymorphism and systematics in the genus Peromyscus. I.
Variation in the old-field mouse (Peromyscus polionotus). University of
Texas Publications in Genetics, 6:49-90.
Shipley, M. M., F. B. Stangl, Jr., R. L. Cate, and C. S. Hood. 1989.
Immunoelectrophoretic relationships among four species of woodrats
(Cricetidae: Neotoma). Southwestern Naturalist, 35:173-176.
Simpson, G. G. 1961. Principles of animal taxonomy. Columbia University Press,
New York, 327 pp.
159
Smith, A. B. 1988. Phylogenetic relationships, divergence times, and rates of
molecular evolution for Camarodont Sea Urchins. Molecular Biology and
Evolution, 5:345-365.
Smith, J. K. and E. G. Zimmerman. 1976. Biochemical genetics and evolution of
North American blackbirds, family Icteridae. Comparative Biochemistry
and Physiology, 53B:319-324.
Smouse, P. E. and W. H. Li. 1987. Likelihood analysis of mitochondrial
restriction cleavage patterns for the human-chimpanzee-gorilla trichotomy.
Evolution, 41:1162-1176.
Sneath, P. H. A. and R. R. Sokal. 1973. Numerical Taxonomy. W. H. Freeman
and Co., San Francisco, 573 Pp.
Solignac, M., M. Monnerot, and J-C. Mounolou. 1986. Mitochondrial DNA
evolution in the melanogaster species subgroup of Drosophila. Journal of
Molecular Evolution, 23:31-40.
Southern, E. M. 1975. Detection of specific sequences among DNA fragments
separated by gel electrophoresis. Journal of Molecular Evolution, 98:503-
517.
Spaulding, W. G. 1983. Late Wisconsin macrofossil records of desert vegetation
in the American Soutwest. Quaternary Research, 19:256-264.
• 1990. Vegetational and climatic development of the Mojave Desert: The
last glacial maximum to the present. Chapter 9 Pp. 166-200, in Packrat
Middens : the last 40,000 years of biotic change (J. L. Betancourt, T. R.
160
Van Devender, and P. S. Martin, eds.). University of Arizona Press,
Tucson, 887 pp.
Spaulding, W. G., J. L. Betancourt, L. K. Croft, and K. L. Cole. 1990. Packrat
Middens: Their composition and methods of analysis. Chapter 5 Pp. 59-84,
in Packrat Middens : the last 40,000 yeas of biotic change (J. L.
Betancourt, T. R. Van Devender, and P. S. Martin, eds.). University of
Arizona Press, Tucson, 887 pp.
Spencer, D. L. 1968. Sympatry and hybridization of the eastern and southern
plains wood rats. Unpublished Ph.D. thesis, Oklahoma State University,
Stillwater, 84 pp.
Swofford, D. L. 1990. PAUP: Phylogenetic analysis using parsimony, version 3.0.
Computer program distributed by the Illinois Natural History Survey,
Champaign.
Swofford, D. L. and S. H. Berlocher. 1987. Inferring evolutionary trees from
gene frequency data under the principle of maximum parsimony.
Systematic Zoology, 36:293-325.
Swofford, D. L. and W. P. Maddison. 1987. Reconstructing ancestral character
states under Wagner parsimony. Mathematical Biosciences, 87:199-229.
Swofford, D. L., and R. B. Selander. 1981. BIOSYS-1: a FORTRAN program for
the comprehensive analysis of electrophoretic data in population genetics
and systematics. Journal of Heredity, 72:281-283.
Tamura, K. and T. Aotsuka. 1988. Rapid isolation of animal mitochondrial DNA
161
by the alkaline lysis procedure. Biochemical Genetics 26 (11/12):815-819.
Tanaka, T., and B. Weisblum. 1975. Construction of a colicin El-R factor
composite plasmid in vitro: means for amplification of deoxyribonucleic
acid. Journal of Bacteriology, 121:354-362.
Tegelstrom, H. 1987. Transfer of mitochondrial DNA from the Northern
Red-Backed Vole (Clethrionomys rutilus) to the Bank Vole (C. glareolus).
Journal of Molecular Evolution, 24:218-227.
Tegelstrom, H., P-I. Wyoni, H. Gelter, and M. Jaarola. 1988. Concordant
divergence in proteins and mitochondrial DNA between two vole species in
the Genus Clethrionomys. Biochemical Genetics, 26:223-237.
Templeton, A. R. 1981. Mechanisms of speciation - a population genetics
approach. Annual Review of Ecology and Systematics, 12:23-48.
. 1983. Phylogenetic inference from restriction endonuclease cleavage site
maps with particular reference to the evolution of humans and apes.
Evolution, 37:221-244.
Thompson, R. S. 1990. Late Quaterary vegetation and climate change in the
Great Basin. Chapter 10 Pp. 200-239, in Packrat Middens : the last 40,000
years of biotic change (J. L. Betancourt, T. R. Van Devender, and P. S.
Martin, eds.). University of Arizona Press, Tucson, 887 pp.
Thompson, R. S., and E. M. Hattori. 1983. Packrat (Neotoma) middens from
Gatecliff Shelter and Holocene migrations of woodland plants. Pp. 167-
171, in The archeology of Monitor Valley, 2. Gatecliff Shelter (D. H.
162
Thomas, ed.). Anthropological Papers of the American Museum of
Natural History, 59, #1.
Van Devender, T. R. 1973. Late Pleistocene plants and animals of the Sonoran
Desert: a survey of ancient packrat middens in southwestern Arizona.
Unpublished Ph. D. dissertation, University of Arizona, Tucson, 111 pp.
. 1987. Holocene vegetation and climate in the Puerto Blanco Mountains,
southwestern Arizona. Quaternary Research, 27:51-72.
. 1990a. Late Quaternary vegetation and climate of the Chihuahuan
Desert, United States and Mexico. Chapter 7 Pp. 104-133, in Packrat
Middens : the last 40,000 years of biotic change (J. L. Betancourt, T. R.
Van Devender, and P. S. Martin, eds.). University of Arizona Press,
Tucson, 887 pp.
• 1990b. Late Quaternary vegetation and climate of the Sonoran Desert,
United States and Mexico. Chapter 8 Pp. 134-165, in Packrat Middens :
the last 40,000 years of biotic change (J. L. Betancourt, T. R. Van
Devender, and P. S. Martin, eds.). University of Arizona Press, Tucson,
887 pp.
Van Devender, T. R., and T. L. Burgess. 1985. Late Pleistocene woodlands in
the Bolson de Mapimi: a refugium for the Chihuahuan Desert biota?
Quaternary Research, 24:346-353.
Van Devender, T. R., R. S. Thompson, and J. L. Betancourt. 1987. Vegetation
history in the Southwest: the nature and timing of the late Wisconsin-
163
Holocene transition. Pp. 323-352 in North America and adjacent oceans
during the last deglaciation (W. F. Ruddiman and H. E. Wright, Jr., eds.).
Geological Society of America, Boulder, 426 pp.
Vaughan, T. A. 1990. Ecology of living packrats. Chapter 2 Pp. 14-27 in Packrat
Middens : the last 40,000 years of biotic change (J. L. Betancourt, T. R.
Van Devender, and P. S. Martin, eds.). University of Arizona Press,
Tucson, 887 pp.
Vorhies, C. T. and W. P. Taylor. 1940. Life history and ecology of the white-
throated woodrat, Neotoma albigula albigula, Hartley, in relation to grazing
in Arizona. University of Arizona College of Agriculture, Agricultural
Experimental Station. Technical Bulletin No. 86:455-529.
Wells, P. V. 1976. Macrofossil analysis of woodrat {Neotoma) middens as a key
to the Quaternary vegetation of arid America. Quaternary Research,
6:223-248.
Wiley, E. O. 1981. Phylogenetics: The theory and practice of phylogenetic
systematics. John Wiley and Sons, New York, 439 pp.
. 1978. The evolutionary species concept reconsidered. Systematic
Zoology, 27:17-26.
Wilson, R. F. 1967. Conclusions and Symposium Hypothesis. Chapter 3 Pp. 46-
61 in Evolution of the Colorado River in Arizona. An hypothesis
developed at the Symposium on Cenozoic Geology of the Colorado Plateau
in Arizona, August 1964 (E. D. McKee, R. F. Wilson, W. J. Breed, and C.
164
S. Breed, eds.). Museum of Northern Arizona Bulletin No. 44, Flagstaff, 67
pp.
Zimmerman, E. G., D. R. Akins, J. V. Planz, and M. J. Schurr. 1988. A rapid
procedure for isolating mitochondrial DNA. Gene Analysis Techniques,
5:102-104.
Zimmerman, E. G., C. W. Kilpatrick, and B. J. Hart. 1978. The genetics of
speciation in the rodent genus Peromyscus. Evolution, 32:565-579.
Zimmerman, E.G., and M.E. Nejtek. 1977. Genetics and speciation of three
semispecies of Neotoma. Journal of Mammalogy, 58:391-402.