M ESTIMATING METHANE E FROM NATURAL GAS AND OIL SYSTEMS
37
METHODS FOR ESTIMATING METHANE EMISSIONS FROM NATURAL GAS AND OIL SYSTEMS October 1999 Prepared by: ICF Consulting Prepared for: Greenhouse Gas Committee Emission Inventory Improvement Program VOLUME VIII: CHAPTER 3
Transcript of M ESTIMATING METHANE E FROM NATURAL GAS AND OIL SYSTEMS

METHODS FOR ESTIMATINGMETHANE EMISSIONS FROMNATURAL GAS AND OIL SYSTEMS
October 1999
Prepared by:ICF Consulting
Prepared for:Greenhouse Gas CommitteeEmission Inventory Improvement Program
VOLUME VIII: CHAPTER 3

DISCLAIMER
This document was prepared for the Emission Inventory Improvement Program and the U.S.Environmental Protection Agency by ICF Incorporated, Washington, D.C. This report isintended to be a working draft document and has not been reviewed or approved for publication.The opinions, findings, and conclusions are those of the authors and not necessarily those of theEmission Inventory Improvement Program or the U.S. Environmental Protection Agency.Mention of company or product names is not to be considered an endorsement by the EmissionInventory Improvement Program or the U.S. Environmental Protection Agency.
Volume VIII, Chapter 3, Natural Gas and Oil Systems
EIIP Volume VIII iii
ACKNOWLEDGMENTS
The text for this document was originally written by staff of the ICF Consulting Group inWashington, DC, drawing on a variety of sources. It has since been updated by Leonard Crook,Randy Freed, Anne Choate, William Driscoll, and other staff of ICF, for the Greenhouse GasCommittee of the Emission Inventory Improvement Program and for Ethan McMahon and WileyBarbour of the Office of Policy of the U.S. Environmental Protection Agency. Bill Irving, ofU.S. EPA’s Office of Air and Radiation, also contributed to this report. Members of theGreenhouse Gas Committee contributing to the preparation of this document were:
Peter Ciborowski, Environmental Protection Specialist, Minnesota Pollution Control AgencyBrenda Griffin, Program Analyst, Illinois Department of Natural ResourcesGuido Franco, Program Analyst, California Energy CommissionWilliam Herz, Assistant Research Engineer, University of Alabama, Department of Chemical
EngineeringPatricia Kimes, Program Analyst, Utah Department of Environmental QualityDon LaTourette, Program Analyst, New Hampshire Department of Environmental ServicesJoe Loyer, Program Analyst, California Energy CommissionJohn Noller, Program Analyst, Missouri Department of Natural ResourcesSam Sadler, Energy Analyst, Oregon Department of EnergyJack Sipple, Program Analyst, Delaware Department of Natural Resources and Environmental
Control

iv EIIP Volume VIII
CONTENTSSection Page
1 Introduction .........................................................................................................................3.1-1
2 Source Category Description...............................................................................................3.2-12.1 Emission Sources .................................................................................................3.2-1
3 Overview of Available Methods for Estimating Emissions................................................3.3-1
4 Preferred Methods for Estimating Emissions......................................................................3.4-14.1 Preferred Method for Estimating Emissions from Natural Gas Systems .............3.4-1
4.2 Preferred Method for Estimating Emissions from Oil Systems ...........................3.4-5
5 Alternative Method for Estimating Emissions from Natural Gas Systems.........................3.5-1
6 Quality Assurance/Quality Control .....................................................................................3.6-16.1 Data Attribute Ranking System (DARS) Scores..................................................3.6-2
7 References ...........................................................................................................................3.7-1

EIIP Volume VIII v
TABLESPage
3.4-1 Methane Emission Factors for the Natural Gas Industry ............................................ 3.4-3
3.4-2 Conversion Factors to Million BTU (MMBTU)......................................................... 3.4-6
3.4-3 Emissions from Oil Systems ....................................................................................... 3.4-7
3.4-4 Methane Emission Factors for Oil Activities .............................................................. 3.4-9
3.5-1 Conversion Factors to Million BTU (MMBTU)......................................................... 3.5-1
3.5-2 Emissions from Natural Gas Systems ......................................................................... 3.5-3
3.5-3 Methane Emission Factors for Natural Gas Activities................................................ 3.5-4
3.6-1 DARS Scores: CH4 Emissions From Natural Gas Systems, Preferred Approach ..... 3.6-3
3.6-2 DARS Scores: CH4 Emissions From Oil Systems, Preferred Approach ................... 3.6-4
3.6-3 DARS Scores: CH4 Emissions From Natural Gas Systems, Alternative Approach .. 3.6-5


EIIP Volume VIII 3.1-1
1
INTRODUCTIONThe purposes of the preferred methods guidelines are to describe emissions estimation techniquesfor greenhouse gas sources in a clear and unambiguous manner and to provide concise examplecalculations to aid in the preparation of emission inventories. This chapter describes theprocedures and recommended approaches for estimating methane emissions from oil and gassystems.
Section 2 of this chapter contains a general description of the oil and gas system source category.Section 3 provides a listing of the steps involved in using the preferred method for estimatinggreenhouse gas emissions from this source. Section 4 presents the preferred estimation method;Section 5 presents an alternative estimation technique. Quality assurance and quality controlprocedures are described in Section 6. References used in developing this chapter are identifiedin Section 7.


EIIP Volume VIII 3.2-1
2
SOURCE CATEGORY DESCRIPTION2.1 EMISSION SOURCES
Oil and natural gas systems are the third largest source of methane in the U.S., comprising 18percent of methane emissions and 1.7 percent of total GHG emissions in 1996 (U.S. EPA 1998).In the U.S., methane emissions from natural gas systems are about 5 times greater than methaneemissions from oil systems.
This source category contains many distinct subcategories. It is important to account foremissions from oil and natural gas systems separately in order to differentiate between emissionsassociated with particular fuels. For purposes of this workbook, the terms natural gas or gas areused to refer to both natural gas (extracted from the ground), and "synthetic" or "substitute"natural gas (comprised mostly of methane) produced from other petroleum-based products orsources. Depending on its origin and how it is processed, commercially distributed natural gasalso will include various amounts of non-methane hydrocarbons (e.g., ethane, butane, propane,and pentane), carbon monoxide, carbon dioxide, and nitrogen. Oil is used to refer to both oilextracted directly from the ground and oil produced by various synthetic processes, such asrecovery of oil from oil shale or tar sands.
Methane is emitted during oil and gas production, storage, transportation, and distribution."Fugitive" sources of emissions within oil and gas systems include: releases during normaloperations, such as emissions associated with venting and flaring during oil and gas production,chronic leaks or discharges from process vents; emissions during routine maintenance, such aspipeline repair; and emissions during system upsets and accidents.
Oil and Natural Gas System Overview:
1. Oil and Gas Production: Oil and gas are withdrawn from underground formations usingon-shore and offshore wells. While most gas production is from gas wells, frequently gasis found in association with oil, and is withdrawn simultaneously from the same geologicformation, and then separated. Gathering lines are used to bring the crude oil and raw gasto one or more collection point(s) within a production field. Because methane is the majorcomponent of natural gas, leaks or venting from these systems result in methaneemissions.
2. Crude Oil Transportation and Refining: The largest single contributor to methaneemissions from the oil sector is venting from crude oil storage facilities that hold the oilbefore it is piped or trucked to refineries. The methane that is in solution vaporizes and isvented from the storage tanks directly to the atmosphere, unless it is captured by vapor

CHAPTER 3 – NATURAL GAS AND OIL SYSTEMS 10/20/99
3.2-2 EIIP Volume VIII
recovery units. Some emissions occur as crude is transferred in tankers and pipelines forshipment to refineries. Methane emissions from crude oil streams are strongly dependenton the original methane content of the crude oil and its preparation for transport.
Refineries process crude oil into a variety of hydrocarbon products such as gasoline andkerosene. Refineries account for only about 2 percent of the emissions from the oil sector.Refinery outputs, referred to as "refined products," generally contain negligible amountsof methane. Consequently, methane emissions are not estimated for transporting anddistributing refined products.
3. Natural Gas Processing, Transportation, and Distribution: Natural gas is processed toremove water and recover heavier hydrocarbons, such as ethane, propane and butane, andprepare the dried gas for transporting to consumers. Most gas is transported throughtransmission and distribution pipelines. A small amount of gas is shipped by tanker asliquefied natural gas (LNG).
The following are the main processing, transportation, and distribution activities:
• Gas processing plants: Natural gas is usually processed in gas plants to remove andprocess the natural gas liquids and prepare the natural gas for pipeline transportation.During processing, natural gas is dried and a variety of processes may be used toremove most of the heavier hydrocarbons, or condensate, from the gas. Processed gasis then injected into the natural gas transmission system and the heavier hydrocarbonsare marketed separately. Major methane emissions sources in the gas processing arecompressor fugitives, compressor exhaust, vents, pneumatic devices, and blowdown.
• Transmission pipelines: Transmission pipelines are large diameter, high pressurelines that transport gas from production fields, processing plants, storage facilities,and other sources of supply over long distances to local distribution companies, orlarge volume customers. A variety of facilities support the overall system, includingmetering stations, maintenance facilities, and compressor stations located alongpipeline routes. Compressor stations, which maintain the pressure in the pipeline,generally include upstream scrubbers where the incoming gas is cleaned of particlesand liquids before entering the compressors. Reciprocating engines and turbines areused to drive the compressors. Compressor stations normally use pipeline gas to fuelthe compressor. They also use the gas to fuel electric power generators to meet thestation's electricity requirements. Major methane emissions sources are chronic leaks,compressor fugitives, compressor exhaust, vents, and pneumatic devices.
• Local Distribution Companies: Distribution pipelines are extensive networks ofgenerally small diameter, low pressure pipelines. Gas enters distribution networksfrom transmission systems at "city gate stations," where the pressure is reduced fordistribution within cities or towns. Major methane emissions sources are chronicleaks, meters, regulators, and mishaps.

EIIP Volume VIII 3.3-1
3
OVERVIEW OF AVAILABLE METHODS FORESTIMATING EMISSIONSSection 4 below presents two preferred methods for estimating methane emissions; one fornatural gas systems, and the other for oil systems.
Section 5 below presents analternative method for esti-mating methane emissionsfrom natural gas systems.This method is less complexthan the preferred method,and uses data that are morereadily available, but it isalso less accurate than thepreferred method. Note thatthe alternative method fornatural gas systems is thesame as the preferredmethod for oil systems.(There is no alternativemethod for oil systems.)
The data required for thepreferred method for naturalgas systems include: (1) thenumber of wells and off-shore platforms, (2) thenumber of miles of gather-ing pipeline, (3) the numberof gas processing plants, (4)the number of miles oftransmission pipeline, and(5) the total number of ser-vices (i.e., gas meters). Thedata required for the alter-native method for naturalgas systems are state-leveldata on gas production, gas
Methods for developing greenhouse gas inventories arecontinuously evolving and improving. The methods presented inthis volume represent the work of the EIIP Greenhouse GasCommittee in 1998 and early 1999. This volume takes intoaccount the guidance and information available at the time oninventory methods, specifically, U.S. EPA's State Workbook:Methodologies for Estimating Greenhouse Gas Emissions(U.S.EPA 1998a), volumes 1-3 of the Revised 1996 IPCCGuidelines for National Greenhouse Gas Inventories (IPCC,1997), and the Inventory of U.S. Greenhouse Gas Emissions andSinks: 1990 – 1996 (U.S. EPA 1998b).
There have been several recent developments in inventorymethodologies, including:
• Publication of EPA’s Inventory of U.S. Greenhouse GasEmissions and Sinks: 1990 – 1997 (U.S. EPA 1999b) andcompletion of the draft inventory for 1990 – 1998. Thesedocuments will include methodological improvements forseveral sources and present the U.S. methodologies in a moretransparent manner than in previous inventories;
• Initiation of several new programs with industry, whichprovide new data and information that can be applied tocurrent methods or applied to more accurate and reliablemethods (so called "higher tier methods" by IPCC); and
• The IPCC Greenhouse Gas Inventory Program’s upcomingreport on Good Practice in Inventory Management, whichdevelops good practice guidance for the implementation ofthe 1996 IPCC Guidelines. The report will be published bythe IPCC in May 2000.
Note that the EIIP Greenhouse Gas Committee has notincorporated these developments into this version of the volume.Given the rapid pace of change in the area of greenhouse gasinventory methodologies, users of this document are encouragedto seek the most up-to-date information from EPA and the IPCCwhen developing inventories. EPA intends to provide periodicupdates to the EIIP chapters to reflect important methodologicaldevelopments. To determine whether an updated version of thischapter is available, please check the EIIP site athttp://www.epa.gov/ttn/chief/eiip/techrep.htm#green.

CHAPTER 3 – NATURAL GAS AND OIL SYSTEMS 10/20/99
3.3-2 EIIP Volume VIII
consumption, and oil production.
The preferred method for natural gas systems is based on a set of activity levels for the activitiesfrom which methane is emitted, and a set of emission factors presented in a study by the GasResearch Institute and the U.S. Environmental Protection Agency. (GRI/EPA, 1996) The studywas based on a large survey of emissions from the natural gas industry.
The GRI/EPA study developed emission factors for activities in four segments of the natural gasindustry: production, processing, transmission (including storage), and distribution. Within eachsegment, industry facilities and operations were analyzed to identify sources of methaneemissions—both fugitive emissions (leaks) and vented emissions. The study identifiedapproximately 100 components of natural gas systems that are methane emission sources. Foreach component, the study developed an emission factor. To estimate emissions, one multipliesthese emission factors by the activity level for each component—e.g., amount of gas produced,numbers of wells, miles of pipe of a given type and operating regime, or hours of operation of agiven type of compressor.
The U.S. EPA uses the finely grained GRI/EPA data on emission factors and activity levels todevelop the annual U.S. inventory of greenhouse gas emissions. This approach is also the “Tier3” approach recommended by the IPCC (IPCC 1997). However, for purposes of state-levelestimation of methane emissions from natural gas systems, EPA has developed simplifiedemission factors that aggregate the emissions from throughout natural gas systems and representthose emissions as being associated with certain aspects of natural gas systems. Section 4 usesthese emission factors, which require the use of only a few key activity levels. Thus, for eachactivity level, this methodology presents an emission factor that represents emissions both fromthe specified activity and from several associated activities.1 Note that this simplified approachestimates emissions using data only on the natural gas system infrastructure, and does not usedata on natural gas production.2 However, the emission factors for the natural gas systeminfrastructure components also account for the emissions from production. The simplifiedapproach is relatively accurate; when used to estimate total U.S. emissions from the natural gassectors, it yields an estimate within six percent of the estimate generated using the full EPA/GRIdatabase. However, the simplified approach is less accurate when used to estimate emissions fora state that transmits large amounts of gas but does not produce much gas. For such a state, thesimplified approach would overestimate the state’s emissions, because it would allocate to thestate some emissions from gas production in other states.
1 Those states that are interested in obtaining the entire GRI/EPA database on emission factors may obtain thepublished database (GRI/EPA, 1996); an updated version of the database is available from Paul Gunning, EPA’sClimate Protection Division (202-564-9736). However, it would be quite difficult to compile the state-level activitydata needed to use this complete set of emission factors.2 The purpose of this workbook is to present emission estimation techniques for GHG sources and sinks in a clearand unambiguous manner. To this end, the simplified method strikes a balance between rigor, data collection efforts,and applicability to specific states. However, we understand that data availability and emission factors may vary bystate and we encourage states to tailor this method as needed.

10/20/99 CHAPTER 3 – NATURAL GAS AND OIL SYSTEMS
EIIP Volume VIII 3.3-3
EPA recently developed and adopted an improved methodology for calculating emissions fromthe oil industry.3 This methodology uses emission factors and activity data at a level of detailcomparable to the GRI/EPA study for the natural gas industry. Until this approach is modified tomake it usable at the state level, the preferred method for estimating methane emissions from oilsystems continues to be the “Tier 1” approach developed by the Intergovernmental Panel onClimate Change (IPCC 1997). This approach is simpler than the preferred method for natural gassystems, but is also less accurate. This method involves three relatively simple steps: (1) obtainthe required state-level data on oil production, oil refined, oil tankered, and gas production; (2)multiply activity levels by the appropriate emission factors; and (3) sum across activity types tocalculate total emissions. The method yields median estimates, but can also be used to developlow and high estimates, by using low and high emission factors.
As noted above, the alternative method for natural gas systems is analogous to the preferredmethod for oil systems.
3 USEPA (U.S. Environmental Protection Agency). 1999a. Draft Report. Estimates of Methane Emissions from theU.S. Oil Industry. Office of Air and Radiation. EPA-68-W7-0069.

EIIP Volume VIII 3.4-1
4
PREFERRED METHODS FOR ESTIMATINGEMISSIONSThis section presents two preferred methods, one for natural gas systems and one for oil systems.
4.1 PREFERRED METHOD FOR ESTIMATING EMISSIONS FROM NATURAL GASSYSTEMS
This section presents a method for estimating methane emissions from natural gas systems, basedon a set of activity levels for the activities from which methane is emitted. Step (1) Obtain Activity Data • Required Data: Data are required for four stages of the natural gas system, as described
below.
For estimating production emissions: The data required are (1) number of wells,broken down into the number of non-associated wells and the number ofassociated wells (non-associated wells produce only gas; associated wells produceboth gas and oil); (2) the number of offshore platforms in the Gulf of Mexico (ifapplicable); (3) the number of offshore platforms in water bodies other than theGulf of Mexico (if applicable); (4) the number of miles of gathering pipeline. Because of the different characteristics of wells in different parts of the country,the data required vary in different regions. In Appalachian states,5 data arerequired only for the total number of wells.
For estimating gas processing emissions: The data required are the number of gasprocessing plants.
For estimating gas transmission emissions: The data required are (1) the numberof miles of transmission pipeline; (2) the number of transmission stations andstorage stations (or use a default based on pipeline length as discussed below);and (3) the number of LNG storage stations. The last data element may be omittedif data are not available, since the emissions from LNG storage stations are small.
5 West Virginia, Pennsylvania, Kentucky, New York, Maryland, and Virginia.

CHAPTER 3 – NATURAL GAS AND OIL SYSTEMS 10/20/99
3.4-2 EIIP Volume VIII
For estimating gas distribution emissions: The data required are (1) the number ofmiles of cast iron main pipeline, (2) the number of miles of unprotected steel mainpipeline, (3) the number of miles of protected steel main pipeline; (4) the numberof miles of plastic main pipeline, (5) the total number of services (the industryname for customer connections), (6) the number of unprotected steel services (oruse a default based on the total number of services as discussed below), and (7)number of protected steel services (or use a default based on the total number ofservices as discussed below).
• Data Sources: Most of the activity level data required to generate the emissions are
available in three publications.
Data on the number of wells by state can generally be found in the Natural GasAnnual (e.g., EIA 1997a), the Basic Petroleum Data Book (e.g., API 1998), orGas Facts (e.g., AGA 1993). The breakout for associated and non-associatedwells may be obtained by consulting local producers and requesting a roughpercentage estimate. As an alternative, data in the Natural Gas Annual on theproportion of annual gas production from associated wells versus non-associatedwells can be used as a proxy for the proportion of each type of well. Gas Factsprovides data on the number of miles of gathering pipeline. Each June, the Oil and Gas Journal provides data on the number of gasprocessing plants by state. Data on the number of miles of transmission pipeline by state are reported in GasFacts. Data on the number of gas transmission stations and gas storage stationsmay be available from state sources. If these data are not available, the number ofgas transmission and storage stations may be estimated by multiplying the state’smileage of transmission pipeline by 0.005975 (for transmission stations) and0.001357 (for storage stations). The number of LNG storage stations may beavailable from state sources. As noted above, however, LNG storage stations are asmall source of emissions, and may be disregarded if data are not available. Gas Facts reports mileage of distribution pipeline by type (steel, plastic and“other”). If a state has more detailed data on mileage of each of the four types ofpipeline shown in Table 3.4-1, those data may be used with emission factors in thetable for each type of pipeline. The mileage of each type of pipeline may also beestimated based on the ratios shown in the footnotes to Table 3.4-1. Alternatively,Table 3.4-1 provides a single emission factor applicable to all distributionpipelines. Gas Facts also reports data on the number of services, and thebreakdown between protected steel services and unprotected steel services.Alternatively, these data may be available from local gas distribution companies.If state-level data are not available for the number of protected and unprotectedsteel services, a state may estimate these numbers by multiplying the total number
10/20/99 CHAPTER 3 – NATURAL GAS AND OIL SYSTEMS
EIIP Volume VIII 3.4-3
of services by 0.4656 (for protected steel services) and 0.1246 (for unprotectedsteel services). The balance of services are made of plastic or copper.
• Units for Reporting Data: The units for reporting data are either the number of a giventype of unit (e.g., the number of a given type of well) or the number of miles of a giventype of pipeline.
Step (2) Develop Estimate of Methane Emissions
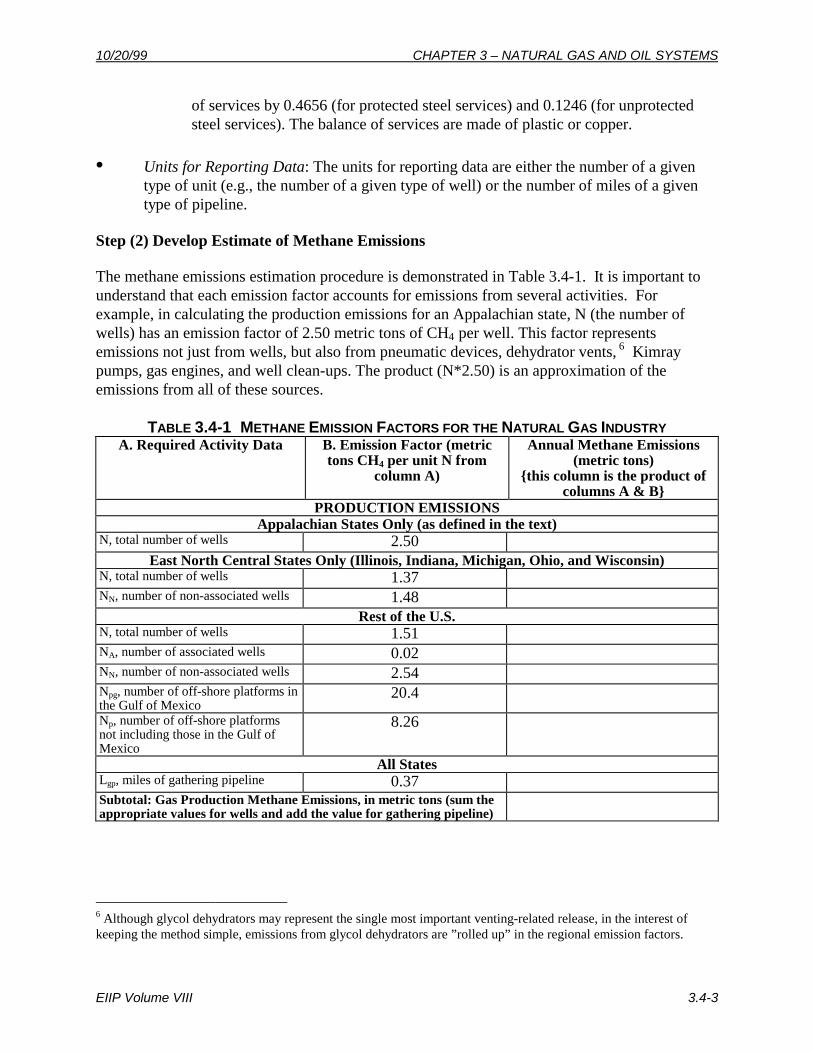
The methane emissions estimation procedure is demonstrated in Table 3.4-1. It is important tounderstand that each emission factor accounts for emissions from several activities. Forexample, in calculating the production emissions for an Appalachian state, N (the number ofwells) has an emission factor of 2.50 metric tons of CH4 per well. This factor representsemissions not just from wells, but also from pneumatic devices, dehydrator vents, 6 Kimraypumps, gas engines, and well clean-ups. The product (N*2.50) is an approximation of theemissions from all of these sources.
TABLE 3.4-1 METHANE EMISSION FACTORS FOR THE NATURAL GAS INDUSTRYA. Required Activity Data B. Emission Factor (metric
tons CH4 per unit N fromcolumn A)
Annual Methane Emissions(metric tons)
{this column is the product ofcolumns A & B}
PRODUCTION EMISSIONSAppalachian States Only (as defined in the text)
N, total number of wells 2.50East North Central States Only (Illinois, Indiana, Michigan, Ohio, and Wisconsin)
N, total number of wells 1.37NN, number of non-associated wells 1.48
Rest of the U.S.N, total number of wells 1.51NA, number of associated wells 0.02NN, number of non-associated wells 2.54Npg, number of off-shore platforms inthe Gulf of Mexico
20.4
Np, number of off-shore platformsnot including those in the Gulf ofMexico
8.26
All StatesLgp, miles of gathering pipeline 0.37Subtotal: Gas Production Methane Emissions, in metric tons (sum theappropriate values for wells and add the value for gathering pipeline)
6 Although glycol dehydrators may represent the single most important venting-related release, in the interest ofkeeping the method simple, emissions from glycol dehydrators are ”rolled up” in the regional emission factors.

CHAPTER 3 – NATURAL GAS AND OIL SYSTEMS 10/20/99
3.4-4 EIIP Volume VIII
A. Required Activity Data B. Emission Factor (metrictons CH4 per unit N from
column A)
Annual Methane Emissions(metric tons)
{this column is the product ofcolumns A & B}
GAS PROCESSING EMISSIONS (ALL STATES)P, number of gas processingplants
948
Subtotal: Gas Processing Methane Emissions (metric tons):GAS TRANSMISSION EMISSIONS (ALL STATES)
ST, number of gasTransmission stations3
891
SS, number of gasstorage stations4
914
L, miles of transmission pipeline 0.68SLNG, number of LNGstorage stations
914
Subtotal: Gas Transmission Methane Emissions (metric tons):GAS DISTRIBUTION EMISSIONS (ALL STATES)
MCI, miles of cast irondistribution pipeline5
4.63
MUS, miles of unprotected steeldistribution pipeline6
2.16
MPS, miles of protected steeldistribution pipeline7
0.11
MPl, miles of plastic distributionpipeline8
0.42
3 In the absence of more accurate data, ST may be estimated by the following: L*0.0060, where L is the length oftransmission pipeline in miles.4 In the absence of more accurate data, SS may be estimated by the following: L*0.0014, where L is the length oftransmission pipeline in miles.5 In the absence of more accurate data, MCI may be estimated by the following: 0.066*M, where M is the length ofdistribution pipeline in miles.6 In the absence of more accurate data, MUS may be estimated by the following: 0.098*M, where M is the length ofdistribution pipeline in miles.7 In the absence of more accurate data, MPS may be estimated by the following: 0.53*M, where M is the length ofdistribution pipeline in miles.8 In the absence of more accurate data, MPl may be estimated by the following: 0.30*M, where M is the length ofdistribution pipeline in miles.

10/20/99 CHAPTER 3 – NATURAL GAS AND OIL SYSTEMS
EIIP Volume VIII 3.4-5
A. Required Activity Data B. Emission Factor (metrictons CH4 per unit N from
column A)
Annual Methane Emissions(metric tons)
{this column is the product ofcolumns A & B}
Alternative approach—Default for M: miles of
distribution pipeline
0.70
Sub-Subtotal: Pipeline Methane Emissions, in metric tons (eithersum the products of the activity levels for each of the four types ofpipeline, multiplied by the respective emission factors, or copy the
product of the activity level for all distribution pipeline, multiplied bythe default emission factor)
H, total number of services 0.014HUS, number of unprotected steel
services90.033
HPS, number of protected steelservices10
0.0035
Sub-Subtotal: Services Methane Emissions, in metric tonsSubtotal: Distribution Methane Emissions, in metric tons (sum the
two sub-subtotals)TOTAL METHANE EMISSIONS FROM THE GAS INDUSTRY,
IN METRIC TONS (sum all subtotals):
Step (3) Convert Units to Metric Tons of Carbon Equivalent
• Convert from units of metric tons to units of metric tons of carbon equivalent (MTCE).First multiply by 21 (the global warming potential of methane) and then by 12/44 (theratio of the atomic weight of carbon to the molecular weight of CO2), to obtain theamount of methane in units of MTCE.
4.2 PREFERRED METHOD FOR ESTIMATING EMISSIONS FROM OIL SYSTEMS
This method estimates methane emissions from oil systems, based on oil and gas production, oiltransport by tanker, and oil refining.
Step (1) Obtain Activity Data
• Required Data. The information required to estimate emissions from this source is basedon activity (e.g., production) by the oil sector. Data required include the amount of oilproduced, refined, transported, and stored at oil facilities.
9 In the absence of more accurate data, HUS may be estimated by the following: H*0.12, where H is the total numberof services.10 In the absence of more accurate data, HPS may be estimate by the following: H*0.47, where H is the total numberof services.
CHAPTER 3 – NATURAL GAS AND OIL SYSTEMS 10/20/99
3.4-6 EIIP Volume VIII
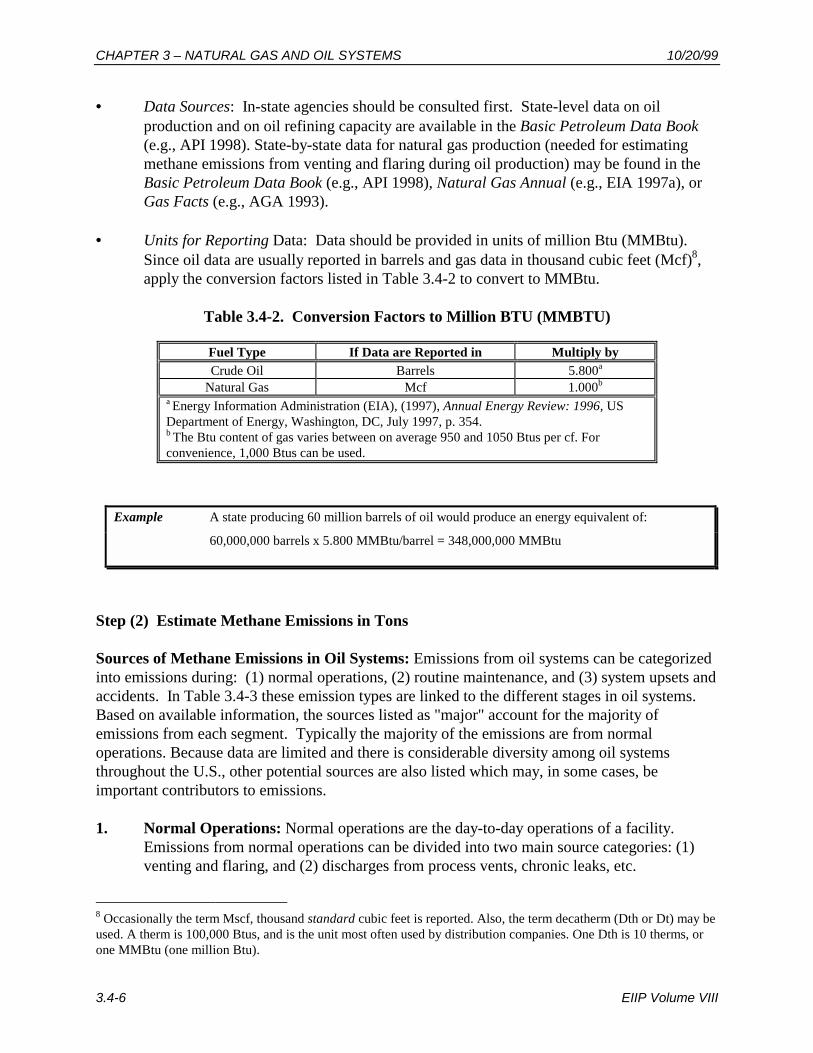
• Data Sources: In-state agencies should be consulted first. State-level data on oilproduction and on oil refining capacity are available in the Basic Petroleum Data Book(e.g., API 1998). State-by-state data for natural gas production (needed for estimatingmethane emissions from venting and flaring during oil production) may be found in theBasic Petroleum Data Book (e.g., API 1998), Natural Gas Annual (e.g., EIA 1997a), orGas Facts (e.g., AGA 1993).
• Units for Reporting Data: Data should be provided in units of million Btu (MMBtu).Since oil data are usually reported in barrels and gas data in thousand cubic feet (Mcf)8,apply the conversion factors listed in Table 3.4-2 to convert to MMBtu.
Table 3.4-2. Conversion Factors to Million BTU (MMBTU)
Fuel Type If Data are Reported in Multiply byCrude Oil Barrels 5.800a
Natural Gas Mcf 1.000b
a Energy Information Administration (EIA), (1997), Annual Energy Review: 1996, USDepartment of Energy, Washington, DC, July 1997, p. 354.b The Btu content of gas varies between on average 950 and 1050 Btus per cf. Forconvenience, 1,000 Btus can be used.
Step (2) Estimate Methane Emissions in Tons
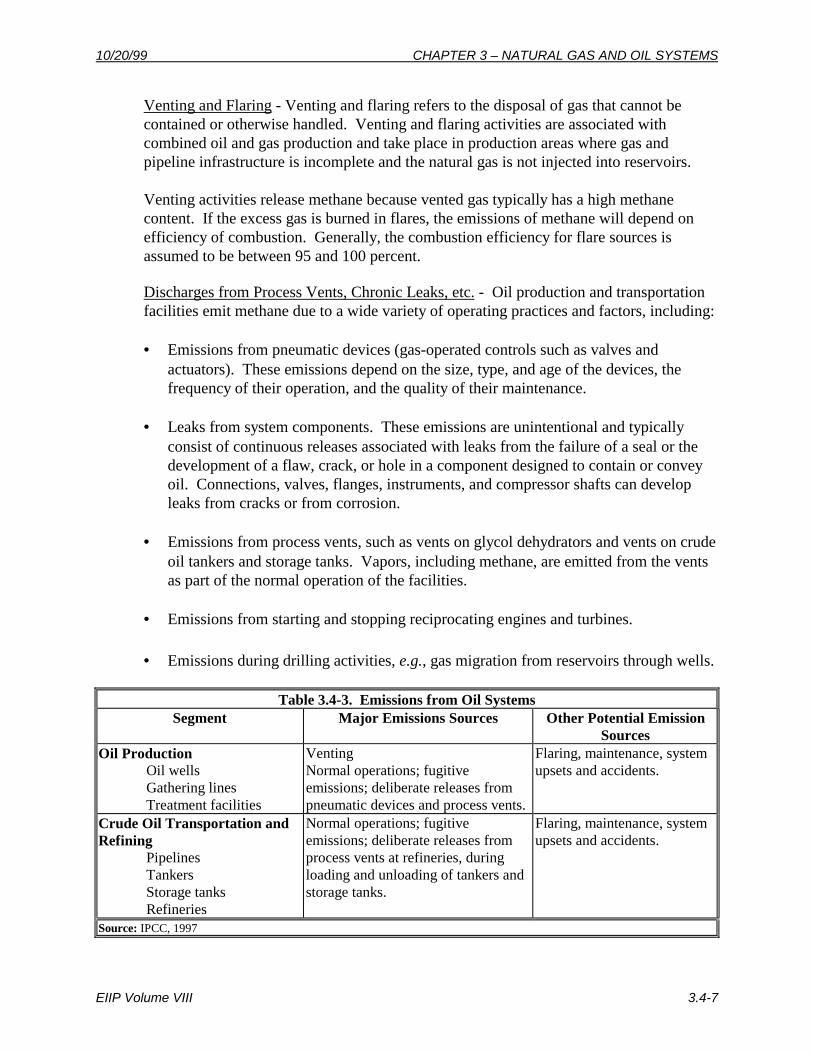
Sources of Methane Emissions in Oil Systems: Emissions from oil systems can be categorizedinto emissions during: (1) normal operations, (2) routine maintenance, and (3) system upsets andaccidents. In Table 3.4-3 these emission types are linked to the different stages in oil systems.Based on available information, the sources listed as "major" account for the majority ofemissions from each segment. Typically the majority of the emissions are from normaloperations. Because data are limited and there is considerable diversity among oil systemsthroughout the U.S., other potential sources are also listed which may, in some cases, beimportant contributors to emissions.
1. Normal Operations: Normal operations are the day-to-day operations of a facility.Emissions from normal operations can be divided into two main source categories: (1)venting and flaring, and (2) discharges from process vents, chronic leaks, etc.
8 Occasionally the term Mscf, thousand standard cubic feet is reported. Also, the term decatherm (Dth or Dt) may beused. A therm is 100,000 Btus, and is the unit most often used by distribution companies. One Dth is 10 therms, orone MMBtu (one million Btu).
Example A state producing 60 million barrels of oil would produce an energy equivalent of:
60,000,000 barrels x 5.800 MMBtu/barrel = 348,000,000 MMBtu
10/20/99 CHAPTER 3 – NATURAL GAS AND OIL SYSTEMS
EIIP Volume VIII 3.4-7
Venting and Flaring - Venting and flaring refers to the disposal of gas that cannot becontained or otherwise handled. Venting and flaring activities are associated withcombined oil and gas production and take place in production areas where gas andpipeline infrastructure is incomplete and the natural gas is not injected into reservoirs.
Venting activities release methane because vented gas typically has a high methanecontent. If the excess gas is burned in flares, the emissions of methane will depend onefficiency of combustion. Generally, the combustion efficiency for flare sources isassumed to be between 95 and 100 percent.
Discharges from Process Vents, Chronic Leaks, etc. - Oil production and transportationfacilities emit methane due to a wide variety of operating practices and factors, including:
• Emissions from pneumatic devices (gas-operated controls such as valves andactuators). These emissions depend on the size, type, and age of the devices, thefrequency of their operation, and the quality of their maintenance.
• Leaks from system components. These emissions are unintentional and typicallyconsist of continuous releases associated with leaks from the failure of a seal or thedevelopment of a flaw, crack, or hole in a component designed to contain or conveyoil. Connections, valves, flanges, instruments, and compressor shafts can developleaks from cracks or from corrosion.
• Emissions from process vents, such as vents on glycol dehydrators and vents on crudeoil tankers and storage tanks. Vapors, including methane, are emitted from the ventsas part of the normal operation of the facilities.
• Emissions from starting and stopping reciprocating engines and turbines.
• Emissions during drilling activities, e.g., gas migration from reservoirs through wells.
Table 3.4-3. Emissions from Oil SystemsSegment Major Emissions Sources Other Potential Emission
SourcesOil Production
Oil wellsGathering linesTreatment facilities
VentingNormal operations; fugitiveemissions; deliberate releases frompneumatic devices and process vents.
Flaring, maintenance, systemupsets and accidents.
Crude Oil Transportation andRefining
PipelinesTankersStorage tanksRefineries
Normal operations; fugitiveemissions; deliberate releases fromprocess vents at refineries, duringloading and unloading of tankers andstorage tanks.
Flaring, maintenance, systemupsets and accidents.
Source: IPCC, 1997

CHAPTER 3 – NATURAL GAS AND OIL SYSTEMS 10/20/99
3.4-8 EIIP Volume VIII
2. Routine Maintenance: Routine maintenance includes regular and periodic activitiesperformed in the operation of the facility. These activities may be conducted frequently,such as launching and receiving scrapers (pigs) in a pipeline, or infrequently, such asevacuation of pipes ("blowdown") for periodic testing or repair. In each case, therequired procedures release gas from the affected equipment. Releases also occur duringmaintenance of wells ("well workovers") and during replacement or maintenance offittings.
3. System Upsets and Accidents: System upsets are unplanned events in the system. Themost common upset is a sudden pressure surge resulting from the failure of a pressureregulator. The potential for unplanned pressure surges is considered during facilitydesign, and facilities are provided with pressure relief systems to protect the equipmentfrom damage due to the increased pressure.
Release systems vary in design. In some cases, gases released through relief valves maybe collected and transported to a flare for combustion or re-compressed and reinjectedinto the system. In these cases, methane emissions associated with pressure relief eventswill be small. In older facilities, relief systems may vent gases directly into theatmosphere or send gases to flare systems where complete combustion may not beachieved.
The frequency of system upsets varies with the facility design and the operating practices.In particular, facilities operating well below capacity are less likely to experience systemupsets and related emissions. Emissions associated with accidents are also included inthe category of upsets.
To develop median estimates of methane emissions:9
• Multiply activity data by the appropriate emission factor, as presented in Table 3.4-4. Dothis for each activity type presented in Table 3.4-4.
Activity Level (MMBTU) x Emission factor (median, lbs CH4/MMBTU) = lbs CH4(median)
• Divide the number of lbs/ CH4 obtained by 2,000 lbs/ton to obtain tons of CH4 produced.
lbs CH4 (median, for each activity) ÷ 2,000 lbs/ton = tons CH4 (median, for eachactivity)
9 Data are also provided in Table 3.4-3 to permit development of low and high estimates of methane emissions, ifdesired.

10/20/99 CHAPTER 3 – NATURAL GAS AND OIL SYSTEMS
EIIP Volume VIII 3.4-9
Table 3.4-4. Methane Emission Factors for Oil Activities
Sector Activity Data (MMBtu)
Emission Factor (lbs CH4/MMBtu)
Low High Median
Oil Production
Oil Oil Production 0.0007 0.0116 0.0062
Oil & Gas: Venting and Flaring(portion attributable to oil production)
Oil & GasProduceda
0.0035 0.0163 0.0099
Crude Oil Transportation and Refining
Transportation Oil Tankered 0.0017 0.0017 0.0017
Refining Oil Refined 0.0002 0.0033 0.0017
Storage Tanks Oil Refined 0.00005 0.0006 0.0003
a Emissions are based on total production of oil and gas. Source: IPCC, 1997; the emission factors for the oil portion of oil and gas venting and flaring have beenestimated as one-half of the IPCC emission factors for venting and flaring from oil and gas production combined.
Step (3) Estimate Total Methane Emissions from Oil Systems • Sum across the five activity types (i) to obtain total methane emissions from oil and
natural gas systems. i7 Σ tons CH4 (median) = Total CH4 Emissions from Oil Systems (tons CH4, median estimate) i1
• Convert from units of tons to units of metric tons of carbon equivalent (MTCE). First,
multiply the weight of methane in tons by 0.9072 to obtain the weight of methane inmetric tons. Then multiply by 21 (the global warming potential of methane) and by 12/44(the ratio of the atomic weight of carbon to the molecular weight of CO2) to obtain theamount of methane in units of MTCE.
Example For each 1,000,000 million BTU (MMBTU) of oil produced in a state, estimated methaneemissions from oil production facilities would be :
Median1,000,000 (MMBTU) x 0.0062 (lbs CH4/MMBTU) = 6,200 lbs CH4
6,200 lbs CH4 ÷ 2,000 (lbs/ton) = 3.1 tons CH4
Perform similar calculations for the other four activities, and then sum across all activities.

CHAPTER 3 – NATURAL GAS AND OIL SYSTEMS 10/20/99
3.4-10 EIIP Volume VIII
The method presented uses emission factors multiplied by activity data that describe the oilsystem production level. While it is relatively easy to obtain the necessary activity data, note thatthe basis for developing the emission factors used in this method is weak. Because oil systemsare comprised of a complex set of facilities, simple relationships between emissions andcomponents of the systems are not easily defined. In addition, no single set of emission factorscan apply to all conditions. Consequently, more detailed assessments would be required to moreaccurately reflect the diverse nature of the industry throughout the U.S.10
The emission factors presented were developed as part of the IPCC emission inventoryguidelines for oil and gas systems (IPCC, 1997), which was based on a review of all availablepublished estimates of methane emissions from the various sectors of the oil and gas industry.Although the objective in developing the emission factors was to include all emissions sourcesand types (described in the previous section), in some cases no published emissions estimateswere found for categories of emissions believed to be negligible. Using the available published emissions estimates, the implied emission factors from each studywere developed by dividing the emissions estimates by appropriate measures of system size orcapacity. Across the studies, the resulting implied emission factors per unit of energy variedwidely. The estimates were grouped by region, and within each region a range of emissionfactors was selected for the IPCC emissions inventory guidelines. The emission factors used arethe factors developed from studies of the U.S. system. The emission factors can be considered to be no better than "order of magnitude" estimates.Actual emissions depend on site-specific characteristics including facility design, operation, andmaintenance. While these characteristics were considered to various extents in the studies thatformed the basis for the emission factor estimates, the variation in characteristics among systemsthroughout the U.S. implied the need for a range of emission factors (median, low, and high).
10 As noted above, in 1999 EPA developed a more detailed assessment of methane emissions from the oil industry.Once adapted to state conditions, this method will be able to reflect the diversity of emission sources in the oilindustry within the US.

EIIP Volume VIII 3.5-1
5
ALTERNATIVE METHOD FOR ESTIMATINGEMISSIONS FROM NATURAL GAS SYSTEMSThis method estimates methane emissions from natural gas systems, based on oil and gasproduction, and gas consumption.
Step (1) Obtain Activity Data
• Required Data. The information required to estimate emissions from this source is basedon activity (e.g., production) by sector (oil or gas). Data required include: the amount ofoil produced, refined, transported, and stored at oil facilities; and the amount of naturalgas produced, processed, and distributed to consumers.
• Data Sources: In-state agencies should be consulted first. However, if it is difficult toobtain data from these sources, state-by-state data on natural gas systems may be found inNatural Gas Annual (e.g., EIA 1997a) and Gas Facts (e.g., AGA 1993). State-level dataon oil production (needed for estimating emissions from venting and flaring in natural gassystems) may be found in the Basic Petroleum Data Book (e.g., API 1998).
• Units for Reporting Data: Data should be provided in units of million Btu (MMBtu).Since gas data are usually reported in thousand cubic feet (Mcf)11 and oil data in barrels,apply the conversion factors listed in Table 3.5-1 to convert to MMBtu.
Table 3.5-1. Conversion Factors to Million BTU (MMBTU)
Fuel Type If Data are Reported in Multiply byCrude Oil Barrels 5.800a
Natural Gas Mcf 1.000b
a Energy Information Administration (EIA), (1997), Annual Energy Review: 1996, USDepartment of Energy, Washington, DC, July 1997, p. 354.b The Btu content of gas varies between on average 950 and 1050 Btus per cf. Forconvenience, 1,000 Btus can be used.
11 Occasionally the term Mscf, thousand standard cubic feet is reported. Also, the term decatherm (Dth or Dt) maybe used. A therm is 100,000 Btus, and is the unit most often used by distribution companies. One Dth is 10 therms,or one MMBtu (one million Btu).
CHAPTER 3 – NATURAL GAS AND OIL SYSTEMS 10/20/99
3.5-2 EIIP Volume VIII
Step (2) Estimate Methane Emissions in Tons
Sources of Methane Emissions in Natural Gas Systems: Emissions from gas systems can becategorized into emissions during: (1) normal operations, (2) routine maintenance, and (3)system upsets and accidents. In Table 3.5-2 these emission types are linked to the differentstages in gas systems. Based on available information, the sources listed as "major" account forthe majority of emissions from each segment. Typically the majority of the emissions are fromnormal operations. Because the data are limited and there is considerable diversity among gassystems throughout the U.S., other potential sources are also listed which may, in some cases, beimportant contributors to emissions.
1. Normal Operations: Normal operations are the day-to-day operations of a facility.Emissions from normal operations can be divided into two main source categories: (1)venting and flaring, and (2) discharges from process vents, chronic leaks, etc.
Venting and Flaring - Venting and flaring refers to the disposal of gas that cannot becontained or otherwise handled. Venting and flaring activities are associated withcombined oil and gas production and take place in production areas where gas andpipeline infrastructure is incomplete and the natural gas is not injected into reservoirs.
Venting activities release methane because vented gas typically has a high methanecontent. If the excess gas is burned in flares, the emissions of methane will depend onefficiency of combustion. Generally, the combustion efficiency for flare sources isassumed to be between 95 and 100 percent.
Discharges from Process Vents, Chronic Leaks, etc. - Gas production, processing,transportation, and distribution facilities emit methane due to a wide variety of operatingpractices and factors, including:
• Emissions from pneumatic devices (gas-operated controls such as valves andactuators). These emissions depend on the size, type, and age of the devices, thefrequency of their operation, and the quality of their maintenance.
• Leaks from system components. These emissions are unintentional and typicallyconsist of continuous releases associated with leaks from the failure of a seal or thedevelopment of a flaw, crack, or hole in a component designed to contain or conveyoil or gas. Connections, valves, flanges, instruments, and compressor shafts candevelop leaks from cracks or from corrosion.
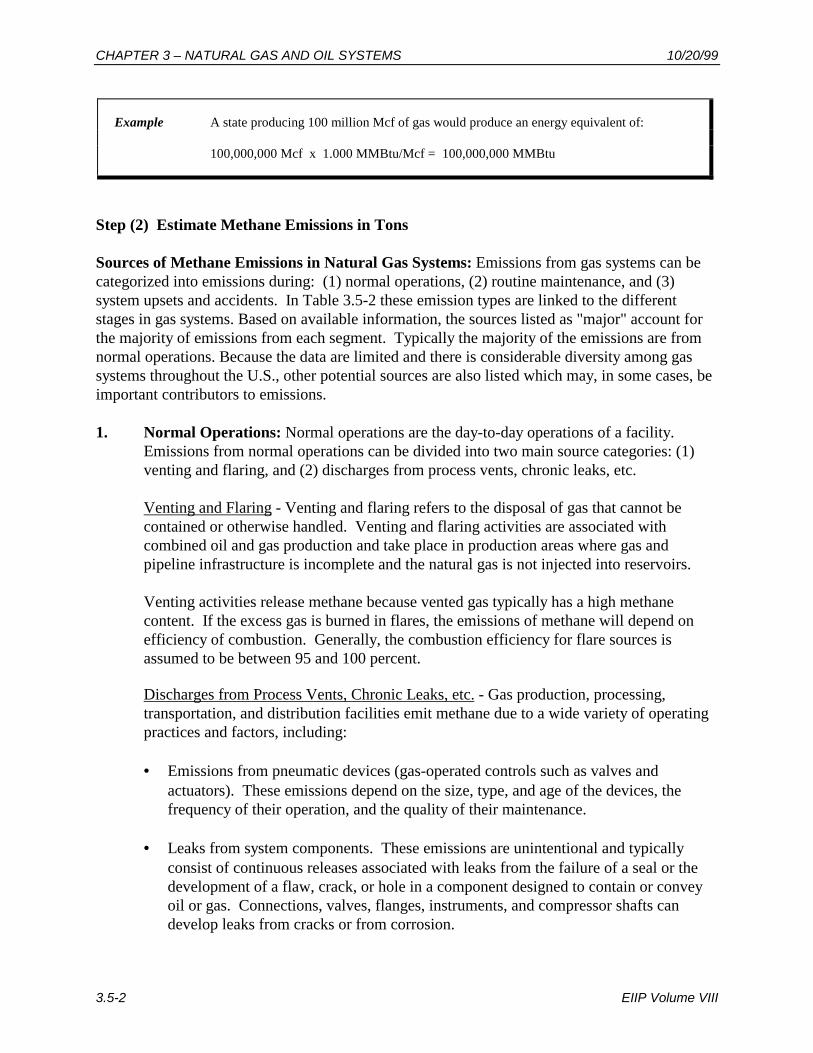
Example A state producing 100 million Mcf of gas would produce an energy equivalent of:
100,000,000 Mcf x 1.000 MMBtu/Mcf = 100,000,000 MMBtu

10/20/99 CHAPTER 3 – NATURAL GAS AND OIL SYSTEMS
EIIP Volume VIII 3.5-3
• Emissions from process vents, such as vents on glycol dehydrators and vents on crudeoil tankers and storage tanks. Vapors, including methane, are emitted from the ventsas part of the normal operation of the facilities. However, such process vents areminor methane sources in most gas production facilities.
• Emissions from starting and stopping reciprocating engines and turbines.
• Emissions during drilling activities, e.g., gas migration from reservoirs through wells.
Table 3.5-2. Emissions from Natural Gas SystemsSegment Major Emissions Sources Other Potential Emission
SourcesOil and Gas Production
Oil and gas wellsGathering linesTreatment facilities
VentingNormal operations; fugitiveemissions; deliberate releasesfrom pneumatic devices andprocess vents.
Flaring, maintenance, systemupsets and accidents.
Natural Gas Processing,Transportation, andDistribution
Gas plantsUnderground storagereservoirsTransmission PipelinesDistribution pipelines
Normal operations; fugitiveemissions; deliberate releasesfrom pneumatic devices andprocess vents.
Flaring, maintenance, systemupsets and accidents.
Source: IPCC, 1997
2. Routine Maintenance: Routine maintenance includes regular and periodic activitiesperformed in the operation of the facility. These activities may be conducted frequently,such as launching and receiving scrapers (pigs) in a pipeline, or infrequently, such asevacuation of pipes ("blowdown") for periodic testing or repair. In each case, the requiredprocedures release gas from the affected equipment. Releases also occur duringmaintenance of wells ("well workovers") and during replacement or maintenance of fittings.
3. System Upsets and Accidents: System upsets are unplanned events in the system. Themost common upset is a sudden pressure surge resulting from the failure of a pressureregulator. The potential for unplanned pressure surges is considered during facilitydesign, and facilities are provided with pressure relief systems to protect the equipmentfrom damage due to the increased pressure.
Release systems vary in design. In some cases, gases released through relief valves may becollected and transported to a flare for combustion or re-compressed and reinjected into thesystem. In these cases, methane emissions associated with pressure relief events will besmall. In older facilities, relief systems may vent gases directly into the atmosphere or sendgases to flare systems where complete combustion may not be achieved.

CHAPTER 3 – NATURAL GAS AND OIL SYSTEMS 10/20/99
3.5-4 EIIP Volume VIII
The frequency of system upsets varies with the facility design and the operating practices.In particular, facilities operating well below capacity are less likely to experience systemupsets and related emissions. Emissions associated with accidents are also included inthe category of upsets. Occasionally, gas transmission and distribution pipelines areaccidentally ruptured by construction equipment or other activities. These ruptures notonly result in methane emissions, but they can be extremely hazardous as well.
To develop median estimates of methane emissions:12
• Multiply activity data by the appropriate emission factor, as presented in Table 3.5-3. Dothis for each activity type presented in Table 3.5-3.
Activity Level (MMBTU) x Emission factor (median, lbs CH4/MMBTU) = lbs CH4(median)
• Divide the number of lbs/ CH4 obtained by 2,000 lbs/ton to obtain tons of CH4 produced.
lbs CH4 (median, for each activity) ÷ 2,000 lbs/ton = tons CH4 (median, for eachactivity)
Table 3.5-3. Methane Emission Factors for Natural Gas Activities
Sector Activity Data (MMBtu)
Emission Factor (lbs CH4/MMBtu)
Low High Median
Gas Production
Gas GasProduction
0.1069 0.1952 0.1510
Oil & Gas: Venting and Flaring(portion attributable to gasproduction)
Oil & GasProduceda
0.0035 0.0163 0.0099
Natural Gas Processing, Transport, and Distribution
Gas Processing, Transmission, andDistribution
GasConsumption
0.1324 0.2742 0.2033
a Emissions are based on total production of oil and gas. Source: IPCC, 1997; the emission factors for the gas portion of oil and gas venting and flaring have beenestimated as one-half of the IPCC emission factors for venting and flaring from oil and gas production combined.
12 Data are also provided in Table 3.5-3 to permit development of low and high estimates of methane emissions, ifdesired.

10/20/99 CHAPTER 3 – NATURAL GAS AND OIL SYSTEMS
EIIP Volume VIII 3.5-5
Step (3) Estimate Total Methane Emissions from Natural Gas Systems • Sum across the three activity types (i) to obtain total methane emissions from natural gas
systems. i7 Σ tons CH4 (median) = Total CH4 Emissions from Gas Systems (tons CH4, median estimate) i1 • Convert from units of tons to units of metric tons of carbon equivalent (MTCE). First,
multiply the weight of methane in tons by 0.9072 to obtain the weight of methane inmetric tons. Then multiply by 21 (the global warming potential of methane) and by 12/44(the ratio of the atomic weight of carbon to the molecular weight of CO2) to obtain theamount of methane in units of MTCE.
The method presented uses emission factors multiplied by activity data that describe the gassystem production level. While it is relatively easy to obtain the necessary activity data, note thatthe basis for developing the emission factors used in this method is weak. Because natural gassystems are comprised of a complex set of facilities, simple relationships between emissions andcomponents of the systems are not easily defined. In addition, no single set of emission factorscan apply to all conditions. Consequently, more detailed assessments would be required to moreaccurately reflect the diverse nature of the industry throughout the U.S. The emission factors presented were developed as part of the IPCC emission inventoryguidelines for oil and gas systems (IPCC, 1997), which was based on a review of all availablepublished estimates of methane emissions from the various sectors of the gas industry. Althoughthe objective in developing the emission factors was to include all emissions sources and types(described in the previous section), in some cases no published emissions estimates were foundfor categories of emissions believed to be negligible. Using the available published emissions estimates, the implied emission factors from each studywere developed by dividing the emissions estimates by appropriate measures of system size or
Example For each 1,000,000 million BTU (MMBTU) of natural gas produced in a state, estimated methaneemissions from natural gas production facilities would be :
Median1,000,000 (MMBTU) x 0.2040 (lbs CH4/MMBTU) = 204,000 lbs CH4
204,000 lbs CH4 ÷ 2,000 (lbs/ton) = 102.0 tons CH4 Perform similar calculations for the other six activities, and then sum across all activities.

CHAPTER 3 – NATURAL GAS AND OIL SYSTEMS 10/20/99
3.5-6 EIIP Volume VIII
capacity. Across the studies, the resulting implied emission factors per unit of energy variedwidely. The estimates were grouped by region, and within each region a range of emissionfactors was selected for the IPCC emissions inventory guidelines. The emission factors used arethe factors developed from studies of the U.S. system. The emission factors can be considered to be no better than "order of magnitude" estimates.Actual emissions depend on site-specific characteristics including facility design, operation, andmaintenance. While these characteristics were considered to various extents in the studies thatformed the basis for the emission factor estimates, the variation in characteristics among systemsthroughout the U.S. implied the need for a range of emission factors (median, low, and high).

EIIP Volume VIII 3.6-1
6
QUALITY ASSURANCE/QUALITY CONTROLQuality assurance (QA) and quality control (QC) are essential elements in producing high qualityemission estimates and should be included in all methods to estimate emissions. QA/QC ofemissions estimates are accomplished through a set of procedures that ensure the quality andreliability of data collection and processing. These procedures include the use of appropriateemission estimation methods, reasonable assumptions, data reliability checks, and accuracy/logicchecks of calculations. Volume VI of this series, Quality Assurance Procedures, describesmethods and tools for performing these procedures.
The ability to estimate emissions from oil and gas systems will be hampered by the general lackof data on the factors that lead to emissions. These systems are very diverse and variable.Emissions cannot be accurately estimated with simple assumptions or rules of thumb.Nevertheless, recent studies indicate that the main types of emissions can be assessed with fairlystraightforward approaches.
The most difficult emissions to estimate will likely be fugitive emissions from distributionsystems. The precision of gas accounting data is typically not adequate to estimate emissionsfrom these sources. Because these emissions can be quite important, specially conductedmeasurement studies using specially designed and operated meters and instruments may berequired. Such studies would improve considerably the basis for estimating emissions from thissource.
Carbon dioxide emissions from fuel used in compressor stations and related equipment forproviding the pressure to transport the fuel over land are not counted in the methodologies in thischapter. These emissions should be counted as part of fossil fuel combustion emissions (Chapter1 of this volume). The recommended data source for Chapter 1—the State Energy Data Report—does count carbon dioxide emissions from compressor stations and related equipment.
In addition, carbon dioxide emissions from certain gas and oil fields could be significant.However, the extent of these emissions has not yet been characterized; additional research wouldbe required to understand and estimate these emissions.

CHAPTER 3 – NATURAL GAS AND OIL SYSTEMS 10/20/99
3.6-2 EIIP Volume VIII
6.1 DATA ATTRIBUTE RANKING SYSTEM (DARS) SCORES
DARS is a system for evaluating the quality of data used in an emission inventory. To develop aDARS score, one must evaluate the reliability of eight components of the emissions estimate.Four of the components are related to the activity level (e.g., the amount of oil or gas produced).The other four components are related to the emission factor (e.g., the amount of methanereleased per unit of oil or gas produced). For both the activity level and the emission factor, thefour attributes evaluated are the measurement method, source specificity, spatial congruity, andtemporal congruity. Each component is scored on a scale of zero to one, where one represents ahigh level of reliability. To derive the DARS score for a given estimation method, the activitylevel score is multiplied by the emission factor score for each of the four attributes, and theresulting products are averaged. The highest possible DARS composite score is one. A completediscussion of DARS may be found in Chapter 4 of Volume VI, Quality Assurance Procedures.
The DARS scores provided here are based on the use of the emission factors provided in thischapter, and activity data from the national-level data sources referenced in the various steps ofthe methodology. If a state uses state data sources for activity data, the state may wish to developa DARS score based on the use of state data.

10/20/99 CHAPTER 3 – NATURAL GAS AND OIL SYSTEMS
EIIP Volume VIII 3.6-3
TABLE 3.6-1
DARS SCORES: CH4 EMISSIONS FROM NATURAL GAS SYSTEMS, PREFERRED APPROACH
DARSAttributeCategory
EmissionFactor
Attribute
Explanation ActivityData
Attribute
Explanation EmissionScore
Measurement 7 The factors were based on measurement ofemissions from a small sample of sources overtypical loads.
9 Data on each activity are based onintermittent measurement.
0.63
SourceSpecificity
10 An emission factor was developed for each ofapproximately 100 components of natural gassystems which were identified as methaneemission sources.
9 The activities measured were identified asmethane emission sources and thus arehighly correlated to emissions.
0.90
SpatialCongruity
8 The factors were developed for the entire U.S.,not for any state. Assuming variability within theU.S. is low to moderate, the score is 8.
9 Activity data are sometimes scaled based onnational ratios of one activity to another;spatial variability is expected to be low.
0.72
TemporalCongruity
8 The emission factors are based on measuredemissions over a period of less than a year.However, temporal variability is expected to below, so the score is 8.
10 States use activity data from a given year toestimate emissions in that year.
0.80
Composite Score 0.76

CHAPTER 3 – NATURAL GAS AND OIL SYSTEMS 10/20/99
3.6-4 EIIP Volume VIII
TABLE 3.6-2
DARS SCORES: CH4 EMISSIONS FROM OIL SYSTEMS, PREFERRED APPROACH
DARSAttributeCategory
EmissionFactor
Attribute
Explanation ActivityData
Attribute
Explanation EmissionScore
Measurement 2 Because emissions are not measured, the highestpossible score is 5. Because of the wide range foreach emission factor, we assigned a score of 2.
10 Data on each activity are based oncontinuous measurement.
0.20
SourceSpecificity
7 An emission factor was developed for eachactivity (e.g., production, refining, anddistribution), but the emission factor aggregatesemissions at a higher level than where they occur.
7 The activities measured (production,transportation, refining, and consumption)are highly correlated to emissions, but areaggregated at a higher level than whereemissions occur.
0.49
SpatialCongruity
8 The factors were developed for the entire U.S.,not for any state. Variability within the U.S. isassumed to be low to moderate.
5 States use state-level activity data toestimate statewide emissions, but these data(e.g., oil refined) are poor proxies for thedesired activity level (e.g., oil stored).
0.40
TemporalCongruity
9 The emission factors are not based on measuredemissions over a particular time frame. However,the emission factors should not vary significantlyover the course of a year, so the score is 9.
10 States use annual activity data to estimateannual emissions.
0.90
Composite Score 0.50

10/20/99 CHAPTER 3 – NATURAL GAS AND OIL SYSTEMS
EIIP Volume VIII 3.6-5
TABLE 3.6-3
DARS SCORES: CH4 EMISSIONS FROM NATURAL GAS SYSTEMS, ALTERNATIVE APPROACH
DARSAttributeCategory
EmissionFactor
Attribute
Explanation ActivityData
Attribute
Explanation EmissionScore
Measurement 2 Because emissions are not measured, the highestpossible score is 5. Because of the wide range foreach emission factor, we assigned a score of 2.
10 Data on each activity are based oncontinuous measurement.
0.20
SourceSpecificity
7 An emission factor was developed for eachactivity, but the emission factor aggregatesemissions at a higher level than where they occur.
7 The activities measured (production,transportation, refining, and consumption)are highly correlated to emissions, but areaggregated at a higher level than whereemissions occur.
0.49
SpatialCongruity
8 The factors were developed for the entire U.S.,not for any state. Variability within the U.S. isassumed to be low to moderate.
5 States use state-level activity data toestimate statewide emissions, but these data(e.g., gas consumed) are poor proxies forthe desired activity level (e.g., gas transitinga state).
0.40
TemporalCongruity
9 The emission factors are not based on measuredemissions over a particular time frame. However,the emission factors should not vary significantlyover the course of a year, so the score is 9.
10 States use annual activity data to estimateannual emissions.
0.90
Composite Score 0.50


EIIP Volume VIII 3.7-1
7
REFERENCESAGA (American Gas Association). 1993. Gas Facts. AGA: Arlington, Virginia.
API (American Petroleum Institute). 1998. Basic Petroleum Data Book. API: Washington, D.C.
EIA (Energy Information Administration/Department of Energy). 1997. Annual Energy Review:1996. Energy Information Administration, U.S. Department of Energy, Washington, DC.July 1997. Internet address: http://www.eia.doe.gov. Also published on EIA’s EnergyInfoDisk CD-ROM—a list of all the information provided on the CD-ROM, and orderinginformation, is available on the Internet at http://www.eia.doe.gov/infodisc.html.
EIA. 1997a. Natural Gas Annual 1996: Volumes 1 & 2, DOE/EIA-0131(92)/1&2, EnergyInformation Administration, U.S. Department of Energy, October 1997.Internet address: http://www.eia.doe.gov/fuelnatgas.html#pannual. Also published onEIA’s Energy InfoDisk CD-ROM—a list of all the information provided on the CD-ROM, and ordering information, is available on the Internet athttp://www.eia.doe.gov/infodisc.html.
Gas Research Institute/ U.S. Environmental Protection Agency (GRI/EPA, 1996). MethaneEmissions from the Natural Gas Industry, June 1996. EPA-600/R-96-080a.
IPCC. 1997. IPCC Guidelines for National Greenhouse Gas Inventories, 3 volumes: Vol. 1,Reporting Instructions; Vol. 2, Workbook; Vol. 3, Draft Reference Manual.Intergovernmental Panel on Climate Change, Organization for Economic Co-Operationand Development. Paris, France. Internet address: http://iea.org/ipcc/general/inus1.htm
U.S. EPA. 1999a. Draft Report. Estimates of Methane Emissions from the U.S. Oil Industry.Office of Air and Radiation. EPA-68-W7-0069.
U.S. EPA. 1999b. Inventory of U.S. Greenhouse Gas Emissions and Sinks: 1990 - 1997. EPA236-R-99-003. Internet address: http://www.epa.gov/globalwarming/inventory/1999-inv.html.
U.S. EPA. 1998. Inventory of U.S. Greenhouse Gas Emissions and Sinks: 1990 - 1996. EPA 236-R-98-006. Internet address: http://www.epa.gov/globalwarming/inventory/1998-inv.html.