
M E M O R A N D U M - Eugene Water & Electric Board(ETRM) system, Allegro. Risk staff monitor...
37
1 M E M O R A N D U M EUGENE WATER & ELECTRIC BOARD TO: Commissioners Helgeson, Brown, Mital, Simpson, and Carlson FROM: Erin Erben, Chief Customer Officer; Greg Brownell, Portfolio Management Supervisor; Jonathan Hart, Power Trader DATE: April 21, 2017 SUBJECT: 2017 Power Market and Budget Hedging Update OBJECTIVE: Information Only Issue The purpose of this backgrounder is to provide an annual update of wholesale power markets. Background The Pricing and Portfolio Management department, along with Power Operations, manages EWEB power supply and wholesale market activities consistent with utility financial objectives, in accordance with Board Policy contained in SD8, and as further described in the EWEB Energy Risk Management Procedures.
Transcript of M E M O R A N D U M - Eugene Water & Electric Board(ETRM) system, Allegro. Risk staff monitor...

1
M E M O R A N D U M
EUGENE WATER & ELECTRIC BOARD
TO: Commissioners Helgeson, Brown, Mital, Simpson, and Carlson
FROM: Erin Erben, Chief Customer Officer; Greg Brownell, Portfolio Management Supervisor;
Jonathan Hart, Power Trader
DATE: April 21, 2017
SUBJECT: 2017 Power Market and Budget Hedging Update
OBJECTIVE: Information Only Issue The purpose of this backgrounder is to provide an annual update of wholesale power markets. Background The Pricing and Portfolio Management department, along with Power Operations, manages EWEB power supply and wholesale market activities consistent with utility financial objectives, in accordance with Board Policy contained in SD8, and as further described in the EWEB Energy Risk Management Procedures.

2
Discussion Market Price Update Wholesale energy markets can generally be described as either near term spot markets or long term forward futures markets. For spot markets, prices are impacted by near term weather (temperature and precipitation) and operational phenomena (generator, transmission), where long term markets are more likely impacted by forecasted structural changes in resource abundance and consumer demand. For 2017, northwest spot markets price are among the lowest seen in decades. Several factors are contributing to these historic prices. First off, the Columbia River Basin is expected to receive 132% of its normal water supply for the season (Oct-Sep). This ranks the water year 6th out of the last 57 years tracked by NOAA1. Secondly, export pricing to California has been soft given the state’s remarkable drought recovery2 and aggressive schedule of renewables development3. Finally, natural gas prices remain low and were near 20 year lows in 20164. 2017 natural gas prices are expected to be higher than 20165, which could boost energy market values, but overall the region is awash low value energy. While daily average spot prices are declining, we are starting to see increased volatility in intraday prices. This volatility appears to coincide with increases in California solar build outs which have a tendency to stress system capacity during shoulder periods6. This change in diurnal pricing pattern (illustrated below) is now appearing in northwest markets. While the solar build outs push down prices overall they generally yield additional value to flexible resources such Carmen Smith.
1 https://www.nwrfc.noaa.gov/water_supply/ws_ranking.cgi?id=TDAO3&per=OCT-SEP 2 https://www.eia.gov/todayinenergy/detail.php?id=30452 3 http://www.energy.ca.gov/renewables/tracking_progress/documents/renewable.pdf 4 https://www.eia.gov/todayinenergy/detail.php?id=29552 5 https://www.eia.gov/todayinenergy/detail.php?id=29632 6 https://www.eia.gov/todayinenergy/detail.php?id=30692
Figure 1: Example day of real time price volatility with historical comparators

3
The trends, noted above, impact the forward northwest energy futures markets, as well as the spot markets previously discussed. The futures markets continue to fall relative to historical periods. This pattern is driven largely by continued expectations for low price natural gas and increases in renewable development (wind/solar) created by the renewable legislations (“RPS”). The chart below shows forward curves over time and spot market prices. A forward curve reflects prices for future periods in tradable markets. The first line reflects forward curve was taken at the end of 2007. Trades executed during this time would likely reflect this sort of pricing. The subsequent lines reflects changing forward curves for each year after that. Figure 2: Historical forward curves and spot prices

4
Surplus Position Hedging Update The chart below shows EWEB’s surplus market position for 2017-2021 based on the budget hydro assumption of 90% of expected hydro conditions. The top of the chart indicates EWEB’s original surplus market position. The red band represents unhedged energy surplus. The black line reflects the desired volume of hedging the RMC would like to achieve over time. EWEB hedges a portion of its surplus position up to five years in advance. This provides two benefits: 1) it reduces financial exposure related to market prices; and 2) it results in sales executed at various times which diversifies the sales price by “dollar cost averaging” through time. This strategy results in near term years being fully hedged while year five is the least hedged, with interim years somewhere in between. Beyond five years Power Operations does not hedge any surplus energy. The value of all current executed hedges for forward periods is approximately $12M of forward value when compared to today’s market. Said another way, EWEB has benefited by an estimated $12M compared to not hedging for the period from today through 2021.
Requested Board Action - None

1
M E M O R A N D U M
EUGENE WATER & ELECTRIC BOARD
TO: Commissioners Helgeson, Brown, Mital, Simpson, and Carlson
FROM: Sue Fahey, Chief Financial Officer; Deborah Hart, Fiscal Services Supervisor
Anna Wade, Lead Financial Analyst
DATE: April 21, 2017
SUBJECT: Annual Report on Power Trading Compliance
OBJECTIVE: Information Only
Issue
Board Policy SD8, governing Power Risk Management, requires the Chief Financial Officer to
present a report to the Board at least annually that covers trading and contracting compliance. This
backgrounder provides that information for calendar year 2016.
Background
Oregon statutes stipulate the appropriate scope for a governmental agency’s investment of “surplus
funds.” Accordingly, EWEB’s activities in the power markets must be associated with the
provision of electricity to meet anticipated sales and generation forecasts. Board Policy SD8 was
developed to provide oversight control and guidance to the power trading operations, in order to
protect the utility from financial instability and unacceptable risk.
Discussion
The following discussion is framed around the specific responsibilities of the Risk Management
Committee (RMC) which are codified in the SD8 policy. A detailed itemization of instances in
which compliance was maintained through exception is provided herein.
SD8.1 – Anti-speculation Statutes: In Compliance
To comply with anti-speculation statutes, SD8 requires managing its average megawatt market
positions so that exposure to prices is limited. Occasionally, changes to forecasts, load and/or
generation result in position limits being exceeded. In those events, the Power Risk Management
Procedures require positions to be brought back into compliance no later than the next trading day
unless preapproved by the Chief Financial Officer and Power Operations Manager. EWEB was
in compliance with this procedure in 2016.

2
SD8.2 – Development of Detailed Control Procedures: In Compliance
SD8 requires that the RMC develop detailed procedures and review them on an ongoing basis.
Within these procedures, processes are defined which govern roles and responsibilities, daily trade
activity, and exception authorization.
SD8.3 – Notification of changes to compliance limits: In Compliance
The RMC reviews compliance metrics on at least a monthly basis. No changes to compliance
limits were recommended or approved by the RMC during the 2016 calendar year.
SD8.4 – Oversee control infrastructure and monitor compliance: In Compliance
Much of EWEB’s control infrastructure is embedded in the Energy Trading and Risk Management
(ETRM) system, Allegro. Risk staff monitor transaction activity through a variety of automated
alerts and reports. Additionally, market compliance is monitored through advanced spreadsheet
modeling which is regularly monitored by risk staff and reviewed by the RMC. Access to this
model is restricted to approved staff members only.
SD8.5 – Authorize and monitor risk reports for financial results, market positions and credit
exposure: In Compliance
The RMC met in each month of 2016 with the exception of September. In that instance, voting
members received up to date compliance reporting materials in lieu of meeting. These materials
provide the basis for monitoring financial results and compliance with market position limits and
credit.
SD8.6 – Review and approve contracts which impact EWEB’s power portfolio: In Compliance
The RMC provides cross-functional oversight and review of any contracts that may have an impact
on EWEB’s portfolio to ensure that the Board mandate of risk mitigation and financial stability
are maintained. Where contracts demand the higher authority of the Board, the RMC provides
direction and preliminary review in advance of Board action.
2016 RMC Actions
In addition to reviewing compliance on a monthly basis, the following actions were taken by the
RMC in 2016:
A June power trade created an out of compliance position. This transaction was supported
and approved jointly by the Power Operations Manager and the Chief Financial Officer.
In this instance, expected length was considerable enough to warrant temporary exception
while the calculation of firm was analyzed in light of water year conditions.
In March and October of 2016, the RMC reviewed and authorized a temporary approval
strategy to accommodate the reorganization taking place in the utility.
Chief Engineering and Operations Officer was added to the RMC voting membership by
unanimous support.
Mid-term trade authority was authorized on an exception basis to a Short-term trader.
Authority was provided by the Power Operations Manager and reported to the RMC.
Credit authority was granted by exception on three occasions; once for credit over-run on
a broker executed trade and twice for tenor where transaction duration exceeded standing
credit policy. These exceptions were authorized jointly by the Power Operations Manager
and the Chief Financial Officer as required by the Risk Management Procedures.
3
RMC reviewed and approved the SD8 redraft for Board consideration and approval.
An amendment to the Seneca Power Purchase Agreement was reviewed and approved by
the RMC.
The RMC directed staff to update the Risk Management Procedures to reflect the Board
approved edits of SD8, and the restructure of Executive Management and reorganization
of relevant business units. This work was reviewed on multiple occasions throughout 2016
(Subsequently, in February of 2017, a new draft of the procedures was approved by the
RMC).
Recommendation and Requested Board Action
This item is information only and no Board action is being requested at this time.

Capital "EL1" Report: Electric, 2017 -Q1Type 1 - General Capital
Capital Category Budget YTD ActualYear-End
Projection
Electric Infrastructure - Generation $1,196,000 (Note 2) $112,346 $1,200,000
Electric Infrastructure - Substations $1,741,000 $227,868 $1,741,000
Electric Infrastructure - Telecom $600,000 $2,141 $600,000
Electric Infrastructure - Transmission &
Distribution$6,754,000 $1,561,728 (1) $6,345,000
Project Budget YTD ActualYear-End
Projection
Initial
Plan
To-Date
Actual
Project-End
ProjectionStart
Initial
Planned
Completion
Projected
Completion
Leaburg Dam Roll Gate Hoists $0 $29,221 $700,000 $5,150,000 $6,318,582 $7,000,000 Jul-2012 Nov-2014 Apr-2017All three hoist systems released for full automatic operation in Q1. Final payments to contractors pending punch
list completion, expected by the end of Q2 2017. Potential repair of worn gate teeth under design for Fall
implementation. Monitoring overall capital budget to determine if amendment necessary. ZINNIKER
Upriver Re-Configuration/Holden Ck. Substation $4,582,000 (Note 2) $967,234 $4,457,000 $3,000,000 $1,550,073 $5,800,000 Jan-2014 Oct-2015 Feb-2018
Major procurement contracts have been completed. Transformers have been delivered, switchgear is scheduled
for delivery in September 2017. Other major components (steel structures, bus, instrument transformers, etc.)
have been ordered and are relatively short lead times. The construction contract has been awarded and the
contractor is currently developing a detailed schedule and planning submittals. FERC has communicated that
there are no major concerns and that the construction has been approved, however final documents are in
process. Lane County Permitting Design meeting has been completed and questions from Lane County are being
addressed; final permit will follow and not expected to hold schedule. Technical review of the 115kV
interconnection is in process, and EWEB is awaiting BPA's final schedule and comment. The substation
construction is expected to be complete in late October 2017, with EWEB crews finishing final wiring, testing and
commissioning through January 2018. - NICE
Downtown Distribution Network $1,600,000 (Note 2) $15,086 $1,026,000 $15,000,000 $266,570 $20,000,000 Sep-2010 Dec-2015 Dec-2019
Downtown Network protector replacements to occur at Lane County Building, Jail, US Bank and Hult Center and
are scheduled for completion spread May through December in series. Engineering is currently in planning phase
for remaining work developing preliminary design, scope, schedule and budget for priority of cable replacements,
system modeling and configuration and comm. upgrades. - NICE
Grid Edge Demonstration Project $837,000 (Note 2) $11,591 $837,000 $1,200,000 $143,455 $1,157,000 May-2016 Jun-2017 Mar-2017
Design build RFP advertisement scheduled to be completed mid June with award in July to winning manufacturer
and integrator. Procurement and delivery of materials scheduled by year end with installation and
commissioning planned for Q1 of 2018. Totals do not include $262k of grant funding which will be reimbursed at
major milestones and completion. - NICE
Project Budget YTD ActualYear-End
Projection
Initial
Plan
To-Date
Actual
Project-End
ProjectionStart
Initial
Planned
Completion
Projected
Completion
Carmen Smith License Implementation $11,700,000 $753,665 $11,600,000 $135,000,000 $38,614,821 $129,500,000 May-2009 Dec-2021 Dec-2025
The Project End Projected has been updated to reflect the 2016 Settlement Agreement that has been filed with the
FERC. A Technical Conference was held in March 2017 to discuss the licensing process and changes to the Settlement
Agreement. Staff is updating the remaining FERC exhibits and the Biological Assessment in support of the regulatory
process. We expect the license to be issued no earlier than 2018. Implementation of 5-year plan to address aging
infrastructure at Carmen Powerhouse underway. Gantry crane rehab complete. Preparations for turbine shutoff
valve replacement nearing completion. Carmen Powerhouse outage scheduled to start in June with intent to
complete by the end of October (ZINNIKER, BOYLE)
Total Electric Capital (Excluding Shared Services) $29,010,000 $3,669,289 $28,506,000 98%
Note(s)
2. Budget amounts are adjusted to reflect changes presented and approved by the Board on April 4, 2017 (April True Up)
Status/Comments
Implementation of capital work will begin in Q2 during the planned outages at IP in
April/May and Walterville in June. Seismic early warning system installations
underway at Leaburg and Carmen-Smith. Debris management improvements at
Leaburg Lake and Smith Reservoir timed for late 2017. - ZINNIKER
Type 1 Projects currently tracking on planned schedule. Bertelsen 115kV breaker and
swich replacement outage planned for mid May-July. Remainder of R&R projects are
short duration and do not require extended substation outages (comm upgrades, 15kV
Breaker replacements, battery replacements, etc.). - NICE
Budget on track. - Fraser
These categories match the Capital Improvement Plans (CIPs) submitted by Water & Electric.
Type 1 - General Capital is budgeted Year-by-Year for recurring capital expenditures from January
through December. Type 1 Capital includes categorized collections of projects of less than $1 million.
Typical examples include "pole replacements" as part of Transmission & Distribution. This work
typically involves many small projects that up to $1.2-$1.7 million per year.
Type 2 projects have "discrete" scopes, schedules (launch through completion), and cost over $1MM
during the project life.
Type 3 - Strategic Projects & Programs 2017 thru Q1 Project Total Schedule
2017 thru Q1 Note - Changes from previous report(s) are in BOLD
Type 2 Rehabilitation & Expansion Projects 2017 thru Q1 Project Total Schedule
Management Notes: The Electric Capital Budget expenditure rate is lower than actual to date (13% vs. 25%), Type I expenditures predicted year end is at100% of budget vs. actual., with about 20% spent through Q1. Type II spending
ended at 16% of Q1 spending, and projected expenditures year end at 98%. Holden Creek Substaiton project is slated to complete in 2017 and Downtown Network projects are lined up for this year. Carmen Smith spending is
lagging for the year but expenditures will pick up sharply in Q2 and Q3 due to work being conducted by our engineering consultant and turbine shut off valve installation. The total project-end cost for Carmen has not yet been
adjusted downward to account for potential re-negotions of settlement agreement. That will be reflected in the 2018 CIP to be presented to the Board in July 2017. Year end results of total expenditures vs. budget is at 98%
excluding Shared Services. The Budget figures do not reflect the April True-up Budget Adjustments.
1. Distribution transformers and network protectors are being capitalized when received in inventory, therefore some projects in T&D and Downtown network are understated.
Status/Comments
Status/Comments
Crews have begun installing fiber conduit for the Downtown Network. City of Eugene
still awaiting Economic Development Grant that may slow the project schedule.
(Damewood)
\\ewebnetwork.net\data\TEAM\Board\Consent Forms\2017\05-02-17\corr-EL1-Electric-Q1-2017

Capital "EL1" Report: Water, 2017 -Q1
Type 1 - General Capital
Project Budget YTD ActualYear-End
Projection
Source - Water Intakes & Filtration Plant $1,030,000 $226,000 $1,030,000
Mains - Replacements, Improvements, & Trans. $4,378,000 $880,000 $4,378,000
Services and Meters $1,803,000 $437,000 $1,803,000
Pump Stations $1,236,000 $120,000 $1,236,000
Reservoirs $103,000 $0 $103,000
Project Budget YTD ActualYear-End
Projection
Initial
Plan
To-Date
Actual
Project-End
ProjectionStart
Initial
Planned
Completion
Projected
Completion
Hayden Bridge Disinfection System Replacement $700,000 $4,000 $700,000 $3,645,000 $4,000 $3,880,000 2017 YE-2018 YE-2018Replacement of gas chlorine system with on-site liquid hypochlorite system. Project currently in design. (Initial
Plan - 2015 CIP)
Hayden Bridge Seismic Upgrades $515,000 $0 $515,000 $1,215,529 $1,117,067 $1,740,000 2014 YE-2015 Q1-2018Phase 1 (Basins and Filters) is complete. Phase 2 (Headhouse) deferred to 2017-2018. Phase 1 costs more
expensive than anticipated. (Initial Plan - 2013 CIP)
Distribution System Scada/PLC Upgrades $412,000 $57,000 $412,000 $3,079,780 $538,109 $1,520,000 2013 YE-2016 YE-2019Multi-Year upgrade project. Completed Crest System. Currently working on Shasta, Dillard, and Willamette
systems. Project complexities and staffing limitations are affecting schedule (Initial Plan 2013 CIP)
Hayden Bridge Standby Power Improvements $1,030,000 $8,000 $1,030,000 $1,728,000 $34,666 $1,060,000 2015 YE-2017 Q1-2018Currently in design phase. Will be prepurchaseing two generators, one for Hayden Bridge Plant and one for
Intakes. Construction and electrical work anticipated this fall. (Initial Plan - 2015 CIP)
Hawkins Reservoir Improvements $300,000 $3,000 $350,000 $2,067,000 $3,000 $2,340,000 2014 YE-2018 Q2-2019Results of upcoming structural evaluations may increase scope. Any scope increase should by known by second
quarter EL-1 report. (Initial Plan 2016 CIP)
Project Budget YTD ActualYear-End
Projection
Initial
Plan
To-Date
Actual
Project-End
ProjectionStart
Initial
Planned
Completion
Projected
Completion
Second Source of Supply $1,830,000 $128,000 $1,700,000
Varied from
$52M to
$120M
$1,008,000 $67,000,0002014 with
PlanningYE-2021 YE-2021
Property purchase for plant will occur in 2017. Currently completing preliminary design for Filtration Plant and
Related Facilities. Yellow due to pending questions on project direction.
Total Water Capital (Excluding Shared Services) $13,337,000 $1,863,000 $13,257,000 99% year end projection to budget
2017
Status/Comments
Largest item is solids improvement project. Also included are costs for treatment trailer
equipment, a SCADA/Historian upgrade and close out work for the South Filter Upgrade.
These categories will match the Capital Improvement Plans (CIPs) submitted by Water & Electric.
Type 1 - General Capital is budgeted Year-by-Year for recurring capital expenditures from January through
December. Typical Type 1 Capital includes categorized collections of projects of less than $1 million.
Typical examples include "main replacements" . This work typically involves dozens of jobs that add up to $3-$3.5
million per year.
Largest componenet in this area is main replacements. This item is tracking well so far at 24%
of budget spent. Cost reporting does lag however, so we will be watching this number closely
Includes both new services and meters as well as replacement of existing service lines
Work this year includes Upgrades at Santa Clara and Laurel Hill Pump Stations, a new
Crenshaw Pump Station (reimbursable) and work on a new City View 1150 Pump Station.
2017 work includes new hatch/vent and ladder at Crest 800 Reservoir
Status/Comments
Management Notes: Overall Water’s Type 1 projects are tracking well. Our largest item in this area, Main Replacements is at approximately 24% of budget spent. Costs do lag in the reporting system however, so we will need to watch this area closely. On the Water Type 2
projects, we are tracking low in the first quarter. This year is different than last in that in 2016 there were numerous large construction projects occurring over the entire year. The first part of this year numerous projects are in the design phase hence the low year to date
actual. Spending will increase significantly later in the year as construction begins on several projects. Overall, water has $13,337,000 budgeted for capital in 2017 (adjusted for the April True-Up) and anticipates spending that amount. Engineering’s target is attain at least 90%
expenditures of the capital budget amounts.
Type 2 Rehabilitation & Expansion Projects 2017 Project Total Schedule
Type 3 - Strategic Projects & Programs 2017 Project Total Schedule
Status/Comments
\\ewebnetwork.net\data\TEAM\Board\Consent Forms\2017\05-02-17\Word\corr-EL1-water-Q1-2017

Capital "EL1" Report: Shared Services, 2016-Q4
Type 1 - General Capital
Capital Category Budget YTD ActualYear-End Projection
General Plant - Information Technology (I.T.) $685,000 $405,402 $650,000
General Plant - Buildings & Land Management $2,622,000 $14,437 $1,754,000
General Plant - Electric& Water Fleet Capital $610,000 $150,000 $610,000
Project Budget YTD ActualYear-End Projection Initial
Plan
To-Date
ActualProject-End Projection Start
Initial
Planned
Completion
Projected
Completion
AMI Information Technology & Integration $1,930,000 $225,357 $1,930,000 $6,475,700 $3,283,044 $6,475,700 May-2015 Dec-2017 May-2018
Budget $ shifted from 2016 to 2017 . Capital portion of AMI project is
expected to close out mid-2017, approx. 9 months ahead of initial
projected end date. Total capital spending is anticipated to be at/near
initial target of $6.5m. Project shifting to operations for implementation.
(Damewood/Armstead)
Customer Information System (CIS) Replacement $1,500,000 $0 $1,080,000 $9.7M $0 $9.7M Sep-2016 Aug-2018mid to late-
2019Conditional Intent to Award letter sent to selected vendor. Contract
negotiations expected to begin in Q2 and conclude in Q3. (Barton)
$7,347,000 $795,196 $6,024,000 81.99%Note(s)
Total Shared Services Capital (This Report)1) April 2017 true-up budget numbers are reflected as Budget, as approved by Board on April 4, 2017.
Management Notes: Type I IT Projects are on track and on schedule. This is good news since in the past these projects have lagged for various reasons. As per the April True Up, Fleet Capital
was reduced significantly due to a re-assessment of future fleet needs and strategy. AMI is progressing forward in current Opt In Strategy. Projected spending is in the 82% range for end of
year, largely driven by the cancelation of HQ Fire Alarm System Upgrade and the shift to O&M from Capital by Facilities.
Type 2 Rehabilitation & Expansion Projects 2017 - Q1 Project Total Schedule
Status/Comments
2017- Q1 Note - Changes from previous report(s) are in BOLD
Status/Comments
In the future, these categories will match the Capital
Improvement Plans (CIPs) submitted by Water & Electric.
Type 1 - General Capital is budgeted Year-by-Year for recurring
capital expenditures from January through December. Type 1
Capital includes categorized collections of projects of less than $1
million. Typical examples include "pole replacements" as part of
Transmission & Distribution. This work typically involves many
small projects that add up to $1.2-$1.7 million per year.
Type 2 projects have "discrete" scopes, schedules (launch
through completion), and cost over $1MM during the project life.
Emergency SAN Replacement Complete. Capital replacement of aging infrastructure expected throughout the
year. (Barton)
Elevator Contracts approved by Board in Feb 2017 Contract for elevator upgrade has been issued to Kone and
work is currently being scheduled. Upgrade of HQ Fire Alarm System has been cancelled and more focus on
O&M projects for Buildings and Land. Purchase of Weyco Included. (Morgenstern)
Fleet recently rolled back in April True up - due to changes in strategy of fleet. ($500,000 for Electric,
$110,000 for Water) (Taylor)

M E M O R A N D U M
EUGENE WATER & ELECTRIC BOARD
TO: Commissioners Helgeson, Brown, Mital, Simpson and Carlson
FROM: Sue Fahey, Chief Financial Officer; Aaron Balmer, Interim General Accounting
Supervisor
DATE: April 21, 2017
SUBJECT: First Quarter 2017 Financial Report
OBJECTIVE: Information Only Issue This memo provides a summary of operating results for the first quarter of 2017. Background This information is provided to the Board on a quarterly basis to report the ongoing financial performance of both utilities. Recommendation / Requested Board Action None at this time. Information only. Attachment 1: Electric Utility Financial Report Attachment 2: Water Utility Financial Report

M E M O R A N D U M
EUGENE WATER & ELECTRIC BOARD
TO: Commissioners Helgeson, Brown, Mital, Simpson and Carlson
FROM: Sue Fahey, Chief Financial Officer; Aaron Balmer, Interim General Accounting
Supervisor
DATE: April 21, 2017
SUBJECT: Electric Utility First Quarter 2017 Financial Report
OBJECTIVE: Information Only Schedule of Revenues, Expenses, and Changes in Net Position (Income Statement)‐Page 3 Income before capital contributions (Net Income) Net income for the Electric Utility is $12.7 million. The variance of Net Income to the Year-to-Date (YTD) seasonally shaped budget is a favorable $3.5 million. The variance breakdown compared to budget is as follows (unfavorable)/favorable: Millions
Retail Revenue $ 2.0 Wholesale and Other revenue 3.5 Purchased Power (2.0) Non-power Operating Expenses (0.3) Other Non-operating revenues 0.1 Other Non-operating expenses 0.2
$ 3.5
For comparability purposes, the budget has been modified to reflect seasonal fluctuations in revenue and purchased power. The favorable net income variance to budget is primarily driven by colder than anticipated weather in the first quarter leading to favorable revenue. Further, wholesale sales net of purchased power costs are $1.5 million favorable due to higher than budgeted streamflow and hydroelectric generation.
$0
$5,000,000
$10,000,000
$15,000,000
Jan Feb Mar
(Year-to-date)
Electric System Net Income
2016 2017 2017 Budget
Page 1
EW1510
Typewritten Text
ATTACHMENT 1

Operating Expenses Wheeling has an unfavorable variance due to higher than budgeted hydroelectric generation. Customer accounting and administrative and general expenses are unfavorable compared to the budget due to lower capital spending in the first quarter and lower overhead credit transfers from O&M to capital. This should correct over time as actual capital spending increases in the summer months. Conservation expenses are favorable due to low seasonal spending for energy management services. At this time, actual spending is anticipated to equal budget by year end. Non-operating Revenues Investment earnings has a favorable variance due to a $519,000 non-cash gain marking financial investments (derivatives) to market each quarter as required by generally accepted accounting principles (GAAP) . There is no budget for the change in the market value for these investments.
Page 2

Annual Working2017 2016 Budget Budget $ Budget % Budget Variance
Residential $ 33,848,518 $ 28,711,140 $ 101,465,141 $ 31,708,0001
107% $ 2,141,000Commercial and industrial 25,390,192 24,803,195 101,684,339 25,472,000 1 100% (82,000)Sale for resale and other 12,241,232 11,014,902 33,670,893 8,725,000 1 140% 3,516,000
Operating revenues 71,479,942 64,529,237 236,820,373 65,905,000 108% 5,575,000
Purchased power 30,287,327 28,598,486 112,087,636 28,246,0002
107% (2,041,000)System control 1,314,929 1,436,095 5,613,030 1,403,000 94% 88,000Wheeling 3,993,492 2,699,462 13,429,919 3,357,000 119% (636,000)Generation 2,823,846 2,859,597 12,465,418 3,116,000 91% 292,000Transmission and distribution 5,147,311 4,977,496 22,185,813 5,546,000 93% 399,000Customer accounting 2,635,405 1,996,654 7,948,667 1,987,000 133% (648,000)Conservation expenses 936,772 767,986 5,068,774 1,267,000 74% 330,000Administrative and general 5,752,498 4,715,500 22,302,313 5,576,000 103% (176,000)Depreciation on utility plant 5,613,778 6,001,081 22,519,481 5,630,000 100% 16,000
Operating expenses 58,505,358 54,052,357 223,621,051 56,128,000 104% (2,376,000)
Net Operating Income 12,974,584 10,476,880 13,199,322 9,777,000 133% 3,199,000
Investment earnings 1,029,353 1,847,772 2,028,478 507,000 203% 522,000Interest earnings, Water 185,443 276,476 737,405 184,000 101% 1,000Other non-operating revenue 425,099 510,656 3,325,150 831,000 51% (406,000)
Non-operating Revenues 1,639,895 2,634,904 6,091,033 1,522,000 108% 117,000
Other expenses 187,843 168,755 2,025,935 506,000 37% 318,000Interest expense and related amortization 1,751,292 2,559,539 6,518,767 1,630,000 107% (121,000)
Other Non-operating Expenses 1,939,135 2,728,294 8,544,702 2,136,000 91% 197,000
Income before capital contributions 12,675,344 10,383,490 10,745,653 9,163,000 138% 3,512,000
Contributions in aid of construction 2,173,065 1,969,713 4,877,000 1,219,000 178% 954,000Contributed plant assets 846,927 390,476 - - 847,000
Increase in Net Position $ 15,695,336 $ 12,743,679 $ 15,622,653 $ 10,382,000 151% $ 5,313,000
Notes to the Financial Statements:1 Seasonal budget figure based on PPM forecast used for budgeting.2 Seasonal budget figure based on cyclical account activity averaged from the past four years.Unmarked seasonal budget figures are not shaped and are allocated using a straight-line methodBudget variance column may not add up due to rounding.
YTD Budget ComparisonPrior Year Comparison
Eugene Water & Electric Board
Schedule of Revenues, Expenses, and Changes in Net Position for the three months ended March 31, 2017
Electric Utility
Page 3

December2017 2016 2016
AssetsCapital assets
Utility plant in service $ 738,018,957 $ 747,066,811 $ 741,377,401 Less - Accumulated depreciation (407,976,223) (399,124,447) (403,327,971)
Net utility plant in service 330,042,734 347,942,364 338,049,430
Property held for future use 827,449 827,449 827,449 Construction work in progress 18,912,567 14,998,860 11,489,223
Net utility plant 349,782,750 363,768,673 350,366,102
Current assetsCash and cash equivalents 17,556,941 10,845,400 6,423,227 Short-term investments 23,362,612 31,558,094 19,149,761 Restricted cash and investments 28,593,556 41,883,567 27,424,546 Designated cash and investments 105,463,177 95,087,949 52,930,042 Receivables, less allowances 30,401,138 29,310,411 35,212,662 Due from Water System 779,674 796,702 870,656 Materials and supplies, at average cost 3,848,060 4,163,309 3,675,617 Prepaids 6,566,250 6,793,218 7,483,244
Total current assets 216,571,408 220,438,650 153,169,755
Non-current assetsLong-term receivable, conservation and other 3,590,787 5,167,109 3,453,706 Due from Water System 16,456,494 17,097,428 16,612,001 Long-term investments - - 59,198,524 Investment in WGA 3,455,752 2,786,808 3,509,388 Investment in Harvest Wind 23,362,662 24,667,199 23,730,662 Nonutility Property 7,830,500 7,830,481 7,830,500 Other assets 61,897,290 62,764,395 61,900,158
Total non-current assets 116,593,485 120,313,420 176,234,939
Deferred OutflowsDeferred outflows of resources 57,468,069 8,800,891 57,024,020
Total Assets and Deferred Outflows $ 740,415,712 $ 713,321,634 $ 736,794,816
LiabilitiesCurrent liabilities
Payables $ 15,639,721 $ 16,310,741 $ 26,292,077 Accrued payroll and benefits 4,821,847 4,897,259 4,754,554 Accrued interest on long-term debt 1,297,526 1,846,634 2,868,599 Long-term debt due within one year 11,165,000 13,510,000 11,165,000
Total current liabilities 32,924,094 36,564,634 45,080,230
Non-current liabilitiesLong-term debt 199,728,734 232,554,363 200,279,317 Net pension liability 86,824,424 37,311,057 86,824,424 Other liabilities 10,742,067 9,957,489 9,996,306
Total liabilities 330,219,319 316,387,543 342,180,277
Deferred InflowsDeferred Inflows of resources 7,180,440 11,792,631 7,293,921
Net PositionNet investment in capital assets 177,834,451 167,850,483 178,261,000 Restricted 16,699,690 20,972,253 13,282,845 Unrestricted 208,481,812 196,318,724 195,776,773
Total net position 403,015,953 385,141,460 387,320,618
Total Liabilities, Deferred Inflows,and Net Position $ 740,415,712 $ 713,321,634 $ 736,794,816
Eugene Water & Electric Board Electric Utility
Statement of Net Position March 31, 2017 and 2016
Page 4

Eugene Water & Electric BoardElectric Utility
Capital Budget Comparisonfor the three months ended March 31, 2017
AnnualWorking
Current Month Year to Date
Budget w/Amendment
% of Budget
Transformers (Pre-capped) 1 $ 103,805 359,771$ -$ 0.0%
Meters (Pre-capped) 1 10,585 97,289 - 0.0%Type 1 Capital
Building & Land 13,155 13,542 1,074,000 1.3%Distribution 755,984 1,550,388 8,870,000 17.5%Electric Fleet 45,269 58,181 1,000,000 5.8%Generation 63,148 112,345 1,196,000 9.4%Information Technology 322,660 405,702 494,000 82.1%Substation 127,698 227,867 1,741,000 13.1%Telecom 2,140 2,140 1,100,000 0.2%Transmission 4,867 11,330 150,000 7.6%
Total Type 1 Capital 1,334,921 2,381,495 15,625,000 15.2%
Type 2 Capital
AMI 1 86,969 (110,787) 982,000 -11.3%CIS - - 4,920,000 0.0%Downtown Network 13,978 15,086 1,000,000 1.5%Holden Creek Substation 951,202 967,234 - 0.0%Leaburg Dam Rollgate #2 4,544 29,221 - 0.0%LTD West Side EMX 109 (6,007) - 0.0%Up River Re-configuration - - 250,000 0.0%
Total Type 2 Capital 1,056,802 894,747 7,152,000 12.5%
Type 3 CapitalCarmen-Smith Relicensing 383,998 753,664 12,960,000 5.8%
Total Type 3 Capital 383,998 753,664 12,960,000 5.8%
Total Capital before CIA 2,890,111 4,486,966 35,737,000 12.6%
Contributions in aid (115,427) (2,173,065) (4,877,000) 44.6%
Grand Total $ 2,774,684 2,313,901 $ 30,860,000 7.5%
1
CapitalThe capital budget is approved by the Board as the maximum amount allowed for all capital work. Annual budgets by type and by individual projects are prepared for planning and reporting purposes, but overall budget accountability to the Board remains at the total capital level. The Electric Utility has spent $4.5 million or 12.6% of the capital budget, compared to $4 million or 9.8% in year to date 2016.
Meters and transformers are capitalized at the time of purchase. The budget for meters is included within the Distribution project and the AMI project. However, the actual costs are not included in project reporting in WAM and are included as their own line item.
Page 5

YTD December Performance 2017 Status 2016 Standard
Current Ratio 6.58 3.40 ≥ 3.25
Debt as % of Net Book Value 64% 63% ≤ 60%
Debt Service Coverage - Annualized 2.35 1.65 ≥ 1.75
Age of System - Overall 55% 54% ≤ 60%
Distribution Plant 62%Electric Generating Plant 55%
Days Unrestricted Cash 262 136 90 to 149 days
Rate of Return - Annualized 5% 5% Range 5-7%
See next page for Ratio definitions and benchmark sources
Ratios
The current ratio, a measure of current assets compared to current liabilities, remains well above Board targets due to balances in restricted and designated cash remaining classified as short term. A portion of these balances is reclassified annually in December to long term investments for external reporting. Securities held by the Board are highly marketable and could be liquidated if a need arose. Debt as a % of Net Book Value measures the overall leverage of system assets. Debt levels of the Electric Utility continue to be monitored and management will be recommending additional restructuring in 2017. The annualized debt service coverage ratio is above performance standards at 2.35. The debt service coverage ratio as of December 2016 was below the performance standard due largely to December storm costs and the Carmen-Smith write-off. At the end of March, all other ratios are performing in line or better than the performance standards.
Electric Utility Financial Ratios March 31, 2017
Page 6

Current Ratio
Debt as % of Net Book Value (NBV)
Debt Service Coverage
Age of System
Days Unrestricted Cash
Rate of ReturnRate of return on investment, expressed as a percentage of the total amount invested in infrastructure. For mid-year calculations, year-to-date net operating income is annualized. This ratio measures the utility's ability to pay current infrastructure costs and future replacement costs. Per the APPA, a rate of return between 5-7% is an acceptable range.
Total current assets to total current liabilities. This ratio measures the utility's short-term liquidity (ability to pay bills). The standard is set by EWEB financial policies and is meant to support a higher than average credit rating.
Ratio of the amount of debt outstanding against the remaining Net Book Value of assets. This metric measures overall leverage of the system in an effort to align debt service payments with the useful lives of assets. The performance standard of 60% is derived from APPA publications and is typical of electric utilities involved in both generation and distribution.
Ratio of annualized net revenues available for debt service to total long-term debt service for the year. This ratio measures the utility's ability to meet its annual long-term debt obligation. The standard is meant to support a single A credit rating.
Ratio of accumulated depreciation against the historical value of assets. This ratio measures how old the system is as compared to how much has been depreciated. Infrastructure over 65% depreciated should be watched for aging, while infrastructure less than 50% depreciated is representative of newer systems.
Ratio of total unrestricted cash and cash equivalents to average daily cash requirements for operating expenses (defined as yearly budgeted operating expenses net of depreciation divided by 365 days in the year). This figure measures the length of time the utility can carry on normal operations with available unrestricted cash not otherwise designated for future capital needs. Standard and Poor's Industry Standards for Investment Grade ratings are typically 60 to 90 days, however the APPA has indicated 150-200 days unrestricted cash is desired for high bond ratings.
Page 7
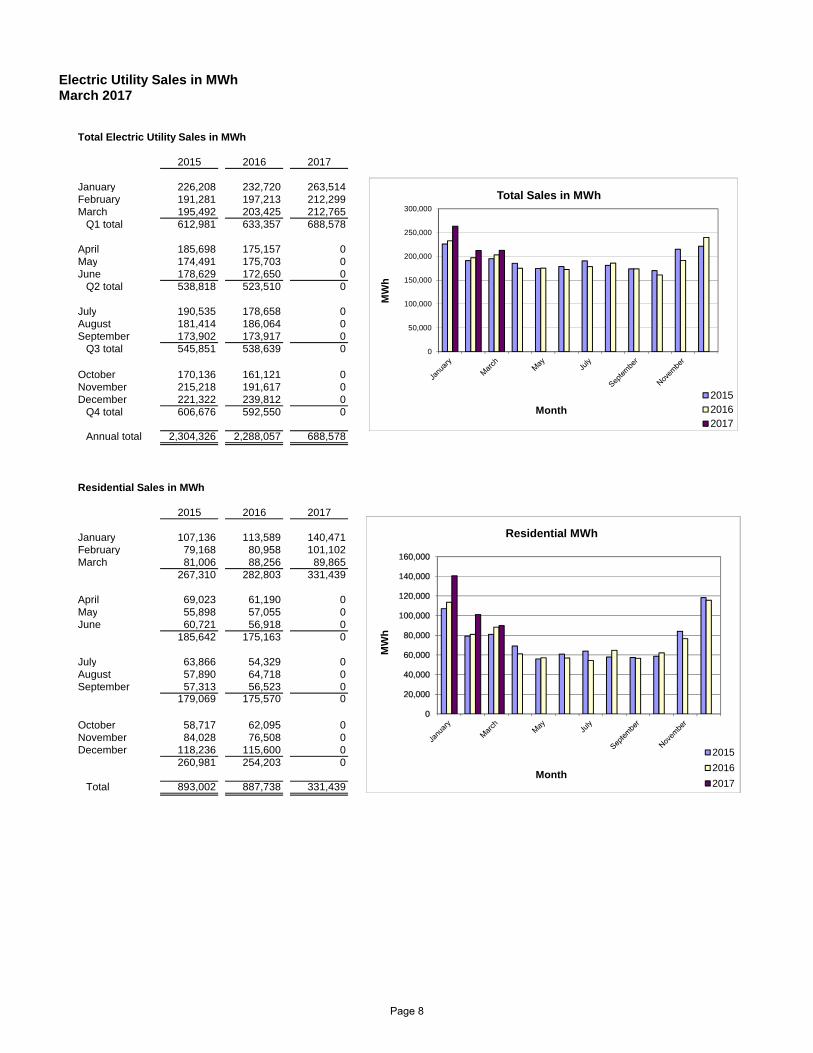
Electric Utility Sales in MWhMarch 2017
Total Electric Utility Sales in MWh
2015 2016 2017
January 226,208 232,720 263,514February 191,281 197,213 212,299March 195,492 203,425 212,765
Q1 total 612,981 633,357 688,578
April 185,698 175,157 0May 174,491 175,703 0June 178,629 172,650 0
Q2 total 538,818 523,510 0
July 190,535 178,658 0August 181,414 186,064 0September 173,902 173,917 0
Q3 total 545,851 538,639 0
October 170,136 161,121 0November 215,218 191,617 0December 221,322 239,812 0
Q4 total 606,676 592,550 0
Annual total 2,304,326 2,288,057 688,578
Residential Sales in MWh
2015 2016 2017
January 107,136 113,589 140,471February 79,168 80,958 101,102March 81,006 88,256 89,865
267,310 282,803 331,439
April 69,023 61,190 0May 55,898 57,055 0June 60,721 56,918 0
185,642 175,163 0
July 63,866 54,329 0August 57,890 64,718 0September 57,313 56,523 0
179,069 175,570 0
October 58,717 62,095 0November 84,028 76,508 0December 118,236 115,600 0
260,981 254,203 0
Total 893,002 887,738 331,439
0
20,000
40,000
60,000
80,000
100,000
120,000
140,000
160,000
MW
h
Month
Residential MWh
2015
2016
2017
0
50,000
100,000
150,000
200,000
250,000
300,000
MW
h
Month
Total Sales in MWh
201520162017
Page 8

Electric Utility Sales in MWhMarch 2017
General Service & Large Industrial Sales in MWh
2015 2016 2017
January 117,866 117,905 121,636February 111,091 114,969 110,038March 113,463 114,088 121,755
342,420 346,962 353,429
April 116,038 112,987 0May 117,742 117,677 0June 117,015 114,827 0
350,795 345,491 0
July 125,672 123,364 0August 122,673 120,117 0September 115,459 116,236 0
363,804 359,717 0
October 110,229 97,802 0November 130,010 114,712 0December 101,752 123,126 0
341,991 335,640 0
Total 1,399,010 1,387,810 353,429
Total Wholesale Sales in MWh
2015 2016 2017
January 166,562 91,229 150,213February 192,878 119,306 182,911March 216,315 200,903 213,771
575,755 411,438 546,895
April 133,635 251,173 0May 171,384 233,001 0June 130,835 197,619 0
435,854 681,793 0
July 136,993 164,635 0August 116,194 120,758 0September 126,384 110,175 0
379,571 395,568 0
October 93,491 128,793 0November 94,117 128,802 0December 109,166 129,274 0
296,774 386,869 0
Total 1,687,954 1,875,668 546,895
0
20,000
40,000
60,000
80,000
100,000
120,000
140,000
MW
h
Month
GS & Large Industrial
2015
2016
2017
0
50,000
100,000
150,000
200,000
250,000
300,000
MW
h
Month
Wholesale Sales
2015
2016
2017
Page 9

M E M O R A N D U M
EUGENE WATER & ELECTRIC BOARD
TO: Commissioners Helgeson, Brown, Mital, Simpson and Carlson
FROM: Sue Fahey, Chief Financial Officer; Aaron Balmer, Interim General Accounting
Supervisor
DATE: April 21, 2017
SUBJECT: Water Utility First Quarter 2017 Financial Report
OBJECTIVE: Information Only
Schedule of Revenues, Expenses, and Changes in Net Position (Income Statement)–Page 3
Income before capital contributions (Net Income) Net income for the Water Utility as of March is $1.2 million and is favorable to the seasonally shaped budget by $1.0 million. This is due to a combination of higher than budgeted revenues and lower than budgeted expenses for this point in the year.
The variance from budget breakdown is as follows: (in thousands) Retail Revenue over budget $ 598 Wholesale and Other revenue over budget 123 Operating Expenses under budget 260 Non-operating revenues over budget 56 Non-operating expenses over budget (4)
$1,033
For purposes of analysis, the revenue budget has been modified to reflect seasonal fluctuations. The comparison to annual budget in the chart below is seasonally shaped. Within the Water Utility, revenue and consumption peak in the summer. Fixed costs remain fairly constant throughout the year. This results in a budgeted net loss early in the year.
($500,000)
$0
$500,000
$1,000,000
$1,500,000
Jan Feb Mar
WaterSystemNetIncome
2016 2017 2017Budget
(year‐to‐date)
Page 1
ATTACHMENT 2

Operating Revenues Residential and Commercial and industrial sales are higher than the seasonally shaped budget and are above prior year levels primarily as a result of increased consumption. Sales for resale and other includes sales to Water Districts and the Willamette Water Company, as well as sales to the City of Veneta. Other operating revenue includes revenues from customer account related fees and reimbursements for billable work. The $123 thousand above the seasonally shaped budget is primarily due to larger amounts of billable work being performed. Operating expenses Operating expenses are 96% of the seasonally shaped budget. However, they have increased compared to 2016, reflecting a shift in work from capital to O&M. Source of supply and pumping is below budget by $186 thousand due to multiple factors. Finance will continue to monitor activity going forward to further identify variance drivers as the year progresses. Transmission and distribution is below budget by $347 thousand due in part to vacant positions. The budget for transmission and distribution also includes $476 thousand of the water utility’s contingency funds, which has not yet been allocated for spending and contributes to the positive budget variance. Also contributing to the positive variance are charges related to maintenance and construction services and professional and technical services which are also below budget for this point in the year. Transmission and distribution expenses are up year over year. A primary driver is a significant decrease in overhead credit transfers due to less capital work performed so far this year as compared to prior year. Administration and general expenses are at 136% of the seasonally shaped budget. They have increased compared to 2016. This is due in part to a significant decrease in overhead credit transfers when compared to both the budget and prior year. We expect overhead credit transfers to increase as we move into the construction season. At this time we expect Administration and general expenses to trend closer to budget as we progress through the year.
Statement of Net Position (Balance Sheet)–Page 4 Utility Plant in Service is $7 million less than the December 2016 figure. This is the result of a year-end accrual done for financial reporting purposes. There was a reclassification between Construction work in progress and Utility plant in service.
Page 2

Actual Actual Annual Working Budget Variance2017 2016 Budget Budget $ Budget % to Actual
Residential $ 4,118,760 $ 4,026,672 $ 20,405,566 $ 3,861,000 1 107% $ 258,000Commercial and industrial 2,963,769 2,648,048 13,925,378 2,624,000 1 113% 340,000Sale for resale and other 740,711 735,064 3,449,130 618,000 1 120% 123,000
Operating revenues 7,823,240 7,409,784 37,780,074 7,103,000 110% 721,000
Source of supply, pumping and purification 1,251,735 1,081,488 5,750,047 1,438,000 87% 186,000Transmission and distribution 1,552,236 1,322,740 7,594,321 1,899,000 82% 347,000Customer accounting 403,659 314,935 1,627,347 407,000 99% 3,000Conservation expenses 73,455 45,786 414,351 104,000 71% 31,000Administrative and general 1,218,776 978,192 3,589,647 897,000 136% (322,000)Depreciation on utility plant 1,500,646 1,501,505 6,063,784 1,516,000 99% 15,000
Operating expenses 6,000,507 5,244,646 25,039,497 6,261,000 96% 260,000
Net operating income 1,822,733 2,165,138 12,740,577 842,000 216% 981,000
Investment earnings 139,867 100,084 394,970 99,000 141% 41,000Other revenue 17,533 36,868 7,200 2,000 877% 16,000
Non-operating revenues 157,400 136,952 402,170 101,000 156% 56,000
Other revenue deductions 1,299 49,728 85,000 21,000 6% 20,000Interest expense and related amortization 545,760 533,971 2,096,078 524,000 104% (22,000)Interest expense, Electric 185,443 276,476 737,405 184,000 101% (1,000)
Non-operating expenses 732,502 860,175 2,918,483 729,000 100% (4,000)
Income before capital contributions 1,247,631 1,441,915 10,224,264 214,000 583% 1,034,000
Contribution in aid of construction 346,736 170,277 1,133,000 283,000 123% 64,000Contributed plant assets 497,036 102,213 - - 0% 497,000System development charges 259,305 379,402 412,000 103,000 252% 156,000
Increase in net position $ 2,350,708 $ 2,093,807 $ 11,769,264 $ 600,000 392% $ 1,751,000
Notes:1 Seasonal budget figure based on cyclical account activity averaged from the past four years.Unmarked budget figures are not shaped and are allocated using a straight-line method.Budget variance column may not add up due to rounding.
Eugene Water & Electric BoardWater Utility
Schedule of Revenues, Expenses and Changes in Net Position for the three months ended March 31, 2017
Prior Year Comparison YTD Budget Comparison
Page 3

December2017 2016 2016
AssetsCapital assets
Utility plant in service $ 260,163,954 $ 252,936,084 $ 267,601,807 Less - Accumulated depreciation (112,840,907) (107,037,257) (111,343,682)
Net utility plant in service 147,323,047 145,898,827 156,258,125 Property held for future use 1,188,920 1,151,497 1,184,434 Construction work in progress 13,142,787 7,995,373 3,063,265
Net Utility Plant 161,654,754 155,045,697 160,505,824
Current assetsCash and cash equivalents 5,742,409 7,848,801 4,740,905 Short-term investments - - 845,370 Restricted cash and investments 19,599,157 7,373,569 19,562,392 Designated cash and investments 27,989,795 16,421,775 14,959,703 Receivables, less allowances 3,420,437 2,974,541 3,298,133 Material and supplies, at average cost 883,485 975,527 900,943 Prepayments and special deposits 1,271,249 1,376,798 1,254,708
Total current assets 58,906,532 36,971,011 45,562,154
Non-current assetsLong-term investments - designated - - 12,286,276 Long-term investments - unrestricted - - 1,269,344 Long-term receivables, conservation and other 143,548 197,673 157,206 Other assets 4,113,966 2,127,736 4,124,167
Total non-current assets 4,257,514 2,325,409 17,836,993
Deferred Outflows of ResourcesDeferred Outflows of Resources 11,511,992 2,219,259 11,561,575
Total Assets & Deferred Outflows $ 236,330,792 $ 196,561,376 $ 235,466,546
Current liabilitiesPayables $ 609,984 $ 208,797 $ 1,201,768 Accrued payroll and benefits 1,066,089 1,251,705 1,094,979 Accrued interest on long-term debt 386,508 336,100 966,271 Long-term debt due within one year 1,840,000 1,920,000 1,840,000 Due to Electric System 779,674 796,702 870,656
Total current liabilities 4,682,255 4,513,304 5,973,674 Non-current liabilities
Long term debt -note and bonds payable 59,180,746 43,921,268 59,273,233 Due to Electric System 16,456,494 17,097,428 16,612,001 Net pension liability 19,059,020 8,190,233 19,059,020 Other liabilities 320,435 253,634 267,484
Total liabilities 99,698,950 73,975,867 101,185,412
Deferred Inflows of Resources
Deferred inflows of resources 1,009,432 1,947,248 1,009,432
Net PositionNet invested in capital assets 98,972,280 94,369,641 97,536,117 Restricted 8,016,594 7,015,660 7,368,976 Unrestricted 28,633,536 19,252,960 28,366,609
Total net position 135,622,410 120,638,261 133,271,702
Total Liabilities, Deferred Inflows & Net Position $ 236,330,792 $ 196,561,376 $ 235,466,546
Liabilities
Eugene Water & Electric Board Water Utility
Statement of Net Position March 31, 2017
Page 4

Eugene Water & Electric BoardWater Utility
Capital Budget Comparisonfor the three months ending March 31, 2017
AnnualWorking % of
Current Month Year-to-Date Budget Budget
Meters (Pre-capped) 1 30,206$ 87,719$ -$ 0.0%Type 1 Capital
Buildings & Land 810 895 248,000 0.4% Distribution Facilities 78,209 119,244 1,339,000 8.9%
Distribution Pipe & Services 1 482,476 1,316,485 6,181,001 21.3%Information Technology 70,828 89,056 196,002 45.4%Source Of Supply 52,734 226,061 1,029,999 21.9%Water Fleet 104,726 104,726 610,000 17.2%
Total Type 1 Capital 789,783 1,856,467 9,604,002 19.3%
Type 2 Capital
AMI 1 19,091 (24,319) 2 133,000 -18.3%CIS - - 1,080,000 0.0%Distribution Facilities 52,966 59,678 1,277,000 4.7%Distribution Pipe & Services 1,454 (2,730) 2 - 0.0%Source Of Supply 8,054 (34,485) 2 3,090,000 -1.1%
Total Type 2 Capital 81,565 (1,856) 5,580,000 0.0%
Type 3 CapitalSource Of Supply 70,018 128,257 530,000 24.2%
Total Type 3 Capital 70,018 128,257 530,000 24.2%
Total Capital before CIA 971,572 2,070,587 15,714,002 13.2%
Contributions in aid (193,190) (346,736) (1,133,000) 30.6%
Grand Total $ 778,382 $ 1,723,851 $ 14,581,002 11.8%
1
2
CapitalThe capital budget is approved by the Board as the maximum amount allowable for all capital work. Annual budgets by type and by individual project are prepared for planning and reporting purposes, but overall budget accountability to the Board remains at the total capital spending level. Information by project is provided in the quarterly EL1 report.
Meters are capitalized at the time of purchase. The budget for meters is included within the Distribution Pipe and Services project and the AMI project. However, the actual costs are not included in project reporting in WAM and are included as their own line item.
Negative amounts in the Year-to-Date column stem from year end accrual activity. They will reverse as invoices are received and posted.
Page 5

YTD December PERFORMANCE2017 Status 2016 STANDARD
Current Ratio 12.58 7.63 ≥ 3.25
Debt as % of Net Book Value 41% 39% ≤ 60%
Debt Service Coverage - Annualized 4.11 6.32 ≥ 2.0
Age of System - Overall 43% 42% ≤ 60%
Pumping Plant 67%Water T&D Plant 49%
Days Unrestricted Cash 643 694 90 to 120 days
Rate of Return - Annualized 8% 10% Range 5-7%
Ratios
Note: See next page for ratio definitions
The current ratio, a measure of current assets compared to current liabilities, is well above the Board performance target of 3.25, due primarily to the deposit of water bond proceeds in May 2016. A portion of these balances is reclassified annually in December to long-term investments for external reporting.Strong sales, lower expenses and the adoption of a smoothing strategy by the Board are allowing the utility to accumulate cash and reserves. The debt service ratio continues to be well above the target of 2.0. All other ratios are performing better than the Board performance standards.
Eugene Water & Electric Board Water Utility
Financial RatiosMarch 31, 2017
Page 6

Current Ratio
Debt as % Net Book Value (NBV)
Debt Service Coverage
Age of System
Days Unrestricted Cash
Rate of Return
Ratio of total unrestricted cash and cash equivalents to average daily cash requirements for operating expenses (defined as yearly budgeted operating expenses net of depreciation divided by 365 days in the year). This figure measures the length of time the utility can carry on normal operations with available unrestricted cash not otherwise designated for future capital needs. Standard and Poor's Industry Standards for Investment Grade ratings are typically 60 to 90 days. The higher performance standard supports higher credit rating.
Rate of return on investment, expressed as a percentage of the total amount invested in infrastructure. This ratio measures the utility's ability to pay current infrastructure costs and future replacement costs. A range of 5-7% is consistent with AWWA materials indicating regionally, the upper quartile for return on assets is approximately 6%.
Total current assets to total current liabilities. This ratio measures the utility's short-term liquidity (ability to pay bills). The standard is set by EWEB financial policies and is meant to support a higher than average credit rating.
Ratio of the amount of debt outstanding against the remaining Net Book Value of assets. This metric measures overall leverage of the system in an effort to align debt service payments with the useful lives of assets.
Ratio of annualized net revenues available for debt service to total long-term debt service for the year. This ratio measures the utility's ability to meet its annual long-term debt obligation. The performance standard is meant to support a double A credit rating.
Ratio of accumulated depreciation against the historical value of assets. This ratio measures how old the system is as compared to how much has been depreciated. Infrastructure over 65% depreciated should be watched for aging, while infrastructure less than 50% depreciated is representative of newer systems.
Page 7

Water Utility Sales in Kgal March 2017
Total Water Sales in Kgal
2015 2016 2017
January 459,108 399,369 469,493February 404,303 419,161 405,815March 467,462 450,547 444,552
Q1 total 1,330,873 1,269,077 1,319,860
April 487,636 488,756 0May 679,838 662,977 0June 1,051,349 942,995 0
Q2 total 2,218,823 2,094,728 0
July 1,255,528 1,066,322 0August 1,145,986 1,190,789 0September 840,585 863,372 0
Q3 total 3,242,099 3,120,483 0
October 674,261 566,078 0November 473,737 478,000 0December 187,717 653,434 0
Q4 total 1,335,715 1,697,512 0
Annual total 8,127,510 8,181,800 1,319,860
Residential Sales in Kgal
2015 2016 2017
January 219,363 199,360 200,913February 186,053 172,258 176,564March 213,577 195,684 190,004
Q1 total 618,993 567,302 567,481
April 225,226 214,567 0May 328,179 305,247 0June 551,652 474,954 0
Q2 total 1,105,057 994,768 0
July 732,314 560,639 0August 620,535 640,466 0September 417,603 439,526 0
Q3 total 1,770,452 1,640,631 0
October 315,532 226,033 0November 191,016 193,702 0December 41,102 303,194 0
Q4 total 547,650 722,929 0
Total 4,042,152 3,925,630 567,481
General Service in Kgal
2015 2016 2017
January 239,745 200,009 268,580February 218,250 246,903 229,251March 253,885 254,863 254,548
Q1 total 711,880 701,775 752,379
April 262,410 274,189 0May 351,659 357,730 0June 499,697 468,041 0
Q2 total 1,113,766 1,099,960 0
July 523,214 505,683 0August 525,451 550,323 0September 422,982 423,846 0
Q3 total 1,471,647 1,479,852 0
October 358,729 340,045 0
November 282,721 284,298 0December 146,615 350,240 0
Q4 total 788,065 974,583 0
Total 4,085,358 4,256,170 752,379
0
100,000
200,000
300,000
400,000
500,000
600,000
700,000
800,000
Kg
al
Month
Residential Kgal2015
2016
2017
0
100,000
200,000
300,000
400,000
500,000
600,000
Kg
al
Month
General Service2015
2016
2017
l
-
200,000
400,000
600,000
800,000
1,000,000
1,200,000
1,400,000
Kg
al
Month
Total Sales in Kgal2015
2016
2017
Page 8

1
M E M O R A N D U M
EUGENE WATER & ELECTRIC BOARD
TO: Commissioners Helgeson, Brown, Mital, Simpson, and Carlson
FROM: Sue Fahey, Chief Financial Officer; Sarah Gorsegner, Purchasing & Warehouse
Supervisor
DATE: April 24, 2017
SUBJECT: Quarterly Contract Report for Q1 2017
OBJECTIVE: Information Only
Issue
The Board requested that management provide a quarterly report of awarded contracts above $20,000
that are not approved on the consent calendar.
Background
A few years ago, the policy for Board approval was changed to align with Oregon Statute formal
solicitation thresholds which streamlined the contract approval process and allowed the Board and
staff to focus on higher dollar contracts and other strategic initiatives.
Current approval thresholds are at the formal solicitation threshold levels:
Purchase of all Goods, Equipment, Services and Personal Services: $ 150,000 or greater
Purchase of Construction Services: $ 100,000 or greater.
Discussion
Attached is the contract report for the first quarter of 2017.
Recommendation/Requested Board Action
None at this time. This information is provided for informational purposes only.

Contract Execution
Date Contractor City, State Description
Contract
Amount
Contract
Term Contract Process ET Manager
1/6/2017 Peterson Structural Engineers Eugene, OR Carmen Smith & Trail Intake Gate Dogging System Improvements $ 59,600 3/3/2017 Direct-QBS Mel Damewood
1/12/2017 Northwest Hazmat Inc Springfield, OR Hazardous Material Cleanup Services $ 150,000 12/20/2021
*Informal Quotes at time of
Emergency Declaration Mel Damewood
1/26/2017 MWH Portland, OR Willamette River Raw Water Intake and Pump Station Prelim Design $ 85,000 4/21/2017 Direct- QBS Mel Damewood
2/6/2017 R2 Resource Consultants Redmond, WA Permitting Activties at Leaburg Walterville $ 67,159 2/1/2019 Direct-QBS Mel Damewood
2/8/2017 Peterson Structural Engineers Portland, OR Hayden Bridge Headhouse Seismic Upgrades Design $ 49,860 12/22/2017 Direct-QBS Mel Damewood
2/15/2017 LCOG Eugene, OR Water Systems Planning Technical Assistance Activities $ 50,000 12/31/2022
Intergovernmental
Agreement Mel Damewood
2/22/2017 Belfor Springfield, OR Hazardous Material Cleanup Services $ 150,000 2/21/2022
*Informal Quotes at time of
Emergency Declaration Mel Damewood
2/27/2017 On Electric Group Springfield, OR Carmen Smith Security Improvements $ 51,307 5/3/2017
Informal Request for
Proposal Mel Damewood
3/7/2017 Findlay Engineering Eugene, OR Leaburg Safety Report $ 60,100 10/31/2017 Direct Negotiation Mel Damewood
3/14/2017 Oldham Crane Service Eugene, OR Carmen Smith Power Tunnel Crane/ Platform Service $ 50,840 11/1/2017
Informal Request for
Proposal Mel Damewood
3/17/2017 USGS Portland, OR Source Water Protection Program $ 76,420 12/31/2017
Intergovernmental
Agreement Mel Damewood
3/23/2017 Branch Engineering Springfield, OR Topographic Surveying and Drafting $ 20,000 12/31/2018 Direct-QBS Mel Damewood
3/24/2017 McKenzie Watershed Alliance Eugene, OR
Matching EPA Grant to support schools involved with watershed monitoring
projects $ 37,000 12/31/2018
Memorandum of
Understanding Mel Damewood
3/30/2017 Cornforth Consulting Portland, OR Leaburg Landslide Monitoring-Inclinometer and Peizometer Readings $ 86,000 6/30/2017 Direct Negotiation Mel Damewood
3/30/2017 Cascade Health Solutions Eugene, OR Employee Assistance Program $ 100,000 3/31/2022
Direct Negotiation, exempt
under ORS 279A.025 ®
Contracts for employee
benefit plans Lena Kostopulos
Questions? Please contact: Sarah Gorsegner, 541-685-7348
EWEB association for all above contracts = None
Qualification Based Selection (QBS) is required based on current statutes and EWEB Public Contracting Rules for consultants who provide architectural, engineering, land surveying, and related services. The selection process for contracts on
this report requires selection from pre-qualified firms, contract values are based on negotiations and reviewed for appropriate effort and rate schedules.
*Prior to and during the Dec 2016 Storm EWEB had a requirement for Hazardous Material Cleanup Services. Staff requested rate schedules from 4 contractors with the intent to award contracts for work both during and after the storm event on
an as needed basis.

1
M E M O R A N D U M
EUGENE WATER & ELECTRIC BOARD
TO: Commissioners Helgeson, Brown, Mital, Simpson and Carlson
FROM: Jeanine Parisi, Government Affairs Coordinator and Wallace McCullough, Water
Engineering Supervisor
DATE: April 13, 2017
SUBJECT: Second Source Blue Ribbon Panel
OBJECTIVE: Information Only Background A new intake and seismically sound water filtration plant on the Willamette River is EWEB’s biggest investment in Water Reliability. Public awareness of the need for a second source of drinking water is steadily gaining ground, and community education about the project specifics is well-underway. To supplement these broad outreach efforts, EWEB solicited input from a team of community stakeholders and subject matter experts about critical components of the project to complement engineering expertise. Discussion EWEB asked nine people for their independent feedback and perspectives on the preliminary design recommendations and to offer their advice on how best to move this project forward. Panel members were selected based on their professional background in important facets of this project, including emergency preparedness and response, water quality monitoring, watershed protection, infrastructure planning and facility operations. Members were:
Kevin Batridge, Lake Oswego Tigard Water Treatment Plant, Assistant Plant Manager Josh Bruce, UO/Oregon Partnership for Disaster Resilience, Director Amanda Gilbert, Coast Fork Watershed Council, Executive Director Johan Hogervorst, Willamette National Forest, Lead Hydrologist Gregory Nieckarz, Seavey Loop Property Owner Sarah Puls, Lane County Public Health Drinking Water Program Dr. Stewart Rounds, United States Geological Survey, Lead Hydrologist Eric Wold, Willamalane Parks & Recreation District, Assistant Superintendent Joe Zaludek, Eugene-Springfield Fire Chief
The panel met three times to learn more about the project (siting decisions, water treatment regime, operational plan, resiliency features, etc.) and participated in a site tour. Notes were taken and feedback compiled for panel review. The panelists affirmed the general design and project direction,

2
and offered valuable insights to consider as we move forward. Attached is a summary of the panelists’ observations and recommendations. We have recently received a letter of support for the Second Source project from Oregon Resiliency Officer Michael Harryman, also attached. Recommendation and Action This is an information item only, no action required. If you have any questions or wish to make comments on the information please contact Jeannine Parisi at 541-685-7451 or email at [email protected]. Attachments: Blue Ribbon Panel Findings & Recommendations EWEB – Letter of Support from Michael Harryman, Oregon State Resiliency Officer

Second Source Blue Ribbon Panel Feb-March 2017
Blue Ribbon Panel FINDINGS & RECOMMENDATIONS
Facility Siting and Design Findings
Overall, EWEB has a solid, well thought out plan for the new Willamette River water source and filtration plant. The planned location and siting for the facilities appears to optimize water quality, resiliency, operational logistics and practical connectivity to the transmission and distribution system. A modular design and phased build out should allow the utility to accommodate potential growth without overcommitting initial investments.
Recommendations:
Take into account the potential for future partnerships with other water utilities throughout the design process to leave open the opportunities for further regional benefits.
Design the new plant to be scalable, with sufficient space and infrastructure to expand.
Investigate filtration plant design for peer utilities – regional, national, international – particularly in earthquake prone areas.
Consider the effects on river recreation in the design of the new water intake. Create an amenity – not an attractive nuisance or eyesore.
Operations Findings
EWEB is designing the facilities with resiliency in mind. The additional investments in resilient features will help ensure the plant is operational after a disaster and can serve as a regional asset in a worst-case scenario.
Recommendations:
High quality drinking water requires not just a good source and good treatment process. Attentive and well-trained operators are just as important to ensuring delivery of great water every day.
Consider the optimal balance between operating the Hayden Bridge and Willamette plants, based on cost-effectiveness.
Identify operational protocols for the new plant that produce cost savings, balancing efficiency and dependability.
Install control systems for the new plant that are similar to Hayden Bridge, or vice versa, to ease the transition for operators.
Second Source Blue Ribbon Panel Feb-March 2017
Water Quality Findings
EWEB has collected a lot of water quality data in this reach of the Willamette River. Overall, it is fair to say it is a reliable and high quality source for our community and can meet EWEB’s goals of providing the same or better quality water compared to Hayden Bridge. Threats to raw-water quality exists, but the technology EWEB plans to utilize is designed to address identified threats. EWEB is nationally recognized for putting innovative programs in place to monitor for, manage and reduce upstream threats, and it would be a good idea to extend these efforts to include the Willamette River source.
Recommendations:
Continue monitoring water quality of the Willamette River, particularly in the Coast Fork.
EWEB is seen as a leader in source protection and should continue to develop partnerships for water quality protection and collaboration opportunities as it moves into the Upper Willamette River watershed.
Ozone treatment represents a best practice and should be included in the new plant’s treatment regime to ensure consistent taste and odor, which will enhance public acceptance of the new source. Ozone treatment is best suited to deliver the best water quality even when faced with identified threats.
Testing for toxic algae should be included in EWEB’s monitoring plan.
Survey business customers’ needs for particular water quality/chemistry; for example, food and beverage producers, high-tech manufacturing and medical facilities.
Work with communities that are located up-stream (Cottage Grove, Creswell, Oakridge) on risk mitigation measures such as current and future wastewater capital improvement plans.
Permitting Findings
EWEB should anticipate project permitting may take longer than expected.
Recommendations:
Use land use consultants with local permitting knowledge to help ensure success.
Familiarize regulatory staff with the site and project well in advance.
For the land use permitting process, be upfront, transparent and start conversations early with any impacted neighborhoods.
Reach out to regional advocates—key customers, emergency managers, public health professionals and others—to help tell EWEB’s story.
Even if there are permitting complications, keep this important infrastructure project moving forward.

Second Source Blue Ribbon Panel Feb-March 2017
Distribution Findings
The distribution system needs to be as resilient as the water treatment plant after an emergency.
Recommendations:
Pipeline connections should ensure switching from one source to another is as seamless as possible.
Invest in the Knickerbocker Bridge ASAP to improve seismic reliability.
Work with SUB and Rainbow WD to improve regional system interconnectivity. This includes improving existing interties with SUB/Rainbow to increase service flexibility and capacity in both directions. Also includes exploring additional interties if needed/prudent.
Consider other opportunities to improve resilience including the ability to move raw water to different treatment plants.
Resiliency Findings
EWEB’s new water supply represents a huge step in improving the community’s redundancy and resilience. Having sources from different watersheds allows for operational flexibility and could be a huge advantage for fire-fighting. Enabling increased production capacity under emerging conditions in order to meet the community’s minimum water needs is a smart choice so there is potable water available in an emergency.
Recommendations:
Ensure there are alternate sources for critical treatment supplies and fuel to operate the new plant in an emergency. Partnerships for fuel storage should be explored.
Further investments in the new plant (more treatment capacity or resiliency features) should be balanced against other water system resiliency priorities, such as fortifying transmission lines.
Exploring potential partnerships with other water suppliers could further diversify EWEB’s water supply and support resilience efforts.
Embrace EWEB role as a local resilience leader and engage multiple government entities (utilities, municipalities, etc.) to promote a broad vision of lifeline infrastructure resilience in the region.

Second Source Blue Ribbon Panel Feb-March 2017
Communications Findings
This is a “teachable moment”. It’s important to continue communicating with customers and other stakeholders about the importance of resilience and the project’s critical role.
Recommendations
Use interpretive displays and/or a video to educate the public about reliability and resilience features of the new plant – these are value added investments.
Communicate with other local jurisdictions and area water suppliers about EWEB’s reliability plans and progress – start the regional conversations now.
Use the Cascadia recurrence level (the chances of a quake hitting the central Oregon region in the next 50 years is between 15 and 20 percent) when communicating seismic resilience investment decisions to the public for consistency with partners’ messaging.
Reach out early to permitting agency staff so they are aware of the project’s purpose/intent, can tour the site, and start those conversations before the applications are submitted.
Make sure customers whose water will include a mix of McKenzie and Willamette River water are informed of that change. Consider a notification process if the new plant is operating in emergency mode with capacity above normal operations.
Find ways to share the message: EWEB is an industry leader in watershed protection and treatment plant operations.


![Ignite ETRM in Fintech Publication[4]](https://static.fdocuments.us/doc/165x107/58e8c2ca1a28abc9058b5d5d/ignite-etrm-in-fintech-publication4.jpg)


