
M & A M A R K E T M O N I T O...
6
M&A MARKET MONITOR HEALTHCARE SERVICES APRIL 2019
Transcript of M & A M A R K E T M O N I T O...

M&A MARKETMONITORHEALTHCARE SERVICES APRIL 2019

5 Yr
4 Yr
3 Yr
2 Yr
1 Yr
PP
About the DataThe information presented in this report is an analysis of deals in the United States or Canada. A deal is described as any closed or announced M&A transaction where the target is headquartered in the United States or Canada, financial terms of the transaction have been disclosed, and the target has an industry classification that falls into the subject industry group and as such may not be representative of your company's market valuation. Past performance is not indicative of future results. Certain adjustments have been made to the information
to exclude transactions which are not specific to the industry or incorporate relevant transactions for which an industry classification was omitted.
US & Canada M&A Market OverviewOverall Market Transactions
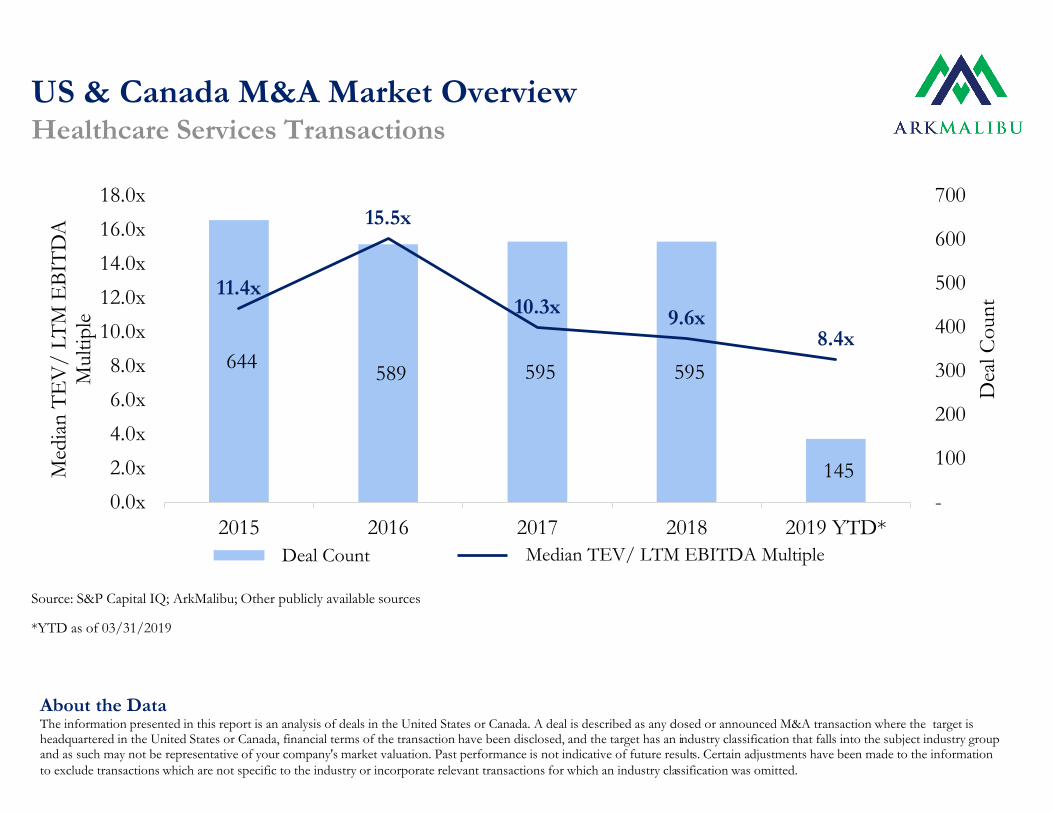
Source: S&P Capital IQ; ArkMalibu; Other publicly available sources
*YTD as of 03/31/2019
22,926 20,858
18,487 19,455
5,196
11.1x 10.7x12.0x
11.2x10.5x
-
5,000
10,000
15,000
20,000
25,000
2.0x
4.0x
6.0x
8.0x
10.0x
12.0x
14.0x
16.0x
18.0x
2015 2016 2017 2018 2019 YTD*
Dea
l C
oun
t
Med
ian
TE
V/ L
TM
EB
ITD
A
Mult
iple
Deal Count Median TEV/ LTM EBITDA Multiple
Healthcare Services
5 Yr
4 Yr
3 Yr
2 Yr
1 Yr
About the DataThe information presented in this report is an analysis of deals in the United States or Canada. A deal is described as any closed or announced M&A transaction where the target is headquartered in the United States or Canada, financial terms of the transaction have been disclosed, and the target has an industry classification that falls into the subject industry group and as such may not be representative of your company's market valuation. Past performance is not indicative of future results. Certain adjustments have been made to the information
to exclude transactions which are not specific to the industry or incorporate relevant transactions for which an industry classification was omitted.
Source: S&P Capital IQ; ArkMalibu; Other publicly available sources
*YTD as of 03/31/2019
US & Canada M&A Market OverviewHealthcare Services Transactions
644 589 595 595
145
11.4x
15.5x
10.3x9.6x
8.4x
-
100
200
300
400
500
600
700
2015 2016 2017 2018 2019 YTD*
0.0x
2.0x
4.0x
6.0x
8.0x
10.0x
12.0x
14.0x
16.0x
18.0x
Dea
l C
oun
t
Med
ian
TE
V/ L
TM
EB
ITD
A
Mult
iple
Deal Count Median TEV/ LTM EBITDA Multiple

Public Companies' Trading Metrics | Healthcare ServicesAs of: 3/31/2019
USD in millions except per share price
Last Equity Enterprise EBITDA
Price Value Value Margin 2017A LTM NTM 2017A LTMLast Sale PriceMarket CapitalizationTotal Enterprise ValueLTM EBITDA Margin %CY - 1 TEV/Total RevenuesLTM TEV/Total RevenuesNTM TEV/Forward Total RevenueCY - 1 TEV/EBITDALTM TEV/EBITDANTM TEV/Forward EBITDA
Acute-Care Hospitals
Community Health Systems, Inc. 3.73 421 14,399 10.3% 0.9 1.0 1.1 8.7 9.8
HCA Healthcare, Inc. 130.38 44,787 79,091 19.1% 1.5 1.7 1.6 8.0 8.8
LHC Group, Inc. 110.86 3,482 3,798 9.1% 1.3 2.1 1.8 13.8 23.1
Tenet Healthcare Corporation 28.84 2,969 19,610 15.2% 1.0 1.1 1.1 8.6 6.7
Median 69.85 3,225 17,004 12.7% 1.1 1.4 1.3 8.7 9.3
Assisted Living
Brookdale Senior Living Inc. 6.58 1,228 5,329 15.2% 1.7 1.5 1.3 9.8 10.1
Capital Senior Living Corporation 3.99 125 1,116 13.4% 3.0 2.4 2.4 17.5 18.2
Median 5.29 676 3,223 14.3% 2.4 2.0 1.8 13.6 14.2
Behavioral Health
AAC Holdings, Inc. 1.84 45 350 9.8% 1.5 1.1 1.2 11.6 11.2
Acadia Healthcare Company, Inc. 29.31 2,592 5,764 19.0% 2.2 1.9 1.8 10.6 10.1
Magellan Health, Inc. 65.92 1,577 2,200 2.0% 0.5 0.3 0.3 10.6 14.8
Universal Health Services, Inc. 133.77 12,142 16,112 15.6% 1.4 1.5 1.4 8.7 9.6
Median 47.62 2,085 3,982 12.7% 1.5 1.3 1.3 10.6 10.6
Diagnostic Imaging
RadNet, Inc. 12.39 620 1,352 10.9% 1.2 1.4 1.3 8.7 11.5
Varian Medical Systems, Inc. 141.72 12,865 12,214 18.8% 3.7 4.1 3.9 20.3 21.7
Median 77.06 6,743 6,783 14.9% 2.4 2.7 2.6 14.5 16.6
Dialysis Services
Centene Corporation 53.10 21,940 23,485 4.6% 0.4 0.4 0.3 8.0 8.9
Molina Healthcare, Inc. 141.96 8,891 7,523 6.9% 0.1 0.4 0.5 18.2 6.0
WellCare Health Plans, Inc. 269.75 13,569 12,042 4.5% 0.3 0.6 0.5 7.3 13.2
Median 141.96 13,569 12,042 4.6% 0.3 0.4 0.5 8.0 8.9
Category / Company Valuation Statistics Multiples Data
EV / Revenue (x) EV / EBITDA (x)
NTM
8.7
8.2
17.5
7.3
9.4
8.4
8.7
8.5
8.5
13.1
13.7
13.4
7.4
8.4
19.2
13.8
7.4
7.5
10.4
7.5
to exclude transactions which are not specific to the industry or incorporate relevant transactions for which an industry classification was omitted.
Source: SP Capital IQ; ArkMalibu;
EV = enterprise value; LTM = last twelve months; NTM = next twelve months
NM = Not Meaningful
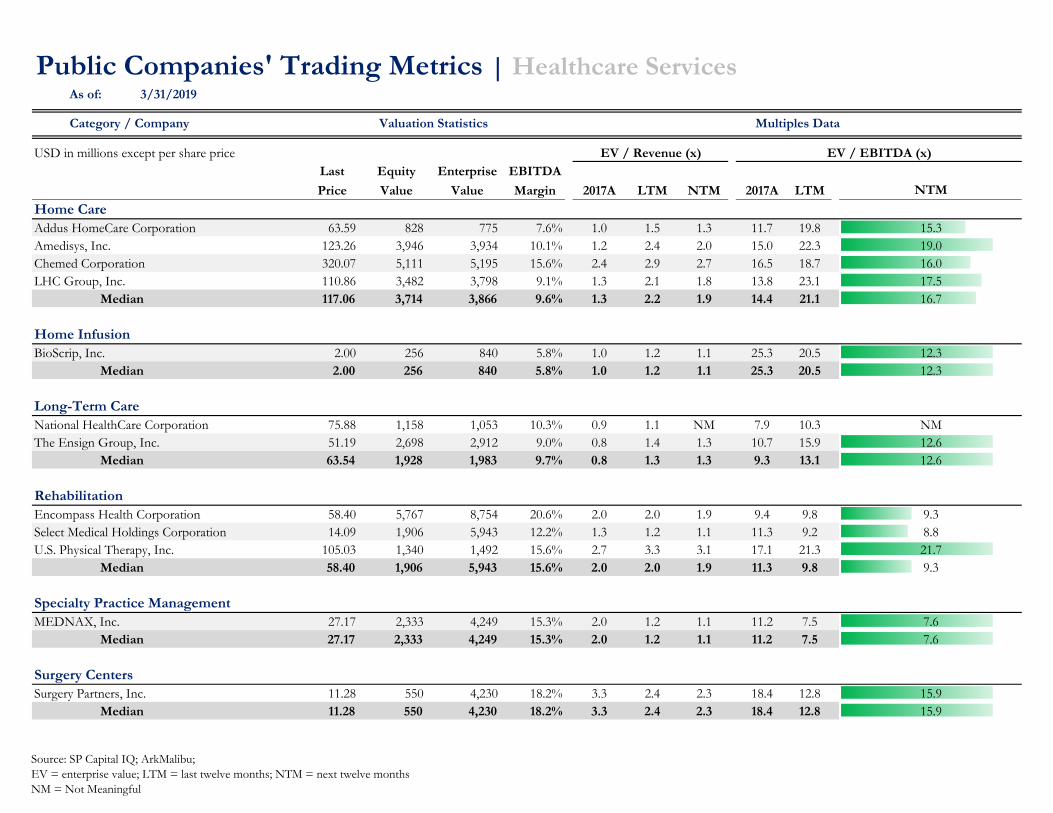
Public Companies' Trading Metrics | Healthcare ServicesAs of: 3/31/2019
USD in millions except per share price
Last Equity Enterprise EBITDA
Price Value Value Margin 2017A LTM NTM 2017A LTM
Category / Company Valuation Statistics Multiples Data
EV / Revenue (x) EV / EBITDA (x)
NTM
to exclude transactions which are not specific to the industry or incorporate relevant transactions for which an industry classification was omitted.
Home Care
Addus HomeCare Corporation 63.59 828 775 7.6% 1.0 1.5 1.3 11.7 19.8
Amedisys, Inc. 123.26 3,946 3,934 10.1% 1.2 2.4 2.0 15.0 22.3
Chemed Corporation 320.07 5,111 5,195 15.6% 2.4 2.9 2.7 16.5 18.7
LHC Group, Inc. 110.86 3,482 3,798 9.1% 1.3 2.1 1.8 13.8 23.1
Median 117.06 3,714 3,866 9.6% 1.3 2.2 1.9 14.4 21.1
Home Infusion
BioScrip, Inc. 2.00 256 840 5.8% 1.0 1.2 1.1 25.3 20.5
Median 2.00 256 840 5.8% 1.0 1.2 1.1 25.3 20.5
Long-Term Care
National HealthCare Corporation 75.88 1,158 1,053 10.3% 0.9 1.1 NM 7.9 10.3
The Ensign Group, Inc. 51.19 2,698 2,912 9.0% 0.8 1.4 1.3 10.7 15.9
Median 63.54 1,928 1,983 9.7% 0.8 1.3 1.3 9.3 13.1
Rehabilitation
Encompass Health Corporation 58.40 5,767 8,754 20.6% 2.0 2.0 1.9 9.4 9.8
Select Medical Holdings Corporation 14.09 1,906 5,943 12.2% 1.3 1.2 1.1 11.3 9.2
U.S. Physical Therapy, Inc. 105.03 1,340 1,492 15.6% 2.7 3.3 3.1 17.1 21.3
Median 58.40 1,906 5,943 15.6% 2.0 2.0 1.9 11.3 9.8
Specialty Practice Management
MEDNAX, Inc. 27.17 2,333 4,249 15.3% 2.0 1.2 1.1 11.2 7.5
Median 27.17 2,333 4,249 15.3% 2.0 1.2 1.1 11.2 7.5
Surgery Centers
Surgery Partners, Inc. 11.28 550 4,230 18.2% 3.3 2.4 2.3 18.4 12.8
Median 11.28 550 4,230 18.2% 3.3 2.4 2.3 18.4 12.8
15.3
19.0
16.0
17.5
16.7
12.3
12.3
NM
12.6
12.6
9.3
8.8
21.7
9.3
7.6
7.6
15.9
15.9
Source: SP Capital IQ; ArkMalibu;
EV = enterprise value; LTM = last twelve months; NTM = next twelve months
NM = Not Meaningful

ABOUTArkMalibu advises business owners by making highly informed and relevant recommendations on steps towards finding a great partner or monetizing their businesses. We help you maximize value by effectively conveying your company’s investment merits and minimizing the buyers’ perceived investment risks. As one of the most trusted boutique investment banking firms, we leverage our proprietary process to serve our privately-owned clients based on our experience, creativity, and avoidance of conflicts of interest. We focus our energy and talent on turning culture into capital so that we can creatively deliver value beyond our clients’ expectations.
Sell-Side Focused• ArkMalibu’s unique business model is to focus solely
on sell-side clients• Experienced and expert negotiators motivated to
meet all your goals• No conflicts of interest – other investment banks often
find themselves negotiating against their regular clients on the buyside
Art of the Possible• ArkMalibu has a strong track record of achieving
maximum value for our clients• Creativity to explore less obvious avenues for meeting
our client’s goals and achieving maximum value
Four Boxes Methodology• Proprietary process minimizes buyers’ perceived risks
and unlocks value for your company• Focus on your corporate culture fit
Client Focus• Active senior banker involvement• Financial advocates – effectively execute the client’s
chosen deal strategy• Financial confidants – confidentiality is of utmost
importance
Experienced Team• Our team has decades of M&A experience• Decades of operations, leadership, and strategic


![uPynXogeqw fnhm}Xeqw - Umesh, Sindhu and Vishakh€¦ · · 2010-04-15uIcj¿otd ‘\yr GPm hb´o$m’ uUn. F°. uKn]ndIsgmW° uPynXogeqw uPynXobnhm}Xeqw eogban•o ... [n\yualq`qte`m](https://static.fdocuments.us/doc/165x107/5ae0cce07f8b9afd1a8e7046/upynxogeqw-fnhmxeqw-umesh-sindhu-and-2010-04-15uicjotd-yr-gpm-hbom.jpg)


