Lyubomir Zagorchev, Carsten Meyer, Thomas Stehle, Fabian Wenzel Philips Research
17
Lyubomir Zagorchev, Carsten Meyer, Thomas Stehle, Fabian Wenzel Philips Research Imaging Biomarkers for Early Diagnosis of Traumatic Brain Injury
-
Upload
finn-gardner -
Category
Documents
-
view
30 -
download
1
description
Lyubomir Zagorchev, Carsten Meyer, Thomas Stehle, Fabian Wenzel Philips Research. Imaging Biomarkers for Early Diagnosis of Traumatic Brain Injury. Neuroimaging of Mild-Moderate TBI. normal. Majority of conventional imaging studies in mTBI are normal CT scan Conventional MRI - PowerPoint PPT Presentation
Transcript of Lyubomir Zagorchev, Carsten Meyer, Thomas Stehle, Fabian Wenzel Philips Research
Lyubomir Zagorchev, Carsten Meyer, Thomas Stehle, Fabian Wenzel
Philips Research
Imaging Biomarkers for Early Diagnosis of Traumatic Brain Injury
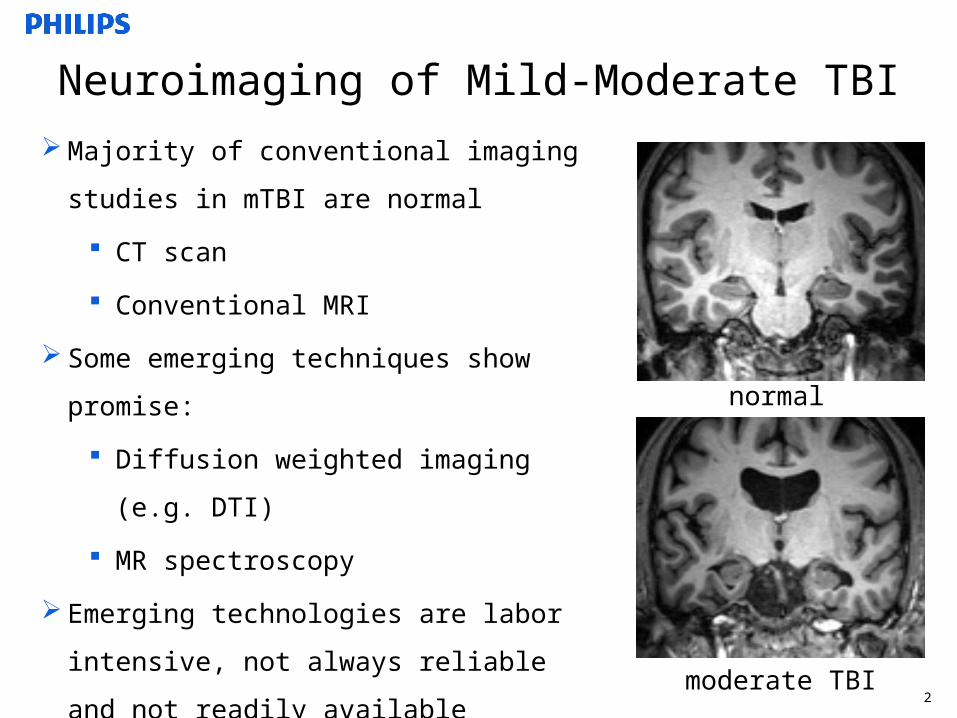
Neuroimaging of Mild-Moderate TBI
Majority of conventional imaging studies in
mTBI are normal
CT scan
Conventional MRI
Some emerging techniques show promise:
Diffusion weighted imaging (e.g. DTI)
MR spectroscopy
Emerging technologies are labor intensive,
not always reliable and not readily available
Real-time volumetric measures would be of
interest
normal
moderate TBI2

Shape-constrained Deformable Brain Model
3

Fully Automatic Adaptation
4

Segmentation Example
5
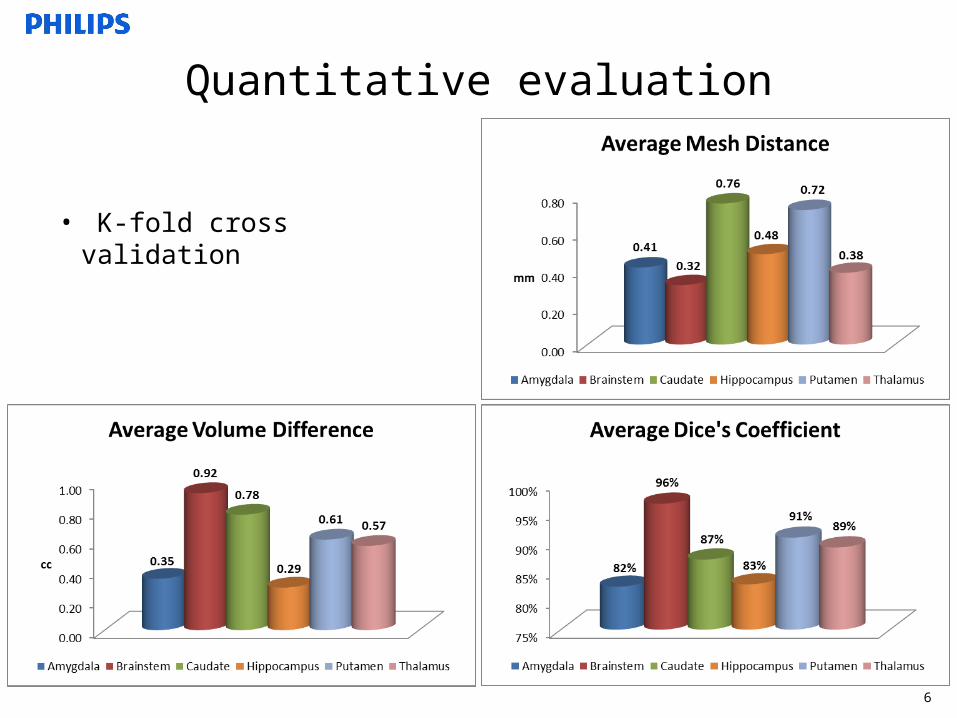
Quantitative evaluation
• K-fold cross validation
6

Comparison with FIRST and Freesurfer
7
10 healthy volunteers scanned twice within a week
Quantitative scan, re-scan reproducibility
FIRST 5.0Freesurfer 5.1
Methods
• 44 patients with mild TBI (mTBI) and 29 healthy control
subjects were imaged with MR (T1-weighted) at 2 time
points
• The fully automatic shape-constrained deformable brain
model was applied to each group at both time points
• Volumetric measures were examined for significant
differences using multivariate analysis of covariance
(MANCOVA) with age and relative intracranial volume as
covariates
8
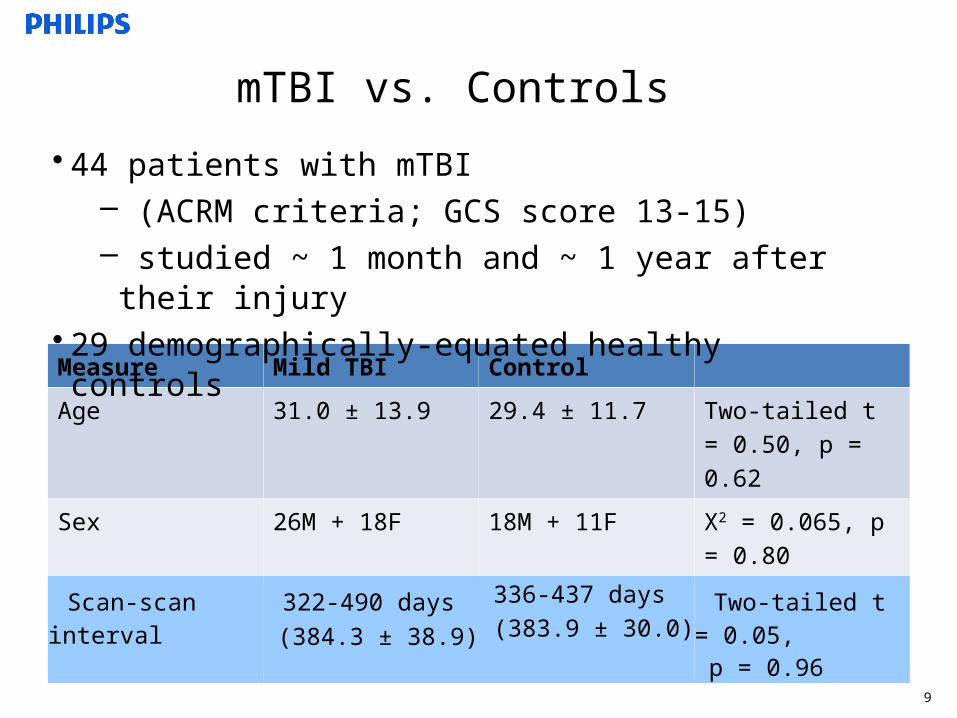
mTBI vs. Controls
Measure Mild TBI Control
Age 31.0 ± 13.9 29.4 ± 11.7 Two-tailed t = 0.50, p = 0.62
Sex 26M + 18F 18M + 11F Χ2 = 0.065, p = 0.80
Scan-scan interval 322-490 days (384.3 ± 38.9)
336-437 days (383.9 ± 30.0)
Two-tailed t = 0.05, p = 0.96
• 44 patients with mTBI– (ACRM criteria; GCS score 13-15)– studied ~ 1 month and ~ 1 year after their injury
• 29 demographically-equated healthy controls
9

TBI Injury-Scan Interval
Loss of Consciousness (minutes) Glasgow Coma Scale Score
1.95 ± 1.89 (max 7.5 min)(n=31; 13 had no LOC or unknown)
14.7 ± 0.6 (13-15)(n=34)
Measure Value
Injury to scan 1 19-113 days(59.9 ± 20.6)
Injury to scan 2 376-537 days(444.2 ± 41.7)
mTBI Cohort: Clinical Features
10

Results
p(0.0027;0.0010;0.0025;0.0016;0.0671;0.0049)
11

Results
p (0.0013; 0.0006; 0.0001; 0.0002; 0.0148; 0.0060; 0.0009; 0.0303; 0.0872; 0.0819 )
12
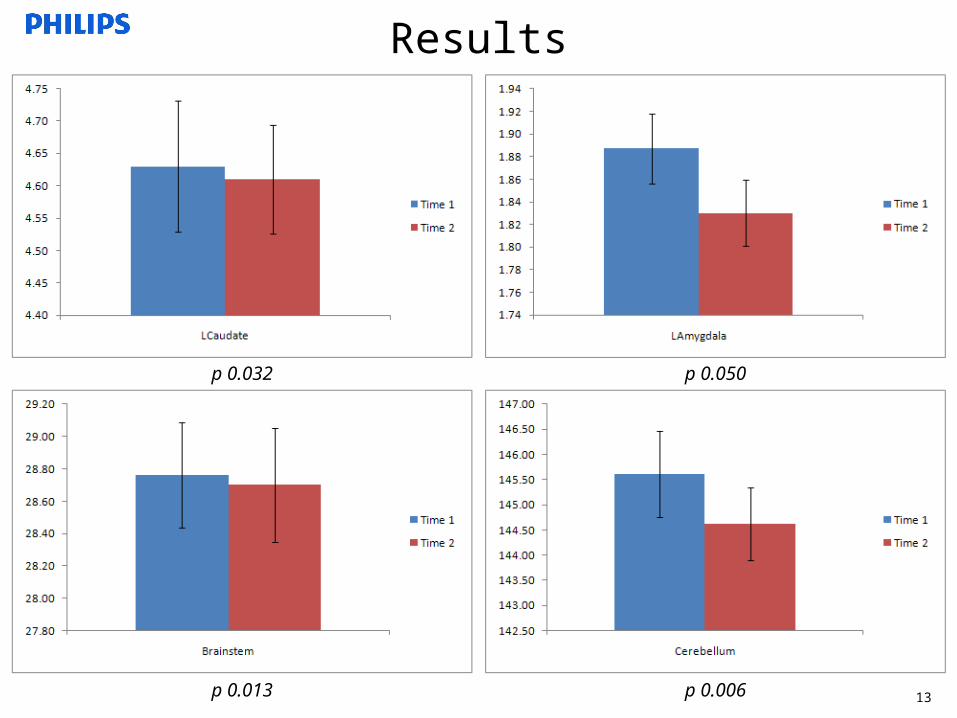
Results
p 0.032 p 0.050
p 0.013 p 0.006 13

Putamen Thalamus
Visual Volumetric Differences
green: controls (mean mesh)red: mTBI patient
14

Conclusions
• mTBI is associated with small but detectable and
statistically significant reduced volume in key subcortical
structures one month after injury
• The differences persist at one year but are reduced in
magnitude suggesting the possibility of normalization
over time
• MBS provides sensitive measure of structural brain
change after mTBI
15

Acknowledgements
• Thayer School of Engineering, Dartmouth College
• Dartmouth-Hitchcock Medical Center
• Lahey Clinic
16

17