Lyme Bay - A case study: measuring recovery of benthic...
53
Lyme Bay - A case study: measuring recovery of benthic species, assessing potential spill-over effects and socio-economic changes Annual Report No 2 Final October 2010
Transcript of Lyme Bay - A case study: measuring recovery of benthic...
Lyme Bay - A case study: measuring recovery of benthic species,
assessing potential spill-over effects and socio-economic changes
Annual Report No 2
Final
October 2010

Project Title: Lyme Bay - A case study: measuring recovery of benthic species,
assessing potential spill-over effects and socio-economic changes
Report 2: Annual Report
Project Code: MB0101 Marine Biodiversity R&D Programme
Defra Contract Manager: Carole Kelly
Funded by:
Department for Environment Food and Rural Affairs (Defra)
Marine and Fisheries Science Unit
Marine Directorate
Nobel House
17 Smith Square
London SW1P 3JR
&
Natural England
Northminster House
Peterborough PE1 1UA
Authorship: Attrill MJ, Bayley DTI, Gall SC, Hattam C, Jackson EL, Langmead O,
Mangi S, Marshall C, Munro C, Rees S, Rodwell L, Sheehan EV, Stevens, TF.
Strong S. 2010. Lyme Bay – a case-study: measuring recovery of benthic species;
assessing potential “spillover” effects and socio-economic changes, Annual Report,
December 2010. Report to the Department of Environment, Food and Rural Affairs
from the University of Plymouth-led consortium. Plymouth: University of Plymouth
Enterprise Ltd. 53 pages.
Disclaimer: The content of this report does not necessarily reflect the views of Defra,
nor is Defra liable for the accuracy of the information provided, nor is Defra
responsible for any use of the reports content.

Table of Contents List of Figures ............................................................................................................. 4 List of Tables .............................................................................................................. 5 Executive Summary .................................................................................................... 6 Introduction ............................................................................................................... 10
Project Background........................................................................................ 10
Aims and Objectives ...................................................................................... 10 Structure of this report ................................................................................... 11
Part 1: Predicting the effect of fishery area closures on long-lived sessile species .. 12
1.1 Introduction .............................................................................................. 12
1.2 Results ..................................................................................................... 12 Part 2: Field surveys of benthic species and assemblages ...................................... 14
2.1 Introduction .............................................................................................. 14
2.2 Methods ................................................................................................... 14 2.3 Data analysis ........................................................................................... 19
Part 3: Field Surveys of reef associated nekton ....................................................... 25 3.1 Introduction .............................................................................................. 25
3.2 Methods ................................................................................................... 25 Part 4: Scallops ........................................................................................................ 27
4.1 Introduction .............................................................................................. 27
4.2 Methods ................................................................................................... 27 4.3 Data analysis ........................................................................................... 31
Part 5: Socio-economic implications ......................................................................... 32
5.1 Introduction .............................................................................................. 32 5.2 Methods ................................................................................................... 32 5.3 Main results ............................................................................................. 34 5.4 Enforcement of closure ............................................................................ 45 5.5 Discussion ............................................................................................... 45
Part 6: Conclusions and programme for future work ................................................ 47
Acknowledgements .................................................................................................. 50 References ............................................................................................................... 50 Appendix................................................................................................................... 51

List of Figures
Figure 2.1 Location of towed video transects in Lyme Bay
Figure 2.2 Area designations of sites within each treatment (1, 2, 3, or 4) for use in
PERMANOVA analyses
Figure 2.3 Location of diver survey sites in Lyme Bay
Figure 2.4 Diver surveying species present in a 0.5 x 0.5 m quadrat in Lyme Bay
Figure 2.5
Mean abundance of Eunicella verrucosa populations in Lyme Bay. Graphs represent
abundance in different areas as determined in Figure 2.4. Error bars are Standard
Error
Figure 2.6
Mean abundance of Phallusia mammillata populations in Lyme Bay. Graphs
represent abundance in different areas as determined in Figure 2.4. Error bars are
Standard Error
Figure 2.7
Mean abundance of target species from belt transects for 2008, 2009 and 2010 for
sites a) within the open controls, b) new closures and c) closed controls. Error bars
are standard deviation
Figure 3.1 Location of sites for baited video sampling
Figure 4.1 Map showing the location of scallop survey sites during the 2010 field season
Figure 4.2 Diagram detailing the survey method for scallop collection (not to scale)
Figure 4.3 Photographs of Pecten maximus showing a) dimensions used for width and height
measurements, and b) clear growth rings on a 3 year old specimen
Figure 4.4 Evidence of damage in the growth ring of two Pecten maximus specimens
Figure 4.5 The underside of 2 Pecten maximus shells showing the attachment of a) bryozoans
and b) numerous Crepidula fornicata
Figure 4.6 Pecten maximus a) after lower shell has been removed and b) showing where the
gonad was cut prior to weighing (dotted line) and the location of the foot
Figure 5.1
Comparisons based on a) wet weight, and b) value of landings one year before and
one year after the closure for all species landed by static gear, towed gear, and
scallops from vessels that had fished in ICES rectangles 30E6 and 30E7
Figure 5.2
Value of landings (£) for fishing vessels that use static gear and those that use towed
gear comparing the value of landings when fishing had been conducted inside or
outside of the closed area
Figure 5.3
Raw sightings data records from 2005 to 2009 collected by the Devon Sea Fisheries
Committee (DSFC). The positions shown are sightings from a patrol boat that were
normalised with the patrol boat effort and are presented for a) static and b) towed
gear types
Figure 5.4 Proportion of divers who reported changes to diving trips to Lyme Bay in the first and
second phase of surveys

Figure 5.5 Changes in various aspects of dive businesses comparing responses for the first and
second surveys
Figure 5.6 Number of trips made by Charter Boat Operators in 2008 and 2009 showing the type
of activity hired for
Figure 5.7 Location of charter operations in 2008 and 2009
List of Tables
Table 2.1 Fieldwork dates for Diver Surveys & Towed Video 2008 - 2010
Table 2.2 Definition of treatments from which survey sites were selected
Table 3.1 Fieldwork dates for Baited Underwater Video 2009 - 2010
Table 5.1
Perceived changes in income, total costs, travel time to fishing sites, number of
fishing trips made and trip duration for towed and static gear fishermen a)
immediately after the closure (towed, n = 15, static, n = 25), and b) one year after the
closure (towed, n = 12, static, n = 18) in Lyme Bay
Table 5.2
Changes in the a) number of vessels and b) number of trips one year before and
after the closure for static and towed gear showing the number fishing inside or
outside of the closed area
Table 5.3 Relative importance (%) of the main impacts reported by fish merchants
(Respondents include a total of seven key fish merchants from Devon and Dorset)
Table 6.1 Reporting deadlines for the 2010-2011 period

Executive Summary
Introduction
Lyme Bay, located off the south west coast of England is home to some of the UK‟s
most important reef habitat and is considered to be both nationally and internationally
important in ecological and conservation terms. It is also an important area for
commercial fishing and has a substantial number of recreational users.
In July 2008 the UK Government (Defra) acted on guidance from Natural England
that advised the closure of a 60 nm2 area of Lyme Bay to bottom towed fishing gear.
This closure took the form of a Statutory Instrument and had the primary aim of
allowing the recovery of benthic biodiversity. The reefs have now also been put
forward by Natural England as part of the Lyme Bay and Torbay candidate Special
Area of Conservation (cSAC).
Following the closure, the Marine Institute, University of Plymouth was awarded the
contract for a three year project funded by Defra and Natural England that aims to
assess both the ecological and socio-economic implications of the closure. The
project partners are the Marine Biological Association of the UK, Plymouth Marine
Laboratory Limited, and Marine Bio-images.
The project has been designed around eight main objectives:
(1) To identify and select a number of representative species within the study area
that could signify changes within the ecosystem. Selection of such indicator
species should include representatives from the full range of life strategies used
by benthic species in the study area (but selection of species should consider
their wider application for monitoring of MPAs);
(2) To develop a cost-effective sampling design for the monitoring of benthic recovery
within the closed area of Lyme Bay;
(3) To quantify the recovery of the indicator species within the closure compared to
areas which continue to be fished using bottom towed gear;
(4) To quantify the effects of the closures on reef-associated nekton, compared to
areas which continue to be fished using towed bottom gear;
(5) To assess the long-term effects of fishery area closures on long lived and sessile
benthic species;
(6) To collect and store samples of selected benthic species for future DNA analysis;

(7) To quantify and assess any effects on adult scallop populations resulting from the
closure;
(8) To assess any socio-economic impacts (e.g. diversification, gear changes,
changes to areas fished, effort changes) which result from the closure restrictions.
This document is the second Annual Report produced by the project team and
reports on work completed to date. Some preliminary data analysis is included, but,
as all analyses are not yet complete, full results will not be presented until the Final
Report which is due at the end of March 2011.
Part 1: Predicting the effect of fishery area closures on long-lived sessile species
It is not possible to assess the long-term effects of fishery area closures in Lyme Bay
directly within the time frame of this project because, as they are often slow growing,
the recovery time for many long-lived sessile species is substantial. The approach
here was to make an informed assessment of the likely outcomes of fishery area
closures using the best available knowledge from the scientific and grey literature.
Detailed results are presented in the Objective 4 report (October 2010), but the main
findings of this work are summarised here. The majority of species investigated were
found to be slow growing with prolonged maturation, and over 66 % have no
regeneration capacity, meaning that their regeneration is dependent on larval
dispersal. Literature searches revealed a lack of published studies that met the
search criteria, highlighting the importance of this work in improving the
understanding of the effects of fishery area closures on hard substrate, temperate
benthic communities, particularly if key aspects of benthic monitoring are continued.
Part 2: Field surveys of benthic species and assemblages
There is a need to develop cost-effective and innovative ways of monitoring changes
in biological assemblages within MPAs due to the current increase in their
designation. The ecological survey was designed with this in mind.
Fieldwork included towed video surveys of the benthos, and diver surveys for
detailed, site specific documentation of change over time within a specific cobble reef
habitat. Survey sites were selected to control for habitat and fishing effort variability.
To allow changes to be detected as a result of the closure, four treatments were
defined:
(1) New closure (previously fished, now closed to mobile ground gear)
(2) Closed controls (previously unfished under a voluntary agreement, continuing to
be unfished)

(3) Near open controls (previously fished, continuing to be fished, < 5 km from
closure boundary)
(4) Far open controls (previously fished, continuing to be fished, > 5 km from
closure boundary)
Survey sites have now been successfully sampled in 2008, 2009 and 2010 and data
sets are now complete. Data analysis includes estimates of abundance data for
mobile species and ten large obvious benthic species as well as detailed frame grab
analysis for a subset of 30 frames per tow. Frame grab analysis is in progress, and in
the same week that this report was due, the extraction of data from the video footage
for all three years was completed. Initial investigations have shown changes in
abundance of indicator species that are typical of an assemblage of organisms in
various stages of recovery. PERMANOVA has revealed significant differences in
abundances of some species between areas within and between treatments. Post
hoc testing is needed before any conclusions can be drawn, but this investigatory
dataset has shown that there is a likely emerging trend for some species towards
„recovery‟ within the new closure. Initial observations of the diver surveyed belt
transects also suggests that there will be differences in species abundance between
treatments and years.
The need for ongoing monitoring is clear as these emerging trends may be the
beginning of a recovery phase, or they may not. We will not know for possibly several
more years due to the long-lived nature of the key species, but if there is recovery it
is vital to capture this in order to inform other potential closures and provide robust
evidence to support their effectiveness.
Part 3: Field surveys of reef-associated nekton
Static baited underwater video sampling was used to quantify the diversity and
structure of nektonic and mobile benthic faunal assemblages. Surveys were
successfully repeated in 2010 and data analysis is underway. Analysis will provide an
understanding of the differences between nekton and benthic mobile species in
terms of species diversity, abundance and assemblage structure between seasons,
(spring, March, and summer, July), spatial treatment differences (CC, NC and OC),
and temporal treatment differences. Full analysis will be presented in the Final
Report.
Part 4: Scallops
Adult scallop populations were surveyed to assess differences in population structure
within and outside the closure. This work was incorporated into the quadrat surveys
undertaken by the dive team and therefore survey sites were predetermined.
Scallops were collected, and data on their length, width, height, and age recorded.
Damage to their shells was also noted. Data analysis is underway and will be
reported in the Final Report. Data from the towed video analysis regarding total
scallop abundance will also be included.
Part 5: Socio-economic implications
Socio-economic assessment used questionnaires and interviews to determine the
effect of the closure on various stakeholder groups – commercial fishermen, sea
anglers, dive businesses, divers, charter boat operators, owners of local hotels, and
fish merchants. Secondary data in the form of catch data from the Marine
Management Organisation (MMO) relating to wet weight and value of landings
reported by vessels that have fished within International Council for the Exploration of
the Sea (ICES) statistical rectangles 30E6 and 30E7 was also used to study changes
in fishing effort following the closure. Data on sightings was also obtained from the
Devon Sea Fisheries Committee (DSFC) and the MMO and was used to explore
changes in areas fished.
Preliminary results indicate that the closed area has imposed a number of costs and
benefits on the stakeholders. For fishermen, impacts differ depending on their choice
of gear and fishing location. Those who fish within the closure have seen an increase
in fishing effort as they are able to increase the number of crab and whelk pots they
deploy. However, outside the closure, conflicts have been reported between static
and mobile gear fishermen. Despite this, analysis of landings data has indicated that
there have been minimal impacts on the average incomes and profits of fishermen
and fish merchants. For all other stakeholder groups minimal changes have been
reported. However, these impacts are immediate and all stakeholders shared the
view that the full impacts of the closure are yet to be realised.
Part 6: Conclusions and program for future work
To date, this project has identified tentative evidence for the recovery of long lived
sessile species within the 60 nm2 closure in Lyme Bay. Preliminary analyses have
revealed a statistically significant effect of treatment for the towed video data, with
sites within the new closure significantly more abundant in sessile benthic organisms
than those outside that continue to be fished. Furthermore, socio-economic analysis
has shown that although there have been some negative effects of the closure on
fishermen, overall the impact on stakeholders has been minimal, and landings data
has revealed that incomes and profits have not been greatly impacted.
However, despite these positive trends, the time period of this project is not adequate
to allow the clear, unequivocal recovery of long lived sessile indicator species to be
determined. The results we have to date show an emerging trend that may be the
beginning of a recovery phase, but continued monitoring is essential to determine
whether this is the case; these data would be of national and international importance
in terms of assessing the value of MPAs and similar closures.

Introduction
Project Background
Lyme Bay, located off the south west coast of England is home to some of the UK‟s
most important reef habitat and is considered to be both nationally and internationally
important in ecological and conservation terms. The bay is an important fishing area
for mobile gear such as scallop dredges, and static gear such as crab and lobster
pots. It also supports a large number of recreational users, including sea anglers and
divers.
Since 2001, some areas of the Lyme Bay reefs have been protected through
voluntary agreements with local fishermen. The size of these areas was increased in
2006. However, following advice given by Natural England, the UK Government
(Defra) closed a 60 nm2 area in July 2008 to bottom towed fishing gear under a
Statutory Instrument to provide protection against damage to the seabed.
Consequently scallop dredgers and demersal trawlers are no longer permitted to fish
within the closed area, but it remains open to fishers using pots and nets, sea
anglers, scuba divers, and other recreational users. The bay has also now been put
forward as a candidate Special Area of Conservation (cSAC) by Natural England
under the EC Habitats Directive.
Aims and Objectives
There are a multitude of factors (both ecological and socio-economic) which are
affected by this type of fisheries closure. A consortium of scientists, lead by the
University of Plymouth Marine Institute, is carrying out a comprehensive study which
aims to monitor both the ecological and socio-economic impacts of this closure. With
these aims in mind the project has been designed around the following objectives:
(1) To identify and select a number of representative species within the study
area that could signify changes within the ecosystem. Selection of such
indicator species should include representatives from the full range of life
strategies used by benthic species in the study area (but selection of species
should consider their wider application for monitoring of MPAs);
(2) To develop a cost-effective sampling design for the monitoring of benthic
recovery within the closed area of Lyme Bay;
(3) To quantify the recovery of the indicator species within the closure compared
to areas which continue to be fished using bottom towed gear;

(4) To quantify the effects of the closures on reef-associated nekton, compared to
areas which continue to be fished using towed bottom gear;
(5) To assess the long-term effects of fishery area closures on long lived and
sessile benthic species;
(6) To collect and store samples of selected benthic species for future DNA
analysis;
(7) To quantify and assess any effects on adult scallop populations resulting from
the closure;
(8) To assess any socio-economic impacts (e.g. diversification, gear changes,
changes to areas fished, effort changes) which result from the closure
restrictions.
The completed study will aim to provide valuable information on the effectiveness of
MPAs at delivering conservation gains, and in determining the kinds of information
that is essential to assessing their socio-economic implications. In addition, they can
be used to provide further detail on where fisheries management and conservation
objectives could be integrated.
The project is now in its final year and will be completed in March 2011. This report
outlines the work completed to date, and provides some preliminary analysis of the
data collected. Detailed analyses are currently in progress and this will be presented
once all datasets are complete in the final report.
Structure of this report
This report is presented in several sections. In general, they correspond to the
objectives as outlined above; however, in some cases it was more logical and
reader-friendly to cover several objectives within a single part. Each part is intended
to stand alone, but should be read in the context of this introduction, and in
conjunction with the overall conclusions at the end of the report.
The timing of this document falls just three months before the completion of the Final
Report. To minimise repetition between reports and to focus resources and efforts on
completing full analyses on time, final analyses will be presented and conclusions
drawn mostly in the Final Report.

Part 1: Predicting the effect of fishery area closures on long-lived
sessile species
1.1 Introduction
It is not possible to assess the long-term effects of fishery area closures in Lyme Bay
directly within the time frame of this project because, as they are often slow growing,
the recovery time for many long-lived sessile species is substantial. The approach
here was to make an informed assessment of the likely outcomes of fishery area
closures using the best available knowledge from the scientific and grey literature.
This comprised two components:
(1) An investigation into the sensitivity and recoverability of the long-lived sessile
species recorded in the study area of Lyme Bay using biological traits analysis
(2) A review of scientific literature into the long-term effects of fishery area closures
on benthic fauna at a national, regional (NE Atlantic) and global scale to put
findings into wider context.
In addition, this work was supported by predictive species distribution modelling of
the pink sea fan, Eunicella verrucosa, to gain a spatial dynamic to the assessment of
long term change and inform on priority areas for long-term monitoring.
1.2 Results
The results are reported in detail in the Objective 4 report, but in brief, it was found
that recoverability traits varied amongst the sessile species. Over a third of the
sessile long-lived species in Lyme Bay were classified as fragile according to their life
history traits. Many of these (> 66 %) have no regeneration capacity, meaning that
their recovery is dependent on larval dispersal. Larval dispersal distance was
categorised as short (< 0.1 km), medium (0.1 – 1 km) and long (> 10 km). Of the
species lacking regeneration mechanisms, most could travel moderate to long
distances as larvae which could enable recolonisation from outside the Bay.
However, for species such as Amphianthus dorhni (sea fan anemone) which can
neither regenerate nor travel far as a larvae; recoverability is low. Other traits that
were considered in this analysis were growth and age at maturity, since these can
determine the speed of recolonisation. Most of the species investigated here were
slow growing with prolonged maturation.
The analysis of studies reporting recovery in temperate reef communities following
protection was constrained by the paucity of suitable studies that fulfilled the search
criteria. While there is a body of literature on recovery (or lack of) in tropical reef

systems and also a significant amount of information available on the impacts of
fisheries activity on benthic communities, there are few cases where the recovery of
sessile benthic communities has been documented. Where there are studies that
show recovery, it is often reported for mobile rather than sessile species. Findings
are highly variable, with dramatic changes in benthic community composition in some
areas (e.g. Southern Italy (Guidetti 2007)) but others have remained unchanged (e.g.
Lundy, (Hoskin et al,. 2009)).
The predictive modelling work on E. verrucosa compared Generalized
Linear/Additive Model (GLM/GAM) and Maximum Entrophy (Maxent) results in terms
of predictive accuracy and generated predictive maps of E. verrucosa distribution
from the different modelling approaches. These were appraised in terms of the
ecological insight gained from the modelling exercise and their applicability to future
monitoring effort within the Lyme Bay closed area. All three approaches predicted
that a large proportion of the closed area is suitable for supporting the pink sea fan.
In reality, many of these areas are associated with absence records (false positives).
Overall the Maxent model outperformed the other models in all but one of the model
performance indicators and on face value one might use this model in preference to
the GLM output to support spatial management measures.

Part 2: Field surveys of benthic species and assemblages
2.1 Introduction
With the current increase in designation of MPAs there is a need to develop cost-
effective and innovative ways of monitoring changes in the biological assemblages to
enable effective management to be implemented. With this in mind, the specific
objectives of this monitoring program were:
(1) To design and implement a cost-effective and low impact sampling regime to
quantify abundance of benthic biota
(2) To establish monitoring sites for small and large scale surveys
(3) To collect and analyse base-line data as soon as practicable after the
implementation of the closure (2008)
(4) To repeat the data collection surveys annually for two years (2009 & 2010)
The fieldwork aspect has now been completed (Table 2.1), and data analyses are
underway. Preliminary results are presented here and full analyses will be presented
in the Final Report.
Table 2.1: Fieldwork dates for Diver Surveys & Towed Video 2008 - 2010
Date Purpose Status
2008
09.09.08 – 24.09.08 Diver Surveys Completed
25.09.08 – 10.10.08 Towed Video Completed
2009
03.08.09 – 21.08.09 Diver Surveys Completed
25.08.09 – 18.09.09 Towed Video Completed
2010
19.07.10 – 25.07.10 Diver Surveys Completed
02.08.10 – 16.08.10 Towed Video Completed
2.2 Methods Full methods have been reported in the 2009 Annual Report (Attrill et al., 2009), and
Sheehan et al. (in revision) and have therefore only been summarized here.

Two main methodological elements were selected for the monitoring of change in
benthic species abundances and assemblage structure over time. These were
designed to provide quantitative, robust information at a range of scales:
Annual towed High Definition HD (large scale) video transect sampling to
quantify broad-scale changes of benthic assemblages over time.
Annual surveys by divers using quadrat and fixed transects (small scale) for
detailed and site specific documentation of change over time within a specific
cobble reef habitat.
Survey locations were selected following consultation with DSFC, the Marine
Fisheries Agency (MFA, now MMO) and Devon Wildlife Trust (DWT) to ensure that
locations controlled for habitat and fishing effort variability. Target areas were defined
(Table 2.2), and from these, sites were determined during the 2008 field season
using local knowledge and site investigations by divers.
Table 2.2: Definition of treatments from which survey sites were selected
Treatment Definition
New closure Previously fished, now closed to mobile ground gear
Closed controls Previously un-fished under voluntary agreement, continuing to be un-fished
Near open controls Previously fished, continuing to be fished, < 5km from closure boundary
Far open controls Previously fished, continuing to be fished, > 5km from closure boundary
It was predicted that the initial baseline (2008) data would show the closed controls
to be different from both open controls and the new closure. Over time, a recovery
scenario predicts that species composition in the new closures will move to a state
approximating that of the closed controls.
2.2.1 Towed video
Towed video analysis was used to sample abundance of benthic taxa using a low
impact, cost-effective methodology. A total of 64 sites were identified, with 16 sites
surveyed per treatment (Figure 2.1). The survey has now been successfully
completed in the summers of 2008, 2009 and 2010.
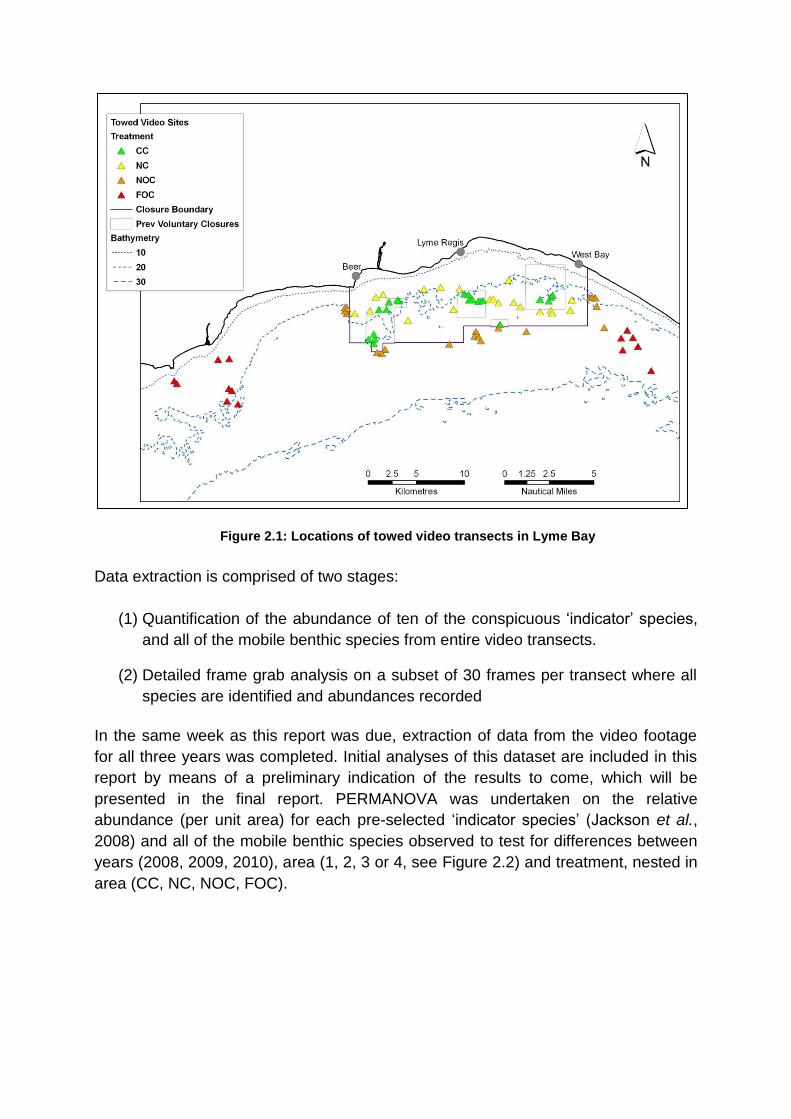
Figure 2.1: Locations of towed video transects in Lyme Bay
Data extraction is comprised of two stages:
(1) Quantification of the abundance of ten of the conspicuous „indicator‟ species,
and all of the mobile benthic species from entire video transects.
(2) Detailed frame grab analysis on a subset of 30 frames per transect where all
species are identified and abundances recorded
In the same week as this report was due, extraction of data from the video footage
for all three years was completed. Initial analyses of this dataset are included in this
report by means of a preliminary indication of the results to come, which will be
presented in the final report. PERMANOVA was undertaken on the relative
abundance (per unit area) for each pre-selected „indicator species‟ (Jackson et al.,
2008) and all of the mobile benthic species observed to test for differences between
years (2008, 2009, 2010), area (1, 2, 3 or 4, see Figure 2.2) and treatment, nested in
area (CC, NC, NOC, FOC).

Figure 2.2: Area designations of sites within each treatment (1, 2, 3, or 4) for use in
PERMANOVA analyses
Data extraction from the frame-grabs is not yet complete and will be presented in the
final report.
With the two sets of data complete and a comprehensive dataset compiled of
encrusting and sessile species from the frame grabs and the more conspicuous, less
abundant and/or mobile species identified from the video, it will be possible to
appropriately assess with confidence the effect of the SI on the species associated
with the seabed in Lyme Bay, in the two years that it has been in place.
2.2.2 Random Quadrat and Fixed Transect Diver Survey
To provide more detailed, site-specific data complementing the large scale towed
video camera survey, a smaller scale diver survey was conducted, primarily through
the use of quadrats, focussing on the mixed sediment (referred to as „cobble reef‟)
habitat. Detailed surveys of change in species assemblage over time were carried
out by SCUBA divers.
During July 2010, Marine bio-images survey divers successfully relocated and re-
surveyed all ten fixed monitoring stations (Figure 2.3). As in previous years the diving

survey work was conducted from the 10 m, Lyme Regis based workboat Miss Patty,
with skipper John Walker. The dive survey team (Colin Munro, Lin Baldock, Sean
Lindsley-Leake and Katharina Brown) remained the same, ensuring maximum
continuity in species identification.
Figure 2.3: Location of diver survey sites in Lyme Bay
All stations lay between 20 and 22 m chart datum in areas of level seabed with
similar exposure to tidal streams and wave action. Their location was selected from
areas of cobble reef to ensure habitat homogeneity. As in previous years, at each
station, eight 0.5 x 0.5 m quadrats were dropped at random locations around the
station markers, surveyed and photographed (Figure 2.4). Species from a
predetermined list were recorded quantitatively, and a total species list was produced
from four quadrats.

Figure 2.4: Diver surveying species present in a 0.5 x 0.5 m quadrat in Lyme Bay
Each quadrat was photographed using a 10 megapixel DSLR and wide-angle lens
(approximately 100 degree angle of acceptance allowing a camera-to-subject
distance of about 0.4 m) to ensure image clarity. Images were collected as RAW files
and have been given limited processing to improve contrast and resolution prior to
being archived on CD as high quality JPEG files.
An 8 x 2 m belt transect fixed between two markers at each station was also
surveyed. This focussed on larger, more widely distributed species that are less likely
to fall, or be accurately recorded within quadrats. The target species for which counts
were performed were Eunicella verrucosa, Alcyconium digitatum, Pentapora foliacea,
Cliona celata (raphus form only), Phallusia mamillata and all erect branching axinellid
sponges over 3 cm in height (grouped as a single category).
2.3 Data analysis
Data collection is now complete (Table 2.1) and analysis underway. Data presented
here are preliminary, and full analysis will be included in the Final Report.

2.3.1 Towed video analysis
Initial investigations into the changes in abundance of indicator species are giving
results typical of an assemblage of organisms exhibiting various stages of recovery.
This would be expected based on the fact that these species were selected to
represent a range of life histories, tolerances to disturbance and abilities to recover
from disturbance (Jackson et al., 2008).
There also appear to be geographical differences between „area‟ (Figure 2.2), which
will be formalized once post-hoc tests have been carried out. For example, E.
verrucosa populations were significantly different between areas within and between
treatments (PERMANOVA P < 0.05, see Appendix A).
Figure 2.5: Mean abundance (number of individuals) of Eunicella verrucosa populations in
Lyme Bay. Graphs represent abundance in different areas as determined in Figure 2.4. Error
bars are Standard Error

Post hoc tests are required to formally explain results; however, it appears that there
are geographical differences between the west and east of the bay within the New
Closure (Figure 2.5, see Appendix). The abundance of pink sea fan appears to be
increasing in sites on the eastern side, but not on the west (Figures 2.2 & 2.5, see
Appendix). In areas which continue to be fished, pink sea fans continue to be mostly
absent.
Similarly, populations of the sea squirt Phallusia mammilata had significantly
different abundances between treatment and area (P < 0.05 PERMANOVA,
Appendix A) and showed no apparent change in fished areas, nor within tows to the
far western area of the New Closure (Figures 2.2 & 2.6, Appendix A). Increases in
abundance of this species however, appear to be occurring further east in the bay
within the New Closure (Figures 2.2 & 2.6, see Appendix).
Figure 2.6: Mean abundance (number of individuals) of Phallusia mammillata populations in
Lyme Bay. Graphs represent abundance in different areas as determined in Figure 2.4. Error
bars are Standard Error

Without appropriate post hoc tests, it is too early to draw any conclusions, but, on the
basis of this investigatory dataset, there is likely to be an emerging trend for some
species towards „recovery‟. Although this is not statistically demonstrated here, there
may also be a geographic effect, in that some species are showing apparent
recovery in the east, but not in the west.
The need for ongoing monitoring is clear, these emerging trends may be the
beginning of a recovery phase, or they may not. We will not know for possibly several
more years, so the opportunity exists for further benthic monitoring to provide the first
robust data on recovery of such temperature reefs that will be vital to inform future
closures.
2.3.2 Random quadrat and fixed transect diver survey
Preliminary analysis has been completed and initial results are presented below.
Statistical analysis has not yet been conducted due to time constraints and therefore
only basic observations can be presented at this stage.
Figure 2.7 shows mean abundance and standard deviation for the six target species
recorded by belt transects at sites within Open Controls, New Closures and Closed
Controls in 2008, 2009 and 2010.
a) Open controls

b) New closure
c) Closed controls
Figure 2.7: Mean abundance of target species from belt transects for 2008, 2009 and 2010 for
sites a) within the open controls, b) new closure and c) closed controls. Error bars are
standard deviation

These initial observations reveal that in the open controls, species abundance is low.
P. foliacea is the most abundant species, and with the exception of A. digitatum
which has a very low abundance for all three years, no other species is present
consistently across sampling seasons. However, with the exception of C. celata in
2008 in the new closure, all six target species are present for all years in the new
closure and closed controls.
Repeated measures ANOVA will be used to look at the statistical significance of the
data and allow trends to be examined, and full results and analyses will be presented
in the final report.

Part 3: Field Surveys of reef associated nekton
3.1 Introduction
In this study, we used the well established methods of static baited video sampling
(e.g. Stobart et al. 2007) to quantify the diversity and structure of nektonic and mobile
benthic faunal assemblages. The specific objectives were:
(1) To establish baited video sampling stations for time-series monitoring of changes
in species abundance and assemblage structure over time
(2) To quantify differences between nektonic and mobile benthic species and
assemblages between different treatment types, as defined in Part 3.
(3) To quantify seasonal differences between nektonic and mobile benthic species
and assemblages, in the context of different treatments (Attrill et al., 2009).
3.2 Methods
The 2010 sampling followed the methods detailed in Attrill et al. (2009).
Figure 3.1: Location of sites for baited video sampling

Six sites were surveyed per treatment (CC, NC & NOC) giving a total of eighteen,
and each site consisted of 3 replicates (Figure 3.1).
Data collection is now completed for this work (Table 3.1) and analysis is underway.
Full methods and analysis for 2009 are presented in the 2009 Annual Report (Attrill
et al, 2009). Findings confirmed that the baited video method is capable of detecting
changes between treatments, and analysis of the species and higher taxonomic
group levels showed that there are distinct suites of species characteristic of
impacted or un-impacted sites (Attrill et al., 2009).
Table 3.1: Fieldwork dates for Baited Underwater Video 2009 - 2010
Date Purpose Status
2009
29.03.09 – 03.04.09 Baited Underwater Video Completed
28.07.09 – 02.08.09 Baited Underwater Video Completed
2010
29.03.10 – 13.04.10 Baited Underwater Video Completed
12.07.10 – 29.07.10 Baited Underwater Video Completed
Analysis of the 2010 data will allow these trends to be further examined, and will
provide an understanding of differences between nekton and benthic mobile species
in terms of species diversity, abundance and assemblage structure between
seasons, (spring, March, and summer, July), spatial treatment differences (CC, NC
and OC), and temporal treatment differences which will show how the response
variables have changed between 2009 and 2010 within treatments. If positive
temporal differences are detected in the NC and CC, but not the OC, then we will be
able to draw positive conclusions regarding the success of the SI for the recovery of
mobile species associated with the sea bed in Lyme Bay.

Part 4: Scallops
4.1 Introduction At the start of this project it was asked that we undertake a scallop spat study to
understand whether the SI will affect king scallop Pecten maximus populations over
time. The study was commissioned too late in the year to set up scallop spat
collectors and after some consideration it was also thought that the amount of effort
necessary to detect this change far exceeded this project. Additionally, genetic
analysis, to determine different scallop populations and to quantify where spat were
coming from and going to, and scallop collection up and down the coast from Lyme
Bay would need to be undertaken.
As a compromise it was agreed that instead we would refocus the objective to
concentrate on the adult populations and begin to look for differences in scallops
inside and outside of the box using divers to collect them. The health of scallop
populations could then be assessed and any changes over time detected.
To make this economically feasible (as it was not part of the original study plan),
dives which were necessary to collect scallops were incorporated into the quadrat
work undertaken by Colin Munro during the first week of August 2009 (Attrill et al.,
2009).
Here we present the scallop collection methods to quantify changes in scallop
populations as a result of the cessation of scallop dredging in the Lyme Bay SI. The
analyses and results will be presented in the Final Report.
4.2 Methods
Surveys to compare scallop populations were conducted over two consecutive
summers (2009 and 2010). Scallop populations were measured in three of the four
treatment areas, at sites as determined by the diver surveys (Figure 4.1).
(1) New closure (previously fished, now closed to mobile ground gear)
(2) Closed controls (previously unfished under a voluntary agreement,
continuing to be unfished)
(3) Near open controls (previously fished, continuing to be fished, < 5km from
closure boundary)

Figure 4.1: Map showing the location of scallop survey sites during the 2010 field season
Sampling was undertaken by the dive team using SCUBA (nitrox), alongside the
divers survey work from the vessel “Miss Pattie”. A shot line was deployed within a
200 m radius of the permanent markers at each station to ensure that scallop work
and diver survey work remained separate. Two divers then deployed a 10 m transect
north from the shot (replicate 1) with 1 diver length between the shot and the start of
the transect to ensure independence of the replicates. A 2 m pole was held
perpendicular to the transect line between the divers to standardise the area from
where the scallops were collected (Figure 4.2). Every P. maximus found in the 2 m x
10 m transect was collected. This was then repeated east, south and west of the
shot, with the scallops from each transect collected in different bags, giving a total of
4 replicates per site (Figure 4.2).

Figure 4.2: Diagram detailing the survey method for scallop collection (not to scale)
The scallops collected were measured at the surface for width, length (Figure 4.3a)
and height (highest point on upper shell to lowest point on lower shell). They were
then aged by counting their growth rings, and damage to their shells was recorded
(present/absent).
Figure 4.3: Photographs of P. maximus showing a) dimensions used for width and height
measurements, and b) clear growth rings on a 3 year old specimen
The age of P. maximus is determined by counting rings that are laid down annually
(Allison et al., 1994). A thumb placed at the hinge end of the shell represents one
a) b)
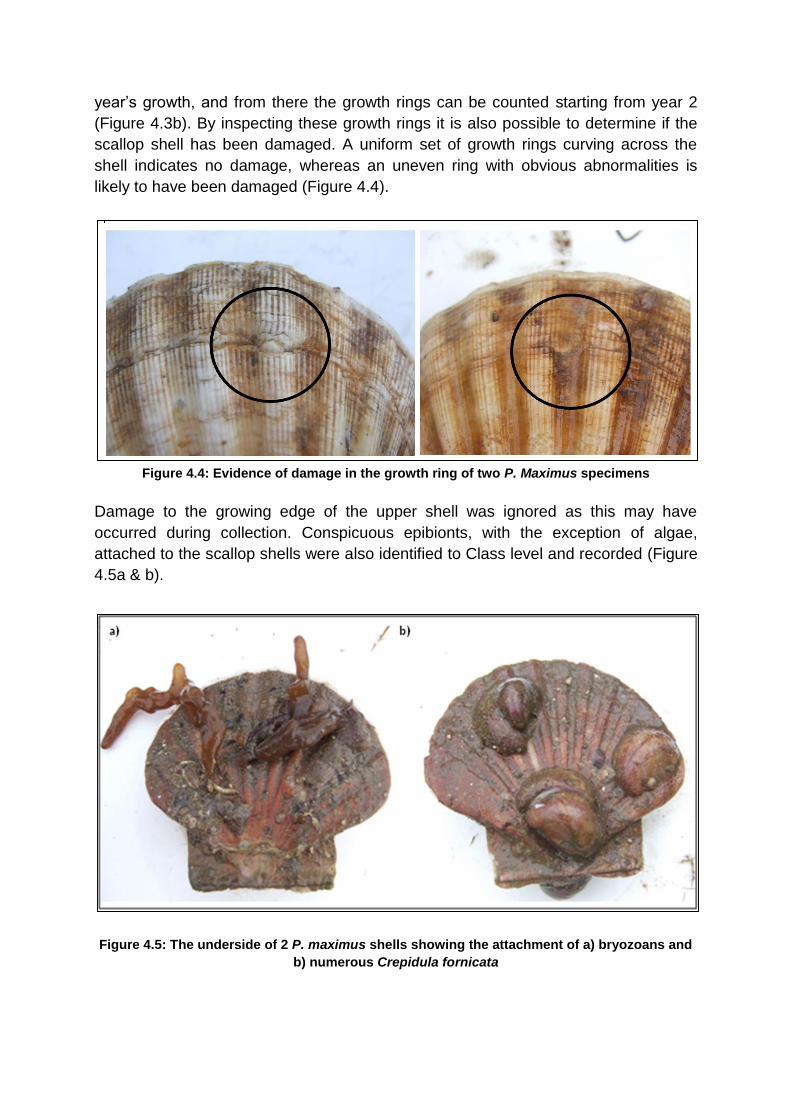
year‟s growth, and from there the growth rings can be counted starting from year 2
(Figure 4.3b). By inspecting these growth rings it is also possible to determine if the
scallop shell has been damaged. A uniform set of growth rings curving across the
shell indicates no damage, whereas an uneven ring with obvious abnormalities is
likely to have been damaged (Figure 4.4).
Figure 4.4: Evidence of damage in the growth ring of two P. Maximus specimens
Damage to the growing edge of the upper shell was ignored as this may have
occurred during collection. Conspicuous epibionts, with the exception of algae,
attached to the scallop shells were also identified to Class level and recorded (Figure
4.5a & b).
Figure 4.5: The underside of 2 P. maximus shells showing the attachment of a) bryozoans and
b) numerous Crepidula fornicata

A subsample of 4 individuals from each transect was sacrificed so that total body
mass and gonad weight could be measured. All other scallops were returned at sea.
Prior to weighing the whole scallop any large aggregations of Crepidula fornicata
were removed, but all other epibionts were left on the shell.
Each scallop was opened by cutting the adductor muscle from the lower shell, the
internal organs were removed and the gonad was cut anterior to the foot and
subsequently weighed (Figure 4.6a & b).
Figure 4.6: P. maximus a) after lower shell has been removed and b) showing where the gonad
was cut prior to weighing (dotted line) and the location of the foot.
4.3 Data analysis
Data collection is now complete and analysis is underway. This will be reported in full
in the Final Report in March 2011 and will include the scallop abundance data
derived from the towed video footage.

Part 5: Socio-economic implications
5.1 Introduction
As conservation theory and practice moves away from excluding resource users and
towards creating partnerships with them, it is becoming increasingly clear that
conservation of marine ecosystems is as much about understanding people as it is
about understanding ecological processes. Social and economic factors can
influence whether and how individuals and communities exploit resources or
cooperate to conserve them. Integrating high quality social science at conservation
sites can help to adapt and refine management strategies to reflect the needs and
desires of the stakeholders. It also enables the selection of strategies that are
appropriate for local conditions, and ensures that scarce resources are used more
wisely by targeting specific strategies at the segments of the population where they
are most needed. Objective 7 therefore focuses on the socio-economic implications
of the 60 nm2 closure in Lyme Bay to scallop dredging and bottom trawling.
The specific objectives of this socio-economic assessment were to:
(1) Quantify the socio-economic changes resulting from the closure for:
a. Fishermen, such as diversification and gear changes, changes in areas
fished, landings and fishing effort;
b. Tourism and recreational activities;
c. Supporting industries e.g. fish merchants and processors; and
d. Enforcement agencies
(2) Examine the perceptions, and changes in attitudes to the closed area amongst
local and wider communities
5.2 Methods
The socio-economic impacts of the closure on the various stakeholder groups have
been assessed using a combination of primary and secondary data.
5.2.1 Primary data
Primary data collection has mainly employed surveys. Seven questionnaires have
been developed and used to obtain socio-economic details of the main user groups
of Lyme Bay including commercial fishermen, sea anglers, dive businesses, divers,

charter boat operators, owners of local hotels and fish merchants. A combination of
interview methods has been used to collect data on costs, income and perceptions of
the various stakeholders, including online surveys, face-to-face, postal and telephone
interviews. A full explanation of the methods used to survey each stakeholder
category and the selection of respondents is presented in our earlier report (Mangi et
al., 2009). During the second phase of the survey which was completed in April this
year (2010), we invited the same people to participate as in the first survey i.e. 157
commercial fishermen, 10 dive businesses, 57 charter operators, 62 UK angling
clubs, 180 dive clubs, 68 local hotels and 7 fish processors.
Data analyses have focused on comparing results of the first survey which was
conducted immediately after the closure was implemented, and the second survey
that was conducted one year later. Given that only demersal mobile gear is restricted
in the closed area, analyses have been completed with data pooled into either towed
or static gear types. Data on the perceptions of fishermen towards changes in
income, costs, travel time to fishing sites, and fishing duration are reported based on
the proportion of fishermen who participated in the survey.
We have also completed interviews with various stakeholder groups (including static
and towed gear fishermen, sea anglers, charter boat operators, dive businesses and
divers) aimed at assessing the social impacts of the closure. The focus of these has
been changes in stakeholder behaviours and conflicts that could be attributed to the
closure.
5.2.2 Secondary data
Data on the volume of species landed by different gear types have been obtained
from the MMO for each vessel that has fished in ICES statistical rectangles 30E6 and
30E7 from 2005 to 2009 (for a map on the ICES rectangles and position of closure
please see our earlier report Mangi et al 2009). The catch data includes the wet
weight and value of landings reported by fishermen and fish merchants to the MMO
at various ports around the South West of England. We understand that these data
could be underestimating the actual landings and fishing effort since a high
proportion of inshore fishing activities do not report their catches. We have, however,
used these data sets as they present the official landings and fishing effort.
Based on information from enforcement agencies and data on sightings collected by
the DSFC using their patrol boat, daily catches for each vessel were matched to the
corresponding location of the vessel on the date when fishing was done. Officers of
the DSFC patrol the waters around the coast of Devon to monitor byelaws and in the
process record positions of fishing vessels within the 6 mile limit. The assumption
was that the catch of each vessel came from the location at which the vessel had
been sighted. This is not true for all vessels especially the big ones and therefore

was only applied to vessels that were sighted and those that the DSFC officers were
sure that they would only fish in certain areas e.g. because they were less than 10m
and would therefore only fish up to the 2 mile limit. This underestimates the value of
catches coming from the various areas but because we could not get disaggregated
data using a combination of expert judgements (officers from SFCs), the sightings
data (air, navy patrol and SFCs patrol boat) together with the landings data has
allowed us to make such comparisons. This is however a first step in this analysis
and will be improved as more information becomes available. The fishing locations
were categorised as either inside or outside the closed area and the value of
landings from each were then plotted and compared based on the gear types used.
To study changes in fishing effort following the closure, the number of vessels and
number of trips made per month was used.
To explore changes in areas fished, data on sightings of fishing vessels have been
obtained from the DSFC and the MMO. These data are based on sightings made via
surveillance aircraft and patrol boats. Air and sea surveillance for the closed area
follows an enforcement procedure which confirms the exact position of the vessel
and its observed activity to a level of evidence that is sufficient for prosecution if
appropriate. The sightings data set includes the position of the vessel (latitude and
longitude), the activity (fishing or steaming) and the ICES rectangle used for all
vessels (both under and over 15 m).
Sightings data from 2005 to 2009 were imported into ArcGIS and overlaid on a base
map of the Lyme Bay area. Only vessels sighted fishing were mapped according to
the fishing gear used whilst vessels sighted steaming were removed from the
analysis. Annual comparisons from 2005-2009 (using a July to June year) were
made based on grouped sightings data to reflect annual variation before and after the
closure.
Data on the costs of enforcing the closure restrictions have been obtained from the
MMO and DSFC. Enforcement costs were gathered from the deployment of
surveillance aircraft and Royal Navy fisheries protection vessels by the MMO, and a
patrol vessel by DSFC. At the time of reporting, no infringements of the Lyme Bay
closed area have been detected by the enforcing authorities.
5.3 Main results
5.3.1 Impacts on commercial fishermen
a) Diversification and gear changes
Four fishermen indicated that they have changed gear as a result of the closure. The
majority are still using their preferred gear type while two fishermen have changed

gear type, but not as a consequence of the closure. For example, one sold his fishing
vessel because of restrictions to catch quotas. During the social interviews however,
some fishermen suggested that the number that have changed gear may possibly be
as high as nine or ten. We are currently investigating this issue further.
b) Perceived changes to costs and incomes
The majority of fishermen (73 %) who use towed gear claim that their income has
decreased (Table 5.1). This is a view shared by 40 % of static gear fishermen, while
52 % of claim that fishing incomes have remained at similar levels to before the
closure (Table 5.1). Between 68 and 83 % of all fishermen in both surveys claimed
that total costs have increased (Table 5.1).
The reasons provided for this increase include a reduction in scalloping, an increase
in fuel costs, and increased duration of fishing. Static gear fishermen also claim that
the fall in income is due to the displacement of towed gear fishermen into fishing
grounds traditionally used by static gear fishermen. Another reason given was that
the quality of scallops harvested from outside the closed area is lower and hence
they fetch lower prices. Over 75% of towed gear fishermen have seen increases in
the time taken to travel to fishing sites, while most of the static gear fishermen have
seen no change as their fishing grounds have remained the same (Table 5.1).
Table 5.1: Perceived percentage change in income, total costs, travel time to fishing sites,
number of fishing trips made and trip duration for towed and static gear fishermen a)
immediately after the closure (towed, n = 15, static, n = 25), and b) one year after closure
(towed, n = 12, static, n = 18) in Lyme Bay
a) Immediately after closure
Perceived changes to: Gear Increased
(%)
Decreased
(%) Same (%)
No response
(%)
Income Towed 0 73 20 7
Static 4 40 52 4
Total costs Towed 73 0 7 20
Static 68 0 28 4
Travel time to fishing sites Towed 80 0 13 7
Static 16 4 76 4
Number of trips per month Towed 13 0 87 0
Static 4 4 76 16
Fishing duration Towed 67 0 20 13
Static 28 4 64 4

b) One year after closure
Perceived changes to: Gear Increased
(%)
Decreased
(%) Same (%)
No response
(%)
Income Towed 0 83 8 8
Static 6 44 39 11
Total costs Towed 83 8 0 8
Static 78 0 11 11
Travel time to fishing sites Towed 75 0 8 17
Static 17 0 50 33
Number of trips per month Towed 0 17 75 8
Static 0 11 89 0
Fishing duration Towed 50 25 8 17
Static 28 6 50 17
Both towed and static gear fishermen still make the same number of fishing trips per
month, but fishing duration has increased for most towed gear fishermen due to the
need to access more distant fishing sites (Table 5.1). Fishermen were asked if they
had any other sources of income in order to determine their level of dependence on
fishing, in particular fishing in Lyme Bay. Most of them claimed that they had no other
income and attributed 98 to 100 % of their monthly income to fishing in Lyme Bay.
c) Changes in wet weight and value of landings
The value of landings for static gear fishermen from July 2007 to June 2008 (one
year before the closure) was very similar to the value of landings from July 2008 to
July 2009 (one year after the closure) at around £2.2 million (Figure 5.1b). Similarly,
the total value landed by mobile gear including scallop dredging one year before the
closure was very similar to the value of landings one year after the closure at £1.1
million.

Figure 5.1: Comparisons based on a) wet weight, and b) value of landings one year before and
one year after the closure for all species landed by static gear (pots, nets), towed gear (scallop
dredgers and demersal trawlers), and scallops from vessels that had fished in ICES rectangles
30E6 and 30E7
Landings for scallops indicate a 26.7 % increase from £560,610 the year before
closure to £710,844 afterwards (Figure 5.1b). These landings data reveal that the
majority of the catches for both static and towed gear fishermen have been coming
from outside the closed area (Figure 5.2).
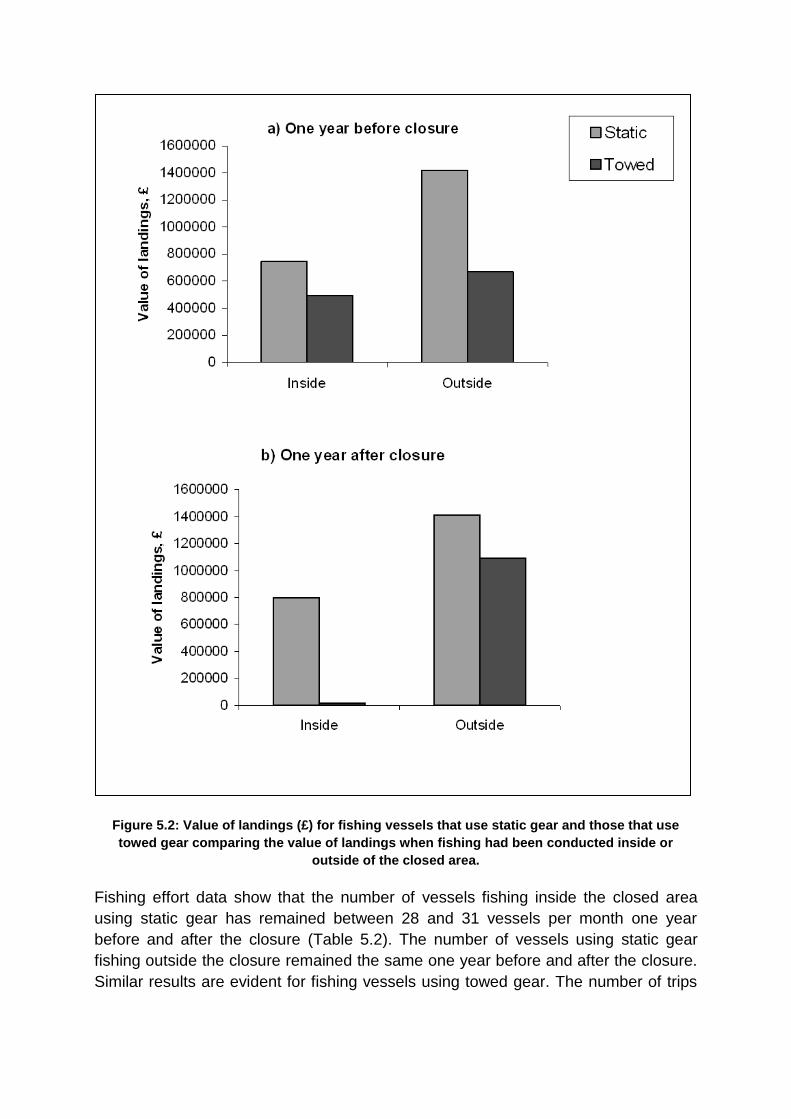
Figure 5.2: Value of landings (£) for fishing vessels that use static gear and those that use
towed gear comparing the value of landings when fishing had been conducted inside or
outside of the closed area.
Fishing effort data show that the number of vessels fishing inside the closed area
using static gear has remained between 28 and 31 vessels per month one year
before and after the closure (Table 5.2). The number of vessels using static gear
fishing outside the closure remained the same one year before and after the closure.
Similar results are evident for fishing vessels using towed gear. The number of trips
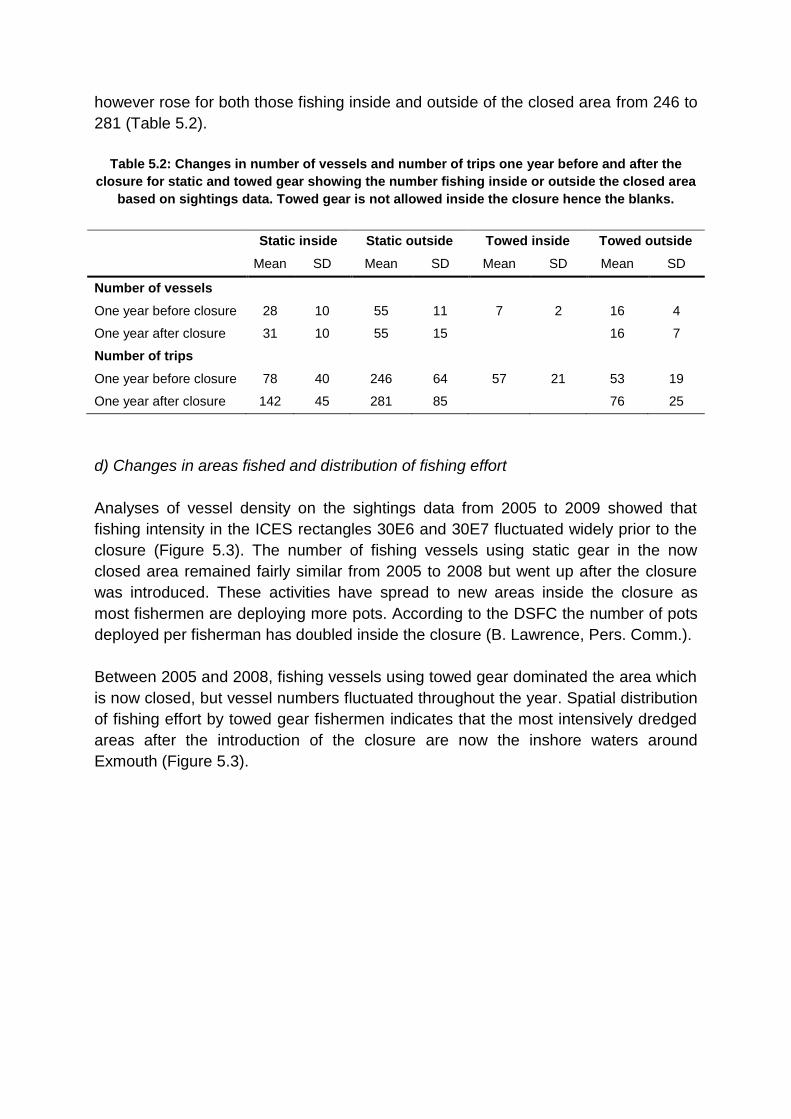
however rose for both those fishing inside and outside of the closed area from 246 to
281 (Table 5.2).
Table 5.2: Changes in number of vessels and number of trips one year before and after the
closure for static and towed gear showing the number fishing inside or outside the closed area
based on sightings data. Towed gear is not allowed inside the closure hence the blanks.
Static inside Static outside Towed inside Towed outside
Mean SD Mean SD Mean SD Mean SD
Number of vessels
One year before closure 28 10 55 11 7 2 16 4
One year after closure 31 10 55 15 16 7
Number of trips
One year before closure 78 40 246 64 57 21 53 19
One year after closure 142 45 281 85 76 25
d) Changes in areas fished and distribution of fishing effort
Analyses of vessel density on the sightings data from 2005 to 2009 showed that
fishing intensity in the ICES rectangles 30E6 and 30E7 fluctuated widely prior to the
closure (Figure 5.3). The number of fishing vessels using static gear in the now
closed area remained fairly similar from 2005 to 2008 but went up after the closure
was introduced. These activities have spread to new areas inside the closure as
most fishermen are deploying more pots. According to the DSFC the number of pots
deployed per fisherman has doubled inside the closure (B. Lawrence, Pers. Comm.).
Between 2005 and 2008, fishing vessels using towed gear dominated the area which
is now closed, but vessel numbers fluctuated throughout the year. Spatial distribution
of fishing effort by towed gear fishermen indicates that the most intensively dredged
areas after the introduction of the closure are now the inshore waters around
Exmouth (Figure 5.3).

a) Static gear
b) Towed gear
Figure 5.3: Raw sightings data records from 2005-2009 collected by DSFC for a) static, & b)
towed. Positions are patrol boat sightings normalised with patrol boat effort. Dates clockwise
from top left: Jan 05–June 06, July 07–June 08, July 06–June 07 & July 08–Dec 09
Point density analysis shows that this area was popular with scallop dredgers before
the closure, and after the closure it has experienced a considerable increase in the
number of towed gear vessels. Views from static gear fishermen indicate that the
increased fishing effort within the fishing grounds west of Lyme Bay is causing
conflicts with static gear fishermen, who regard this area as their traditional fishing
ground.
5.3.2 Changes for divers
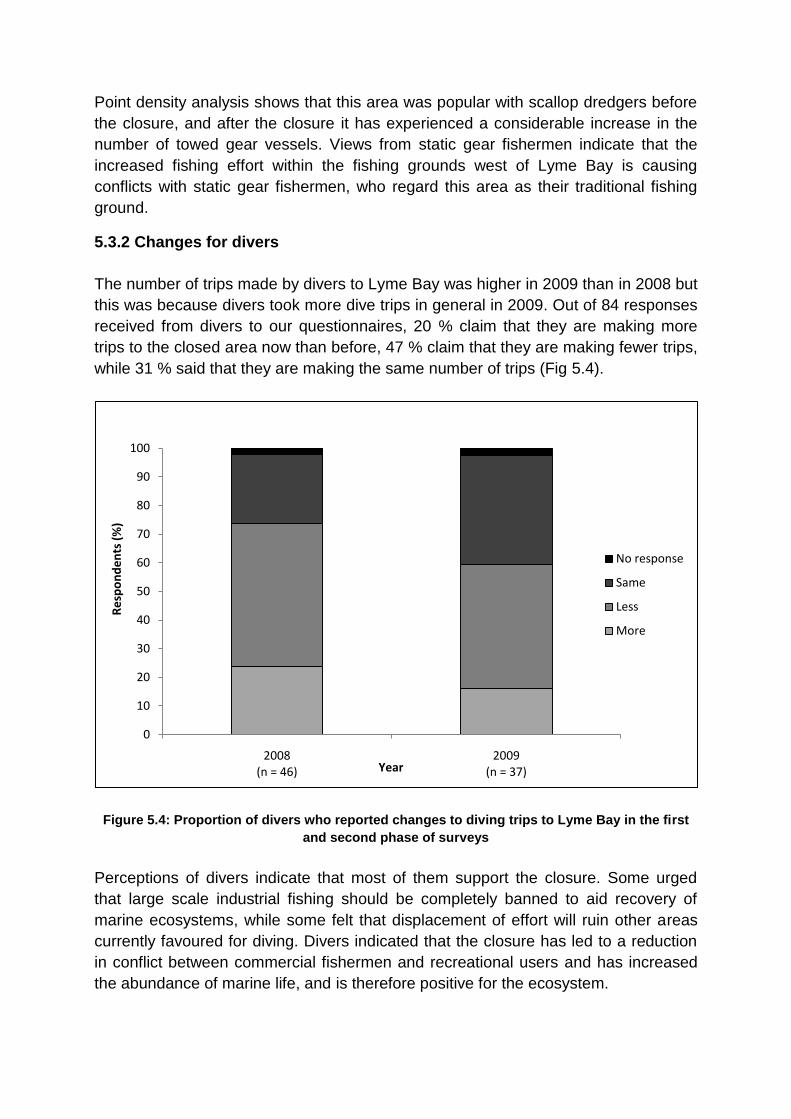
The number of trips made by divers to Lyme Bay was higher in 2009 than in 2008 but
this was because divers took more dive trips in general in 2009. Out of 84 responses
received from divers to our questionnaires, 20 % claim that they are making more
trips to the closed area now than before, 47 % claim that they are making fewer trips,
while 31 % said that they are making the same number of trips (Fig 5.4).
Figure 5.4: Proportion of divers who reported changes to diving trips to Lyme Bay in the first
and second phase of surveys
Perceptions of divers indicate that most of them support the closure. Some urged
that large scale industrial fishing should be completely banned to aid recovery of
marine ecosystems, while some felt that displacement of effort will ruin other areas
currently favoured for diving. Divers indicated that the closure has led to a reduction
in conflict between commercial fishermen and recreational users and has increased
the abundance of marine life, and is therefore positive for the ecosystem.
0
10
20
30
40
50
60
70
80
90
100
2008 (n = 46)
2009 (n = 37)
Re
spo
nd
en
ts (
%)
Year
No response
Same
Less
More

5.3.3 Changes for dive businesses
Changes in turnover, number of divers on trips, number of staff and number of
students taught as indicated by dive businesses are presented in Figure 5.5. Dive
business owners stated that as yearly changes are influenced by weather conditions,
recession and expansion of business it is hard to attribute changes to the closure.
Figure 5.5: Changes in various aspects of dive businesses comparing responses for the first
and second surveys
Perceptions and attitudes of most dive business owners indicate that they support
the closed area policy. They claimed that it has led to an increase in environmental
awareness locally, has long term advantages to fish stocks, and should increase
diver numbers. One respondent was still not aware that the closed area existed.
5.3.4 Changes for charter boat operators
In both 2008 and 2009 the majority of people hiring charter boats were sea anglers
(Fig 5.6). There was a large increase in the number of charters hired for trips into the
closed area in 2009 (Fig 5.7). Charter boat operators however, reported little change
as a consequence of the closure. They attribute most of the changes to an increase
in fuel costs, poor weather, recession or business expansion. Charter boat operators
have mixed opinions, but generally are in support of the closure for conservation
reasons. However, they feel that it has to be done right, and some were worried
about the effects of the closure on fishermen‟s livelihoods.

Figure 5.6: Number of trips made by charter boat operators in 2008 and 2009 for angling, diving
and other activities
Figure 5.7: Response from charter boat operators on the location of charter operations in 2008
and 2009
0
40
80
120
160
200
2008 (n = 16)
2009 (n = 9)
2008 (n = 5)
2009 (n = 2)
2008 (n = 9)
2009 (n = 2)
Angling Diving Other
Nu
mb
er
of
char
ters
Charter type
0
50
100
150
200
250
2008 (n = 16)
2009 (n = 9)
2008 (n = 16)
2009 (n = 9)
2008 (n = 16)
2009 (n = 9)
Outside Lyme Bay Outside Closed Area Inside Closed Area
Nu
mb
er
of
char
ters
Location

5.3.5 Changes for sea anglers
Sea anglers had mixed opinions towards the closure. Those who fish within the
closed area reported improvements in their catches, while those who fish outside
have seen no benefits. All sea anglers interviewed were particularly concerned over
the enforcement of the closure. None had changed the frequency of their angling
activities.
5.3.6 Changes for fish processors and merchants
During the first round of interviews, fish processors and merchants claimed that they
had been heavily impacted by the closure. The main impacts they felt included a
decrease in volume of scallops purchased, increased haulage costs from sourcing
scallops from more distant areas and purchasing low quality scallops (Table 5.3).
Table 5.3: Relative importance (%) of the main impacts reported by fish merchants. Blank cells
mean that the impact was not mentioned in the second survey i.e. one year after closure.
(Respondents include a total of seven key fish merchants from Devon and Dorset)
Main impacts felt Immediately
after closure
One year
after closure
Decline in number of boats landing scallops hence sourcing
fewer scallops from Brixham market 27
Decrease in quality of scallops and subsequent decrease in
customer satisfaction 20
Increase in haulage coats from sourcing scallops from more
distant areas 7 10
Loss of trade 13
Buying scallops from bigger boats that fish a more distant
locations 7 10
Closure has had no effect on business 13 25
No change in the quality of scallops 20
Fishing boats are fishing in other areas such that the volume of
scallops reaching the market has not changed 15
Sourcing scallops from same boats as before the closure 13 20
Our main concern is for the fishermen as we source scallops
from other areas they cannot 35
During the second survey however, most fish merchants claimed that there were no
major impacts that they could attribute to the closure. The majority claimed that the
closure has had little impact on their businesses. They had seen no change in the
quality of scallops purchased and felt that the reduced volumes of purchases are part
of seasonal cycles and not necessarily due to the closure. Most are still sourcing

scallops from the same boats that now fish in more distant areas. Most fish
processors and merchants claimed that they were not experiencing major impacts
but were concerned that the fishermen were being heavily impacted by the closure.
However, one fish merchant claimed that they have had to change the way they buy
scallops (i.e. through the market) which is more unreliable and that they have had to
change the focus of their business to compensate for their inability to meet contracts:
they recently lost a contract to supply scallops to a major retailer.
5.3.7 Local hotel owners
Local hotel owners provided mixed comments, with some completely against the
closure, saying that it aims at protecting sea fans that only a few people will ever see
while ruining people‟s incomes. Others were in support and felt that improved
biodiversity will lead to tourism benefits, and that the closure illustrates a green
image of Dorset and Devon which should increase tourism.
5.4 Enforcement of closure
Risk based enforcement activity was and continues to be undertaken by the MMO
and other enforcement agencies including Devon and Southern SFCs. Enforcement
officers have not sighted any prohibited vessels operating in the closed area illegally,
but there have been sightings of vessels operating close to the boundaries of the
area or transiting through it. Concerns were received by the MMO from a number of
parties in the general area that illegal fishing was taking place. These took the form
of correspondence from a local wildlife trust and some anonymous complaints. The
local SFCs received similar complaints. There were also a small number of reports of
loss of static fishing gear, a possible indicator that it may have been towed away by
trawl gear. However, these were investigated and no infringements were evident.
5.5 Discussion
The establishment of the closed area has affected various activities in Lyme Bay and
imposed a number of costs and benefits on the stakeholders. We have examined the
initial impacts of the closure on seven stakeholder groups including commercial
fishermen, fish merchants, sea anglers, divers, dive businesses, local hotel owners,
and charter operators in order to evaluate the changes that have occurred one year
after its establishment. The results indicate that impacts on fishermen differ
according to gear type and the fishing location used. Most static gear fishermen who
fish within the closure have seen an increase in fishing effort mostly because they
have been able to increase the number of crab and whelk pots they deploy.

The effects of the closure on static gear fishermen who fish outside the closure has
been reported in the form of increased conflicts with towed gear fishermen who now
fish regularly in their traditional grounds. Fishermen using towed gear have also been
impacted as they have been forced to find other fishing grounds outside the closure.
Despite the impacts felt by the fishermen, analyses of landings data (ICES rectangles
30E6 and 30E7) indicate that the introduction of the closed area has so far had
minimal impacts on the average incomes and profits of fishermen and fish
merchants. It is worth noting that although the landings dataset used is from official
sources, it does not contain all the catches as a proportion of landings is not declared
to the authorities. In addition, most recreational users have seen few changes to their
daily activities in Lyme Bay indicating that the introduction of the closure has had
minimal impacts to all stakeholder groups. This conclusion, however, is based on
preliminary findings and reflects a short-term view as the impacts of the closure of
are likely to be felt for many years. This is the view shared by most fishermen, fish
merchants and recreational users who stated that the impacts of the closure are yet
to be fully realized.

Part 6: Conclusions and programme for future work
6.1 Predicting the effects of fishery area closures on long lived sessile species
The main findings of this work to date show that the majority of species investigated
were found to be slow growing with prolonged maturation. Over 66 % have no
regeneration capacity, and their regeneration is dependent on larval dispersal. The
literature search has revealed a lack of published studies that meet the search
criteria, highlighting the importance of this work in improving the understanding of the
effects of fishery closures, and the recovery and sensitivity of sessile benthic species.
6.2 Field surveys of benthic species and assemblages
Survey work has now been successfully completed giving a comprehensive three
year dataset from which it will be possible to appropriately assess the effect of the SI
on benthic species in Lyme Bay over the two years that it has been in place.
Preliminary analysis of the diver belt transects has identified species whose
abundance differs between treatment types and years. Differences are more
apparent from investigatory analysis of the completed video transect data for the
predetermined indicator species which has revealed statistically significant
differences between treatments, areas and years for some species. There is likely to
be an emerging trend of recovery which will be further investigated using post hoc
tests in the Final Report. However, the need for ongoing monitoring is clear as these
trends may be the beginning of a recovery phase, or they may not, and this is
something that may not be conclusively proven for several years.
6.3 Field surveys of reef associated nekton
Baited underwater video surveys were successfully completed in spring and summer
2010 and data analysis is underway. This will allow the trends identified in 2009 to be
further examined and will provide an understanding of the differences between
nekton and benthic mobile species in terms of species diversity, abundance, and
assemblage structure between seasons, spatial treatment differences and temporal
treatment differences.
6.4 Scallops
Scallop populations were surveyed in 2009 and 2010 using the sites pre-determined
by the random quadrat and fixed diver surveys. Data analysis is underway and will be

reported in the Final Report. This will include the total abundance of scallops, as
derived from the towed video footage.
6.5 Socio-economics Two rounds of socio-economic questionnaires and the social impact survey have
now been completed, and the third round of questionnaires will begin in December
2010. To date, preliminary results have shown that impacts have been minimal for all
stakeholders except fishermen. Impacts to fishermen have varied depending on gear
type and fishing location. Static gear fishermen have seen benefits inside the closure
as they are able to increase the number of crab and whelk pots used, however, those
outside the closure have noticed an increase in conflict between static and mobile
gear fishermen due to the displacement of boats using mobile fishing gear. However,
landings data reveals that impacts on average income and profits have been
minimal. All stakeholders were of the opinion that the full impact of the closure has
yet to be realised.
6.6 Program for 2010-2011
With the exception of the socio-economic study, all survey work is now complete.
Table 6.1 shows the remaining project deadlines, and work for 2010 and 2011 will
focus on these. The Final Report will report fully on all objectives and include detailed
analysis of the data that has been collected to allow conclusions to be drawn.
Table 6.1: Reporting deadlines for the 2010-2011 period
Date Report
31/10/2010 Objective 4 Long Lived Species Report
13/12/2010 Stakeholder Workshop Report
16/02/2011 Final Project Report Draft
30/03/2011 Final Project Report
Work for Objective 4 is now complete and is currently being compiled into a detailed
report, due at the end of October (Table 6.1). The monitoring results from the towed
video and frame grab analysis will be used to put these findings into context in the
Final Report, enabling a comparison of the actual results with the expected
recoverability and sensitivity of the indicator species. This can then be used to inform
future management of the effectiveness of MPAs at delivering conservation gains.
Analysis of towed video is underway, with work on 2009 and 2010 frame grabs still to
be completed. Once analysed, these will allow a detailed comparison of species

composition before and after the closure was implemented and detailed information
on the recovery of species within the closure. This work will also enable an
estimation of recovery time and can be used to inform management of the likely
scale of recovery of species on hard substrate in UK waters.
The socio-economic team will be holding a stakeholder workshop later in the year
and will begin their final round of questionnaires in December 2010. Once these are
completed final data analysis will begin, allowing the impact of the closure over the 3
years post closure to be determined.
6.7 Conclusion
To date, this project has identified some evidence for the recovery of long lived
sessile species within the 60 nm2 closure in Lyme Bay. Preliminary analysis of towed
video has revealed a statistically significant effect of treatment with sites within the
new closure significantly more abundant in sessile benthic organisms than those
outside. Furthermore, socio-economic analysis has shown that although there have
been some negative effects of the closure on fishermen, overall the impact on
stakeholders has been minimal, and landings data has revealed that incomes and
profits have not been greatly impacted.
However, despite these positive trends, the time period of this project is not adequate
to allow the recovery of long lived sessile indicator species to be determined. The
results we have to date show an emerging trend that may be the beginning of a
recovery phase, but continued monitoring is essential to determine whether this is the
case. We suggest that the benthic video monitoring should be continued for a further
three years to allow robust data on recovery to be obtained.

Acknowledgements
We thank the large number of people who collected the information which appears in
this report, and those who assisted in fieldwork, analysis and production.
References
Allison, E.H., Wilson, U.A.W, and Brand, A.R. (2004). Age determination and the first
growth ring in North Irish Sea populations of the scallop, Pecten maximus (L.).
Molluscan Studies, 60, 91 -95
Attrill, M.J., Fowell, S., Hall-Spencer, J., Hattam, C., Jackson, E.L., Langmead, O.,
Mangi, S., Marshall, C., Munro, C., Rees, S., Rodwell, L., Sheehan, E.V., Stevens,
T.F. (2009). Lyme Bay – a case-study: measuring recovery of benthic species;
assessing potential “spillover” effects and socio-economic changes, Annual Report,
December 2009. Report to the Department of Environment, Food and Rural Affairs
from the University of Plymouth-led consortium. Plymouth: University of Plymouth
Enterprise Ltd. 70 pages.
Hoskin, M.G., Coleman, R.A., von Carlhausen, L. (2009). Ecological effects of the
Lundy No-Take Zone: the first 5 years (2003-2007). Final Report to Natural England,
DEFRA & WWF-UK
Guidetti, P. (2007). Potential for Marine Reserves to Cause Community-Wide
Changes beyond Their Boundaries. Conservation Biology, 21, 540-545
Mangi, S., Hattam, C., Rodwell, L., Rees, S., Stehfest, K., (2009) Initial report on
socio-economic costs of closing Lyme Bay to scallop dredging and heavy trawling
gear. Report to the Department of Environment, Food and Rural Affairs from the
Plymouth Marine Laboratories and the University of Plymouth-led consortium.
Plymouth: University of Plymouth Enterprise Ltd. 50 pp. Defra Contract No. MB101
Sheehan, E.V., Stevens, T.F. & Attrill, M.J. (in revision). A quantitative, non-
destructive methodology for habitat characterization and benthic monitoring at
offshore renewable energy developments. Submitted to PLos ONE
Stobart, B., García-Charton, J.A., Espejo, C., Rochel, E., Goñi, R., Reñones, O.,
Herrero, A., Crec'hriou, R., Polti, S., Marcos, C., Planes, S., Pérez-Ruzafa, A. (2007)
A baited underwater video technique to assess shallow-water Mediterranean fish
assemblages: Methodological evaluation. Journal of Experimental Marine Biology
and Ecology, 345. 158-174

Appendix Investigatory PERMANOVA analysis of towed video transects for 13 indicator species. Analysis
is by treatment (4 x Closed Control; 4 x New Closure; 3 x Near Open Control; 3 x Far Open
Control with four replicate tows per treatment), year (2008, 2009, 2010) and Area (1, 2, 3 & 4). *
denotes a significant result (p < 0.05)
Species Source df SS MS Pseudo-
F P(perm)
Pecten maximus Year 2 5205.10 2602.60 2.02 0.11
Treatment 3 7384.40 2461.50 0.87 0.49
Area(Treatment) 11 34105.00 3100.50 3.06 0.00*
Year x Treatment 6 10395.00 1732.50 1.35 0.24
Year x Area(Treatment)** 20 25731.00 1286.50 1.27 0.12
Residual 125 126740.00 1013.90
Total 167 212560.00
Phallusia mammillata
Year 2 14093.00 7046.60 2.47 0.05
Treatment 3 88501.00 29500.00 5.18 0.01*
Area(Treatment) 11 68710.00 6246.40 2.89 0.00*
Year x Treatment 6 19948.00 3324.70 1.16 0.33
Year x Area(Treatment)** 20 57214.00 2860.70 1.32 0.08
Residual 125 270330.00 2162.60
Total 167 524810.00
Pentapora foliacea
Year 2 2503.80 1251.90 0.58 0.75
Treatment 3 91254.00 30418.00 5.83 0.00*
Area(Treatment) 11 62305.00 5664.10 2.41 0.00*
Year x Treatment 6 17690.00 2948.30 1.37 0.19
Year x Area(Treatment)** 20 43140.00 2157.00 0.92 0.62
Residual 125 293340.00 2346.70
Total 167 518080.00
Aiptasia mutabilis
Year 2 39140.00 19570.00 6.79 0.00*
Treatment 3 41722.00 13907.00 3.67 0.01*
Area(Treatment) 11 44821.00 4074.60 2.12 0.00*
Year x Treatment 6 33395.00 5565.90 1.93 0.08
Year x Area(Treatment)** 20 57745.00 2887.20 1.50 0.03*
Residual 125 240150.00 1921.20
Total 167 477830.00
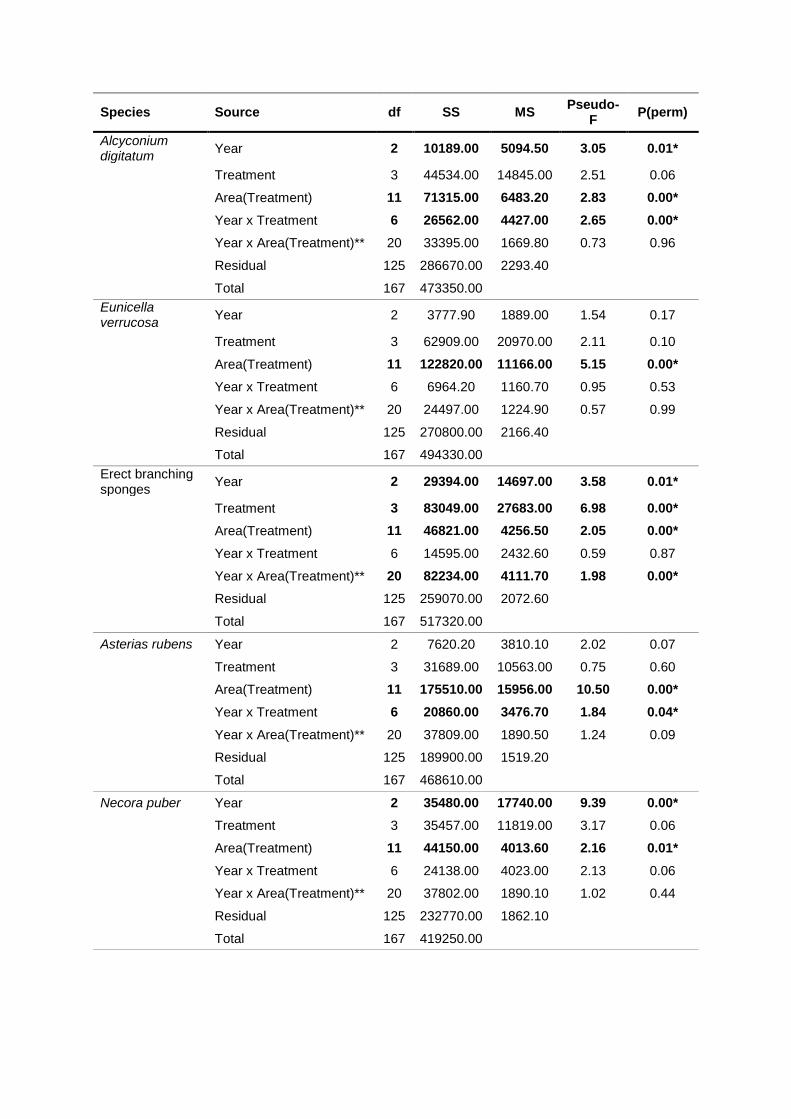
Species Source df SS MS Pseudo-
F P(perm)
Alcyconium digitatum
Year 2 10189.00 5094.50 3.05 0.01*
Treatment 3 44534.00 14845.00 2.51 0.06
Area(Treatment) 11 71315.00 6483.20 2.83 0.00*
Year x Treatment 6 26562.00 4427.00 2.65 0.00*
Year x Area(Treatment)** 20 33395.00 1669.80 0.73 0.96
Residual 125 286670.00 2293.40
Total 167 473350.00
Eunicella verrucosa
Year 2 3777.90 1889.00 1.54 0.17
Treatment 3 62909.00 20970.00 2.11 0.10
Area(Treatment) 11 122820.00 11166.00 5.15 0.00*
Year x Treatment 6 6964.20 1160.70 0.95 0.53
Year x Area(Treatment)** 20 24497.00 1224.90 0.57 0.99
Residual 125 270800.00 2166.40
Total 167 494330.00
Erect branching sponges
Year 2 29394.00 14697.00 3.58 0.01*
Treatment 3 83049.00 27683.00 6.98 0.00*
Area(Treatment) 11 46821.00 4256.50 2.05 0.00*
Year x Treatment 6 14595.00 2432.60 0.59 0.87
Year x Area(Treatment)** 20 82234.00 4111.70 1.98 0.00*
Residual 125 259070.00 2072.60
Total 167 517320.00
Asterias rubens Year 2 7620.20 3810.10 2.02 0.07
Treatment 3 31689.00 10563.00 0.75 0.60
Area(Treatment) 11 175510.00 15956.00 10.50 0.00*
Year x Treatment 6 20860.00 3476.70 1.84 0.04*
Year x Area(Treatment)** 20 37809.00 1890.50 1.24 0.09
Residual 125 189900.00 1519.20
Total 167 468610.00
Necora puber Year 2 35480.00 17740.00 9.39 0.00*
Treatment 3 35457.00 11819.00 3.17 0.06
Area(Treatment) 11 44150.00 4013.60 2.16 0.01*
Year x Treatment 6 24138.00 4023.00 2.13 0.06
Year x Area(Treatment)** 20 37802.00 1890.10 1.02 0.44
Residual 125 232770.00 1862.10
Total 167 419250.00

Species Source df SS MS Pseudo-
F P(perm)
Cancer pagurus Year 2 3691.60 1845.80 0.87 0.44
Treatment 3 11902.00 3967.30 2.18 0.13
Area(Treatment) 11 20374.00 1852.20 1.14 0.32
Year x Treatment 6 12393.00 2065.50 0.97 0.48
Year x Area(Treatment)** 20 42617.00 2130.80 1.31 0.16
Residual 125 203490.00 1627.90
Total 167 298120.00
Thorogobius ephippiatus
Year 2 10808.00 5403.80 8.41 0.00*
Treatment 3 1299.90 433.31 0.73 0.52
Area(Treatment) 11 6431.30 584.67 0.94 0.48
Year x Treatment 6 1708.50 284.75 0.44 0.87
Year x Area(Treatment)** 20 12855.00 642.75 1.03 0.41
Residual 125 77716.00 621.73
Total 167 112220.00
Ciona intestinalis
Year 2 34820.00 17410.00 2.75 0.05
Treatment 3 26195.00 8731.50 2.28 0.10
Area(Treatment) 11 45335.00 4121.40 2.08 0.00*
Year x Treatment 6 35128.00 5854.70 0.93 0.52
Year x Area(Treatment)** 20 126770.00 6338.30 3.20 0.00*
Residual 125 247690.00 1981.60
Total 167 530720.00
Aequipecten opercularis
Year 2 14453.00 7226.30 1.88 0.12
Treatment 3 51951.00 17317.00 2.07 0.07
Area(Treatment) 11 102330.00 9302.70 4.22 0.00*
Year x Treatment 6 16017.00 2669.60 0.70 0.78
Year x Area(Treatment)** 20 76844.00 3842.20 1.74 0.00*
Residual 125 275530.00 2204.20
Total 167 540200.00