LX-1309 Lux Meter Manual - ATP Instrumentation · LX-1309 Lux Meter Manual 4 3 2 1 BAT APO kLux kFc...
8
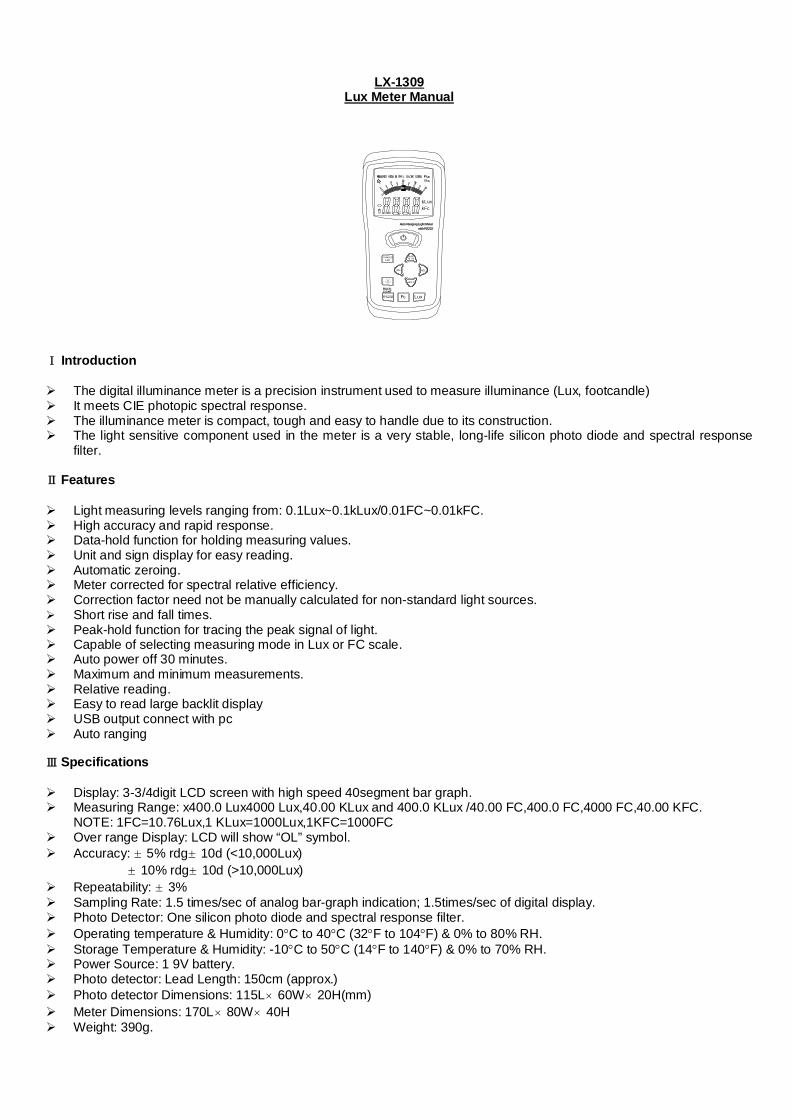
LX-1309 Lux Meter Manual 1 4 3 2 kLux kFc DISABLE HOLD RS232 Fc Lux MAX HOLD REL M I N A PO Auto Ranging Light Meter LIGHT BACK- with RS232 Ⅰ Introduction The digital illuminance meter is a precision instrument used to measure illuminance (Lux, footcandle) It meets CIE photopic spectral response. The illuminance meter is compact, tough and easy to handle due to its construction. The light sensitive component used in the meter is a very stable, long-life silicon photo diode and spectral response filter. Ⅱ Features Light measuring levels ranging from: 0.1Lux~0.1kLux/0.01FC~0.01kFC. High accuracy and rapid response. Data-hold function for holding measuring values. Unit and sign display for easy reading. Automatic zeroing. Meter corrected for spectral relative efficiency. Correction factor need not be manually calculated for non-standard light sources. Short rise and fall times. Peak-hold function for tracing the peak signal of light. Capable of selecting measuring mode in Lux or FC scale. Auto power off 30 minutes. Maximum and minimum measurements. Relative reading. Easy to read large backlit display USB output connect with pc Auto ranging Ⅲ Specifications Display: 3-3/4digit LCD screen with high speed 40segment bar graph. Measuring Range: x400.0 Lux4000 Lux,40.00 KLux and 400.0 KLux /40.00 FC,400.0 FC,4000 FC,40.00 KFC. NOTE: 1FC=10.76Lux,1 KLux=1000Lux,1KFC=1000FC Over range Display: LCD will show “OL” symbol. Accuracy: ±5% rdg±10d (<10,000Lux) ±10% rdg±10d (>10,000Lux) Repeatability: ±3% Sampling Rate: 1.5 times/sec of analog bar-graph indication; 1.5times/sec of digital display. Photo Detector: One silicon photo diode and spectral response filter. Operating temperature & Humidity: 0C to 40C (32F to 104F) & 0% to 80% RH. Storage Temperature & Humidity: -10C to 50C (14F to 140F) & 0% to 70% RH. Power Source: 1 9V battery. Photo detector: Lead Length: 150cm (approx.) Photo detector Dimensions: 115L×60W×20H(mm) Meter Dimensions: 170L×80W×40H Weight: 390g.
Transcript of LX-1309 Lux Meter Manual - ATP Instrumentation · LX-1309 Lux Meter Manual 4 3 2 1 BAT APO kLux kFc...
LX-1309 Lux Meter Manual
14 3 2
BAT
APO
kLuxkFc
1
2
DISABLE
HOLD
RS232 Fc Lux
MAX
HOLDREL
M I NAPO
Auto Ranging Light Meter
LIGHTBACK-
with RS232
Ⅰ Introduction The digital illuminance meter is a precision instrument used to measure illuminance (Lux, footcandle) It meets CIE photopic spectral response. The illuminance meter is compact, tough and easy to handle due to its construction. The light sensitive component used in the meter is a very stable, long-life silicon photo diode and spectral response
filter. Ⅱ Features Light measuring levels ranging from: 0.1Lux~0.1kLux/0.01FC~0.01kFC. High accuracy and rapid response. Data-hold function for holding measuring values. Unit and sign display for easy reading. Automatic zeroing. Meter corrected for spectral relative efficiency. Correction factor need not be manually calculated for non-standard light sources. Short rise and fall times. Peak-hold function for tracing the peak signal of light. Capable of selecting measuring mode in Lux or FC scale. Auto power off 30 minutes. Maximum and minimum measurements. Relative reading. Easy to read large backlit display USB output connect with pc Auto ranging Ⅲ Specifications Display: 3-3/4digit LCD screen with high speed 40segment bar graph. Measuring Range: x400.0 Lux4000 Lux,40.00 KLux and 400.0 KLux /40.00 FC,400.0 FC,4000 FC,40.00 KFC.
NOTE: 1FC=10.76Lux,1 KLux=1000Lux,1KFC=1000FC Over range Display: LCD will show “OL” symbol. Accuracy: ±5% rdg±10d (<10,000Lux)
±10% rdg±10d (>10,000Lux) Repeatability: ±3% Sampling Rate: 1.5 times/sec of analog bar-graph indication; 1.5times/sec of digital display. Photo Detector: One silicon photo diode and spectral response filter. Operating temperature & Humidity: 0C to 40C (32F to 104F) & 0% to 80% RH. Storage Temperature & Humidity: -10C to 50C (14F to 140F) & 0% to 70% RH. Power Source: 1 9V battery. Photo detector: Lead Length: 150cm (approx.) Photo detector Dimensions: 115L×60W×20H(mm) Meter Dimensions: 170L×80W×40H Weight: 390g.
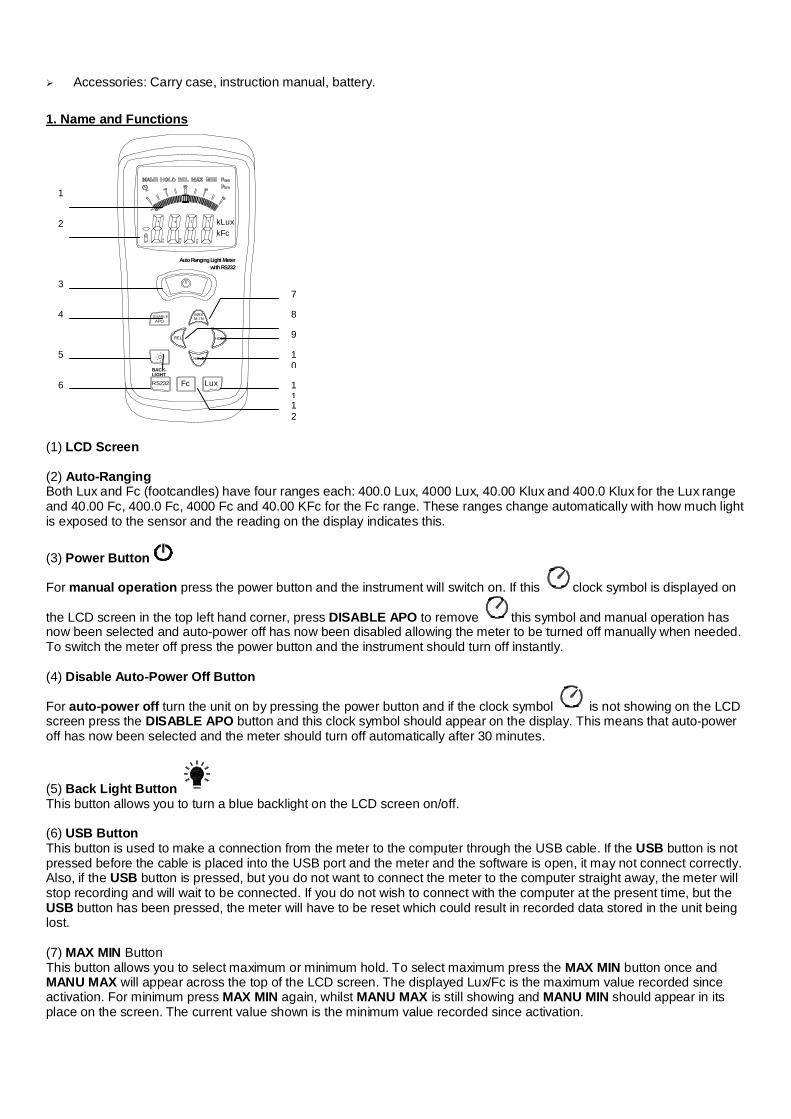
Accessories: Carry case, instruction manual, battery. 1. Name and Functions
14 3 2
BAT
APO
kLuxkFc
1
2
DISABLE
HOLD
RS232 Fc Lux
MAX
HOLDREL
M I NAPO
Auto Ranging Light Meter
LIGHTBACK-
with RS232
(1) LCD Screen
(2) Auto-Ranging Both Lux and Fc (footcandles) have four ranges each: 400.0 Lux, 4000 Lux, 40.00 Klux and 400.0 Klux for the Lux range and 40.00 Fc, 400.0 Fc, 4000 Fc and 40.00 KFc for the Fc range. These ranges change automatically with how much light is exposed to the sensor and the reading on the display indicates this. (3) Power Button
For manual operation press the power button and the instrument will switch on. If this clock symbol is displayed on
the LCD screen in the top left hand corner, press DISABLE APO to remove this symbol and manual operation has now been selected and auto-power off has now been disabled allowing the meter to be turned off manually when needed. To switch the meter off press the power button and the instrument should turn off instantly. (4) Disable Auto-Power Off Button
For auto-power off turn the unit on by pressing the power button and if the clock symbol is not showing on the LCD screen press the DISABLE APO button and this clock symbol should appear on the display. This means that auto-power off has now been selected and the meter should turn off automatically after 30 minutes.
(5) Back Light Button This button allows you to turn a blue backlight on the LCD screen on/off. (6) USB Button This button is used to make a connection from the meter to the computer through the USB cable. If the USB button is not pressed before the cable is placed into the USB port and the meter and the software is open, it may not connect correctly. Also, if the USB button is pressed, but you do not want to connect the meter to the computer straight away, the meter will stop recording and will wait to be connected. If you do not wish to connect with the computer at the present time, but the USB button has been pressed, the meter will have to be reset which could result in recorded data stored in the unit being lost. (7) MAX MIN Button This button allows you to select maximum or minimum hold. To select maximum press the MAX MIN button once and MANU MAX will appear across the top of the LCD screen. The displayed Lux/Fc is the maximum value recorded since activation. For minimum press MAX MIN again, whilst MANU MAX is still showing and MANU MIN should appear in its place on the screen. The current value shown is the minimum value recorded since activation.
7
8
9
10
12
1
2
3
4
5
6
11
(8)REL Button To view the relative reading press REL and MANU REL will appear at the top of the screen. The relative reading shown is the difference between the first and second reading detected by the meter. For example: if the first reading taken was 60 and the second was 40, then the relative reading on the meter would be 20. So with every two readings detected by the meter, the instrument will work out the difference and change automatically. (9) PEAK Hold Button This button allows you to select maximum or minimum peak hold. To view the maximum peak hold press the PEAK button once and across the top of the LCD screen MANU PMAX will appear. The reading currently displayed on the meter is the maximum peak in the results since the meter was activated. To select minimum peak hold press the PEAK button again, whilst MANU PMAX is still showing, and MANU PMIN will appear. The reading displayed will be the minimum peak in the results since the meter was activated. (10) HOLD Button Press HOLD to freeze a current reading on the display. Press HOLD again to release. (11) Lux Button To select readings in Lux press the Lux button and Lux will appear next to the value. (12) Fc Button To select Fc press Fc and Fc will appear next to the reading on the display. 1footcandle=10.76 Lux. 2.Operating Instructions (1) Turn the meter on using the power button. (2) Select the desired scale either Lux/Fc (3) Remove the protective cap from the light sensor and face the sensor into the light source, in a horizontal position, so that the whole of the sensor is exposed to all the light making sure that the readings taken are accurate. Any other position could corrupt the readings. (4) Read the measurement on the LCD screen. (5) When the instrument is not in use it is important that the protective cap is replaced and the meter is switched off.
(6) Battery Check: When the battery is low in the bottom left hand corner a battery symbol will appear. This is an indicator to let you know that the voltage in the battery is running low and needs to be replaced. If it is not replaced having a low battery can affect how well the unit will work and its efficiency will drop. 3. Maintenance (1) The white plastic disc on the light sensor should be cleaned when necessary with a damp cloth, as any dirt on the sensor could corrupt the readings. (2) The instrument should not be stored where the temperature and humidity is excessively high. Any moisture that gets inside the instrument could damage the components inside the meter and stop the instrument from operating correctly. (3) To ensure that the meter is working correctly it is recommended to have the meter calibrated annually. 4. Recommended Illumination.
LOCATIONS Lux FC
OFFICE
Conference, Reception room 200~750
18~70
Clerical work 700~1,500 65~140 Typing drafting 1,000~2,000 93~186
FACTORY
Visual work at production line 300~750
28~70
Inspection work 750~1,500 70~140 Electronic parts assembly line
1,500~3,000
140~279 Packing work, Entrance passage
150~300
14~28
HOTEL Public room, Cloakroom 100~200 9~18
Reception 200~500 18~47 Cashier 750~1,000 70~93
STORE
Indoors Stairs Corridor 150~200 14~18 Show window, Packing table
750~1,500
70~140 Forefront of show window 1,500~3,000 140~279
HOSPITAL
Sickroom, Warehouse 100~200 9~18 Medical Examination Room
300~750
28~70 Operating room, emergency treatment
750~1,500
70~140
SCHOOL
Auditorium, Indoor Gymnasium 100~300
9~28
Class room 200~750 18~70 Laboratory, Library, Drafting, room
500~1,500
47~140 5. Installing the Software
(1) Start Windows
(2) Insert the CD into the CD drive.
(3) If the InstallShield Wizard does not appear automatically go to START at the bottom of the desktop then Run . . . then browse for 1309 (D :) which is the name of the software you wish to install.
(4) By clicking on 1309 (D :) it will open up the files stored within the CD. Open the SETUP file and follow the instructions to install the software. (5) Once installation is complete you will see a red recycling symbol appear of the desktop with DT 1309 underneath it.
This means that the installation was successful. If you have the SL-8851 or SL-8852 sound level meter installing the software is not necessary because the hardware stored in these meters is the same as the hardware stored in the LX-1309. If you do not have these products, it is necessary to install the hardware as the software will not be ready for use with it. Do not remove the CD even though installation is complete because it is needed for installing the hardware.
6. Installing the Hardware (1) With the CD for installing the software still in the CD drive turn the meter on and plug the meter into the USB port with the USB cable supplied with the meter. (2) At the bottom of the desktop, on the right hand side a message will appear indicating that the computer has detected new hardware in the USB port. If the Found New Hardware Wizard window does not appear, double click on this message and this should open the Hardware Wizard window for you. (3) In this window it will ask you if you would like to connect to Windows Update to search for software. Click ‘No, not this time’ because you already have the software installed and the software disc in the CD drive, then press next. Follow the instructions to install the hardware. In the last window it should say CP2101 USB Composite Device, this means that the first hardware driver has been installed. (4) Click Finish and you will notice that the same Found New Hardware Wizard window will appear on the desktop. Do not press CANCEL, as this window is for installing the second hardware driver. Install this driver in the same way as the
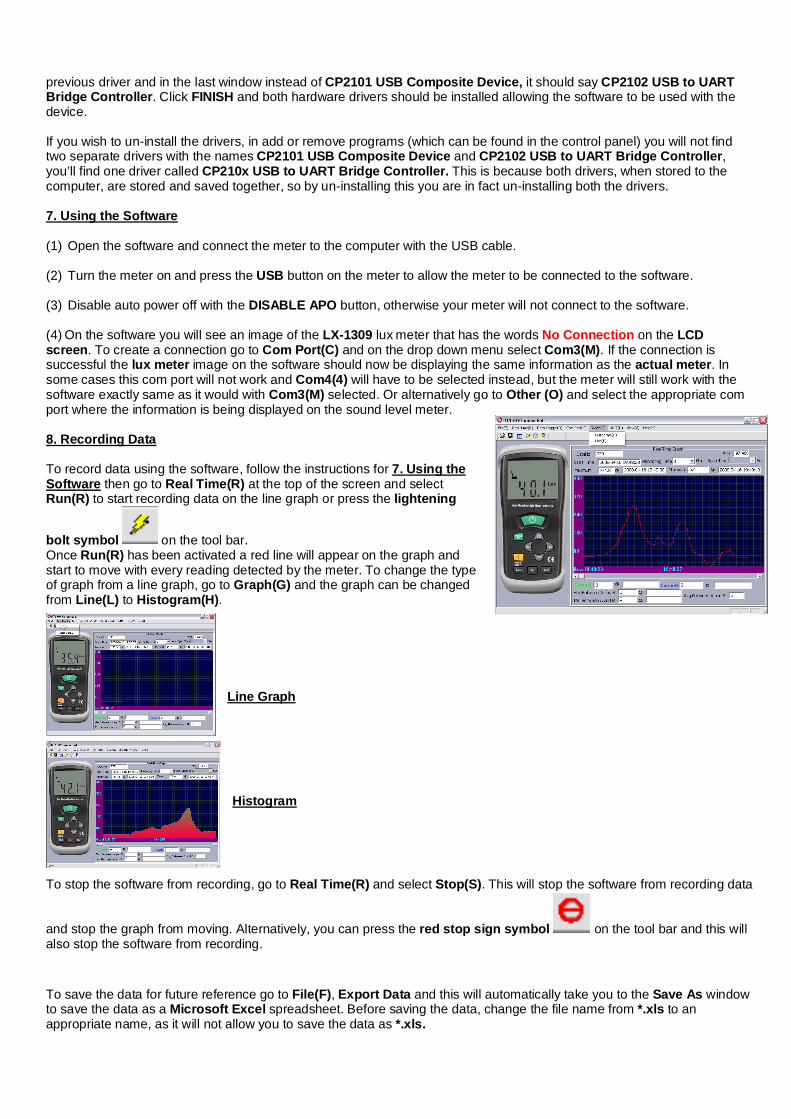
previous driver and in the last window instead of CP2101 USB Composite Device, it should say CP2102 USB to UART Bridge Controller. Click FINISH and both hardware drivers should be installed allowing the software to be used with the device. If you wish to un-install the drivers, in add or remove programs (which can be found in the control panel) you will not find two separate drivers with the names CP2101 USB Composite Device and CP2102 USB to UART Bridge Controller, you’ll find one driver called CP210x USB to UART Bridge Controller. This is because both drivers, when stored to the computer, are stored and saved together, so by un-installing this you are in fact un-installing both the drivers. 7. Using the Software (1) Open the software and connect the meter to the computer with the USB cable. (2) Turn the meter on and press the USB button on the meter to allow the meter to be connected to the software. (3) Disable auto power off with the DISABLE APO button, otherwise your meter will not connect to the software. (4) On the software you will see an image of the LX-1309 lux meter that has the words No Connection on the LCD screen. To create a connection go to Com Port(C) and on the drop down menu select Com3(M). If the connection is successful the lux meter image on the software should now be displaying the same information as the actual meter. In some cases this com port will not work and Com4(4) will have to be selected instead, but the meter will still work with the software exactly same as it would with Com3(M) selected. Or alternatively go to Other (O) and select the appropriate com port where the information is being displayed on the sound level meter. 8. Recording Data To record data using the software, follow the instructions for 7. Using the Software then go to Real Time(R) at the top of the screen and select Run(R) to start recording data on the line graph or press the lightening
bolt symbol on the tool bar. Once Run(R) has been activated a red line will appear on the graph and start to move with every reading detected by the meter. To change the type of graph from a line graph, go to Graph(G) and the graph can be changed from Line(L) to Histogram(H).
Line Graph Histogram
To stop the software from recording, go to Real Time(R) and select Stop(S). This will stop the software from recording data
and stop the graph from moving. Alternatively, you can press the red stop sign symbol on the tool bar and this will also stop the software from recording. To save the data for future reference go to File(F), Export Data and this will automatically take you to the Save As window to save the data as a Microsoft Excel spreadsheet. Before saving the data, change the file name from *.xls to an appropriate name, as it will not allow you to save the data as *.xls.
To save the data as a text file rather than an Excel file, go to File(F), Save and change the file name from *.txt and press
Save. Or alternatively, you can press the floppy disc symbol on the tool bar. 9. Data-logger Window To use the DATALOGGER window you must have saved data stored to your computer from the software, otherwise you will not be able to use this facility. This function allows you to view any saved data as a graph rather then a txt or xls file. To open the DATALOGGER window go to DataLogger(D) at the top of the DT-1309 software and the DATALOGGER window should appear upon the desktop. You will notice that the window will appear to be blank because the data you wish to view needs to be imported from the computer into the software. To import data go to Import Data(I) at the top of the DATALOGGER window and the software will automatically detect data saved in the computer and list them. However, this will only work with data saved as a text file and not a excel file. Click on the data you wish to open and this will automatically import the data to the DATALOGGER window. You will notice that there is no information on the graph. This is because you have not selected the data, on the left hand side of the window that you wish to view. On the left hand side of the DATALOGGER window you will see three of five columns (the other two can be seen by using the scrolling bar at the bottom) that have the headings: Set, DATE, TIME UNIT and NUMS. Highlight the row of information you wish to view in blue by clicking on the row once. With the row still highlighted double click on the row and the data you have selected should appear upon the graph.
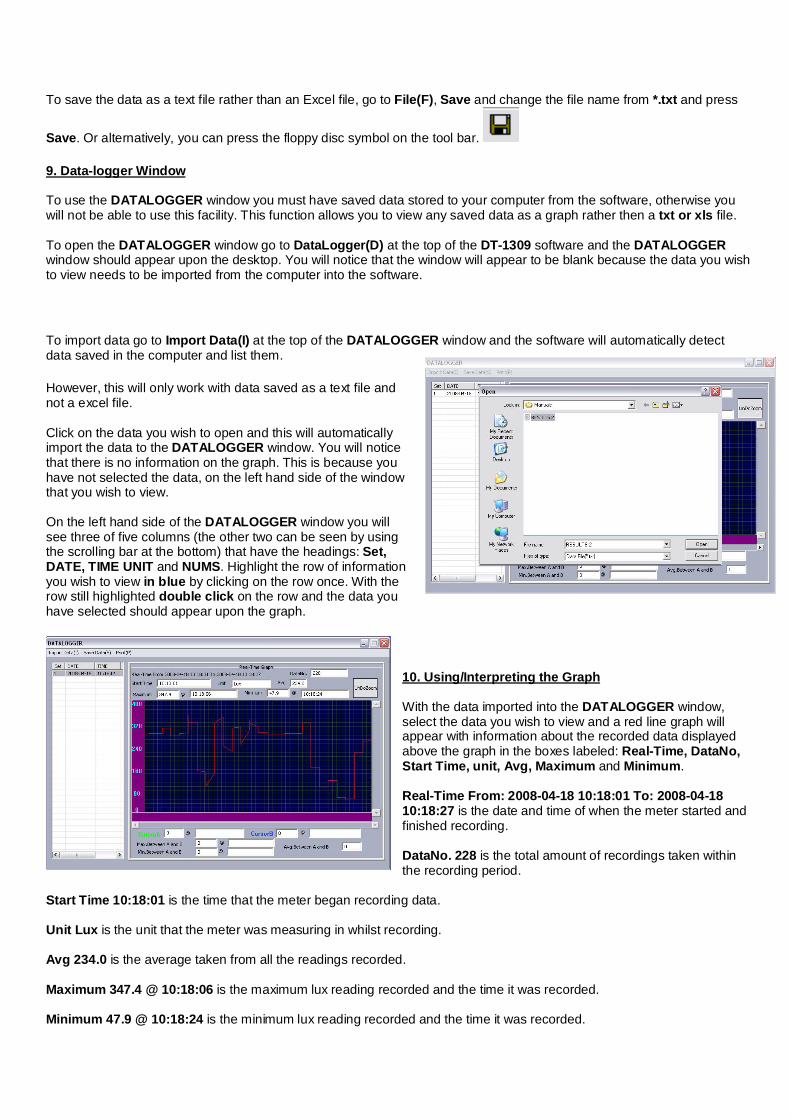
10. Using/Interpreting the Graph With the data imported into the DATALOGGER window, select the data you wish to view and a red line graph will appear with information about the recorded data displayed above the graph in the boxes labeled: Real-Time, DataNo, Start Time, unit, Avg, Maximum and Minimum. Real-Time From: 2008-04-18 10:18:01 To: 2008-04-18 10:18:27 is the date and time of when the meter started and finished recording. DataNo. 228 is the total amount of recordings taken within the recording period.
Start Time 10:18:01 is the time that the meter began recording data. Unit Lux is the unit that the meter was measuring in whilst recording. Avg 234.0 is the average taken from all the readings recorded. Maximum 347.4 @ 10:18:06 is the maximum lux reading recorded and the time it was recorded. Minimum 47.9 @ 10:18:24 is the minimum lux reading recorded and the time it was recorded.
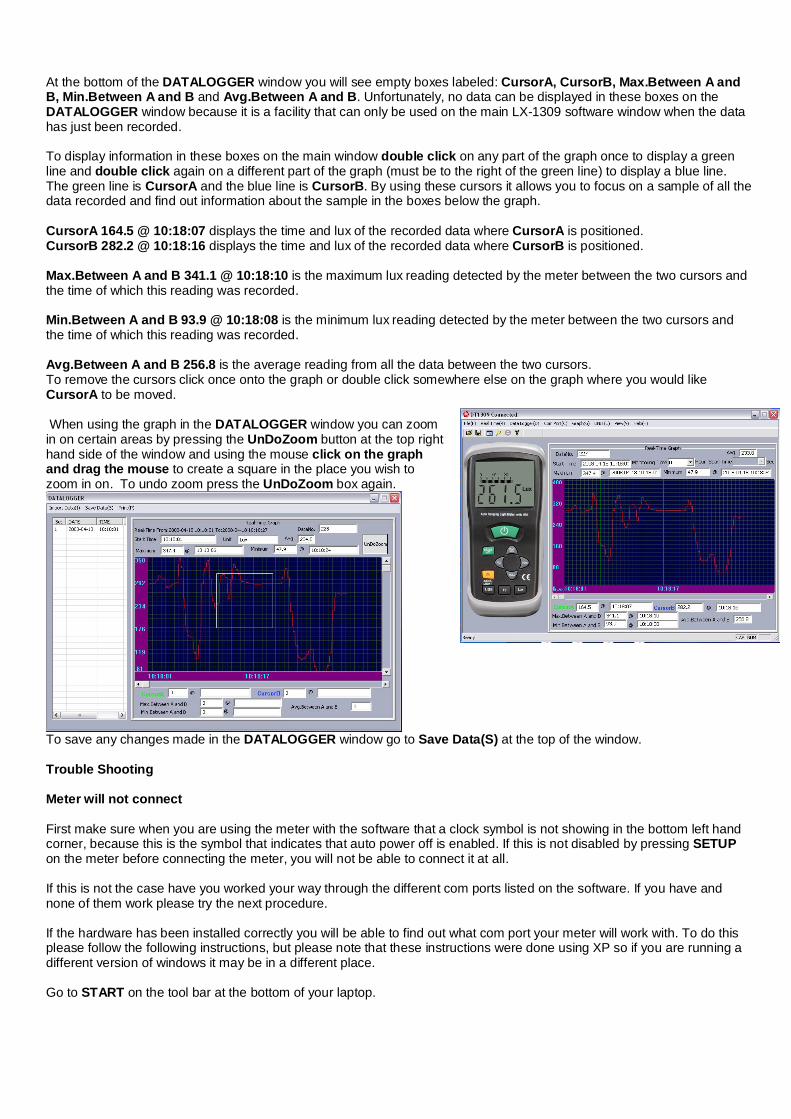
At the bottom of the DATALOGGER window you will see empty boxes labeled: CursorA, CursorB, Max.Between A and B, Min.Between A and B and Avg.Between A and B. Unfortunately, no data can be displayed in these boxes on the DATALOGGER window because it is a facility that can only be used on the main LX-1309 software window when the data has just been recorded. To display information in these boxes on the main window double click on any part of the graph once to display a green line and double click again on a different part of the graph (must be to the right of the green line) to display a blue line. The green line is CursorA and the blue line is CursorB. By using these cursors it allows you to focus on a sample of all the data recorded and find out information about the sample in the boxes below the graph. CursorA 164.5 @ 10:18:07 displays the time and lux of the recorded data where CursorA is positioned. CursorB 282.2 @ 10:18:16 displays the time and lux of the recorded data where CursorB is positioned. Max.Between A and B 341.1 @ 10:18:10 is the maximum lux reading detected by the meter between the two cursors and the time of which this reading was recorded. Min.Between A and B 93.9 @ 10:18:08 is the minimum lux reading detected by the meter between the two cursors and the time of which this reading was recorded. Avg.Between A and B 256.8 is the average reading from all the data between the two cursors. To remove the cursors click once onto the graph or double click somewhere else on the graph where you would like CursorA to be moved. When using the graph in the DATALOGGER window you can zoom in on certain areas by pressing the UnDoZoom button at the top right hand side of the window and using the mouse click on the graph and drag the mouse to create a square in the place you wish to zoom in on. To undo zoom press the UnDoZoom box again.
To save any changes made in the DATALOGGER window go to Save Data(S) at the top of the window. Trouble Shooting Meter will not connect First make sure when you are using the meter with the software that a clock symbol is not showing in the bottom left hand corner, because this is the symbol that indicates that auto power off is enabled. If this is not disabled by pressing SETUP on the meter before connecting the meter, you will not be able to connect it at all. If this is not the case have you worked your way through the different com ports listed on the software. If you have and none of them work please try the next procedure. If the hardware has been installed correctly you will be able to find out what com port your meter will work with. To do this please follow the following instructions, but please note that these instructions were done using XP so if you are running a different version of windows it may be in a different place. Go to START on the tool bar at the bottom of your laptop.

Go to Control Panel and find a computer icon with the word SYSTEM Double click on this icon and at the top of the System Properties window click on the HARDWARE tab, then Device Manager. This will open a window called Device Manager (this window can be seen below):
In the Device Manager list look for Ports (COM & LPT) and click on the + sign next to it to drop down a list of the hardware in your computer and next to each one there will be a COM or LPT number, this tells you which port or LPT it will work with. The name of the hardware you are looking for is CP2101 USB to UART Bridge Controller and next to this there will be a com port number. For example on my computer this hardware will work when com port 3 is selected on the software. If the hardware is not listed, this means that the hardware was not installed correctly. Uninstall the software and see if you can find the hardware listed in the add/remove programs (see below)
If you can see it remove it so you can re-install everything again.
UK Distributor
ATP Instrumentation Ltd Tournament Way
Ivanhoe Industrial Estate Ashby-De-La-Zouch
Leicestershire LE65 2UU
Tel: 01530 566800 Sales 01530 566804 Technical
Fax: 01530 560373
www.atp-instrumentation.co.uk