LWO-RIP-2008-00006, Saltstone Sampling Summary for ...
59
LWO-RIP-2008-00006 Revision 0 SALTSTONE SAMPLING SUMMARY for SEPTEMBER 2008 November 4, 2008 Prepared by: WSRC Site Regulatory Integration & Planning Aiken, SC 29808 Prepared for U.S. Department of Energy Under Contract No. DE-AC09-96SR18500
Transcript of LWO-RIP-2008-00006, Saltstone Sampling Summary for ...

LWO-RIP-2008-00006 Revision 0
SALTSTONE SAMPLING SUMMARY for
SEPTEMBER 2008
November 4, 2008
Prepared by: WSRC Site Regulatory Integration & Planning Aiken, SC 29808
Prepared for U.S. Department of Energy Under Contract No. DE-AC09-96SR18500


Saltstone Core Sampling Summary LWO-RIP-2008-00006 for September 2008 Revision 0 November 4, 2008
Page 3 of 34
TABLE OF CONTENTS TABLE OF CONTENTS................................................................................................................ 3
LIST OF FIGURES ........................................................................................................................ 4
LIST OF TABLES.......................................................................................................................... 4
1.0 Introduction......................................................................................................................... 5
2.0 Pre-Job Planning ................................................................................................................. 5
2.1 Anticipated Saltstone Conditions.................................................................................... 5 2.2 Planned Depth................................................................................................................. 7 2.3 Saltstone Production Facility Data.................................................................................. 9 2.4 Planned Spatial Locations............................................................................................. 10 2.5 Sample Management..................................................................................................... 10 2.6 Mock Up Testing .......................................................................................................... 11 2.7 Video Recording ........................................................................................................... 11 2.8 Work Order Development............................................................................................. 11
3.0 Sample Summaries............................................................................................................ 11
3.1 Core 1............................................................................................................................ 14 3.1.1 Location ................................................................................................................ 14 3.1.2 Weather Conditions .............................................................................................. 15 3.1.3 Core Conditions .................................................................................................... 17
3.2 Core 2............................................................................................................................ 21 3.2.1 Location ................................................................................................................ 22 3.2.2 Weather Conditions .............................................................................................. 22 3.2.3 Core Conditions .................................................................................................... 25
3.3 Core 3............................................................................................................................ 28 3.3.1 Location ................................................................................................................ 29 3.3.2 Weather Conditions .............................................................................................. 29 3.3.3 Core Conditions .................................................................................................... 32
Appendix A: Grout Sampling Surveys ...................................................................................... A-1

Saltstone Core Sampling Summary LWO-RIP-2008-00006 for September 2008 Revision 0 November 4, 2008
Page 4 of 34
LIST OF FIGURES Figure 2.1-1: Cell E, Side View..................................................................................................... 6
Figure 2.1-2: Cell E, 2007 Saltstone Lifts ..................................................................................... 8
Figure 2.4-1: Vault 4, Cell E Coring Locations........................................................................... 10
Figure 3.1-1: Core Location # 1................................................................................................... 14
Figure 3.1-2: Core 1-1 View........................................................................................................ 18
Figure 3.1-3: Core 1-2 View........................................................................................................ 19
Figure 3.1-4: Core 1-3, View 1.................................................................................................... 20
Figure 3.1-5: Core 1-3, View 2.................................................................................................... 21
Figure 3.2-1: Core Location #2.................................................................................................... 22
Figure 3.2-2: Core 2-1 View........................................................................................................ 26
Figure 3.2-3: Core 2-2 View........................................................................................................ 27
Figure 3.2-4: Core 2-3 View........................................................................................................ 28
Figure 3.3-1: Core Location #3.................................................................................................... 29
Figure 3.3-2: Core 3 View ........................................................................................................... 33
LIST OF TABLES Table 2.3-1: Relevant Saltstone Run Worksheet Data................................................................... 9
Table 3.0-1: Saltstone Core Sample Collection Summary Data, September 2008...................... 12
Table 3.1-2: Meteorological Data, September 16, 2008.............................................................. 15
Table 3.2-1: Meteorological Data, September 17, 2008.............................................................. 23
Table 3.3-1: Meteorological Data, September 18, 2008.............................................................. 30

Saltstone Core Sampling Summary LWO-RIP-2008-00006 for September 2008 Revision 0 November 4, 2008
Page 5 of 34
1.0 Introduction Samples of emplaced saltstone are desirable to confirm certain assumptions of properties of the waste form used in the Performance Assessment (PA) and to compare with the properties of saltstone samples prepared in the laboratory. Saltstone currently exists within Saltstone Disposal Facility (SDF) vault 4. The most recent pours are located in cell “D”, but Cell “E” contains saltstone poured in late 2007 which has much lower radiological dose rates. Since cell “E” represents recent, cured, contact handlable, saltstone with minimal ALARA concerns, this cell was selected for sampling.
During the week of September 16, 2008, WSRC performed core drilling of saltstone from cell “E” of vault 4. The intent of this document is to capture information related to the core drilling event including weather conditions at the time of sampling, sample locations and best estimates of sample depths, color, consistency, and radiological survey information.
Since this type of sample collection has not been performed on actual saltstone material prior to this evolution, the initial sampling approach is summarized in the first section of this document to provide context and background of the pre-job planning effort prior to attempting this activity. Each of the Sample Summaries below summarize the data and notes for a specific sample location. Currently, no analytical testing has been performed and no conclusions can be drawn or inferred from the data presented here.
2.0 Pre-Job Planning Planning activities for core drilling involved multiple meetings with Savannah River National Lab (SRNL) Analysts and core drill teams, Site Regulatory Integration and Planning (SRIP), and SDF facility engineering to coordinate analytical requirements with facility implementation. The core boring technique was recognized to be potentially destructive to some or all of the properties of interest. However, from an analytical perspective the most desirable core bore procedure employed the dry (not water lubricant) technique. It was recognized that if dry coring was not successful then wet cores (employing water as a lubricant) would be used, but could significantly alter the properties of interest.
In addition, blast furnace slag is added to the saltstone to enhance its reducing capacity. As oxygen is introduced to the sample from various aspects of the core drilling operation, oxidation of the sample will begin to occur. From an analytical perspective, the sample handling and storage was recognized as a probable source of oxidation and actions to minimize this effect were desirable.
2.1 Anticipated Saltstone Conditions
The targeted saltstone material was emplaced during December 2007 and had undergone at least 90 days of curing at the time of sampling. From camera inspections of the inside of the cell observed by SRIP personnel the surface of the saltstone appeared dry. The anticipated configuration of the vault and saltstone materials are presented in Figure 2.1-1 below.

Saltstone Core Sampling Summary LWO-RIP-2008-00006 for September 2008 Revision 0 November 4, 2008
Page 6 of 34
Figure 2.1-1: Cell E, Side View
Cell D Cell F
Surface Slope Representation(Not to Scale)
19.847
20 20 CORE DRILL REGION
14.1
1.2
6.153
26
98.5 (ID)
1.5
18.347
Note: All dimensions referenced on the diagram are in feet. One inch cell height = 6,048 gallons saltstone.

Saltstone Core Sampling Summary LWO-RIP-2008-00006 for September 2008 Revision 0 November 4, 2008
Page 7 of 34
2.2 Planned Depth Access points to the cell are predominantly by 3” diameter ports located in a grid pattern on the roof. Measurement of critical parameters typically requires a 1 to 2 diameter to length sample dimension. Given the constraints of the access ports, 2 in. diameter by 4 in long cylindrical samples were selected as the target sample dimensions. For this reason, a 2 in. drill bit was selected for the core drilling operation. The initial core depth of 1.5 ft. (or 18 in.) was chosen to provide 3 core sections of 6 in length. This would provide the nominal sample dimensions with some margin in the length. In addition, as indicated in Figure 2.1-2, Cell E saltstone Lifts diagram, drilling a total depth of 18 in. would cross multiple layers of saltstone and may provide insight into possible layering effects.

Saltstone Core Sampling Summary LWO-RIP-2008-00006 for September 2008 Revision 0 November 4, 2008
Page 8 of 34
Figure 2.1-2: Cell E, 2007 Saltstone Lifts
12/16/2007
12/17/2007
12/19/2007
12/20/2007
200
205
210
215
220
225
230
235
240
Grout Lift
Inch
es
Note: The approximate depth of emplaced saltstone from the last 4 Cell E production runs is represented in Figure 2.1-2.

Saltstone Core Sampling Summary LWO-RIP-2008-00006 for September 2008 Revision 0 November 4, 2008
Page 9 of 34
2.3 Saltstone Production Facility Data The parameters that may be measured can be influenced, among other things, by the “recipe” by which the saltstone is made. Variables such as the water-to-premix ratio, the specific gravity of the salt feed solution, the salt solution feed rate, and the composition of the salt solution itself may influence the material properties of saltstone.
In order to capture data relevant to the saltstone core material extracted from the disposal facility, pertinent operational data for the top four lifts of Saltstone in Cell E were obtained from the Saltstone Run Worksheet. The Saltstone Run Worksheet summarizes operational data taken from the facility in a single worksheet and is presented in table 2.3-1, Relevant Saltstone Run Worksheet Data.
Table 2.3-1: Relevant Saltstone Run Worksheet Data
Run Dates Target / Actual / Estimate
12/16/2007 12/17/2007 12/19/2007 12/20/2007
Batch DDA Batch 21 DDA Batch 21 DDA Batch 21 DDA Batch 21
Calc Water Weight % in SFT A 76-80 76-80 76-80 76-80
Flyash (lb / batch) T 2700 2700 2700 2700
Cement (lb / batch) T 600 600 600 600
Slag (lb / batch) T 2700 2700 2700 2700
W/P Ratio T 0.61+/- 0.02 0.61+/- 0.02 0.60+/- 0.02 0.60+/- 0.02
Dry Feed Rate (ton/hr) T 35 +/- .5 T/H 35 +/- .5 T/H 35 +/- .5 T/H 35 +/- .5 T/H
SFT SPG Range T 1.17 – 1.20 1.17 - 1.20 1.17 - 1.20 1.17 – 1.20
Daratard (GPM) A 0.23 0.23 0.23 0.23
Clear Air (GPM) A 0.14 0.14 0.14 0.14
Calc Salt Solution (GPM) A 95.5+/-2 GPM 95.5+/-2 GPM 94.0+/-2 GPM 94.0+/-2 GPM
Grout Flow (GPM) Est 177 177 175 175
1 DDA Batch 2 Salt Solution Analytical Data from WSRC-TR-2008-00080, Zeigler, K. E. and Bibler, N. E, Results for the Third Quarter 2007 Tank 50H WAC Slurry Sample: Chemical and Radionuclide Contaminant Results, Savannah River National Laboratory, Rev. 1, July, 2008

Saltstone Core Sampling Summary LWO-RIP-2008-00006 for September 2008 Revision 0 November 4, 2008
Page 10 of 34
2.4 Planned Spatial Locations Locations selected for core drilling were limited by the ability to access the saltstone from the cell roof. The cell roof contains multiple access ports arranged in a standard grid pattern (shown below). The red circled ports indicate the optimum, planned drill locations. In addition to the port locations, the cell roof contains various operational equipment such as ventilation ducts, electrical conduits and grout lines that either obstruct personnel or drill equipment, or could present safety concerns to the workers. Because of this, the actual drill locations were relocated as indicated by the blue circles presented in Figure 2.4-1.
Figure 2.4-1: Vault 4, Cell E Coring Locations
Three spatial locations were selected ranging from near the center of the cell where the grout enters the cell moving towards the outer wall of the cell, nominally 18 ft. apart. Selecting these spatial locations linearly from center to edge the samples may provide insight into potential effects on the grout as it moves from the center of the cell where it enters toward the wall of the cell.
2.5 Sample Management To identify the nine planned cores a sample identification system was developed in the work documents using a combination of core spatial location and core depth to identify the sample. Thus, the first sample, represented on Figure 2.1-1, Cell E – Side View in red, was collected from sample location 1, depth location 1 and is identified as sample 1-1.

Saltstone Core Sampling Summary LWO-RIP-2008-00006 for September 2008 Revision 0 November 4, 2008
Page 11 of 34
Sample containers were fabricated to minimize the effect of oxidation, as well as enhance the transportability of the samples. These sample containers were essentially stainless steel tubes that could be closed and evacuated to minimize exposure to air. As a consequence of the design, the container provides shielding during handling and transport.
All samples were to be staged in their sample containers on the vault roof until the drilling was complete. The samples containers were to then be shipped together to the SRNL receiving facility.
2.6 Mock Up Testing SRNL personnel involved in the physical core drilling conducted mock up testing in the lab using the drill equipment and saltstone simulants. As a result of this testing, SRNL personnel anticipated that the softer the saltstone the more difficult it would be to remove the core from the drill bit.
2.7 Video Recording Tank farm personnel were contacted to arrange video recording of the coring process under the vault roof. The primary purpose of the video was to provide real time observation of the core drill operations. The video cameras were to be dropped through a roof access point and each core drill recorded for archival.
2.8 Work Order Development Per facility requirements job specific work order 00871023-01 was developed to document planned work activities and provide direction for work in the field.
3.0 Sample Summaries Cores of emplaced saltstone were obtained during the week of September 15, 2008. Critical information related to each core is summarized in Table 3.0-1. More detailed information for individual cores is provided in the rest of Section 3.0.

Saltstone Core Sampling Summary LWO-RIP-2008-00006 for September 2008 Revision 0 November 4, 2008
Page 12 of 34
Table 3.0-1: Saltstone Core Sample Collection Summary Data, September 2008
Core ID Collection Date
Core Depth
(in) Core Conditions Maximum Dose Rates
(mRem/hr)
Maximum Transferable
Contamination Sample Collection Notes
Access Port
Location
Depth Position Length
(in) Drilling
Conditions Color Extremity Skin Whole Body Alpha Beta-
Gamma
1 1 16-Sep-08 0-4 2 Dry Teal 2.5 1 1 <200 40,000
►Material smeared on the drill bit
►Humid Day ►Moisture observed inside
glove bag ►Core material was described as soft, muddy, and crumbly
1 2 16-Sep-08 4-10 6 Dry Teal 2.5 1 1 <200 40,000 Sample is stuck hard within the drill bit
1 3 16-Sep-08 10-14 3 - 4 Wet* Dark Teal 2.5 1 1 <200 40,000
2 1 17-Sep-08 0-6 2 Wet* Dark Teal 3 1 1 <200 80,000 4" of pieces
2 2 17-Sep-08 6-10 3 Wet* Dark Teal 3 1 1 <200 80,000
►1" chunk ►Some pieces fell out of the
bit during retrieval
2 3 17-Sep-08 10-14 4 Wet* Dark Teal 3 1 1 <200 80,000

Saltstone Core Sampling Summary LWO-RIP-2008-00006 for September 2008 Revision 0 November 4, 2008
Page 13 of 34
Table 3.0-1: Saltstone Core Sample Collection Summary Data, September 2008 (Continued)
Core ID Collection Date
Core Depth
(in) Core Conditions Maximum Dose Rates
(mRem/hr)
Maximum Transferable
Contamination Sample Collection Notes
Access Port
Location
Depth Position Length
(in) Drilling
Conditions Color Extremity Skin Whole Body Alpha Beta-
Gamma
3 1 17-Sep-08 0-6 4 Dry** Teal 3 1 1 <200 40,000
►2" of crumbly material ►Appeared similar to day old
concrete with moisture (Mathison)
►Core location 3 was drilled easire than core location 1.
Comparison to location 2 not valid since wet drill technique
was used (drill crew)
3 2 17-Sep-08 6-13 6 Dry** Olive Green 3 1 1 <200 80,000
►Core broke into 2 pieces (4" and 2")
► Easily removed from the bit
► Core location 3 was drilled easire than core location 1.
Comparison to location 2 not valid since wet drill technique
was used (drill crew)
3 3 18-Sep-08 13-20 6 Dry** Olive Green 2.5 1 1 <200 20,000
►Easily removed from the bit
► Core location 3 was drilled easire than core location 1.
Comparison to location 2 not valid since wet drill technique
was used (drill crew) * Wet technique used to facilitate sample removal from drill bit. ** Dry technique requested by SRNL regardless of ability to remove from drill bit.

Saltstone Core Sampling Summary LWO-RIP-2008-00006 for September 2008 Revision 0 November 4, 2008
Page 14 of 34
3.1 Core 1 Cores from locations 1-1 and 1-2 were obtained on Tuesday, September 16, 2008 using the dry core (i.e. without water as a lubricant) technique. The drill team had difficulty removing cores 1-1 and 1-2 from the bit and so Core 1-3 was obtained using the wet technique. All core drilling and sample retrieval occurred during the morning. Radiological Control surveys are included in Appendix A. The general area dose rate for core 1 sample activities was recorded as 7 mRem/Hr. The maximum dose rate obtained from sample material removed from core location 1 was 2.5 mRem/Hr Extremity, 1 mRem/Hr Skin 1 mRem/Hr Whole Body and was found on the drill bit. The maximum transferable contamination levels detected within the glove bag were <200 dpm alpha / 100 cm2 and 40,000 dpm beta-gamma / 100 cm2.
3.1.1 Location Core location 1 is the closest core to the west wall of Vault 4, Cell E. It was approximately 18 ft from the surface of the wall as indicated by the blue circled area in Figure 3.1-1.
Figure 3.1-1: Core Location # 1

Saltstone Core Sampling Summary LWO-RIP-2008-00006 for September 2008 Revision 0 November 4, 2008
Page 15 of 34
3.1.2 Weather Conditions Ambient weather conditions for September 16, 2008 were recorded by the SRNL Atmospheric Technology Center are presented in Table 3.1-2.
Table 3.1-2: Meteorological Data, September 16, 2008
Tower Location
Greenwich Mean Time
Dew Point (F) DQ Temp.
(F) DQ Relative
Humidity (%)
DQ
H 16SEP08:00:00 66.87 G 80.66 G 56 G H 16SEP08:00:15 66.82 G 80.12 G 57.28 G H 16SEP08:00:30 66.48 G 79.68 G 57.61 G H 16SEP08:00:45 66.39 G 79.57 G 56.62 G H 16SEP08:01:00 66.5 G 79.34 G 57.5 G H 16SEP08:01:15 66.46 G 79.1 G 58.08 G H 16SEP08:01:30 66.43 G 78.91 G 58.72 G H 16SEP08:01:45 66.35 G 78.91 G 59.88 G H 16SEP08:02:00 66.33 G 79.38 G 59.84 G H 16SEP08:02:15 66.29 G 79.18 G 59.66 G H 16SEP08:02:30 66.38 G 78.96 G 60.33 G H 16SEP08:02:45 66.43 G 78.34 G 60.77 G H 16SEP08:03:00 66.41 G 77.67 G 61.66 G H 16SEP08:03:15 66.32 G 77.21 G 62.47 G H 16SEP08:03:30 66.18 G 76.8 G 62.93 G H 16SEP08:03:45 65.93 G 76.55 G 63.47 G H 16SEP08:04:00 65.71 G 76.06 G 64 G H 16SEP08:04:15 65.77 G 75.87 G 65.67 G H 16SEP08:04:30 65.19 G 75.18 G 66.3 G H 16SEP08:04:45 65.03 G 74.95 G 67.3 G H 16SEP08:05:00 64.6 G 74.64 G 67.09 G H 16SEP08:05:15 64.27 G 74.21 G 66.21 G H 16SEP08:05:30 64.26 G 73.95 G 66.16 G H 16SEP08:05:45 64.39 G 73.71 G 66.8 G H 16SEP08:06:00 64.64 G 73.49 G 67.15 G H 16SEP08:06:15 64.84 G 73.4 G 68.05 G H 16SEP08:06:30 64.7 G 73.31 G 67.84 G H 16SEP08:06:45 64.67 G 73.11 G 68.16 G H 16SEP08:07:00 64.61 G 73.02 G 69.69 G H 16SEP08:07:15 64.32 G 72.76 G 70.84 G H 16SEP08:07:30 64.16 G 72.57 G 70.61 G H 16SEP08:07:45 64.14 G 72.5 G 69.63 G H 16SEP08:08:00 63.93 G 72.36 G 71.21 G H 16SEP08:08:15 64.32 G 72.19 G 71.19 G H 16SEP08:08:30 64.43 G 72.2 G 71.86 G H 16SEP08:08:45 64.13 G 72.42 G 73.11 G H 16SEP08:09:00 64.05 G 72.46 G 72.93 G

Saltstone Core Sampling Summary LWO-RIP-2008-00006 for September 2008 Revision 0 November 4, 2008
Page 16 of 34
Table 3.1-2: Meteorological Data, September 16,2008 (Continued)
Tower Location
Greenwich Mean Time
Dew Point (F) DQ Temp.
(F) DQ Relative
Humidity (%)
DQ
H 16SEP08:09:15 64 G 72.42 G 73 G H 16SEP08:09:30 63.74 G 72.58 G 74.05 G H 16SEP08:09:45 63.37 G 72.46 G 74.93 G H 16SEP08:10:00 63.13 G 71.99 G 74.95 G H 16SEP08:10:15 63.08 G 71.75 G 75.21 G H 16SEP08:10:30 62.99 G 71.55 G 75.62 G H 16SEP08:10:45 62.98 G 71.51 G 76.04 G H 16SEP08:11:00 63.07 G 71.82 G 76.36 G H 16SEP08:11:15 63.22 G 71.9 G 76.85 G H 16SEP08:11:30 63.46 G 72.04 G 77.47 G H 16SEP08:11:45 63.57 G 72.06 G 77.71 G H 16SEP08:12:00 63.75 G 72.24 G 77.81 G H 16SEP08:12:15 64.09 G 72.82 G 77.94 G H 16SEP08:12:30 64.31 G 73.2 G 77.92 G H 16SEP08:12:45 64.15 G 73.15 G 77.62 G H 16SEP08:13:00 64.03 G 72.9 G 77.75 G H 16SEP08:13:15 64.14 G 73.03 G 77.93 G H 16SEP08:13:30 64.43 G 73.25 G 78.3 G H 16SEP08:13:45 64.76 G 73.94 G 77.66 G H 16SEP08:14:00 65.05 G 74.75 G 77.18 G H 16SEP08:14:15 65.28 G 75.44 G 76.14 G H 16SEP08:14:30 65.18 G 75.51 G 74.52 G H 16SEP08:14:45 64.98 G 75.57 G 73.31 G H 16SEP08:15:00 65.46 G 77.19 G 72.36 G H 16SEP08:15:15 65.37 G 76.9 G 71.47 G H 16SEP08:15:30 65.6 G 77.74 G 69.94 G H 16SEP08:15:45 66.4 G 79.39 G 69.18 G H 16SEP08:16:00 66.56 G 80.06 G 69.04 G H 16SEP08:16:15 66.35 G 80.81 G 67.84 G H 16SEP08:16:30 66.75 G 82 G 66.75 G H 16SEP08:16:45 66.34 G 80.47 G 67.19 G H 16SEP08:17:00 65.94 G 79.24 G 69.17 G H 16SEP08:17:15 65.22 G 78.4 G 70.06 G H 16SEP08:17:30 64.82 G 78.94 G 70.3 G H 16SEP08:17:45 64.92 G 79.98 G 70.05 G H 16SEP08:18:00 65.1 G 79.98 G 69.05 G H 16SEP08:18:15 65.44 G 80.77 G 67.59 G H 16SEP08:18:30 65.5 G 80.18 G 66.83 G H 16SEP08:18:45 65.05 G 80.48 G 65.86 G H 16SEP08:19:00 65.43 G 81.29 G 64.94 G H 16SEP08:19:15 65.05 G 80.6 G 65.08 G

Saltstone Core Sampling Summary LWO-RIP-2008-00006 for September 2008 Revision 0 November 4, 2008
Page 17 of 34
Table 3.1-2: Meteorological Data, September 16,2008 (Continued)
Tower Location
Greenwich Mean Time
Dew Point (F) DQ Temp.
(F) DQ Relative
Humidity (%)
DQ
H 16SEP08:19:30 64.01 G 79.21 G 65.07 G H 16SEP08:19:45 63.85 G 78.89 G 65.49 G H 16SEP08:20:00 63.26 G 78.36 G 65.72 G H 16SEP08:20:15 62.96 G 77.75 G 65.68 G H 16SEP08:20:30 62.69 G 77.69 G 65.74 G H 16SEP08:20:45 62.24 G 76.87 G 65.85 G H 16SEP08:21:00 61.97 G 76.65 G 65.54 G H 16SEP08:21:15 61.85 G 76.31 G 65.56 G H 16SEP08:21:30 61.37 G 75.61 G 66.16 G H 16SEP08:21:45 61.17 G 74.83 G 66.68 G H 16SEP08:22:00 60.9 G 74.27 G 67.7 G H 16SEP08:22:15 60.55 G 73.33 G 68.66 G H 16SEP08:22:30 60.46 G 72.89 G 69.37 G H 16SEP08:22:45 60.17 G 72.19 G 69.64 G H 16SEP08:23:00 59.95 G 71.97 G 69.55 G H 16SEP08:23:15 59.52 G 71.5 G 69.65 G H 16SEP08:23:30 59.26 G 71.13 G 69.74 G H 16SEP08:23:45 59.05 G 70.8 G 69.91 G
3.1.3 Core Conditions Cores 1-1 and 1-2 were drilled dry (i.e. without water as a lubricant). Core 1-2 lodged in the bit and could not safely be removed by hand. Because of this core 1-3 was drilled wet to facilitate removal from the bit. Each core section is described and pictured individually as follows:
Core 1-1 Core 1-1 was drilled from the top of the saltstone surface to a depth of approximately 4 inches. Approximately 2 inches of the core remained contiguous during removal from the bit. For each sample the drill team noted the color of the core. In this case the core appeared teal in color and was described as a soft, crumbly consistency. The drill crew noted that material remained smeared on the drill bit. The core drill team described the smeared material as having the consistency of mud.

Saltstone Core Sampling Summary LWO-RIP-2008-00006 for September 2008 Revision 0 November 4, 2008
Page 18 of 34
Figure 3.1-2: Core 1-1 View
Core 1-2 Core 1-2 was drilled from approximately 4 in. to a depth of approximately 10 in. Approximately 6 inches of the core remained in the bit and could not be removed. The core appeared teal in color.

Saltstone Core Sampling Summary LWO-RIP-2008-00006 for September 2008 Revision 0 November 4, 2008
Page 19 of 34
Figure 3.1-3: Core 1-2 View
Core 1-3 Core 1-3 was drilled from approximately 10 in. to a depth of approximately 14 in using the wet core technique. A core of from 3 – 4 in. was as removed. The core appeared dark teal in color.

Saltstone Core Sampling Summary LWO-RIP-2008-00006 for September 2008 Revision 0 November 4, 2008
Page 20 of 34
Figure 3.1-4: Core 1-3, View 1

Saltstone Core Sampling Summary LWO-RIP-2008-00006 for September 2008 Revision 0 November 4, 2008
Page 21 of 34
Figure 3.1-5: Core 1-3, View 2
3.2 Core 2 Cores from location 2 were all obtained on Wednesday, September 17, 2008 using the wet core technique. All core drilling and sample retrieval occurred during the morning. Radiological Control surveys are included in Appendix A. The general area dose rate for core 2 sample activities was recorded as 7 mRem/Hr. The maximum dose rate obtained from sample material removed during activities of Sept. 17, 2008 during the day (day 2 included sample retrieval from both location 2 and location 3) was 3 mRem/Hr Extremity, 1 mRem/Hr Skin 1 mRem/Hr Whole Body and was found on the samples. The maximum transferable contamination levels detected within the glove bag were <200 dpm alpha / 100 cm2 and 80,000 dpm beta-gamma / 100 cm2.

Saltstone Core Sampling Summary LWO-RIP-2008-00006 for September 2008 Revision 0 November 4, 2008
Page 22 of 34
3.2.1 Location Core location 2 is was approximately 36 ft from the surface of the Vault 2 Cell E west wall as indicated by the blue circled area in Figure 3.2-1.
Figure 3.2-1: Core Location #2
3.2.2 Weather Conditions Ambient weather conditions for September 17, 2008 were recorded by the SRNL Atmospheric Technology Center are presented in Table 3.2-1.

Saltstone Core Sampling Summary LWO-RIP-2008-00006 for September 2008 Revision 0 November 4, 2008
Page 23 of 34
Table 3.2-1: Meteorological Data, September 17, 2008
Tower Location
Greenwich Mean Time
Dew Point (F) DQ Temp.
(F) DQ Relative
Humidity (%)
DQ
H 17SEP08:00:00 58.81 G 70.61 G 70.1 G H 17SEP08:00:15 58.43 G 70.13 G 70.37 G H 17SEP08:00:30 58.2 G 69.82 G 70.4 G H 17SEP08:00:45 58.13 G 69.58 G 70.38 G H 17SEP08:01:00 58.06 G 69.59 G 70.16 G H 17SEP08:01:15 57.99 G 69.56 G 70.06 G H 17SEP08:01:30 57.91 G 69.35 G 70.24 G H 17SEP08:01:45 57.76 G 69.06 G 70.33 G H 17SEP08:02:00 57.72 G 68.91 G 70.41 G H 17SEP08:02:15 57.64 G 68.89 G 70.47 G H 17SEP08:02:30 57.53 G 68.84 G 70.42 G H 17SEP08:02:45 57.41 G 68.56 G 70.4 G H 17SEP08:03:00 57.41 G 68.58 G 70.63 G H 17SEP08:03:15 57.36 G 68.59 G 70.71 G H 17SEP08:03:30 57.32 G 68.6 G 70.68 G H 17SEP08:03:45 57.28 G 68.59 G 70.63 G H 17SEP08:04:00 57.3 G 68.53 G 70.72 G H 17SEP08:04:15 57.32 G 68.51 G 70.77 G H 17SEP08:04:30 57.38 G 68.48 G 71.04 G H 17SEP08:04:45 57.46 G 68.48 G 71.27 G H 17SEP08:05:00 57.52 G 68.38 G 71.49 G H 17SEP08:05:15 57.57 G 68.4 G 71.89 G H 17SEP08:05:30 57.64 G 68.21 G 72.67 G H 17SEP08:05:45 57.53 G 67.91 G 73.47 G H 17SEP08:06:00 57.44 G 67.47 G 74.23 G H 17SEP08:06:15 57.44 G 66.96 G 74.89 G H 17SEP08:06:30 57.51 G 66.81 G 75.55 G H 17SEP08:06:45 57.55 G 66.64 G 75.89 G H 17SEP08:07:00 57.8 G 66.62 G 76.64 G H 17SEP08:07:15 57.88 G 66.54 G 76.82 G H 17SEP08:07:30 57.87 G 66.59 G 76.66 G H 17SEP08:07:45 57.93 G 66.59 G 76.74 G H 17SEP08:08:00 57.99 G 66.55 G 76.81 G H 17SEP08:08:15 58.25 G 66.63 G 77.28 G H 17SEP08:08:30 58.57 G 66.66 G 77.87 G H 17SEP08:08:45 58.97 G 66.78 G 78.75 G H 17SEP08:09:00 59.37 G 66.84 G 79.62 G H 17SEP08:09:15 59.51 G 66.92 G 79.85 G H 17SEP08:09:30 59.81 G 67.04 G 80.51 G H 17SEP08:09:45 59.91 G 67.14 G 80.61 G H 17SEP08:10:00 60.02 G 67.24 G 80.66 G

Saltstone Core Sampling Summary LWO-RIP-2008-00006 for September 2008 Revision 0 November 4, 2008
Page 24 of 34
Table 3.2-1: Meteorological Data, September 17, 2008 (Continued)
Tower Location
Greenwich Mean Time
Dew Point (F) DQ Temp.
(F) DQ Relative
Humidity (%)
DQ
H 17SEP08:10:15 60.05 G 67.36 G 80.57 G H 17SEP08:10:30 60.11 G 67.42 G 80.56 G H 17SEP08:10:45 60.1 G 67.6 G 80.32 G H 17SEP08:11:00 60.16 G 67.6 G 80.31 G H 17SEP08:11:15 60.16 G 67.64 G 80.22 G H 17SEP08:11:30 60.15 G 67.77 G 80.19 G H 17SEP08:11:45 60.12 G 67.83 G 80.17 G H 17SEP08:12:00 60.13 G 67.9 G 80.14 G H 17SEP08:12:15 60.2 G 67.93 G 80.18 G H 17SEP08:12:30 60.21 G 67.95 G 80.08 G H 17SEP08:12:45 60.18 G 68.01 G 79.95 G H 17SEP08:13:00 60.33 G 68.17 G 80 G H 17SEP08:13:15 60.43 G 68.48 G 79.48 G H 17SEP08:13:30 60.35 G 68.88 G 78.54 G H 17SEP08:13:45 60.13 G 68.93 G 78 G H 17SEP08:14:00 60.05 G 68.74 G 77.91 G H 17SEP08:14:15 59.97 G 68.84 G 77.27 G H 17SEP08:14:30 59.93 G 68.93 G 77.12 G H 17SEP08:14:45 59.41 G 69.13 G 75.5 G H 17SEP08:15:00 58.94 G 68.92 G 74.56 G H 17SEP08:15:15 58.63 G 68.9 G 73.85 G H 17SEP08:15:30 58.66 G 69.13 G 73.25 G H 17SEP08:15:45 58.85 G 69.62 G 72.85 G H 17SEP08:16:00 58.74 G 69.6 G 73.21 G H 17SEP08:16:15 58.67 G 69.65 G 72.61 G H 17SEP08:16:30 58.87 G 70.1 G 71.86 G H 17SEP08:16:45 58.96 G 70.39 G 71.42 G H 17SEP08:17:00 58.87 G 70.73 G 70.71 G H 17SEP08:17:15 58.72 G 70.45 G 69.94 G H 17SEP08:17:30 58.91 G 70.94 G 69.34 G H 17SEP08:17:45 58.83 G 71.18 G 68.55 G H 17SEP08:18:00 58.82 G 71.23 G 68.6 G H 17SEP08:18:15 59 G 71.61 G 68.86 G H 17SEP08:18:30 59.14 G 71.9 G 68.88 G H 17SEP08:18:45 58.86 G 71.51 G 68.69 G H 17SEP08:19:00 58.98 G 71.73 G 68.33 G H 17SEP08:19:15 58.9 G 71.56 G 67.86 G H 17SEP08:19:30 58.86 G 71.7 G 67.5 G H 17SEP08:19:45 59.08 G 72.11 G 67.22 G H 17SEP08:20:00 58.95 G 71.96 G 67.09 G H 17SEP08:20:15 59.13 G 72.71 G 66.72 G

Saltstone Core Sampling Summary LWO-RIP-2008-00006 for September 2008 Revision 0 November 4, 2008
Page 25 of 34
Table 3.2-1: Meteorological Data, September 17, 2008 (Continued)
Tower Location
Greenwich Mean Time
Dew Point (F) DQ Temp.
(F) DQ Relative
Humidity (%)
DQ
H 17SEP08:20:30 59.38 G 73.8 G 66.29 G H 17SEP08:20:45 59.08 G 73.32 G 65.5 G H 17SEP08:21:00 59.01 G 73.09 G 64.97 G H 17SEP08:21:15 59.09 G 73.05 G 64.99 G H 17SEP08:21:30 59.31 G 73.54 G 64.81 G H 17SEP08:21:45 59.03 G 73.17 G 64.21 G H 17SEP08:22:00 58.91 G 72.8 G 64.52 G H 17SEP08:22:15 58.68 G 72.28 G 64.47 G H 17SEP08:22:30 58.32 G 71.95 G 65.03 G H 17SEP08:22:45 57.75 G 71.15 G 64.98 G H 17SEP08:23:00 57.56 G 70.72 G 65.34 G H 17SEP08:23:15 57.1 G 70.18 G 64.74 G H 17SEP08:23:30 56.59 G 69.6 G 64.36 G H 17SEP08:23:45 55.88 G 68.66 G 63.01 G
3.2.3 Core Conditions Cores 2-1 through 2-3 were drilled using the wet technique. All cores exhibited the dark teal color similar to core 1-3. Pieces of the sample material were observed falling from core 2-2. Both cores 2-1 and 2-2 were difficult to retrieve. The core drill team observed that the outer surface of the core seemed to be softened and believed that effect to be due to the water lubricant used here. Cores 2-1 and 2-2 had to be retrieved using the retrieval tool but the samples did not break off at the base (as the tool was designed to do). Rather, the drill crew had to work the sample bit twisting and lifting to break the core from the saltstone matrix. This resulted in the cores breaking into shorter segments than anticipated.
Core 2-1 Core 2-1 was drilled from the top of the saltstone surface to a depth of approximately 6 in. Approximately 4 inches of the pieces of core material and a 2 in. core were removal from the bit. The core material appeared dark teal in color.

Saltstone Core Sampling Summary LWO-RIP-2008-00006 for September 2008 Revision 0 November 4, 2008
Page 26 of 34
Figure 3.2-2: Core 2-1 View
Core 2-2 Core 2-2 was drilled from approximately 6 in. to a depth of approximately 10 in. Approximately 3 inches of the core was removed along with a 1 in. “chunk” of core. The core appeared dark teal in color. Real time video showed that some pieces of material fell from the bit back onto the top of the saltstone monolith as the bit was being removed from the cell.

Saltstone Core Sampling Summary LWO-RIP-2008-00006 for September 2008 Revision 0 November 4, 2008
Page 27 of 34
Figure 3.2-3: Core 2-2 View
Core 2-3 Core 2-3 was drilled from approximately 10 in. to a depth of approximately 14 in. Approximately 4 inches of the core was removed. The core appeared dark teal in color.

Saltstone Core Sampling Summary LWO-RIP-2008-00006 for September 2008 Revision 0 November 4, 2008
Page 28 of 34
Figure 3.2-4: Core 2-3 View
3.3 Core 3
Two cores from location 3 were obtained on Wednesday, September 17, 2008 and one on Thursday September 18, 2008 using the dry core technique at the request of SRNL. Radiological Control surveys are included in Appendix A. The general area dose rate for core 3 sample activities was recorded as 7 mRem/Hr. The maximum dose rate obtained from sample material removed from core location 3 on Sept. 18, 2008 was 2.5 mRem/Hr Extremity, 1 mRem/Hr Skin 1 mRem/Hr Whole Body and was found on the sample. The maximum transferable contamination levels detected within the glove bag on Sept. 18, 2008 were <200 dpm alpha / 100 cm2 and 20,000 dpm beta-gamma / 100 cm2.

Saltstone Core Sampling Summary LWO-RIP-2008-00006 for September 2008 Revision 0 November 4, 2008
Page 29 of 34
3.3.1 Location Core location 3 is was approximately 54 ft from the surface of the Vault 2 Cell E west wall as indicated by the blue circled area in Figure 3.3-1.
Figure 3.3-1: Core Location #3
3.3.2 Weather Conditions Ambient weather conditions for September 17, 2008 and September 18, 2008 were recorded by the SRNL Atmospheric Technology Center are presented in Tables 3.2-1 and 3.3-1 respectively.

Saltstone Core Sampling Summary LWO-RIP-2008-00006 for September 2008 Revision 0 November 4, 2008
Page 30 of 34
Table 3.3-1: Meteorological Data, September 18, 2008
Tower Location
Greenwich Mean Time
Dew Point (F) DQ Temp.
(F) DQ Relative
Humidity (%)
DQ
H 18SEP08:00:00 55.69 G 68.08 G 63.32 G H 18SEP08:00:15 55.61 G 67.61 G 63.35 G H 18SEP08:00:30 55.54 G 67.07 G 63.43 G H 18SEP08:00:45 55.59 G 66.9 G 63.76 G H 18SEP08:01:00 55.63 G 66.62 G 63.84 G H 18SEP08:01:15 55.7 G 66.67 G 65.01 G H 18SEP08:01:30 55.76 G 66.88 G 65.39 G H 18SEP08:01:45 55.69 G 67 G 65.98 G H 18SEP08:02:00 55.46 G 67.1 G 64.95 G H 18SEP08:02:15 55.62 G 66.98 G 65.36 G H 18SEP08:02:30 55.67 G 67.11 G 66.05 G H 18SEP08:02:45 55.68 G 67.17 G 65.17 G H 18SEP08:03:00 55.78 G 67.05 G 65.32 G H 18SEP08:03:15 55.68 G 67.29 G 64.91 G H 18SEP08:03:30 55.55 G 67.22 G 64.7 G H 18SEP08:03:45 55.33 G 67.28 G 63.67 G H 18SEP08:04:00 55.15 G 67.16 G 63.12 G H 18SEP08:04:15 55.01 G 66.39 G 63.57 G H 18SEP08:04:30 54.84 G 65.81 G 63.06 G H 18SEP08:04:45 54.85 G 65.04 G 63.44 G H 18SEP08:05:00 54.55 G 64.3 G 62.51 G H 18SEP08:05:15 54.64 G 63.81 G 63.69 G H 18SEP08:05:30 54.74 G 63.4 G 63.96 G H 18SEP08:05:45 55 G 63.63 G 65.51 G H 18SEP08:06:00 54.64 G 64 G 63.84 G H 18SEP08:06:15 54.74 G 63.91 G 64.97 G H 18SEP08:06:30 54.61 G 64.03 G 65.97 G H 18SEP08:06:45 54.59 G 64.3 G 66.81 G H 18SEP08:07:00 54.62 G 64.76 G 67.3 G H 18SEP08:07:15 54.62 G 64.81 G 66.87 G H 18SEP08:07:30 54.8 G 64.94 G 67.39 G H 18SEP08:07:45 54.96 G 65.03 G 67.81 G H 18SEP08:08:00 55.2 G 65.01 G 68.43 G H 18SEP08:08:15 55.21 G 64.67 G 69.49 G H 18SEP08:08:30 55.25 G 64.83 G 69.75 G H 18SEP08:08:45 55.22 G 64.87 G 70.22 G H 18SEP08:09:00 55.12 G 64.77 G 70.37 G H 18SEP08:09:15 54.95 G 65.07 G 69.81 G H 18SEP08:09:30 54.85 G 65.3 G 69.52 G H 18SEP08:09:45 54.75 G 65.48 G 69.27 G H 18SEP08:10:00 54.44 G 65.65 G 68.22 G
Saltstone Core Sampling Summary LWO-RIP-2008-00006 for September 2008 Revision 0 November 4, 2008
Page 31 of 34
Table 3.3-1: Meteorological Data, September 18, 2008 (Continued)
Tower Location
Greenwich Mean Time
Dew Point (F) DQ Temp.
(F) DQ Relative
Humidity (%)
DQ
H 18SEP08:10:15 54.01 G 65.78 G 67.16 G H 18SEP08:10:30 53.66 G 65.4 G 66.8 G H 18SEP08:10:45 53.28 G 64.88 G 66.29 G H 18SEP08:11:00 53.01 G 64.88 G 66.13 G H 18SEP08:11:15 52.9 G 64.94 G 66.25 G H 18SEP08:11:30 52.89 G 64.88 G 66.65 G H 18SEP08:11:45 52.81 G 65.04 G 66.47 G H 18SEP08:12:00 52.86 G 64.94 G 66.68 G H 18SEP08:12:15 52.93 G 65.09 G 66.79 G H 18SEP08:12:30 53.16 G 65.96 G 66.34 G H 18SEP08:12:45 53.15 G 66.34 G 64.72 G H 18SEP08:13:00 53.35 G 67.26 G 63.45 G H 18SEP08:13:15 53.12 G 67.48 G 61.08 G H 18SEP08:13:30 53.78 G 68.82 G 60.42 G H 18SEP08:13:45 53.66 G 69.4 G 60.27 G H 18SEP08:14:00 54.05 G 69.88 G 60.03 G H 18SEP08:14:15 54.79 G 71.25 G 59 G H 18SEP08:14:30 54.33 G 72.43 G 56.5 G H 18SEP08:14:45 55.09 G 73.68 G 56.53 G H 18SEP08:15:00 54.75 G 73.21 G 54.88 G H 18SEP08:15:15 54.26 G 73.39 G 53.17 G H 18SEP08:15:30 54.39 G 74.96 G 52.32 G H 18SEP08:15:45 54.37 G 74.37 G 53.27 G H 18SEP08:16:00 54.91 G 74.42 G 54.04 G H 18SEP08:16:15 56.29 G 77.2 G 54.01 G H 18SEP08:16:30 56.55 G 77.01 G 54.18 G H 18SEP08:16:45 57 G 78.46 G 53.27 G H 18SEP08:17:00 57.63 G 79.62 G 52.82 G H 18SEP08:17:15 57.94 G 80.37 G 52.47 G H 18SEP08:17:30 57.84 G 80.46 G 51.91 G H 18SEP08:17:45 57.74 G 81.28 G 50.56 G H 18SEP08:18:00 57.75 G 81.19 G 50.32 G H 18SEP08:18:15 57.77 G 80.44 G 49.91 G H 18SEP08:18:30 57.31 G 79.12 G 49.52 G H 18SEP08:18:45 57.65 G 80.5 G 49.63 G H 18SEP08:19:00 58.12 G 80.96 G 49.24 G H 18SEP08:19:15 57.35 G 80.01 G 48.44 G H 18SEP08:19:30 57.58 G 79.19 G 49.58 G H 18SEP08:19:45 57.78 G 79.76 G 48.85 G H 18SEP08:20:00 57.92 G 80.5 G 48.51 G H 18SEP08:20:15 57.31 G 79.95 G 47.61 G

Saltstone Core Sampling Summary LWO-RIP-2008-00006 for September 2008 Revision 0 November 4, 2008
Page 32 of 34
Table 3.3-1: Meteorological Data, September 18, 2008 (Continued)
Tower Location
Greenwich Mean Time
Dew Point (F) DQ Temp.
(F) DQ Relative
Humidity (%)
DQ
H 18SEP08:20:30 57.08 G 80.13 G 47.12 G H 18SEP08:20:45 57.7 G 80.17 G 47.34 G H 18SEP08:21:00 57.19 G 78.37 G 48.21 G H 18SEP08:21:15 57.73 G 78.26 G 48.11 G H 18SEP08:21:30 57.53 G 78.79 G 48.16 G H 18SEP08:21:45 57.64 G 77.14 G 48.91 G H 18SEP08:22:00 57.93 G 76.05 G 49.78 G H 18SEP08:22:15 57.6 G 75.34 G 49.36 G H 18SEP08:22:30 57.59 G 74.88 G 49.73 G H 18SEP08:22:45 57.28 G 74.18 G 50.16 G H 18SEP08:23:00 56.79 G 73.34 G 49.4 G H 18SEP08:23:15 56.68 G 72.48 G 49.41 G H 18SEP08:23:30 56.83 G 71.78 G 50.09 G H 18SEP08:23:45 57 G 71.09 G 50.68 G
3.3.3 Core Conditions Cores 3-1 and 3-2 were drilled Wednesday, September 17 and core 3-3 was drilled Thursday, September 18. All cores from location 3 were drilled using the dry technique at the request of SRNL. The core drill crew noted that core location 3 was significantly different from the other locations in that it seemed easier to drill than the core 1 location and the team was able to retrieve the cores from the bit. The drill crew noted that it was not valid to compare the ease of drilling to core location 2 since these were obtained using the wet method.
Core 3-1 Core 3-1 was drilled from the top of the saltstone surface to a depth of approximately 6 in. Approximately 4 inches of core material was removed from the saltstone using a sample retrieval tool along with approximately 2 in of crumbly material. The core material appeared teal in color.
Core 3-2
Core 3-2 was drilled from approximately 6 in. to a depth of approximately 13 in. Approximately 6 inches of the core was removed but broke into a 4” and 2” section during removal from the bit. The core material appeared olive green in color.
Core 3-3
Core 3-3 was drilled from approximately 13 in. to a depth of approximately 20 in. Approximately 6 inches of the core was removed from the bit. The core material appeared olive green in color.

Saltstone Core Sampling Summary LWO-RIP-2008-00006 for September 2008 Revision 0 November 4, 2008
Page 33 of 34
Figure 3.3-2: Core 3 View

Saltstone Core Sampling Summary LWO-RIP-2008-00006 for September 2008 Revision 0 November 4, 2008
Page A-1
Appendix A: Grout Sampling Surveys

VSDS Standard Map RSLSSurvey DWPF-M-20080915-7
General Information
Survey Date/Time: 09/15/2008 15:30
Survey Type: Job Coverage
Counted By: Facility Inspector
871023
JONES, ROSA MLead Inspector:
Work Order/Task #:
KCN: w7862
Facility: ZZZ
Approved by: KISSIAH, STEPHANIE RHODES, 09/16/2008Status: Ready For Review by: DAVIS, THERESA ANN, 09/16/2008
RWP #: 08-ZZZ-007
Saltstone Vault 4 - Cell E Grout SamplingTitle:
Additional Inspectors
Inspector Cmp Alt Approvew6865BRAXTON, CARL O'NEAL JR
Dose Rate (DR) Object Prefixes/Suffixes
E = ExtremGA = GA WBS = Skin
HS = Hot SpotDose Rates with Prefixes: Dose Rates with No Prefixes: Default Prefixes: Default Suffixes:
"n" = Neutron"b" = Beta"c" = Corrected
Postings Legend CA=Contamination Area RA=Radiation Area
Instruments Used
# Model Serial #Instrument Instrument
1 12-110 37812 12-110 37123 12-Alpha 69134 RO-20 CMC0084255 HandECount CMC011378
Survey #: DWPF-M-20080915-7 - Printed On: 10/09/2008 08:59 Page 1 of 4Document #: WD 21014

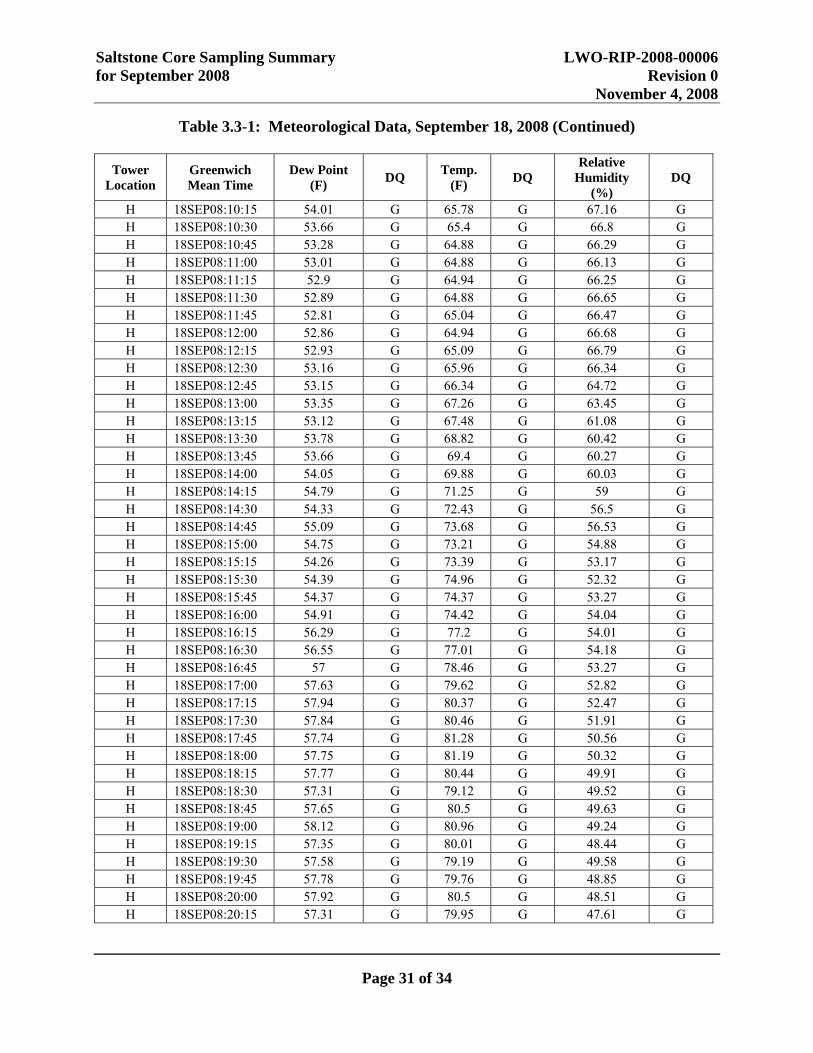
VSDS Standard Map RSLSComments:Performed set-up work for SRNL to do grout sampling on Vault 4 Cell E in three (3) different ports. Work to begin on Tuesday. One glovebag was certified on today and certification paperwork (OSR 4-863) was placed in work package. All smears of area during cap removal were <20 d/m alpha, <200 d/m beta-gamma/100cm2. Dose rate in the area was 7 mrem/hr general area. Approximately 1500 ft2. from RBA to RA/CA for work.
Survey #: DWPF-M-20080915-7 - Printed On: 10/09/2008 08:59 Page 2 of 4Document #: WD 21014
VSDS Standard Map RSLSDate/Time: 09/15/2008 15:30Survey #: DWPF-M-20080915-7BLANK MAP
Comments:
Job CoverageType:RWP #: 08-ZZZ-007Symbol Legend (for example only)
Unless otherwise noted, dose rates in mrem/hr.
Air Samples & WipesSmears
Summary of Highest Readings(All available values may not be listed)
4) <20 DPM/100 cm2
4) <200 DPM/100 cm2
Status: Approved by: KISSIAH, STEPHANIE RHODES, 09/16/2008Lead Inspector: JONES, ROSA MLocation Code: S221000 Bldg/Area Name: MISCELLANEOUSLocation Description: BLANK MAP
Survey #: DWPF-M-20080915-7 - Printed On: 10/09/2008 08:59 Page 3 of 4Image File: COMMON\MISCELLANEOUS\BLANK MAPDocument #: WD 21014
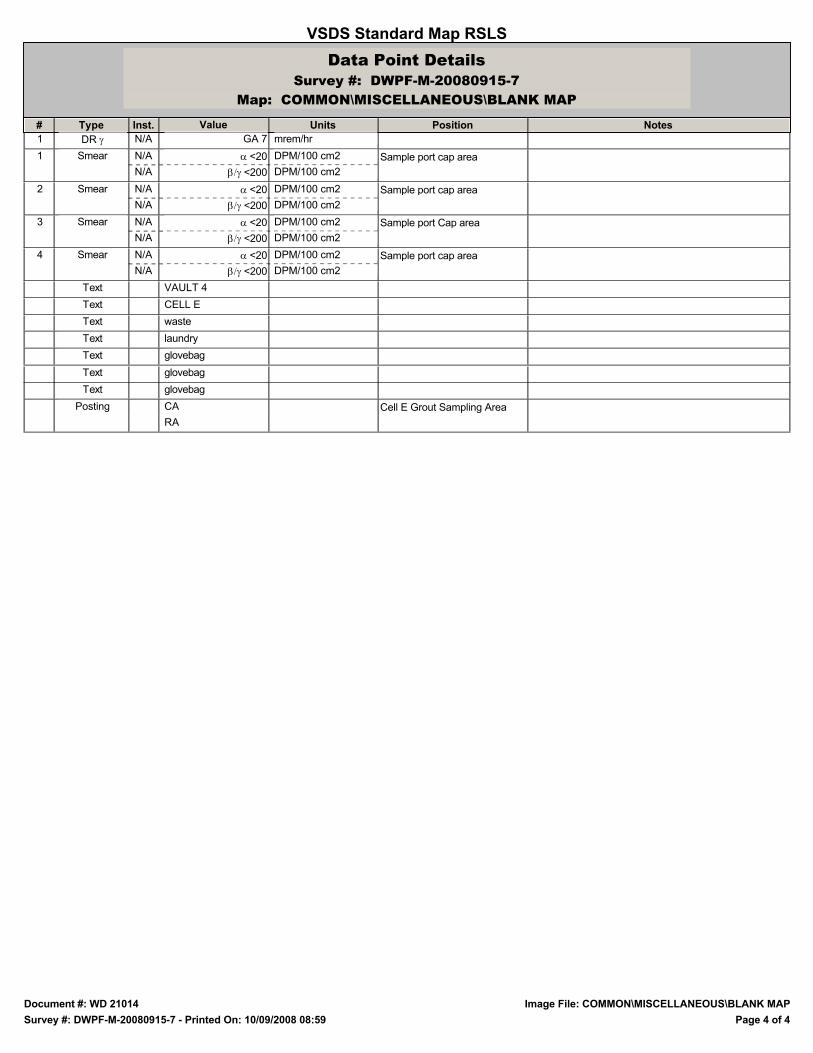
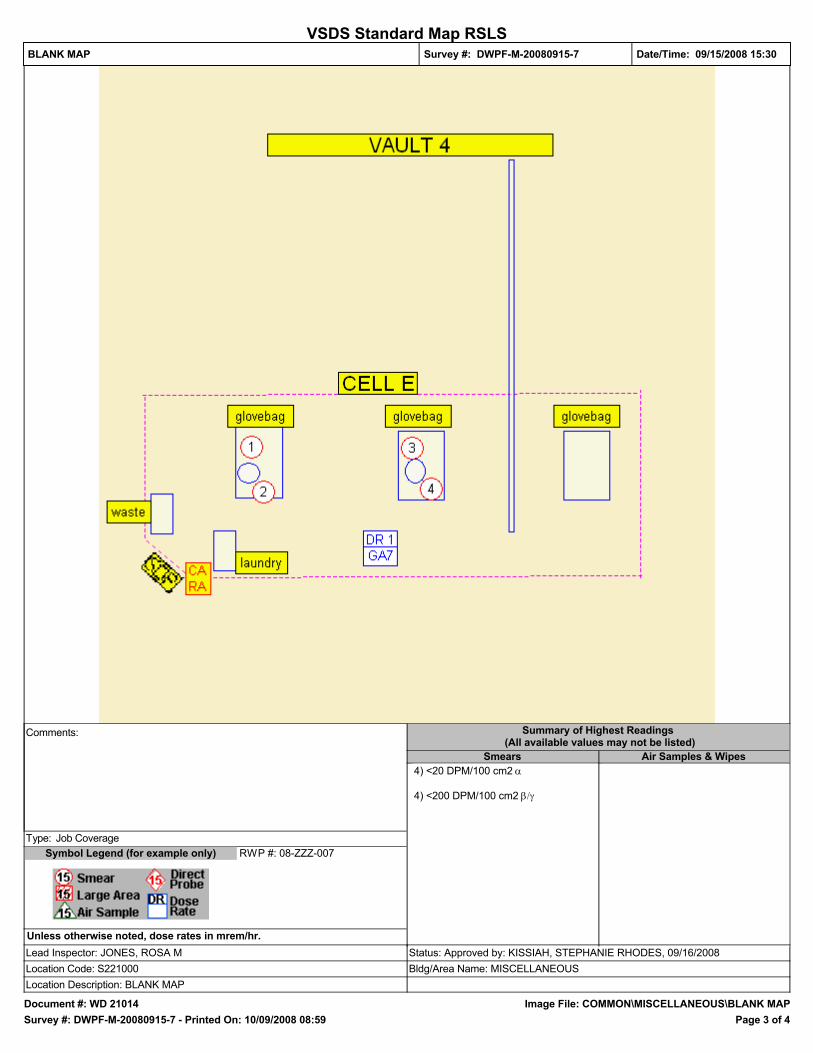
VSDS Standard Map RSLSData Point Details
# NotesType Inst. Value Units Position
Survey #: DWPF-M-20080915-7Map: COMMON\MISCELLANEOUS\BLANK MAP
1 DR N/A GA 7 mrem/hr
Sample port cap area1 Smear N/A <20 DPM/100 cm2N/A <200 DPM/100 cm2
Sample port cap area2 Smear N/A <20 DPM/100 cm2N/A <200 DPM/100 cm2
Sample port Cap area3 Smear N/A <20 DPM/100 cm2N/A <200 DPM/100 cm2
Sample port cap area4 Smear N/A <20 DPM/100 cm2N/A <200 DPM/100 cm2
Text VAULT 4Text CELL EText wasteText laundryText glovebagText glovebagText glovebag
Cell E Grout Sampling AreaPosting CARA
Survey #: DWPF-M-20080915-7 - Printed On: 10/09/2008 08:59 Page 4 of 4Image File: COMMON\MISCELLANEOUS\BLANK MAPDocument #: WD 21014

VSDS Standard Map RSLSSurvey DWPF-M-20080916-2
General Information
Survey Date/Time: 09/16/2008 07:35
Survey Type: Job Coverage
Counted By: Facility Inspector
871023
HICKS, ROBERT HUGHESLead Inspector:
Work Order/Task #:
KCN: w8955
Facility: ZZZ
Approved by: KISSIAH, STEPHANIE RHODES, 09/16/2008Status: Ready For Review by: LILLY, KEVIN BRUCE, 09/16/2008
RWP #: 08-ZZZ-136
Saltstone Vault 4 - Cell E Grout SamplingTitle:
Additional Inspectors
Inspector Cmp Alt Approvew6865BRAXTON, CARL O'NEAL JR
Dose Rate (DR) Object Prefixes/Suffixes
E = ExtremGA = GA WBS = Skin
HS = Hot SpotDose Rates with Prefixes: Dose Rates with No Prefixes: Default Prefixes: Default Suffixes:
"n" = Neutron"b" = Beta"c" = Corrected
Postings Legend CA=Contamination Area RA=Radiation Area
Instruments Used
# Model Serial #Instrument Instrument
1 12-110 CMC0036622 12-110 37123 12-Alpha CMC0068624 12-Alpha CMC0067185 RO-20 CMC0084256 RO-20 CMC007974
Survey #: DWPF-M-20080916-2 - Printed On: 10/09/2008 09:00 Page 1 of 6Document #: WD 21014

VSDS Standard Map RSLSComments:Performed survey for SRNL to perform Core grout sampling on Cell E.All sampling performed inside of certified glove bag. PAS sampling performed during all sampling activities.
Max. Dose Rate: found was on drill bit of 2.5/E,1/S,1WB mRem/hr. General dose rate for area was 7/GA mRem/hr.Max. Large Area: ND alpha, 40,000 dpm beta-gamma (interior of glovebag) Max. Transferable contamination: <200 dpm alpha, 40,000 dpm beta-gamma/ 100cm2 (interior of glovebag)
Installed inspection camera in 3" port adjacent to sample port for visual inspection.Core drill twist sealed cut and taped and removed from glovebag.Glovebag was removed from sample port and bagged, tagged and is awaiting disposal in CA.All smears were < 200 d/m alpha, < 1000 d/m beta gamma / 100 cm2.
Removed three samples taken from 451-4Z vault and two drill bits with partial samples. Max rate for all was2.5/E,1/S,1/WB mRem/hr. All samples were doubled bagged and transported to RCO countroom and stored in hoodper Operations request. All disc smears were < 20d/m alpha, < 200 d/m beta gamma / 100 cm2.
All RCO Action steps were completed within work package.
Survey #: DWPF-M-20080916-2 - Printed On: 10/09/2008 09:00 Page 2 of 6Document #: WD 21014

VSDS Standard Map RSLSMap: 1 Date/Time: 09/16/2008 07:35Survey #: DWPF-M-20080916-2BLANK MAP
Comments:
Job CoverageType:RWP #: 08-ZZZ-136Symbol Legend (for example only)
Unless otherwise noted, dose rates in mrem/hr.
Air Samples & WipesSmears
Summary of Highest Readings(All available values may not be listed)
7) <200 DPM/100 cm2
7) <1000 DPM/100 cm2
Wipe 4) ND DPM/WipeWipe 4) ND DPM/Wipe
Status: Approved by: KISSIAH, STEPHANIE RHODES, 09/16/2008Lead Inspector: HICKS, ROBERT HUGHESLocation Code: S221000 Bldg/Area Name: MISCELLANEOUSLocation Description: BLANK MAP
Survey #: DWPF-M-20080916-2 - Printed On: 10/09/2008 09:00 Page 3 of 6Image File: COMMON\MISCELLANEOUS\BLANK MAPDocument #: WD 21014

VSDS Standard Map RSLSData Point Details
# NotesType Inst. Value Units Position
Survey #: DWPF-M-20080916-2Map: 1 - COMMON\MISCELLANEOUS\BLANK MAP
General Area1 DR N/A GA 7 mrem/hr
general work area2 DR N/A GA 7 mrem/hr
glove bag (outside)1 Smear N/A <200 DPM/100 cm2N/A <1000 DPM/100 cm2
glove bag (outside)2 Smear N/A <200 DPM/100 cm2N/A <1000 DPM/100 cm2
glove bag outside3 Smear N/A <200 DPM/100 cm2N/A <1000 DPM/100 cm2
glove bag outside4 Smear N/A <200 DPM/100 cm2N/A <1000 DPM/100 cm2
roof5 Smear N/A <200 DPM/100 cm2N/A <1000 DPM/100 cm2
roof6 Smear N/A <200 DPM/100 cm2N/A <1000 DPM/100 cm2
roof7 Smear N/A <200 DPM/100 cm2N/A <1000 DPM/100 cm2
glove bag outside1 Wipe ND DPM/WipeND DPM/Wipe
glove bag outside2 Wipe ND DPM/WipeND DPM/Wipe
roof3 Wipe ND DPM/WipeND DPM/Wipe
roof4 Wipe ND DPM/WipeND DPM/Wipe
Text VAULT 4Text CELL EText wasteText laundryText glovebagText glovebagText glovebag
Glove bag was removed after job. All smears Text glove bag was were < 200 d/m alpha, < 1000 d/m beta gamma / removed after job100cm2
Cell Grout sampling areaPosting CARA
Survey #: DWPF-M-20080916-2 - Printed On: 10/09/2008 09:00 Page 4 of 6Image File: COMMON\MISCELLANEOUS\BLANK MAPDocument #: WD 21014

VSDS Standard Map RSLSMap: 2 Date/Time: 09/16/2008 07:35Survey #: DWPF-M-20080916-2BLANK MAP
Comments:
Job CoverageType:RWP #: 08-ZZZ-136Symbol Legend (for example only)
Unless otherwise noted, dose rates in mrem/hr.
Air Samples & WipesSmears
Summary of Highest Readings(All available values may not be listed)
Status: Approved by: KISSIAH, STEPHANIE RHODES, 09/16/2008Lead Inspector: HICKS, ROBERT HUGHESLocation Code: S221000 Bldg/Area Name: MISCELLANEOUSLocation Description: BLANK MAP
Survey #: DWPF-M-20080916-2 - Printed On: 10/09/2008 09:00 Page 5 of 6Image File: COMMON\MISCELLANEOUS\BLANK MAPDocument #: WD 21014
VSDS Standard Map RSLSData Point Details
# NotesType Inst. Value Units Position
Survey #: DWPF-M-20080916-2Map: 2 - COMMON\MISCELLANEOUS\BLANK MAP
Text GlovebagText Sample port
Survey #: DWPF-M-20080916-2 - Printed On: 10/09/2008 09:00 Page 6 of 6Image File: COMMON\MISCELLANEOUS\BLANK MAPDocument #: WD 21014

VSDS Standard Map RSLSSurvey DWPF-M-20080917-2
General Information
Survey Date/Time: 09/17/2008 10:10
Survey Type: Job Coverage
Counted By: Facility Inspector
871023
HICKS, ROBERT HUGHESLead Inspector:
Work Order/Task #:
KCN: w8955
Facility: ZZZ
Approved by: KISSIAH, STEPHANIE RHODES, 09/18/2008Status: Ready For Review by: BRAXTON, CARL, 09/18/2008
RWP #: 08-ZZZ-136
Saltstone Vault 4 - Cell E Grout SamplingTitle:
Additional Inspectors
Inspector Cmp Alt Approvew6865BRAXTON, CARL
Dose Rate (DR) Object Prefixes/Suffixes
E = ExtremGA = GA WBS = Skin
W Body HS = Hot SpotDose Rates with Prefixes: Dose Rates with No Prefixes: Default Prefixes: Default Suffixes:
"n" = Neutron"b" = Beta"c" = Corrected
Postings Legend CA=Contamination Area RA=Radiation Area
Instruments Used
# Model Serial #Instrument Instrument
1 12-110 CMC0036622 12-110 37123 12-Alpha CMC0067184 RO-20 CMC0084255 RO-20 CMC007974
Survey #: DWPF-M-20080917-2 - Printed On: 10/09/2008 09:01 Page 1 of 6Document #: WD 21014

VSDS Standard Map RSLSComments:Performed survey for SRNL to continue Core grout sampling on Cell E. A total of five samples were pulled.All sampling performed inside of certified glove bag. PAS sampling performed during all sampling activities.
Max. Dose Rate: found was 3.0/E,1/S,1WB mRem/hr on samples. General dose rate for area was 7/GA mRem/hr.Max. Large Area: ND alpha, 100,000 dpm beta-gamma (interior of glovebag) Max. Transferable contamination: <200 dpm alpha, 80,000 dpm beta-gamma/ 100cm2 (interior of glovebag floor)
Core drill twist sealed cut and taped and removed from glovebag from glovebag #2 and installed in glove bag #3.all smears were < 200 d/m alpha, < 1000 d/m beta gamma/ 100 cm2Glovebag was removed from sample port and bagged, tagged and is awaiting disposal in CA.All smears were < 200 d/m alpha, < 1000 d/m beta gamma / 100 cm2.
Removed five samples taken from 451-4Z vault. Max rate for all was3.0/E,1/S,1/WB mRem/hr. All samples were double bagged and transported to RCO countroom and stored in hoodper Operations request. All disc smears were < 20d/m alpha, < 200 d/m beta gamma / 100 cm2 on outside of bagged samples.
All RCO Action steps were completed within work package.
Survey #: DWPF-M-20080917-2 - Printed On: 10/09/2008 09:01 Page 2 of 6Document #: WD 21014
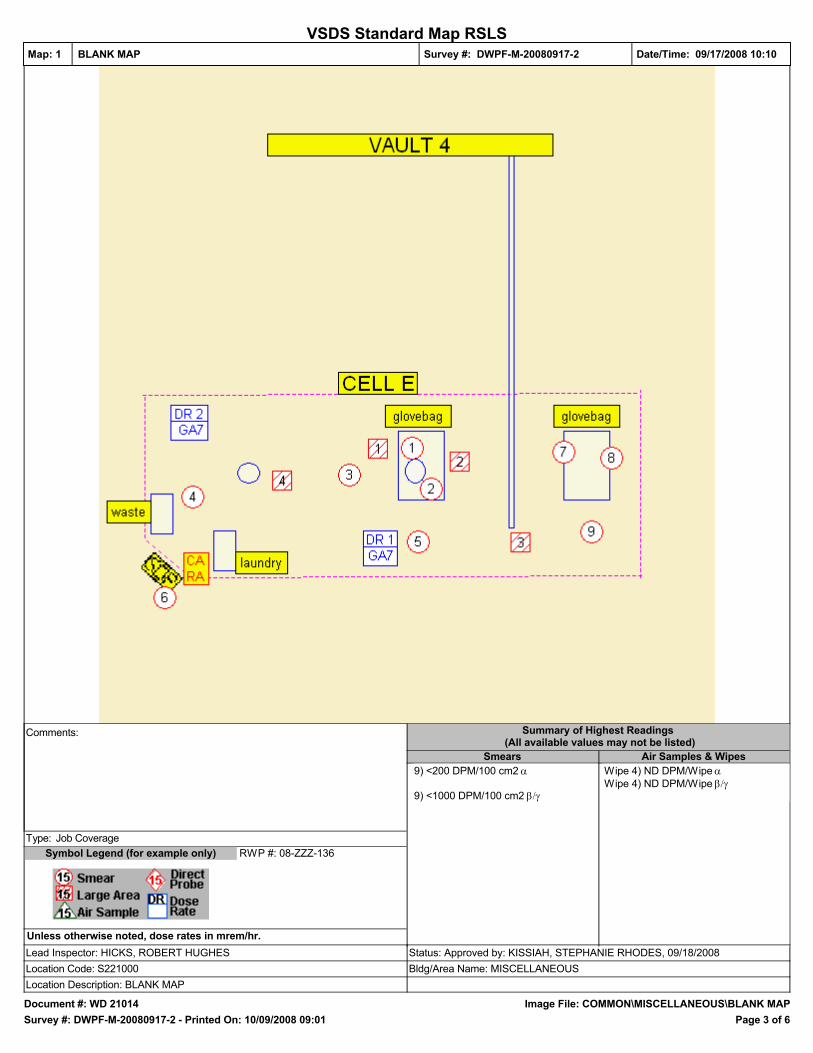
VSDS Standard Map RSLSMap: 1 Date/Time: 09/17/2008 10:10Survey #: DWPF-M-20080917-2BLANK MAP
Comments:
Job CoverageType:RWP #: 08-ZZZ-136Symbol Legend (for example only)
Unless otherwise noted, dose rates in mrem/hr.
Air Samples & WipesSmears
Summary of Highest Readings(All available values may not be listed)
9) <200 DPM/100 cm2
9) <1000 DPM/100 cm2
Wipe 4) ND DPM/WipeWipe 4) ND DPM/Wipe
Status: Approved by: KISSIAH, STEPHANIE RHODES, 09/18/2008Lead Inspector: HICKS, ROBERT HUGHESLocation Code: S221000 Bldg/Area Name: MISCELLANEOUSLocation Description: BLANK MAP
Survey #: DWPF-M-20080917-2 - Printed On: 10/09/2008 09:01 Page 3 of 6Image File: COMMON\MISCELLANEOUS\BLANK MAPDocument #: WD 21014

VSDS Standard Map RSLSData Point Details
# NotesType Inst. Value Units Position
Survey #: DWPF-M-20080917-2Map: 1 - COMMON\MISCELLANEOUS\BLANK MAP
General Area1 DR N/A GA 7 mrem/hr
general work area2 DR N/A GA 7 mrem/hr
glove bag outside1 Smear N/A <200 DPM/100 cm2N/A <1000 DPM/100 cm2
glove bag outside2 Smear N/A <200 DPM/100 cm2N/A <1000 DPM/100 cm2
roof3 Smear N/A <200 DPM/100 cm2N/A <1000 DPM/100 cm2
roof4 Smear N/A <200 DPM/100 cm2N/A <1000 DPM/100 cm2
roof5 Smear N/A <200 DPM/100 cm2N/A <1000 DPM/100 cm2
SOP6 Smear N/A <20 DPM/100 cm2N/A <200 DPM/100 cm2N/A Tritium N/A DPM/100 cm2
glove bag outside7 Smear N/A <200 DPM/100 cm2N/A <1000 DPM/100 cm2
glove bag outside8 Smear N/A <200 DPM/100 cm2N/A <1000 DPM/100 cm2
roof9 Smear N/A <200 DPM/100 cm2N/A <1000 DPM/100 cm2
glove bag outside1 Wipe ND DPM/WipeND DPM/Wipe
glove bag outside2 Wipe ND DPM/WipeND DPM/Wipe
roof3 Wipe ND DPM/WipeND DPM/Wipe
roof4 Wipe ND DPM/WipeND DPM/Wipe
Text VAULT 4Text CELL EText wasteText laundryText glovebagText glovebag
Cell Grout sampling areaPosting CARA
Survey #: DWPF-M-20080917-2 - Printed On: 10/09/2008 09:01 Page 4 of 6Image File: COMMON\MISCELLANEOUS\BLANK MAPDocument #: WD 21014

VSDS Standard Map RSLSMap: 2 Date/Time: 09/17/2008 10:10Survey #: DWPF-M-20080917-2BLANK MAP
Comments:
Job CoverageType:RWP #: 08-ZZZ-136Symbol Legend (for example only)
Unless otherwise noted, dose rates in mrem/hr.
Air Samples & WipesSmears
Summary of Highest Readings(All available values may not be listed)
4) <200 DPM/100 cm2
2) 80000 DPM/100 cm2
Status: Approved by: KISSIAH, STEPHANIE RHODES, 09/18/2008Lead Inspector: HICKS, ROBERT HUGHESLocation Code: S221000 Bldg/Area Name: MISCELLANEOUSLocation Description: BLANK MAP
Survey #: DWPF-M-20080917-2 - Printed On: 10/09/2008 09:01 Page 5 of 6Image File: COMMON\MISCELLANEOUS\BLANK MAPDocument #: WD 21014

VSDS Standard Map RSLSData Point Details
# NotesType Inst. Value Units Position
Survey #: DWPF-M-20080917-2Map: 2 - COMMON\MISCELLANEOUS\BLANK MAP
sample holder1 DR N/A E 3 mrem/hrN/A S 1 mrem/hrN/A 1 mrem/hr
sample holder2 DR N/A E 2.5 mrem/hrN/A S 1 mrem/hrN/A 1 mrem/hr
sample holder3 DR N/A E 2.5 mrem/hrN/A S 1 mrem/hrN/A 1 mrem/hr
vault work area4 DR N/A GA 7 mrem/hr
background for areaInterior of glovebag1 Smear N/A <200 DPM/100 cm2N/A 10000 DPM/100 cm2N/A Tritium N/A DPM/100 cm2
floor of glovebagInterior of glovebag2 Smear N/A <200 DPM/100 cm2N/A 80000 DPM/100 cm2N/A Tritium N/A DPM/100 cm2
background for areaInterior of glovebag3 Smear N/A <200 DPM/100 cm2N/A 10000 DPM/100 cm2N/A Tritium N/A DPM/100 cm2
background for areaInterior of glovebag4 Smear N/A <200 DPM/100 cm2N/A 10000 DPM/100 cm2N/A Tritium N/A DPM/100 cm2
Text GlovebagText Sample portText Sample #1Text Sample #2Text Sample #3
Cell E Grout Sampling AreaPosting CARA
Survey #: DWPF-M-20080917-2 - Printed On: 10/09/2008 09:01 Page 6 of 6Image File: COMMON\MISCELLANEOUS\BLANK MAPDocument #: WD 21014

VSDS Standard Map RSLSSurvey DWPF-M-20080918-7
General Information
Survey Date/Time: 09/18/2008 14:02
Survey Type: Job Coverage
Counted By: Facility Inspector
871023
BRAXTON, CARLLead Inspector:
Work Order/Task #:
KCN: w6865
Facility: ZZZ
Approved by: KISSIAH, STEPHANIE RHODES, 09/18/2008Status: Ready For Review by: HICKS, ROBERT HUGHES, 09/18/2008
RWP #: 08-ZZZ-136
Saltstone Vault 4 - Cell E Grout SamplingTitle:
Additional Inspectors
Inspector Cmp Alt Approvew8955HICKS, ROBERT HUGHES
Dose Rate (DR) Object Prefixes/Suffixes
E = ExtremGA = GA WBS = Skin
W Body HS = Hot SpotDose Rates with Prefixes: Dose Rates with No Prefixes: Default Prefixes: Default Suffixes:
"n" = Neutron"b" = Beta"c" = Corrected
Postings Legend CA=Contamination Area RA=Radiation Area
Instruments Used
# Model Serial #Instrument Instrument
1 12-110 CMC0036622 12-110 CMC0037123 12-Alpha CMC0067184 RO-20 CMC0084255 HandECount CMC0027296 HandECount CMC0046567 HandECount CMC0104118 HandECount CMC0104139 HandECount CMC01129610 HandECount CMC01137711 Electra Plus CMC011378
Survey #: DWPF-M-20080918-7 - Printed On: 10/09/2008 09:02 Page 1 of 9Document #: WD 21014

VSDS Standard Map RSLSComments:Performed survey for SRNL to complete last Core grout sampling on Cell E. All sampling performed inside of certified glove bag. PAS sampling performed during all sampling activities.
Max. Dose Rate: found was 2.5 /E,1/S,1WB mRem/hr @ samples. General dose rate for area was 7/GA mRem/hr.Max. Large Area: ND alpha, 40,000 dpm beta-gamma (interior of glovebag) Max. Transferable contamination: <200 dpm alpha, 20,000 dpm beta-gamma/ 100cm2 (interior of glovebag floor)
Core drill was b-lined cut and taped and removed from glovebag #3. Flex hose was removed from drill inside of Rad bag and threaded end was bagged and tagged. Unit was disc smeared, all results were < 20 d/m alpha< 200 d/m beta gamma/ 100 cm2. Pipe located on end of drill was hollow and was not accessible for survey or deconand end was doubled bagged and tagged. All disc smears were <20 d/m alpha, < 200 d/m beta gamma / 100 cm2.Max direct probe results for drill unit which was doubled bagged was ND for alpha and beta gamma. Unit was transported to RMA sealand for storage.
Glovebag was removed from sample port and bagged, tagged. All smears were < 200 d/m alpha, < 1000 d/m beta gamma / 100 cm2. At completion of job all sample ports / vault floor were disc smeared, all results were < 20 d/m alpha, < 200 d/m beta gamma/100 cm2. All tools clothing and waste recepticals were surveyed and approximately 1500 sq. ft. was rolled back from Radiation/Contamination to Radiation area. Shift manager was notified.
All waste and laundry bags were doubled bagged, tagged and flown down from roof area and waste was placed into B-25 located on East side.
All RCO Action steps were completed within work package.
Survey #: DWPF-M-20080918-7 - Printed On: 10/09/2008 09:02 Page 2 of 9Document #: WD 21014

VSDS Standard Map RSLSMap: 1 Date/Time: 09/18/2008 14:02Survey #: DWPF-M-20080918-7BLANK MAP
Comments:
Job CoverageType:RWP #: 08-ZZZ-136Symbol Legend (for example only)
Unless otherwise noted, dose rates in mrem/hr.
Air Samples & WipesSmears
Summary of Highest Readings(All available values may not be listed)
8) <200 DPM/100 cm2
8) <1000 DPM/100 cm2
Wipe 4) ND DPM/WipeWipe 4) ND DPM/Wipe
Status: Approved by: KISSIAH, STEPHANIE RHODES, 09/18/2008Lead Inspector: BRAXTON, CARLLocation Code: S221000 Bldg/Area Name: MISCELLANEOUSLocation Description: BLANK MAP
Survey #: DWPF-M-20080918-7 - Printed On: 10/09/2008 09:02 Page 3 of 9Image File: COMMON\MISCELLANEOUS\BLANK MAPDocument #: WD 21014

VSDS Standard Map RSLSData Point Details
# NotesType Inst. Value Units Position
Survey #: DWPF-M-20080918-7Map: 1 - COMMON\MISCELLANEOUS\BLANK MAP
General Area1 DR N/A GA 7 mrem/hr
general work area2 DR N/A GA 7 mrem/hr
glove bag outside1 Smear N/A <200 DPM/100 cm2N/A <1000 DPM/100 cm2
roof2 Smear N/A <200 DPM/100 cm2N/A <1000 DPM/100 cm2
roof3 Smear N/A <200 DPM/100 cm2N/A <1000 DPM/100 cm2
roof4 Smear N/A <200 DPM/100 cm2N/A <1000 DPM/100 cm2
SOP5 Smear N/A <20 DPM/100 cm2N/A <200 DPM/100 cm2N/A Tritium N/A DPM/100 cm2
glove bag outside6 Smear N/A <200 DPM/100 cm2N/A <1000 DPM/100 cm2
glove bag outside7 Smear N/A <200 DPM/100 cm2N/A <1000 DPM/100 cm2
roof8 Smear N/A <200 DPM/100 cm2N/A <1000 DPM/100 cm2
glove bag outside1 Wipe ND DPM/WipeND DPM/Wipe
glove bag outside2 Wipe ND DPM/WipeND DPM/Wipe
roof3 Wipe ND DPM/WipeND DPM/Wipe
roof4 Wipe ND DPM/WipeND DPM/Wipe
Text VAULT 4Text CELL EText wasteText laundryText glovebag
Cell Grout sampling areaPosting CARA
Survey #: DWPF-M-20080918-7 - Printed On: 10/09/2008 09:02 Page 4 of 9Image File: COMMON\MISCELLANEOUS\BLANK MAPDocument #: WD 21014

VSDS Standard Map RSLSMap: 2 Date/Time: 09/18/2008 14:02Survey #: DWPF-M-20080918-7BLANK MAP
Comments:
Job CoverageType:RWP #: 08-ZZZ-136Symbol Legend (for example only)
Unless otherwise noted, dose rates in mrem/hr.
Air Samples & WipesSmears
Summary of Highest Readings(All available values may not be listed)
4) <200 DPM/100 cm2
2) 20000 DPM/100 cm2
Wipe 3) ND DPM/WipeWipe 3) ND DPM/Wipe
Status: Approved by: KISSIAH, STEPHANIE RHODES, 09/18/2008Lead Inspector: BRAXTON, CARLLocation Code: S221000 Bldg/Area Name: MISCELLANEOUSLocation Description: BLANK MAP
Survey #: DWPF-M-20080918-7 - Printed On: 10/09/2008 09:02 Page 5 of 9Image File: COMMON\MISCELLANEOUS\BLANK MAPDocument #: WD 21014

VSDS Standard Map RSLSData Point Details
# NotesType Inst. Value Units Position
Survey #: DWPF-M-20080918-7Map: 2 - COMMON\MISCELLANEOUS\BLANK MAP
sample holder1 DR N/A E 2.5 mrem/hrN/A S 1 mrem/hrN/A 1 mrem/hr
vault work area2 DR N/A GA 7 mrem/hr
background for areaInterior of glovebag1 Smear N/A <200 DPM/100 cm2N/A 10000 DPM/100 cm2N/A Tritium N/A DPM/100 cm2
floor of glovebagInterior of glovebag2 Smear N/A <200 DPM/100 cm2N/A 20000 DPM/100 cm2N/A Tritium N/A DPM/100 cm2
background for areaInterior of glovebag3 Smear N/A <200 DPM/100 cm2N/A 10000 DPM/100 cm2N/A Tritium N/A DPM/100 cm2
background for areaInterior of glovebag4 Smear N/A <200 DPM/100 cm2N/A 10000 DPM/100 cm2N/A Tritium N/A DPM/100 cm2
SAMPLE 35 Smear N/A <20 DPM/100 cm2N/A <200 DPM/100 cm2N/A Tritium N/A DPM/100 cm2
SAMPLE #31 Wipe ND DPM/WipeND DPM/Wipe
outside of glove bag2 Wipe ND DPM/WipeND DPM/Wipe
outside of glove bag3 Wipe ND DPM/WipeND DPM/Wipe
Text GlovebagText Sample portText Sample #3
Vault 4 Cell E grout Posting CAsampling areaRA
Survey #: DWPF-M-20080918-7 - Printed On: 10/09/2008 09:02 Page 6 of 9Image File: COMMON\MISCELLANEOUS\BLANK MAPDocument #: WD 21014

VSDS Standard Map RSLSMap: 3 Date/Time: 09/18/2008 14:02Survey #: DWPF-M-20080918-7BLANK MAP
Comments:
Job CoverageType:RWP #: 08-ZZZ-136Symbol Legend (for example only)
Unless otherwise noted, dose rates in mrem/hr.
Air Samples & WipesSmears
Summary of Highest Readings(All available values may not be listed)
10) <20 DPM/100 cm2
10) <200 DPM/100 cm2
Wipe 8) ND DPM/WipeWipe 8) ND DPM/Wipe
Status: Approved by: KISSIAH, STEPHANIE RHODES, 09/18/2008Lead Inspector: BRAXTON, CARLLocation Code: S221000 Bldg/Area Name: MISCELLANEOUSLocation Description: BLANK MAP
Survey #: DWPF-M-20080918-7 - Printed On: 10/09/2008 09:02 Page 7 of 9Image File: COMMON\MISCELLANEOUS\BLANK MAPDocument #: WD 21014

VSDS Standard Map RSLSData Point Details
# NotesType Inst. Value Units Position
Survey #: DWPF-M-20080918-7Map: 3 - COMMON\MISCELLANEOUS\BLANK MAP
BAGGED GLOVE BAG1 DR N/A E 2 mrem/hrN/A S 1 mrem/hrN/A 1 mrem/hr
GLOVE BAG2 DR N/A E 2 mrem/hrN/A S 1 mrem/hrN/A 1 mrem/hr
GLOVE BAG3 DR N/A E 2 mrem/hrN/A S 1 mrem/hrN/A 1 mrem/hr
B-254 DR N/A E ND mrem/hrN/A S ND mrem/hrN/A ND mrem/hr
MOTOR1 Smear N/A <20 DPM/100 cm2N/A <200 DPM/100 cm2
STAND2 Smear N/A <20 DPM/100 cm2N/A <200 DPM/100 cm2
STAND3 Smear N/A <20 DPM/100 cm2N/A <200 DPM/100 cm2
PIPE EXT.4 Smear N/A <20 DPM/100 cm2N/A <200 DPM/100 cm2
2 SMEARSGLOVE BAG WASTE5 Smear N/A <20 DPM/100 cm2N/A <200 DPM/100 cm2
2 SMEARSGLOVE BAG WASTE6 Smear N/A <20 DPM/100 cm2N/A <200 DPM/100 cm2
2 SMEARSGLOVE BAG WASTE7 Smear N/A <20 DPM/100 cm2N/A <200 DPM/100 cm2
4 SMEARSB-258 Smear N/A <20 DPM/100 cm2N/A <200 DPM/100 cm2
4 SMEARSB-259 Smear N/A <20 DPM/100 cm2N/A <200 DPM/100 cm2
2 SMEARS PER BAGLAUNDRY BAGS10 Smear N/A <20 DPM/100 cm2N/A <200 DPM/100 cm2
DRILL MOTOR1 Wipe ND DPM/WipeND DPM/Wipe
WERE FLEX HOSE WAS 2 Wipe ND DPM/WipeREMOVEDND DPM/Wipe
DRILL STAND/TABLE3 Wipe ND DPM/WipeND DPM/Wipe
GLOVE BAG WASTE4 Wipe ND DPM/WipeND DPM/Wipe
GLOVE BAG WASTE5 Wipe ND DPM/WipeND DPM/Wipe
GLOVE BAG WASTE6 Wipe ND DPM/WipeND DPM/Wipe
B-257 Wipe ND DPM/WipeND DPM/Wipe
LAUNDRY BAGS8 Wipe ND DPM/WipeND DPM/Wipe
STAND1 Direct N/A ND DPM/100 cm2 (T)N/A ND DPM/100 cm2 (T)
DRILL MOTOR / PIPE2 Direct N/A ND DPM/100 cm2 (T)N/A ND DPM/100 cm2 (T)
Survey #: DWPF-M-20080918-7 - Printed On: 10/09/2008 09:02 Page 8 of 9Image File: COMMON\MISCELLANEOUS\BLANK MAPDocument #: WD 21014

VSDS Standard Map RSLSData Point Details
# NotesType Inst. Value Units Position
Survey #: DWPF-M-20080918-7Map: 3 - COMMON\MISCELLANEOUS\BLANK MAP
Text DRILL MOTOR AND STAND
Text RAD BAGText B-25Text laundry bags x4
Survey #: DWPF-M-20080918-7 - Printed On: 10/09/2008 09:02 Page 9 of 9Image File: COMMON\MISCELLANEOUS\BLANK MAPDocument #: WD 21014