
LVTest VISUALCONNX Application manual LVTest VISUALCONNX Application Version 6.5.0 - bernard 0 0.
157
Document Type User manual Project Number and Name LVTest VISUALCONNX Application Document No. J001518 Version 6.5.0 Last Modified 20/03/2014 18:03:00 Create Date 29/04/2013 11:04:00 Checked by Author Bernard Leak Approved by Hawkesyard Hall, Armitage Park, RUGELEY, Staffordshire, WS15 1PU Tel: 01889 574400, Fax: 01889 576779, Email: [email protected] Copyright © add2 bernard Page 1 of 157 J001518 V6.5.0 LVTest VISUALCONNX Application.doc LVTest VISUALCONNX Application LVTGO-VBS GUI V6.5.0 Supports LVTGO-VBS Firmware V1.2.0 to V5.1.7 Requires VISUALCONNX V3.0 or later
Transcript of LVTest VISUALCONNX Application manual LVTest VISUALCONNX Application Version 6.5.0 - bernard 0 0.

Document Type User manual
Project Number and Name LVTest VISUALCONNX Application
Document No. J001518 Version 6.5.0 Last Modified 20/03/2014 18:03:00
Create Date 29/04/2013 11:04:00 Checked by
Author Bernard Leak Approved by
Hawkesyard Hall, Armitage Park, RUGELEY, Staffordshire, WS15 1PU
Tel: 01889 574400, Fax: 01889 576779, Email: [email protected]
Copyright © add2 bernard Page 1 of 157 J001518 V6.5.0 LVTest VISUALCONNX Application.doc
LVTest VISUALCONNX Application
LVTGO-VBS GUI V6.5.0
Supports LVTGO-VBS Firmware V1.2.0 to V5.1.7
Requires VISUALCONNX V3.0 or later

User manual LVTest VISUALCONNX Application Version 6.5.0 - bernard
Copyright add2 bernard Page 2 of 157 J001518 V6.5.0 LVTest VISUALCONNX Application.doc
Change History
Date of Issue Version No. Details of Change
14th Nov. 2008 1.0 First Release of documentation for GUI V2.0.5
31st March 2009 1.0.1 Update to support GUI version 3.0.0
22nd April 2009 1.1 Update to support GUI version 3.0.3
12th May 2009 1.2 Update to support LV Test GUI Version 3.0.5
3rd September 2009 1.3 Update to support LV Test GUI Version 3.0.6
22nd September 2009 1.3.1 Update to support LV Test GUI Version 3.0.7
16th November 2009 1.3.3 Update for Firmware 1.3.3, GUI Version 3.0.8 RC2
30th November 2009 1.3.4 Update for Firmware 1.3.4, GUI Version 3.0.8 RC3
18th December 2009 1.3.5 Update for Firmware 1.3.5, GUI Version 3.0.9 PRE
6th January 2010 1.4.0 Update for Firmware 1.4.0, GUI Version 3.5.0 PRE
14th January 2010 1.5.0 Update for Firmware 1.5.0, GUI Version 3.5.0 PRE
20th January 2010 1.5.1 Update for Firmware 1.5.1, GUI Version 3.5.0 PRE
25th February 2010 2.0.4 Update for Firmware 2.0.4 GUI Version 3.9.N
17th February 2011 3.0.0 Update for Firmware 3.0.0 GUI Version 4.0
9th November 2011 4.0.0 Update for Firmware 4.0.0 GUI Version 5.0
13th June 2012 5.0.0 Update for Firmware 5.0.0 GUI Version 6.0
4th February 2013 6.1.0 Update for Firmware 5.1.1 GUI Version 6.1
29th April 2013 6.1.1 Update for Firmware 5.1.2 GUI Version 6.1.1
20th March 2014 6.5.0 Update for Firmware 5.1.7 GUI Version 6.5.0

User manual LVTest VISUALCONNX Application Version 6.5.0 - bernard
Copyright add2 bernard Page 3 of 157 J001518 V6.5.0 LVTest VISUALCONNX Application.doc
Contents
LVTEST VISUALCONNX APPLICATION ................................................................................................. 1
CHANGE HISTORY ..................................................................................................................................... 2
CONTENTS ................................................................................................................................................... 3
INTRODUCTION .......................................................................................................................................... 8
1 CONVENTIONS IN THIS DOCUMENT .......................................................................................... 10
2 OVERVIEW ........................................................................................................................................ 10
3 HARDWARE ...................................................................................................................................... 11
3.1 [HARDWARE] THE LVTGO-VBS GROUND TERMINALS ...................................................................... 11 3.1.1 [Hardware] Small Units .......................................................................................................... 12 3.1.2 [Hardware] Mid-Sized Units.................................................................................................... 13 3.1.3 [Hardware] Rack-Mounted Units ............................................................................................. 13
4 SOFTWARE........................................................................................................................................ 15
4.1 [SOFTWARE]: LOAD THE LVTEST APPLICATION ................................................................................. 15 4.2 [SOFTWARE]: RUN THE LVTEST APPLICATION ................................................................................... 15
5 THE MAIN MENU ............................................................................................................................. 18
5.1 [MENU]: VIEW THE APPLICATION HELP DOCUMENT ............................................................................. 18 5.2 [MENU]: THE TAB-BAR ...................................................................................................................... 18 5.3 [MENU]: SELECTING AND USING A WAVEFORM .................................................................................. 19
6 THE WAVEFORM MAIN FORM ..................................................................................................... 21
6.1 [MAIN]: RETURNING TO THE MAIN MENU............................................................................................ 22 6.2 [MAIN]: SAVE THE CURRENT SETTINGS ............................................................................................... 22 6.3 [MAIN]: VIEWING THE APPLICATION HELP DOCUMENT ........................................................................ 22 6.4 [MAIN]: THE TAB-BAR ....................................................................................................................... 23 6.5 [MAIN]: LOADING WAVEFORM SETTINGS FROM PROFILES .................................................................... 24 6.6 [MAIN]: MODIFYING THE PARAMETERS THAT DEFINE THE WAVEFORM ................................................. 25 6.7 [MAIN]: RUNNING WAVEFORMS ......................................................................................................... 25
6.7.1 [Main]: Playing from and to a specified cycle .......................................................................... 25 6.7.2 [Main]: Starting, Pausing, Resuming and Stopping .................................................................. 26
6.8 [MAIN]: INSPECTING AND LOGGING PROGRESS AND OUTPUTS FROM THE LVT ...................................... 27 6.8.1 [Main]: Logging data from the LVT ......................................................................................... 30
6.9 [MAIN]: SELECTING A SPECIFIC CAPTURED WAVEFORM...................................................................... 31 6.10 [MAIN]: PRE-VIEWING CAPTURED AND MICRO-CUTOUTS WAVEFORMS .......................................... 32
7 THE VOLTAGE CONFIGURATIONS FORM ................................................................................. 33
7.1 [VOLTAGE]: RETURN TO THE PREVIOUS FORM .................................................................................... 33 7.2 [VOLTAGE]: SAVE THE CURRENT SETTINGS......................................................................................... 33 7.3 [VOLTAGE]: VIEWING THE APPLICATION HELP DOCUMENT .................................................................. 34 7.4 [VOLTAGE]: THE TAB-BAR ................................................................................................................. 34 7.5 [VOLTAGE]: ENABLING A, B AND C OUTPUTS IN A RANDOM CRANKING WAVEFORM............................ 35 7.6 [VOLTAGE]: THE NUMBER OF EFTBN STEPS ...................................................................................... 35 7.7 [VOLTAGE]: VOLTAGES DEFINING THE WAVEFORM ............................................................................. 35 7.8 [VOLTAGE]: VOLTAGE INSTABILITY WHILE LOADING PROFILES .......................................................... 36 7.9 [VOLTAGE]: SPECIAL CONSTRAINTS FOR RANDOM CRANKING WAVEFORMS ......................................... 36 7.10 [VOLTAGE]: ADDITIONAL VOLTAGE PARAMETERS .......................................................................... 37 7.11 [VOLTAGE]: VOLTAGE PARAMETERS FOR MICRO-CUTOUTS ........................................................... 38 7.12 [VOLTAGE]: THE WAVEFORM DIAGRAM ......................................................................................... 39 7.13 [VOLTAGE]: THE HELP TEXT .......................................................................................................... 39
User manual LVTest VISUALCONNX Application Version 6.5.0 - bernard
Copyright add2 bernard Page 4 of 157 J001518 V6.5.0 LVTest VISUALCONNX Application.doc
8 THE TIMING AND FREQUENCY CONFIGURATIONS FORM ................................................... 40
8.1 [TIME]: RETURN TO THE PREVIOUS FORM ........................................................................................... 40 8.2 [TIME]: SAVING THE SETTINGS ........................................................................................................... 40 8.3 [TIME]: VIEWING THE APPLICATION HELP DOCUMENT ......................................................................... 41 8.4 [TIME]: THE TAB-BAR ........................................................................................................................ 41 8.5 [TIME]: TIMES AND FREQUENCIES DEFINING THE WAVEFORM .............................................................. 41
8.5.1 [Main]: Timing Parameters for Micro-Cutouts waveforms ....................................................... 42 8.6 [TIME]: SCALING THE DURATION OF TIME-STEPS ................................................................................. 43 8.7 [TIME]: EFTBN CONFIGURATION ....................................................................................................... 44 8.8 [TIME]: THE WAVEFORM DIAGRAM .................................................................................................... 45 8.9 [TIME]: THE HELP-TEXT .................................................................................................................... 45 8.10 [TIME]: THE OUTPUT FILTER CONTROL .......................................................................................... 46 8.11 [TIME]: WAVEFORM-SPECIFIC DETAILS .......................................................................................... 47
9 SETTINGS AND RANDOMISATION ............................................................................................... 48
9.1 [SETTINGS]: FIXED (NO RANDOMISATION) .......................................................................................... 49 9.2 [SETTINGS]: UNIFORMLY DISTRIBUTED .............................................................................................. 49 9.3 [SETTINGS]: NORMAL DISTRIBUTIONS ................................................................................................ 49 9.4 [SETTINGS]: 1/X2
DISTRIBUTION.......................................................................................................... 50 9.5 [SETTINGS]: RANDOM SEEDS.............................................................................................................. 50 9.6 [SETTINGS]: RESOLUTION .................................................................................................................. 51 9.7 [SETTINGS]: SCALING TIME SETTINGS ................................................................................................ 51
10 THE PARAMETER MONITORING FORM .................................................................................... 53
10.1 [PARAMETERS]: RETURN TO THE PREVIOUS FORM .......................................................................... 53 10.2 [PARAMETERS]: VIEWING THE APPLICATION HELP DOCUMENT ........................................................ 53 10.3 [PARAMETERS]: THE TAB-BAR ....................................................................................................... 54 10.4 [PARAMETERS]: SELECTING PARAMETERS TO INSPECT .................................................................... 54 10.5 [PARAMETERS]: THE MAIN PARAMETER VALUES STRIP-CHART ........................................................ 55 10.6 [PARAMETERS]: CONTROLLING PARAMETER STREAMING ................................................................ 55
11 THE INPUT TRIGGER CONFIGURATION FORM ....................................................................... 56
11.1 [INPUT TRIGGERS]: RETURN TO THE PREVIOUS FORM...................................................................... 56 11.2 [INPUT TRIGGERS]: SAVING THE SETTINGS ..................................................................................... 57 11.3 [INPUT TRIGGERS]: VIEWING THE APPLICATION HELP DOCUMENT ................................................... 57 11.4 [INPUT TRIGGERS]: THE TAB-BAR .................................................................................................. 57 11.5 [INPUT TRIGGERS]: INPUT TRIGGERS .............................................................................................. 57 11.6 [INPUT TRIGGERS]: THE HELP-TEXT .............................................................................................. 59 11.7 [INPUT TRIGGERS]: THE OBSOLETE DEFAULT CAN TRIGGER .......................................................... 60
12 THE OUTPUT TRIGGER CONFIGURATION FORM ................................................................... 61
12.1 [OUTPUT TRIGGERS]: RETURN TO THE PREVIOUS FORM .................................................................. 61 12.2 [OUTPUT TRIGGERS]: SAVING THE SETTINGS .................................................................................. 61 12.3 [OUTPUT TRIGGERS]: VIEWING THE APPLICATION HELP DOCUMENT ................................................ 62 12.4 [OUTPUT TRIGGERS]: THE TAB-BAR............................................................................................... 62 12.5 [OUTPUT TRIGGERS]: USING THE ADDITIONAL CONFIGURATION TRIGGER FOR SCRIPTED
CONFIGURATION CHANGES .......................................................................................................................... 63 12.6 [OUTPUT TRIGGERS]: TRIGGERING RAMP UP AND DOWN WAVEFORMS ........................................... 63 12.7 [OUTPUT TRIGGERS]: OUTPUT TRIGGERS ....................................................................................... 64 12.8 [OUTPUT TRIGGERS]: TRIGGERING ON A SCALED TIME-STEP ........................................................... 65 12.9 [OUTPUT TRIGGERS]: OUTPUT TRIGGERS - ANALOGUE.................................................................... 65 12.10 [OUTPUT TRIGGERS]: OUTPUT TRIGGERS – CAN ............................................................................ 66 12.11 [OUTPUT TRIGGERS]: ADDITIONAL ANALOGUE TRIGGERS ............................................................... 66 12.12 [OUTPUT TRIGGERS]: THE HELP-TEXT ........................................................................................... 69 12.13 [OUTPUT TRIGGERS]: CHANGES TO CONTROLS FOR MICRO-CUTOUTS ............................................. 69
13 THE MISCELLANEOUS SETTINGS FORM................................................................................... 71
13.1 [MISC]: RETURN TO THE PREVIOUS FORM ....................................................................................... 71 13.2 [MISC]: NAVIGATING TO SPECIFIC FORMS ...................................................................................... 71 13.3 [MISC]: VIEWING THE APPLICATION HELP DOCUMENT .................................................................... 72 13.4 [MISC]: THE TAB-BAR ................................................................................................................... 72

User manual LVTest VISUALCONNX Application Version 6.5.0 - bernard
Copyright add2 bernard Page 5 of 157 J001518 V6.5.0 LVTest VISUALCONNX Application.doc
13.5 [MISC]: THE CYCLE-NUMBER STREAMING CONTROL ...................................................................... 73 13.6 [TIME]: THE GO FEEDBACK CONTROL ........................................................................................... 74 13.7 [MISC]: THE LOGGING-COMPRESSION CONTROLS............................................................................ 74 13.8 [MISC]: THE DATA-RETENTION CONTROL ....................................................................................... 75 13.9 [MISC]: THE READBACKS STRIP-CHART .......................................................................................... 76
14 THE ERROR STATUS AND SPECIAL VALUES FORM................................................................ 77
14.1 [SPECIAL]: RETURN TO THE PREVIOUS FORM .................................................................................. 77 14.2 [SPECIAL]: NAVIGATING TO SPECIFIC FORMS .................................................................................. 77 14.3 [SPECIAL]: VIEWING THE APPLICATION HELP DOCUMENT ................................................................ 78 14.4 [SPECIAL]: THE TAB-BAR .............................................................................................................. 78 14.5 [SPECIAL]: ERROR STATUS ............................................................................................................ 79 14.6 [SPECIAL]: VERSION NUMBERS ...................................................................................................... 80 14.7 [SPECIAL]: MAKE SETTINGS PERSISTENT ........................................................................................ 81 14.8 [SPECIAL]: THE SPECIAL VALUES INTERFACE................................................................................. 82 14.9 [SPECIAL]: THE OUTPUT-RANGE CONTROLS.................................................................................... 83
15 THE TRIP STATUS FORM ............................................................................................................... 85
15.1 [TRIPS]: RETURN TO THE PREVIOUS FORM ...................................................................................... 85 15.2 [TRIPS]: NAVIGATING TO SPECIFIC FORMS ...................................................................................... 85 15.3 [TRIPS]: VIEWING THE APPLICATION HELP DOCUMENT .................................................................... 86 15.4 [TRIPS]: THE TAB-BAR .................................................................................................................. 86 15.5 [TRIPS]: INSPECTING THE TRIP STATE ............................................................................................. 87 15.6 [TRIPS]: TRIP-LIKE BEHAVIOUR ..................................................................................................... 87 15.7 [TRIPS]: INSPECTING THE TRIP LOG ................................................................................................ 88 15.8 [TRIPS]: INSPECTING THE THERMAL INFORMATION ......................................................................... 90
16 THE HIL INPUTS FORM .................................................................................................................. 91
16.1 [HIL]: RETURN TO THE PREVIOUS FORM ........................................................................................ 91 16.2 [HIL]: NAVIGATING TO SPECIFIC FORMS ........................................................................................ 92 16.3 [HIL]: VIEWING THE APPLICATION HELP DOCUMENT ...................................................................... 92 16.4 [HIL]: THE TAB-BAR ..................................................................................................................... 92 16.5 [HIL]: VIEWING THE APPLICATION HELP DOCUMENT ...................................................................... 93 16.6 [HIL]: THE HIL INPUTS SHOWN NUMERICALLY, AND AS BINARY DATA............................................ 93 16.7 [HIL]: SETTING THE HIL READBACK INTERVAL ............................................................................. 93 16.8 [HIL]: SELECTING THE HIL INPUT TO SHOW ON THE WAVEFORM MAIN FORM ................................. 94 16.9 [HIL]: THE HIL STRIP-CHART ....................................................................................................... 94
17 EXTREMELY FAST TRANSIENT BURST NOISE ......................................................................... 95
17.1 [EFTBN]: CHANGE AND VIEW DURATION AND CYCLE INFORMATION .............................................. 95 17.2 [EFTBN]: MODIFY THE VOLTAGE PARAMETERS ............................................................................. 96
17.2.1 [EFTBN]: Setting the number of steps ................................................................................. 96 17.3 [EFTBN]: MODIFY THE TIME PARAMETERS.................................................................................... 97
18 RANDOM CRANKING WAVEFORM ............................................................................................. 98
18.1 [CRANK]: CHANGE AND VIEW DURATION AND CYCLE INFORMATION ............................................... 98 18.2 [CRANK]: MODIFY THE VOLTAGE PARAMETERS.............................................................................. 99 18.3 [CRANK]: VOLTAGE CONSTRAINTS FOR RANDOM CRANKING........................................................ 100 18.4 [CRANK]: MODIFY THE TIME AND FREQUENCY PARAMETERS ........................................................ 101
19 RAMP UP AND DOWN.................................................................................................................... 102
19.1 [RAMP]: CHANGE AND VIEW DURATION AND CYCLE INFORMATION ............................................... 102 19.2 [RAMP]: MODIFY THE VOLTAGE PARAMETERS.............................................................................. 103 19.3 [RAMP]: MODIFY THE TIME PARAMETERS .................................................................................... 104
20 CONSTANT VOLTAGE .................................................................................................................. 105
20.1 [CONSTANT]: MODIFY THE VOLTAGE PARAMETERS ...................................................................... 106 20.2 [CONSTANT]: MODIFY THE TIME PARAMETERS ............................................................................. 107
21 ALTERNATIVE RAMP ................................................................................................................... 108
21.1 [ALT. RAMP]: CHANGE AND VIEW DURATION AND CYCLE INFORMATION ....................................... 109

User manual LVTest VISUALCONNX Application Version 6.5.0 - bernard
Copyright add2 bernard Page 6 of 157 J001518 V6.5.0 LVTest VISUALCONNX Application.doc
21.2 [ALT. RAMP]: MODIFY THE VOLTAGE PARAMETERS ..................................................................... 109 21.3 [ALT. RAMP]: MODIFY THE TIME PARAMETERS ............................................................................ 110
22 CAPTURED WAVEFORMS ............................................................................................................ 111
22.1 [CAPTURED]: CHANGE AND VIEW DURATION AND CYCLE INFORMATION........................................ 112 22.2 [CAPTURED]: MODIFY THE VOLTAGE PARAMETERS ...................................................................... 112 22.3 [CAPTURED]: MODIFY THE TIME PARAMETERS ............................................................................. 113 22.4 [CAPTURED]: IMPORTING, RESAMPLING AND MANAGING CAPTURED WAVEFORMS ....................... 113
23 MICRO-CUTOUTS WAVEFORMS ................................................................................................ 114
23.1 MICRO-CUTOUTS PREVIEW ......................................................................................................... 115 23.2 [CAPTURED]: CHANGE AND VIEW DURATION AND CYCLE INFORMATION........................................ 115 23.3 [CAPTURED]: MODIFY THE VOLTAGE PARAMETERS ...................................................................... 115 23.4 [CAPTURED]: MODIFY THE TIME PARAMETERS ............................................................................. 117
24 THE CAPTURED IMPORT FORM ................................................................................................ 118
24.1 [IMPORT]: SCANNING THE CURRENT WAVEFORM DIRECTORY ........................................................ 119 24.2 [IMPORT]: RETURN TO THE PREVIOUS FORM ................................................................................. 119 24.3 [IMPORT]: VIEWING THE APPLICATION HELP DOCUMENT ............................................................... 119 24.4 [IMPORT]: THE TAB-BAR ............................................................................................................. 120 24.5 [IMPORT]: DESTINATION FOLDER CONTROL ................................................................................. 120 24.6 [IMPORT]: ACTION BUTTONS ....................................................................................................... 120 24.7 [IMPORT]: IMPORTED WAVEFORMS LIST-BOX ............................................................................... 122 24.8 [IMPORT]: ACTIVITY LOG CONTROLS ........................................................................................... 122 24.9 [IMPORT]: WAVEFORM DETAILS DISPLAY .................................................................................... 124 24.10 [IMPORT]: PROGRESS BAR ........................................................................................................... 125 24.11 [IMPORT]: HELP FRAME ............................................................................................................... 125
25 THE CAPTURED RESAMPLE FORM ........................................................................................... 126
25.1 [RESAMPLE]: SCANNING ............................................................................................................. 126 25.2 [RESAMPLE]: RETURN TO THE PREVIOUS FORM ............................................................................ 127 25.3 [RESAMPLE]: VIEWING THE APPLICATION HELP DOCUMENT .......................................................... 127 25.4 [RESAMPLE]: THE TAB-BAR ......................................................................................................... 127 25.5 [RESAMPLE]: WAVEFORM FOLDER CONTROL ............................................................................... 128 25.6 [RESAMPLE]: THE LIST-BOXES ..................................................................................................... 128 25.7 [RESAMPLE]: SPACE USED FRAME ............................................................................................... 129 25.8 [RESAMPLE]: ACTIVITY LOG CONTROLS ...................................................................................... 130 25.9 [RESAMPLE]: ACTION BUTTONS .................................................................................................. 130 25.10 [RESAMPLE]: WAVEFORM DATA FRAME ...................................................................................... 131 25.11 [RESAMPLE]: GRAPH ................................................................................................................... 132 25.12 [RESAMPLE]: HELP TEXT ............................................................................................................ 132 25.13 [RESAMPLE]: PROGRESS BAR ...................................................................................................... 133 25.14 [RESAMPLE]: QUICK HELP .......................................................................................................... 133 25.15 [RESAMPLE]: RESAMPLING CONTROLS ........................................................................................ 134
26 GENERAL DISCUSSION OF THE RESAMPLING PROCESS .................................................... 137
26.1 [DISCUSSION]: PRECISION SETTINGS FOR THE VOLTAGES .............................................................. 137 26.2 [DISCUSSION]: OPTIONS FOR THE TIME-STAMP DATA .................................................................... 137 26.3 [DISCUSSION]: THE STAGES OF RE-SAMPLING ............................................................................... 138 26.4 [DISCUSSION]: SPECIAL CONSIDERATIONS FOR REPEAT-COUNTS ................................................... 139
27 THE CAPTURED TRANSFER FORM ........................................................................................... 140
27.1 [TRANSFER]: SCANNING .............................................................................................................. 141 27.2 [TRANSFER]: RETURN TO THE PREVIOUS FORM ............................................................................. 141 27.3 [TRANSFER]: VIEWING THE APPLICATION HELP DOCUMENT .......................................................... 142 27.4 [TRANSFER]: THE TAB-BAR ......................................................................................................... 142 27.5 [TRANSFER]: WAVEFORM FOLDER CONTROL ............................................................................... 142 27.6 [TRANSFER]: THE LIST-BOXES ..................................................................................................... 142 27.7 [TRANSFER]: ACTIVITY LOG CONTROLS ...................................................................................... 143 27.8 [TRANSFER]: ACTION BUTTONS................................................................................................... 144 27.9 [TRANSFER]: BUSY LABEL .......................................................................................................... 147

User manual LVTest VISUALCONNX Application Version 6.5.0 - bernard
Copyright add2 bernard Page 7 of 157 J001518 V6.5.0 LVTest VISUALCONNX Application.doc
27.10 [TRANSFER]: SPACE USED FRAME................................................................................................ 147 27.11 [TRANSFER]: WAVEFORM DETAILS ............................................................................................. 147 27.12 [TRANSFER]: HELP FRAME .......................................................................................................... 149 27.13 [TRANSFER]: PROGRESS BAR....................................................................................................... 149
28 REPLAYING PROBLEMATIC WAVEFORM CYCLES .............................................................. 150
29 TEST STANDARDS ......................................................................................................................... 151
29.1 CI 230 – SOME SPECIAL OBSERVATIONS ....................................................................................... 152
30 SCRIPTING USING THE COM INTERFACE ............................................................................... 153
30.1 [SCRIPTING]: COM SCRIPTING AND INPUT TRIGGERS .................................................................... 153 30.1.1 [Scripting]: Using an Analogue Input Trigger from COM .................................................. 154 30.1.2 [Scripting]: Using a User-Configured CAN Trigger from COM ......................................... 154 30.1.3 [Scripting]: Using a Configuration Trigger from COM ...................................................... 155 30.1.4 [Scripting]: Changes to the COM input trigger interface ................................................... 155 30.1.5 [Scripting]: Converting old COM scripts using Default CAN triggers ................................ 156 30.1.6 [Scripting]: Voltages over 20V in configuring 20V LVTGO-VBS units ............................... 156
31 RECOMMENDED SETTINGS FOR RUNNING THE APPLICATION........................................ 157

User manual LVTest VISUALCONNX Application Version 6.5.0 - bernard
Copyright add2 bernard Page 8 of 157 J001518 V6.5.0 LVTest VISUALCONNX Application.doc
Introduction
This document describes the use of the Low Voltage Test Suite, a VISUALCONNX scripting
application. It is available as a PDF file, LVTestApplication.pdf and as a Windows Help file,
LVTestApplication.chm
What is the Low Voltage Test Suite?
The Low Voltage Test Suite is a suite of hardware and software that can create simulations of
real-world waveforms such as engine cranking tests, battery ramp tests and fast transient
generation (“rusty file”) tests.
These tests are defined using modelling techniques which simplify and parametrise the
waveform shapes. This technique allows for long-term testing to take place without a lot of
data storage being necessary. In addition to low storage requirements, the technique allows
for controlled random variation of voltages and time periods using repeatable waveforms.
Should the unit under test fail, the waveforms which produced the failure can be exactly
reproduced.
In addition to the sophisticated software techniques, leading-edge power drive hardware is
used to generate very fast output transitions at high currents, thus exceeding the transient
performance of most modern power supplies. In fact, for nominal output voltages (up to 20V
or 30V, depending on the unit), a simple power supply and vehicle battery can be used to
reduce system costs while maintaining very good output characteristics. An important
feature is that falling output voltages can be actively driven down towards the ground
voltage, which can help overcome distortions due to the impedance of the device under test.
The supplied software package runs as a VISUALCONNX GUI scripting application.
VISUALCONNX is a powerful visualisation tool running under Microsoft WindowsTM
which provides a platform that can communicate with the low voltage test hardware.
The user interface also gives access to diagnostics such as the heatsink temperature of the
tester and the status of thermal and over-power trips. Some values can also be logged to hard
disk if test evidence is required.
For a detailed reference to the “Low Voltage Tester Ground Offset - Vehicle Battery
Simulator”, please refer to the LVTGO-VBS - Specification Sheet.
The GUI supports importing user-captured waveforms and transferring them to the LVTGO-
VBS unit to be replayed. This is documented in the chapters on the Captured Import,
Captured Resampling and Captured Transfer forms. Please also read the chapter on the
resampling process.
The output of the LVTGO-VBS unit can be re-scaled to act as an input to an external power
amplifier. The current support is detailed under the heading Special_Values_Output_Range.
If you have custom requirements, please get in touch with add2.
The output can be shifted by a controllable ground offset, and can also be clipped to a
specified maximum voltage. These voltages can be modified during a test without halting the
waveform being generated. Details can be found here.

User manual LVTest VISUALCONNX Application Version 6.5.0 - bernard
Copyright add2 bernard Page 9 of 157 J001518 V6.5.0 LVTest VISUALCONNX Application.doc
There is also a powerful scripting mechanism by which repetitious operations in the GUI can
be automated. This is currently being extended to cover all the control features of the GUI
which are important for unattended running. See the chapter on the COM Scripting Interface
for additional details and further references.

User manual LVTest VISUALCONNX Application Version 6.5.0 - bernard
Copyright add2 bernard Page 10 of 157 J001518 V6.5.0 LVTest VISUALCONNX Application.doc
1 Conventions in this document
Names in Bold Italics denote user controls labelled with that name, in an application form or
other parts of the Windows interface. This is also used for labels on parts of the LVTGO-
VBS unit itself.
The names of buttons and hot-spots are given in [Square Brackets].
A pipe (|) character is used to separate successive stages in navigating a GUI. For instance,
many applications have a Paste operation which can be reached with Edit | Paste.
2 Overview
The Low Voltage Test Suite is most commonly used as a way of generating a sequence of
test waveforms with repeatable pseudo-random settings. However, this is not the only way to
drive it, and it has several other capabilities.
In addition to the built-in waveform generator, the LVTGO-VBS unit’s outputs can be
specified directly with analogue inputs (effectively using the unit as a signal amplifier with
low output impedance) or with CAN messages. This is most useful when reproducing a
waveform programmatically using the COM scripting interface.
The LVT can be made to defer playing a cycle until a trigger is received. The mechanism
provides not only for internally-generated CAN triggers (used for the Ramp Up and Down
waveform, and also used by the COM scripting interface) but also for user triggers, which
can be sent as analogue signals into the LVTGO-VBS unit or as user-configured CAN
messages. User CAN triggers are sent over a separate CAN bus to avoid potential clashes
with the CAN IDs used by the application interface. Both level-sensitive and edge-sensitive
triggers are possible, allowing both immediate control at the moment when the cycle is due to
begin and a produce/consumer relationship in which triggers can be sent in advance.
Triggers can also be emitted. These include user-configured CAN triggers (again, emitted
over the separate CAN bus) and two different approaches to analogue triggers, as simple
pulses or separately-configured edges. These can be anchored to different stages during
waveform generation.
A considerable amount of diagnostic information is available from the LVTGO-VBS unit,
some of it available over the analogue outputs (see the LVTGO-VBS Specification Sheet for
more details), but mostly over CAN. This includes the target (intended) output voltages, the
actually read output voltages, the current passed, the fan speed, and the temperature at the
internal heat-sink. Most of this information is available through the Miscellaneous Settings
form, or other forms reached from it.
Errors in the CAN communication or in the content of CAN messages received by the LVT
are reported. Trip states (such as over-temperature) to which the LVT responds by driving its
outputs to zero are both reported and logged. The log can be inspected and cleared.
Additional information is available for troubleshooting. This includes the version
information here, and the Special Values interface for inspecting the LVT’s internal state. It
is helpful if the version information is included in any bug reports. The Special Values
interface is a very low-level interface which is not directly useful to users, but add2 may ask
users to use it to diagnose problems.
User manual LVTest VISUALCONNX Application Version 6.5.0 - bernard
Copyright add2 bernard Page 11 of 157 J001518 V6.5.0 LVTest VISUALCONNX Application.doc
3 Hardware
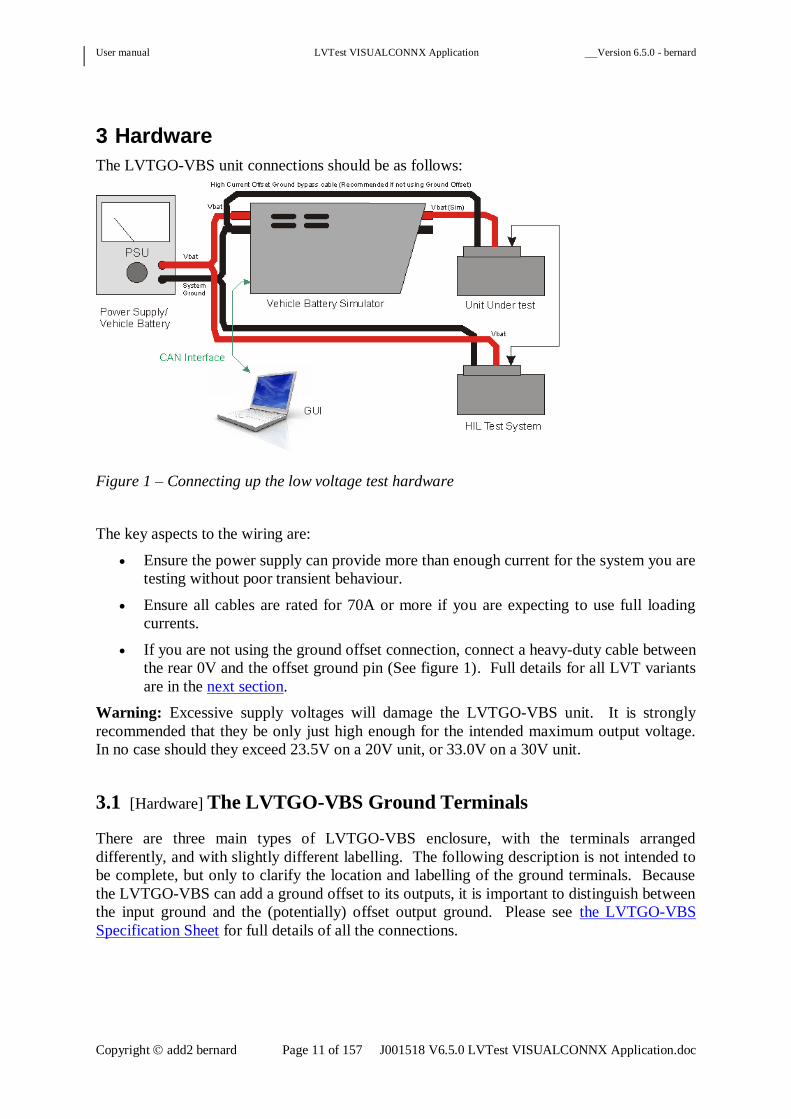
The LVTGO-VBS unit connections should be as follows:
Figure 1 – Connecting up the low voltage test hardware
The key aspects to the wiring are:
Ensure the power supply can provide more than enough current for the system you are
testing without poor transient behaviour.
Ensure all cables are rated for 70A or more if you are expecting to use full loading
currents.
If you are not using the ground offset connection, connect a heavy-duty cable between
the rear 0V and the offset ground pin (See figure 1). Full details for all LVT variants
are in the next section.
Warning: Excessive supply voltages will damage the LVTGO-VBS unit. It is strongly
recommended that they be only just high enough for the intended maximum output voltage.
In no case should they exceed 23.5V on a 20V unit, or 33.0V on a 30V unit.
3.1 [Hardware] The LVTGO-VBS Ground Terminals
There are three main types of LVTGO-VBS enclosure, with the terminals arranged
differently, and with slightly different labelling. The following description is not intended to
be complete, but only to clarify the location and labelling of the ground terminals. Because
the LVTGO-VBS can add a ground offset to its outputs, it is important to distinguish between
the input ground and the (potentially) offset output ground. Please see the LVTGO-VBS
Specification Sheet for full details of all the connections.

User manual LVTest VISUALCONNX Application Version 6.5.0 - bernard
Copyright add2 bernard Page 12 of 157 J001518 V6.5.0 LVTest VISUALCONNX Application.doc
3.1.1 [Hardware] Small Units
The small free-standing enclosure has its input terminals at the back, at the top left of the unit
as seen from the back, above the 15-pin D-Sub connector labelled I/O Connection A. They
are side by side: one labelled VB IN, with a red knob, in the corner, and one labelled GND
IN, with a black knob, to the right of it. The output terminals are at the front, at the top right
of the unit as seen from the front, above the STATUS and TRIP LEDs. They are one above
the other: one labelled VB OUT, with a red knob, in the corner, and one labelled GND OUT,
with a black knob, below it. The ground supply terminal for the device under test depends on
the use of a ground-offset. Use the GND IN terminal for greater stability if you want no
ground offset; for a non-zero ground offset, use the GND OUT terminal.
If a small unit is supplied with BCD outputs, the additional C and D outputs are brought out
on the rear panel, above the power LED. The input connectors are unchanged.
T

User manual LVTest VISUALCONNX Application Version 6.5.0 - bernard
Copyright add2 bernard Page 13 of 157 J001518 V6.5.0 LVTest VISUALCONNX Application.doc
3.1.2 [Hardware] Mid-Sized Units
Larger free-standing versions of the LVT exist. These support additional functionality (e.g,,
Micro-Cutouts waveforms), and may be fitted with additional outputs. The additional outputs
are brought out at the front. The right-hand side of the rear panel is almost exactly like the
rear panel of a single-output small unit, and the front panel is almost exactly like the left-hand
part of the front panel of a rack-sized unit without an integral power supply, so they are not
described further here.
3.1.3 [Hardware] Rack-Mounted Units
The two other variants are large enclosures designed for mounting in a rack. The picture
above shows the left-hand end of the front panel. Not all the outputs may be fitted. If there is
a single positive output, it is the VOUT (D) output at the top left on a red base.
The two RJ45 connectors (CAN and RS485) and the I/O Connection A connector are still at
the back, now at the lower right-hand corner seen from the back. Both of them use screw
terminals with plastic bases, black for ground terminals and red for the others. Seen from the
front, the main output connectors are at the top left. In the corner is a terminal with a red
base, labelled VOUT (D). Below it is a terminal with a black base, labelled VGND (0V). To the
right of the VGND (0V) terminal, on the other side of the fan, and nearer the base of the unit, is a
terminal labelled VGND OFFSET. Use the VGND (0V) terminal for greater stability if you want no
ground offset; for a non-zero ground offset, use the VGND OFFSET terminal.

User manual LVTest VISUALCONNX Application Version 6.5.0 - bernard
Copyright add2 bernard Page 14 of 157 J001518 V6.5.0 LVTest VISUALCONNX Application.doc
One variant uses the same input terminals as the small free-standing enclosure, except that in
the larger box they are not in the corner of the box but nearer the centre, labelled VIN for the
positive supply input and OV for the ground input. The other variant has an integral power
supply, fed with mains power from a normal IEC 3-pin connector at the back of the unit, near
the centre at the bottom. The outputs from the power-supply are fed directly internally to the
LVTGO-VBS, whose power input terminals are not accessible outside the enclosure.
However, the power-supply outputs are also fed to additional terminals at the front of the
unit, near the top and the centre, VPSU and VGND (0V). The two terminals labelled VGND (0V) are
equivalent.
To avoid laborious wording, the rest of this document refers to the terminals as they are
labelled on the small free-standing enclosure, with occasional references to the VGND (0V)
terminal.
See also the short section on the GO Feedback control for configuring the LVTGO-VBS unit.
The unit cannot infer from a zero ground-offset setting that the setting will remain zero, and
has no way to determine which terminal is actually being used to supply the device under
test. The associated configuration is the responsibility of the user. However, it is stored with
a waveform profile, and will be set accordingly whenever a profile is loaded. The profiles
supplied with the LVTest VISUALCONNX Application already include appropriate settings.
User manual LVTest VISUALCONNX Application Version 6.5.0 - bernard
Copyright add2 bernard Page 15 of 157 J001518 V6.5.0 LVTest VISUALCONNX Application.doc
4 Software
4.1 [Software]: Load the LVTest Application
Run the LVTest application for VISUALCONNX from the start menu:
START | All Programs | add2 | LVTest VCX Project V6 | LVTest 6
VISUALCONNX will proceed to load all the Forms and Scripts and the LV Test connection
to allow communications over the CAN port. This may take a few seconds.
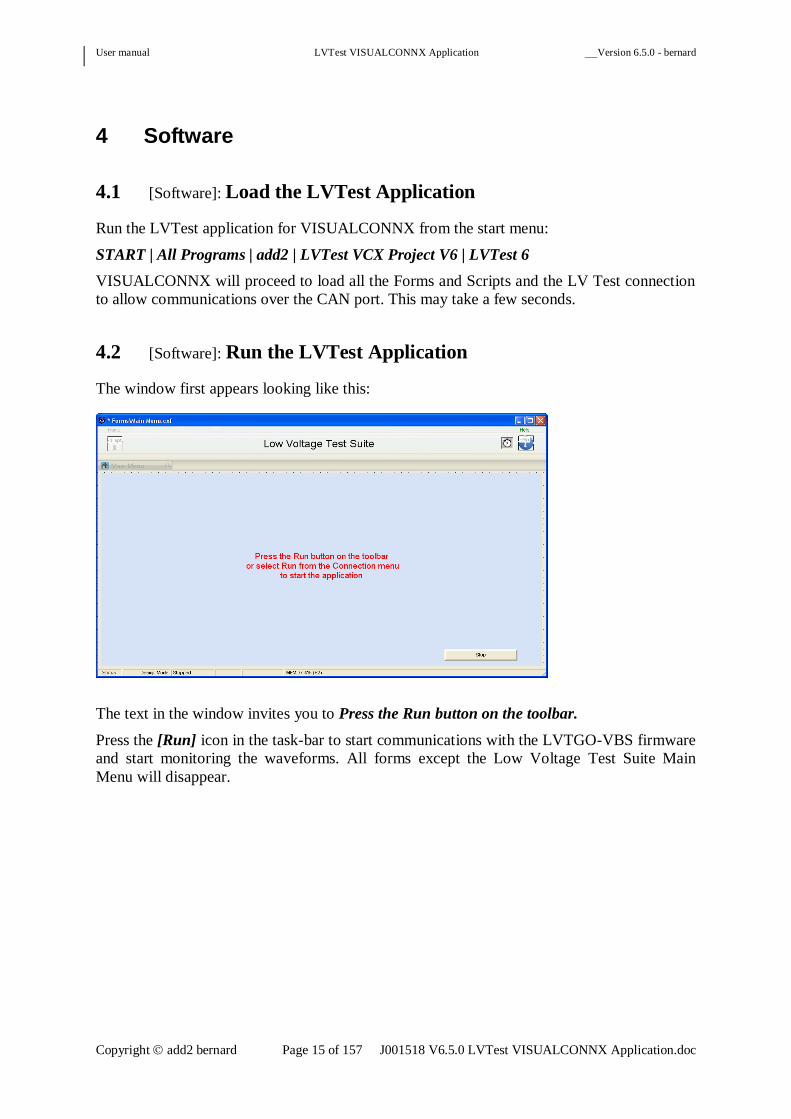
4.2 [Software]: Run the LVTest Application
The window first appears looking like this:
The text in the window invites you to Press the Run button on the toolbar.
Press the [Run] icon in the task-bar to start communications with the LVTGO-VBS firmware
and start monitoring the waveforms. All forms except the Low Voltage Test Suite Main
Menu will disappear.

User manual LVTest VISUALCONNX Application Version 6.5.0 - bernard
Copyright add2 bernard Page 16 of 157 J001518 V6.5.0 LVTest VISUALCONNX Application.doc
While the application connects, the text in the window shows as Connecting…
If the application is unable to communicate with the LVTGO-VBS, or communication is
interrupted, the following screen will be shown. If communication is resumed the connection
will be re-initialised.

User manual LVTest VISUALCONNX Application Version 6.5.0 - bernard
Copyright add2 bernard Page 17 of 157 J001518 V6.5.0 LVTest VISUALCONNX Application.doc
Successful connection to the LVTGO-VBS will bring up the Main Menu.

User manual LVTest VISUALCONNX Application Version 6.5.0 - bernard
Copyright add2 bernard Page 18 of 157 J001518 V6.5.0 LVTest VISUALCONNX Application.doc
5 The Main Menu
From this form you can choose one of the following waveform types by clicking on its
button:
Extremely Fast Transient Burst Noise
Random Cranking
Ramp Up and Down
Constant Voltage
Alternative Ramp
Captured Waveforms
Micro-Cutouts
5.1 [Menu]: View the application help document
Clicking on the [Help] hot-spot at the top right of the form brings up a WindowsTM
Help
document for the application.
5.2 [Menu]: The tab-bar
The tab-bar is present for consistency with the other forms. It shows only this (disabled) tab.

User manual LVTest VISUALCONNX Application Version 6.5.0 - bernard
Copyright add2 bernard Page 19 of 157 J001518 V6.5.0 LVTest VISUALCONNX Application.doc
5.3 [Menu]: Selecting and using a Waveform
For each waveform type, first select the Waveform type by clicking on one of the buttons in
the column down the left, and then click the [Configure and Run Test] button. You will
notice that the [Configure and Run Test] button shows momentarily RED when you choose
a waveform type, to remind you to use that button next.
Normal state
Prompting state after selecting waveform type
This configures the application software to play the selected waveform type, brings up the
Waveform Main form, and causes the last-used profile for that waveform type to be reloaded.
There are two editable controls below the diagram of the selected waveform type. See the
Settings and Randomisation chapter for detailed instructions on modifying their contents. It
is best and easiest to change these, if you wish to change them, before selecting the waveform
type.
The Main Readback Interval (ms) should be short enough to capture the main features of the
waveform. This is normally most important for rapid EFTBN cycles. However, a very short
readback interval (such as 1ms) will use a considerable fraction of the available CAN
bandwidth, and on lower-performance PCs it may supply data faster than they can be
processed by the application.
The Graph Read Interval (ms) is less critical. It controls the frequency with which
information from the LVT is updated. Making it quite short will ensure that visible values
(e.g., in strip-charts) are updated promptly.
The large picture occupying the lower part of the form gives a preview of the waveform type.
Initially it shows a Random Cranking waveform; selecting another waveform type brings up
the appropriate picture.

User manual LVTest VISUALCONNX Application Version 6.5.0 - bernard
Copyright add2 bernard Page 20 of 157 J001518 V6.5.0 LVTest VISUALCONNX Application.doc
Overlaid on the waveform-type diagram are the version numbers of the GUI at the lower left-
hand corner, and the version number of the firmware at the lower right-hand corner.
The Stop Button at the lower right of the form is used to exit the application. It prompts the
user to confirm the exit with the following dialogue-box:
Selecting [No] dismisses the message box, and the user is returned to the Main Menu.
Selecting [Yes] stops the application and disconnects from the Low Voltage Tester.
Disconnecting will not interrupt the LVT while it is playing a waveform. Waveforms using
the Configuration Trigger (such as the Ramp Up and Down waveform) will not continue
beyond the end of the present cycle unless the trigger is supplied (over the Host CAN bus)
from some other source.

User manual LVTest VISUALCONNX Application Version 6.5.0 - bernard
Copyright add2 bernard Page 21 of 157 J001518 V6.5.0 LVTest VISUALCONNX Application.doc
6 The Waveform Main form
This form is initially reached from the Main Menu by clicking on the buttons [Waveform A],
[Waveform B], [Waveform C], [Waveform D], [Free Ramp] or [Captured Waveforms].
Most other forms allow a direct return to this form, configured for the currently-chosen
waveform type, using a tab at the left-hand end of their tab-bars.
The heading shows the currently selected waveform type, but otherwise it is common to all
the different waveform types. Depending on the waveform type, some controls may be
hidden or disabled. It is recommended that the user read this chapter, and the chapters on
Voltage Configurations, Timing and Frequency Configurations and Settings and
Randomisation, before the waveform-specific chapters.
Options available from this form:
Return to the main menu
Save the current settings as a profile
View the application help document
Use the tab-bar to bring up other forms
Load settings from a profile
Choose which cycles to play
Run, pause and stop a waveform
Monitor progress while running a waveform
Control logging
Monitor the values of parameters as they are calculated
Monitor a selected HIL analogue input

User manual LVTest VISUALCONNX Application Version 6.5.0 - bernard
Copyright add2 bernard Page 22 of 157 J001518 V6.5.0 LVTest VISUALCONNX Application.doc
6.1 [Main]: Returning to the main menu
Clicking on the [Home] hot-spot at the top left of the form returns to the Main Menu.
6.2 [Main]: Save the current settings
Modified settings can be saved to the currently selected profile by clicking on the [Save] hot-
spot near the top left of the form. If saving fails (perhaps because the profile is read-only),
use the following control instead.
Clicking on the [Save As...] hot-spot just to the right of the [Save] hot-spot allows you to save
the current profile to a different file. If the profile is saved successfully, it will become the
currently-selected profile.
If the profile already exists, you will be asked whether you wish to over-write its contents,
choose another file, or cancel the operation. If writing to the file fails (perhaps because it is
read-only) you will be given the chance to choose another file, or cancel the operation.
6.3 [Main]: Viewing the application help document
Clicking on the [Help] hot-spot at the top right of the form brings up a WindowsTM
Help
document for the application.

User manual LVTest VISUALCONNX Application Version 6.5.0 - bernard
Copyright add2 bernard Page 23 of 157 J001518 V6.5.0 LVTest VISUALCONNX Application.doc
6.4 [Main]: The tab-bar
Below the title and the row of hot-spots is a tab-bar. The tabs in it can be clicked to bring up
other forms. The tab-bar for this form exists in three versions, depending on the currently-
selected waveform type.
Most waveform types use the tab-bar above.
Captured waveforms use this tab-bar. There are no settable parameters of the kind used for
other waveforms, and the Timing and Frequency Configurations form has very limited use
(only the Output Filter control). The [T Settings] and the [Param. Graphing] tabs are
replaced with more relevant forms (which are only used for Captured waveforms). The
Voltage Configurations form is still available because it gives access to some additional
voltage settings. See Additional Voltage Parameters on the Voltage Configurations form. If
you need the Output Filter control, it can still be reached by clicking on the [U Settings] tab
to bring up the Voltage Configurations form, then on the [T Settings] tab on that form.
Clicking on the [U Settings] tab in the tab-bar brings up the Voltage Configurations form.
Clicking on the [T Settings] tab in the tab-bar brings up the Timing and Frequency
Configurations form.
If the currently-selected waveform type is Captured Waveform, the Captured Import tab
following is shown instead.
Clicking on the [Captured Import] tab in the tab-bar brings up the Captured Import form.
This tab is shown only if the currently-selected waveform type is Captured Waveform:
otherwise the [T Settings] tab is shown instead.
Clicking on the [Param. Graphing] tab in the tab-bar brings up the Parameter Monitoring
form.
This tab is not shown if the currently-selected waveform type is Captured Waveform. The
Captured Transfer tab ifollowing s shown instead.
Clicking on the [Captured Transfer] tab in the tab-bar brings up the Captured Transfer form.
This tab is only shown if the currently-selected waveform type is Captured Waveform;
otherwise the [Param. Graphing] tab preceding is shown instead.

User manual LVTest VISUALCONNX Application Version 6.5.0 - bernard
Copyright add2 bernard Page 24 of 157 J001518 V6.5.0 LVTest VISUALCONNX Application.doc
Clicking on the [Misc. Settings] tab in the tab-bar brings up the Miscellaneous Settings form.
This form gives access to some other special forms: Error Status and Special Values, Trip
Status, and HIL Inputs.
Clicking on the [Triggering] tab in the tab-bar brings up the Input Trigger Configuration
form. From there a tab can be used to go to the Output Trigger Configuration form.
6.5 [Main]: Loading waveform settings from profiles
The settings that define a specific waveform are collectively called “profiles” Profiles are
saved as files with the suffix .prw . The long Waveform Profile control shows the currently
used profile. Each waveform type has an associated (most recently used) profile. Initially
this is a default profile, called Default.prw. If the most recently-used profile cannot be
loaded, a warning is issued and the user is prompted to choose a different profile.
To load a different pre-defined waveform, you can edit the path in the [Waveform Profile]
property control
or browse for it by clicking on the
open-dialogue button at the right-hand end of the editable area
It is possible to edit the path directly in the control, but this is not recommended as a way to
create a new profile. If a profile with this name exists already it will be loaded, and the
current settings will be lost. In any case, the new profile must be saved after the name has
been specified. If you wish to create a new profile it is better to use the Save As... hot-spot.
When a profile has actually been loaded, its path
and file-name appear in grey below the editable text of the control.
If the profile appears to have been saved for a different waveform type, you will be warned
before opening it. If you open it anyway and then save it later, it will be saved with the
currently-selected waveform type. Clicking on the Open button or pressing Enter will import
the settings from the file and re-configure the waveform settings on the LVTGO-VBS unit.

User manual LVTest VISUALCONNX Application Version 6.5.0 - bernard
Copyright add2 bernard Page 25 of 157 J001518 V6.5.0 LVTest VISUALCONNX Application.doc
6.6 [Main]: Modifying the parameters that define the waveform
These settings may then updated by editing them (if modified, they show up with a coloured
background) and then committing to the modified value by pressing the Enter key, at which
point the background becomes white again. Moving the focus to a different control without
pressing Enter abandons any changes and the field reverts to the previous value. Clicking on
the [Save] hot-spot or the [Save As…] hot-spot saves ALL settings (Time, Voltage, Cycles
etc.) associated with the currently loaded waveform.
For details of the randomisation options, see the Settings and Randomisation chapter.
6.7 [Main]: Running waveforms
6.7.1 [Main]: Playing from and to a specified cycle
You can choose to run the test waveform for a given number of “cycles” or seconds.
Each waveform is defined as a succession of defined steps. A “cycle” is a complete run
through all the steps of the current waveform in turn. The first step T0 is only included as part
of the first cycle (numbered 1). Subsequent cycles start with step T1. The number of cycles
can be up to (224
- 1) . As a special case, if the number of cycles is given as 0 then there is
no upper limit and the waveform will be repeated until externally stopped.
Alternatively, the length of time playing can be specified in seconds, up to (224
– 1) (that is,
16,777,215 seconds, or a little over six months). Time spent in the very first cycle in time-
step T0 is not counted, nor is time spent calculating cycles which are not played, nor time
spent checking voltages for random cranking waveforms before the cycle begins. However,
time spent in a cycle which is cut short with [Stop] and then resumed with [Play] is counted
towards the total. The main use of this option is to control high-speed EFTBN waveforms
where the cycle lengths are characteristically very short but also very irregular. These are
normally run for a specified length of time after an initial sustained voltage, without being
interrupted in the course of the configured interval.
If any of the waveform parameters are randomised, it can be useful to re-start a sequence
from a specified cycle iteration, rather than from the first cycle. The waveform will then be
calculated from the first cycle, but without being “played” - that is, it does not drive the
outputs and it does not wait for any time-periods to complete - until the specified cycle is
reached.
The tick-box in the Start Cycle control toggles it between the two states shown above.

User manual LVTest VISUALCONNX Application Version 6.5.0 - bernard
Copyright add2 bernard Page 26 of 157 J001518 V6.5.0 LVTest VISUALCONNX Application.doc
When the box is not ticked, the Start Cycle is 0, and playing begins with time step T0 of the
first cycle. If the box is ticked, a Start Cycle number can be entered into the box, and the
previous cycles will only be calculated, without driving the LVT outputs. If the number is 1,
then playing begins with the first cycle, but with time-step T0 omitted.
If the Time Option is specified as a (non-zero) count of cycles, then it includes any cycles
calculated but not played. If the Start Cycle is greater than the number of cycles, then the
LVTGO-VBS unit will stop without driving any cycle to the output.
6.7.2 [Main]: Starting, Pausing, Resuming and Stopping
You can select the waveform play mode from these buttons:
Play Button
Initially, and after a Reset, the [Play] button plays from the specified Start Cycle until the
specified Time Option has elapsed. If an input trigger is configured, they will be required to
start the first cycle. This was not reliably true in versions of the firmware previous to V3.0.0.
More precisely, the waveform is calculated from the beginning of Cycle 1 until the beginning
of the specified Start Cycle. When the Start Cycle is reached, a clock is started and the
waveform is used to drive the outputs. When the waveform has played for the specified
number of seconds on the clock, or the specified number of cycles has been finished, the
clock is stopped and the output load voltage is driven to the “Voltage after Test” value.
Attempting to play for a number of cycles less than the Start Cycle will go immediately from
calculating the initial cycles to the “Voltage after Test” without playing any waveform.
An unspecified Start Cycle is equivalent to a Start Cycle set to 0, which inserts at the
beginning of Cycle 1 (only) an initial step in which it drives voltage U0 for time T0.
A zero Time Option (play for 0 seconds or for 0 cycles) is used to specify playing
indefinitely. Changes to the Start Cycle have no effect while a waveform is playing.
If a waveform is already being Played, the [Play] button has no effect.
If the waveform is currently Paused, the [Play] button resumes playing the waveform from
the point where it was interrupted, with the clock running. If the waveform is Stopped, the
waveform is played from tbe beginning of the cycle being played when it was interrupted.
This also sets the clock running. However, the time is not set back to the time at the
beginning of the current cycle. Starting with Version 3.0.0 of the firmware, if an input trigger
is configured, it will be required to re-start a cycle after Stop. This does not apply to resuming
a Paused waveform.
Current play mode LED
This LED is positioned between the [Pause] and [Play] buttons, to the left of the Trip LED,
and will only light when the waveform is playing. It does not distinguish, however, between
calculating waveforms before the Start Cycle, actually playing waveforms to the output, and
waiting after the specified Time Option has run out.
User manual LVTest VISUALCONNX Application Version 6.5.0 - bernard
Copyright add2 bernard Page 27 of 157 J001518 V6.5.0 LVTest VISUALCONNX Application.doc
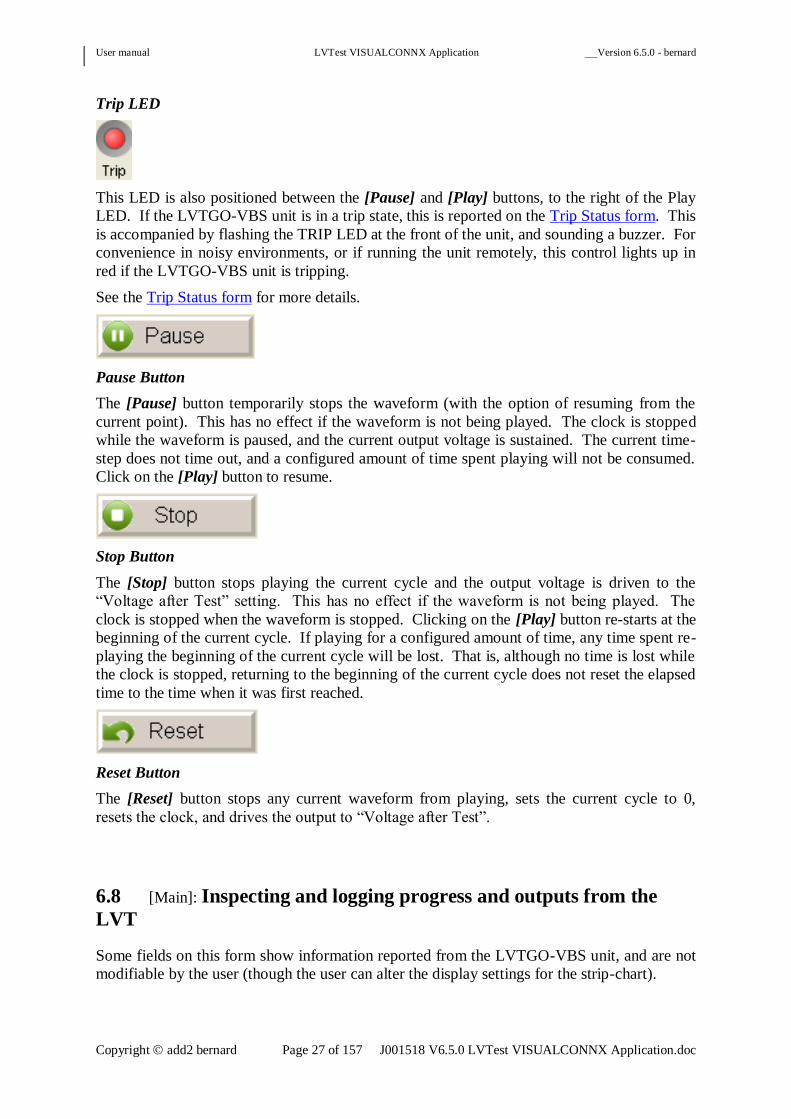
Trip LED
This LED is also positioned between the [Pause] and [Play] buttons, to the right of the Play
LED. If the LVTGO-VBS unit is in a trip state, this is reported on the Trip Status form. This
is accompanied by flashing the TRIP LED at the front of the unit, and sounding a buzzer. For
convenience in noisy environments, or if running the unit remotely, this control lights up in
red if the LVTGO-VBS unit is tripping.
See the Trip Status form for more details.
Pause Button
The [Pause] button temporarily stops the waveform (with the option of resuming from the
current point). This has no effect if the waveform is not being played. The clock is stopped
while the waveform is paused, and the current output voltage is sustained. The current time-
step does not time out, and a configured amount of time spent playing will not be consumed.
Click on the [Play] button to resume.
Stop Button
The [Stop] button stops playing the current cycle and the output voltage is driven to the
“Voltage after Test” setting. This has no effect if the waveform is not being played. The
clock is stopped when the waveform is stopped. Clicking on the [Play] button re-starts at the
beginning of the current cycle. If playing for a configured amount of time, any time spent re-
playing the beginning of the current cycle will be lost. That is, although no time is lost while
the clock is stopped, returning to the beginning of the current cycle does not reset the elapsed
time to the time when it was first reached.
Reset Button
The [Reset] button stops any current waveform from playing, sets the current cycle to 0,
resets the clock, and drives the output to “Voltage after Test”.
6.8 [Main]: Inspecting and logging progress and outputs from the
LVT
Some fields on this form show information reported from the LVTGO-VBS unit, and are not
modifiable by the user (though the user can alter the display settings for the strip-chart).
User manual LVTest VISUALCONNX Application Version 6.5.0 - bernard
Copyright add2 bernard Page 28 of 157 J001518 V6.5.0 LVTest VISUALCONNX Application.doc
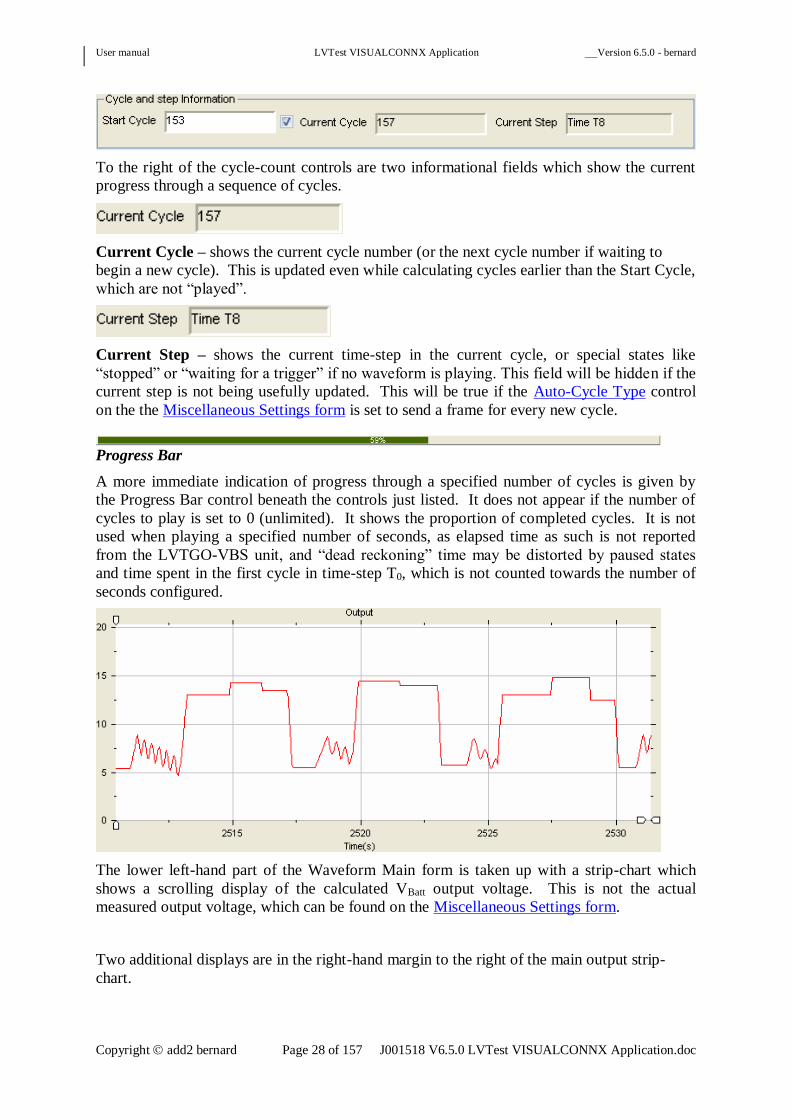
To the right of the cycle-count controls are two informational fields which show the current
progress through a sequence of cycles.
Current Cycle – shows the current cycle number (or the next cycle number if waiting to
begin a new cycle). This is updated even while calculating cycles earlier than the Start Cycle,
which are not “played”.
Current Step – shows the current time-step in the current cycle, or special states like
“stopped” or “waiting for a trigger” if no waveform is playing. This field will be hidden if the
current step is not being usefully updated. This will be true if the Auto-Cycle Type control
on the the Miscellaneous Settings form is set to send a frame for every new cycle.
Progress Bar
A more immediate indication of progress through a specified number of cycles is given by
the Progress Bar control beneath the controls just listed. It does not appear if the number of
cycles to play is set to 0 (unlimited). It shows the proportion of completed cycles. It is not
used when playing a specified number of seconds, as elapsed time as such is not reported
from the LVTGO-VBS unit, and “dead reckoning” time may be distorted by paused states
and time spent in the first cycle in time-step T0, which is not counted towards the number of
seconds configured.
The lower left-hand part of the Waveform Main form is taken up with a strip-chart which
shows a scrolling display of the calculated VBatt output voltage. This is not the actual
measured output voltage, which can be found on the Miscellaneous Settings form.
Two additional displays are in the right-hand margin to the right of the main output strip-
chart.

User manual LVTest VISUALCONNX Application Version 6.5.0 - bernard
Copyright add2 bernard Page 29 of 157 J001518 V6.5.0 LVTest VISUALCONNX Application.doc
The Parameters display shows the current value of the T, U and F parameters used in the
most recently completed wave-form. Unknown or unused parameters (e.g., T3 in a Random
Cranking waveform, T0 if not playing the first cycle) are shown as blanks. This display will
not be updated usefully if the current waveform type is Constant Voltage or Captured
Waveform, or if parameter streaming is disabled.
The HIL Readings display shows the currently selected HIL input voltage, if any, and the
interpretation (high or low, after debouncing) made by the LVTGO-VBS. The signals are all
“asserted high”, so a high value is T for True and a low value is F for false. This is for
debugging analogue inputs which can optionally be used as switches. See Selecting the HIL
input to show on the Waveform Main form on the HIL Inputs form. The fields will show as
'-' if the associated information is not currently being updated.

User manual LVTest VISUALCONNX Application Version 6.5.0 - bernard
Copyright add2 bernard Page 30 of 157 J001518 V6.5.0 LVTest VISUALCONNX Application.doc
6.8.1 [Main]: Logging data from the LVT
To the right of the strip-chart are a set of radio buttons, a text-box and two tick-boxes which
control logging options. These are disabled when there is a current data log (the options used
cannot be changed in the middle of a log).
The Log Option control is used to select whether you wish to log no voltage data, just the
target voltage as shown on the strip-chart on this form, or the target voltage together with all
the other readbacks shown on the Miscellaneous Settings form.
The Compress tick-box can be ticked this box when logging voltage data (i.e., not Log
Option set to None), to save space on your hard disk. Wave data generally compresses well.
The additional readback data typically has enough noise not to compress well without loss.
Lossy compression is available, and controlled from the Logging compression controls on the
Miscellaneous Settings form.
The Log Params tick-box can be ticked if you wish to log all parameters. Parameter logs are
always compressed. Parameters can only be logged when they are streamed (see Controlling
Parameter Streaming on the Parameter Monitoring form). Parameters are not streamed for
Constant Voltage or Captured Waveform waveforms, and usually are not streamed for very
fast EFTBN waveforms.
If Captured Waveform has been selected as the waveform type, there are no parameters to
display, and this tick-box is not displayed. Instead, a Waveform Number selection control
and a button to show a preview of the waveform are shown. See Selecting and previewing
captured waveforms for more details.

User manual LVTest VISUALCONNX Application Version 6.5.0 - bernard
Copyright add2 bernard Page 31 of 157 J001518 V6.5.0 LVTest VISUALCONNX Application.doc
This control specifies a number of seconds during which a log will continue to be recorded
while waveform generation is stopped. The timer is started when the LVTGO-VBS unit
reports its state as Stopped (e.g., because the requested number of cycles has been played),
and when the user clicks on the [Stop] or [Reset] buttons. The timer is stopped (and, if
necessary, the log is re-started) if the unit reports a state other than Stopped, and the user
clicks on the [Play] button. The timer is also stopped, and the log stops, if the user clicks on
the following [Save/Clear Logged] Data button. Times shorter than 10 seconds are not
allowed. The actual additional time spent logging may be up to 5 seconds longer than the
time configured.
The [Save/Clear Logged Data] button is below the other logging controls, to the right of the
lower right-hand corner of the strip-chart.
It is enabled only when there is data in the current log. It clears the current log, but gives the
user a chance to save to a file first. The file is given a name which reflects the form being
saved and the current date and time. Once the data have been cleared, the other logging
controls are re-enabled.
6.9 [Main]: Selecting a specific Captured Waveform
An additional control is available when the currently-selected waveform type is Captured
Waveform. It appears above the Data Logging controls and to the right of the [Reset] button.
The Waveform Number selection control is used to select the index (from 1 to 64 inclusive)
of a captured waveform as stored on the LVTGO-VBS unit. If the application has been
synchronised with the unit, additional information will be available in the Captured Transfer
form. The Target list on this form shows the index numbers of stored waveforms alongside
their descriptive text.

User manual LVTest VISUALCONNX Application Version 6.5.0 - bernard
Copyright add2 bernard Page 32 of 157 J001518 V6.5.0 LVTest VISUALCONNX Application.doc
6.10 [Main]: Pre-viewing Captured and Micro-Cutouts Waveforms
These controls are only visible when Captured Waveforms or Micro-Cutouts waveforms are
selected.
If the Show Preview tick-box is ticked, the main strip-chart is made narrower, and the extra
space used to show a strip-chart preview of the waveform. For a Captured Waveform, if
there is no waveform of that index stored in the LVTGO-VBS unit, or the application has not
been synchronised with the unit, the preview will be blank.
With a selected Captured waveform, after
synchronisation
With no waveform selected
.

User manual LVTest VISUALCONNX Application Version 6.5.0 - bernard
Copyright add2 bernard Page 33 of 157 J001518 V6.5.0 LVTest VISUALCONNX Application.doc
7 The Voltage Configurations form
This form appears when one of the [U Settings] tabs is clicked. These exists in the tab-bars
of the Waveform Main form here, and the Timing and Frequency Configurations form here.
It allows the voltage parameters of the current waveform to be inspected and modified.
Constant Voltage waveforms and Captured Waveforms use (and display) only a very limited
set of the available controls.
The pink area marks a control set to 16V, which is greater than the limiting voltage 15V set
in the Max Output Voltage control.
7.1 [Voltage]: Return to the previous form
Clicking on the [Back] hot-spot at the top left of the form hides this form, and returns to the
previously visible form. Settings are not lost when the form is hidden.
7.2 [Voltage]: Save the current settings
If the currently-selected waveform type is Random Cranking, and current voltage settings
violate the Voltage constraints for Random Cranking, then a warning is issued if you try to
save them to a profile.

User manual LVTest VISUALCONNX Application Version 6.5.0 - bernard
Copyright add2 bernard Page 34 of 157 J001518 V6.5.0 LVTest VISUALCONNX Application.doc
Clicking on the [Save] hot-spot below the [Back] hot-spot saves the current settings (not just
the voltage settings) to the currently-selected profile.
To save to a different profile, use the [Save As…] hot-spot. If the profile is saved
successfully, it will become the currently-selected profile.
7.3 [Voltage]: Viewing the application help document
Clicking on the [Help] hot-spot at the top right of the form brings up a WindowsTM
Help
document for the application.
7.4 [Voltage]: The tab-bar
Below the title and the row of hot-spots is a tab-bar. The tabs in it can be clicked to bring up
other forms. The tab-bar for this form exists in two versions, depending on the currently-
selected waveform type.
Most waveform types use the tab-bar above.
Constant Voltage and Captured waveforms use the tab-bar above. There are no T Settings
parameters for these waveform types.
Clicking on the [Waveform Main] tab in the tab-bar brings up the Waveform Main form.
If the currently-selected waveform type is Random Cranking, and current voltage settings
violate the Voltage constraints for Random Cranking, then a warning is issued if you try to
navigate to the Waveform Main form.

User manual LVTest VISUALCONNX Application Version 6.5.0 - bernard
Copyright add2 bernard Page 35 of 157 J001518 V6.5.0 LVTest VISUALCONNX Application.doc
Clicking on the [T Settings] tab in the tab-bar brings up the Timing and Frequency
Configurations form.
If the currently-selected waveform type is Random Cranking, and current voltage settings
violate the Voltage constraints for Random Cranking, then a warning is issued if you try to
navigate to the Timing and Frequency Configurations form.
7.5 [Voltage]: Enabling A, B and C outputs in a Random Cranking
waveform
An additional control is available when the currently-selected waveform type is Random
Cranking and the currently-connected LVTGO-VBS unit reports itself as having an ABCD
daughter-board. It appears below the left-hand end of the tab-bar.
The ABC Enable tick-box, when visible, controls whether the A, B and C outputs required by
the Ford CI230 test waveform are generated or not. The state of this control (whether visible
or not) is loaded from the current profile.
7.6 [Voltage]: The number of EFTBN Steps
An additional control is available when the currently-selected waveform type is Extremely
Fast Transient Burst Noise. It appears below the left-hand end of the tab-bar.
The Number of EFTBN Steps control, when visible, controls the number of steps in an
EFTBN waveform. See Setting the number of steps for more details.
Only values from 2 to 8 are accepted.
Changing this value has the effect of a Reset.
7.7 [Voltage]: Voltages defining the waveform

User manual LVTest VISUALCONNX Application Version 6.5.0 - bernard
Copyright add2 bernard Page 36 of 157 J001518 V6.5.0 LVTest VISUALCONNX Application.doc
The U Parameter controls fill the upper part of the form below the tab-bar. There is a line of
controls for each voltage parameter Un used for the current waveform. See Settings and
Randomisation for details of the randomisation settings. The choices of random distribution
and seed value are discrete (from pull-down menus). The other values range from 0V to 30V
in steps of 1mV. The minimum, maximum and mean may not be given values greater than
the Max Output Voltage. If it is really intended to randomise over a larger range and clip the
output, set the Max Output Voltage to 30V at first (or to 20V if that is the maximum voltage
for the unit), and to the intended limiting value after the other settings are defined. Voltage
settings on the form above the current Max Output Voltage are shown in a distinctive colour.
The U0 value will only be calculated once (if at all), for the beginning of the first cycle. In
the case of a Constant Voltage waveform, that is literally all the parameter calculation that
happens. This means that U0 values are only randomised in a very weak sense.
For a Captured Waveform, there are no U parameters at all. The voltages are entirely defined
by the stored waveform data.
Changes to these settings made while a cycle is playing will not take effect until the next
following cycle. However, changes to seed values will not take effect until the next reset.
Further details specific to each type of wave-form can be found at
EFTBN waveform
Random Cranking waveform (see also here)
Ramp Up and Down waveform
Constant Voltage waveform
Alternative Ramp waveform
Captured waveforms
Micro-Cutouts (see also here)
7.8 [Voltage]: Voltage Instability while Loading Profiles
Whenever a profile is loaded, which happens whenever the currently-selected waveform type
is changed, there is no guarantee of the order in which the parameters defining the waveform
are updated. Normally loading a profile will force the waveform to stop, and the voltage-
after-test voltage will be driven (subject to the current maximum voltage). However, these
voltages may be updated in either order, and the interval between these two updates may be
considerable. In addition, the voltage-after-test value is derived from different parameters
when using Micro-Cutouts waveforms, which can produce updating in a different order, and
with significantly different effects. In particular, the voltage may briefly “spike” to a value
above both the old and the new maximum voltages, though efforts are made to minimise this..
If equipment is sensitive to spikes or dips in its input voltage, it is best to disconnect it while
loading a profile.
7.9 [Voltage]: Special constraints for random cranking waveforms
For a Random Cranking waveform only, special constraints are applied to the voltages.

User manual LVTest VISUALCONNX Application Version 6.5.0 - bernard
Copyright add2 bernard Page 37 of 157 J001518 V6.5.0 LVTest VISUALCONNX Application.doc
If the user attempts to navigate away from the form using a hot-spot or a tab in the tab-bar, or
attempts to save the current settings, a message-box appears warning the user about possible
violations of the constraints, and giving the opportunity to adjust the settings before
continuing.
For further details, see Voltage constraints for Random Cranking.
7.10 [Voltage]: Additional voltage parameters
Below the array of U Setting parameters (if any) is a row of controls which set voltages
applicable to the entire waveform. These are the only voltage controls which apply to
Captured Waveforms.
The Max Output Voltage control sets the maximum output voltage, up to 30V in steps of
1mV. If the attached LVTGO-VBS unit is a 20V unit, or its output range is undetermined,
then the voltage limit will be constrained to be no more than 20V. You will not be allowed to
set a voltage control so its value can be higher than this. However, it is possible to set the
maximum output voltage to its maximum (20V or 30V, depending on the LVTGO-VBS unit
attached), set the other voltage controls freely within that limit, and then vary the maximum
output voltage freely as the waveform is played. Any voltages displayed which are currently
greater than this limit are displayed with a distinctive background colour.
The maximum output voltage is loaded from the current profile. No profile currently
supplied by add2 has a maximum output voltage higher than 20V. However, you are free to
save profiles with a higher limit if the currently-attached LVTGO-VBS unit supports it.
Warning: if the currently-attached LVTGO-VBS unit supports only 20V output, then this
control will be limited to 20V. Saving a profile in this state may change the maximum output
voltage stored for it. Attaching a 30V unit and re-loading the profile will not restore the old
maximum voltage setting. However, it should be possible to re-set just this setting and save
the profile again.
Fast Output is normally selected. When selected, a falling output voltage will driven low by
controlled leakage to ground. When clear, the output voltages may fall more slowly,
depending on the load characteristics.
Voltage After Test is the output voltage (not including the ground offset) used when a
waveform is stopped (before running, after running a prescribed number of cycles, and after
[Stop] or [Reset]). This is not used when the waveform is paused, when the current output
voltage is sustained without change. This is one of the voltage controls which cannot be set
to a value higher than the current limit on the Max Output Voltage control.

User manual LVTest VISUALCONNX Application Version 6.5.0 - bernard
Copyright add2 bernard Page 38 of 157 J001518 V6.5.0 LVTest VISUALCONNX Application.doc
This control is disabled when Micro-Cutouts waveforms are selected. The voltage used
during the T1 and T3 steps, and the voltage used when not paused and not playing a cycle, is
the higher of the available voltages (Low U + Pulse), but limited by the maximum output
voltage.
There may be brief voltage spikes (less than 1 ms) when moving from a different waveform
type to Micro-Cutouts waveforms, because the previous voltage-after-test voltage will be
sustained even after the high voltage (Low U + Pulse) begins. If this is a problem, the device
under test should be disconnected while selecting Micro-Cutouts waveforms. Similarly, there
may be a short voltage dip when moving from Micro-Cutouts waveforms to a different
waveform type, as the Pulse will be switched off before the new waveform’s voltage-after-
test setting is applied.
Ground Offset sets a controllable ground offset. This can be changed freely while a
waveform is running. All output voltages (including the Max Output Voltage) are offset by
the Ground Offset value. However, 20V units will under no circumstances drive more than
20V. 30V units will operate up to an absolute maximum of 32.5, specifying an output
voltage of 30V and a ground offset of 2.5V. The ground offset can be set to any non-negative
voltage up to 2.5V, in steps of 1mV. This does not mean that the output is controlled with
that precision. On 20V units, the smallest controllable change in the Ground Offset voltage
output is about 3mV; on 30V units the smallest steps of control are approximately 0.7 mV.
BNC Enable (when visible) will enable a BNC filter output on the LVTGO-VBS unit. This
will be applied continuously until switched off. The control will not be visible in the absence
of a daughter-board which supports the BNC filter in the LVTGO-VBS itself.
7.11 [Voltage]: Voltage Parameters for Micro-Cutouts
The following additional controls appear for Voltage Parameters
For Micro-Cutouts waveforms only, the voltage parameters U1 and U2 are treated specially.
U1 is labelled as Low U, and U2 is labelled as Pulse The intended voltage at the beginning
and end of the tests (for time intervals T1 and T3 respectively) is the sum of these voltages. In
between, the voltage oscillates between Low U and Low U + Pulse. This voltage is, as
always, limited by the current maximum output voltage and the physical limits of the
LVTGO unit. These voltages cannot be randomised. Changes to these values will not affect
the voltages used during a cycle until the next time a new cycle is begun, but the derived
voltage (equal to Low U + Pulse.) used as the voltage after test will reflect changes to these
two voltage parameters as soon as possible.
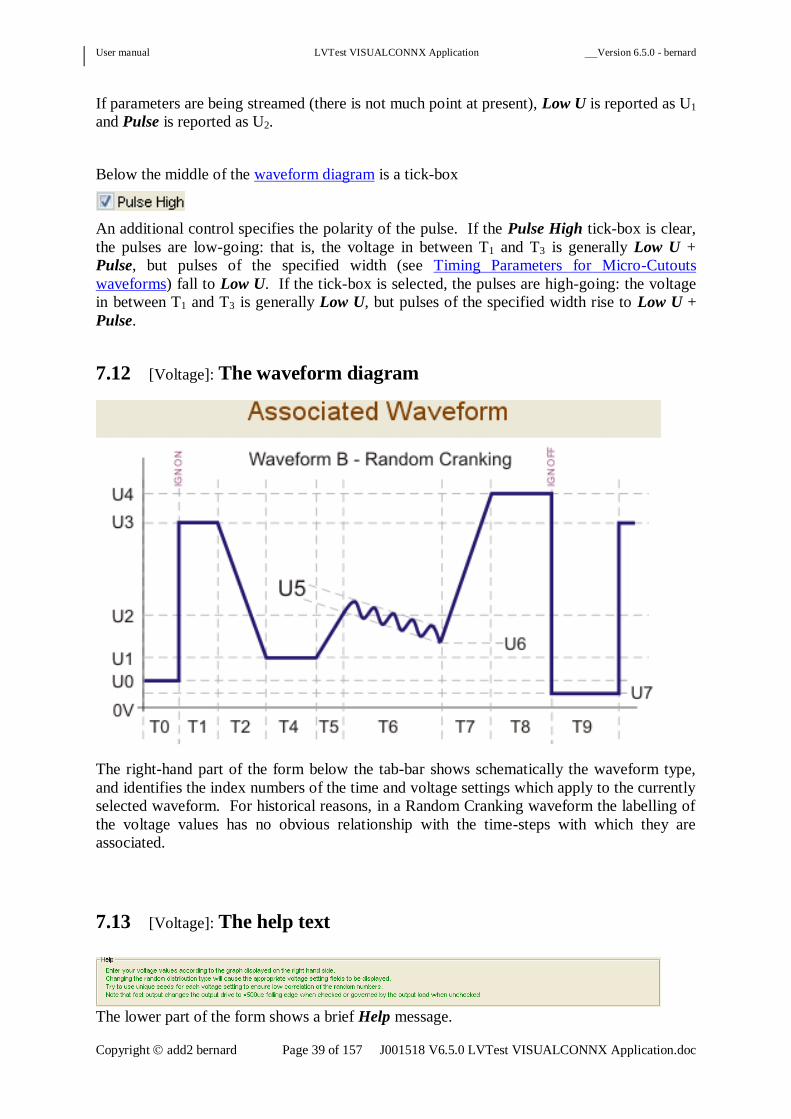
User manual LVTest VISUALCONNX Application Version 6.5.0 - bernard
Copyright add2 bernard Page 39 of 157 J001518 V6.5.0 LVTest VISUALCONNX Application.doc
If parameters are being streamed (there is not much point at present), Low U is reported as U1
and Pulse is reported as U2.
Below the middle of the waveform diagram is a tick-box
An additional control specifies the polarity of the pulse. If the Pulse High tick-box is clear,
the pulses are low-going: that is, the voltage in between T1 and T3 is generally Low U +
Pulse, but pulses of the specified width (see Timing Parameters for Micro-Cutouts
waveforms) fall to Low U. If the tick-box is selected, the pulses are high-going: the voltage
in between T1 and T3 is generally Low U, but pulses of the specified width rise to Low U +
Pulse.
7.12 [Voltage]: The waveform diagram
The right-hand part of the form below the tab-bar shows schematically the waveform type,
and identifies the index numbers of the time and voltage settings which apply to the currently
selected waveform. For historical reasons, in a Random Cranking waveform the labelling of
the voltage values has no obvious relationship with the time-steps with which they are
associated.
7.13 [Voltage]: The help text
The lower part of the form shows a brief Help message.
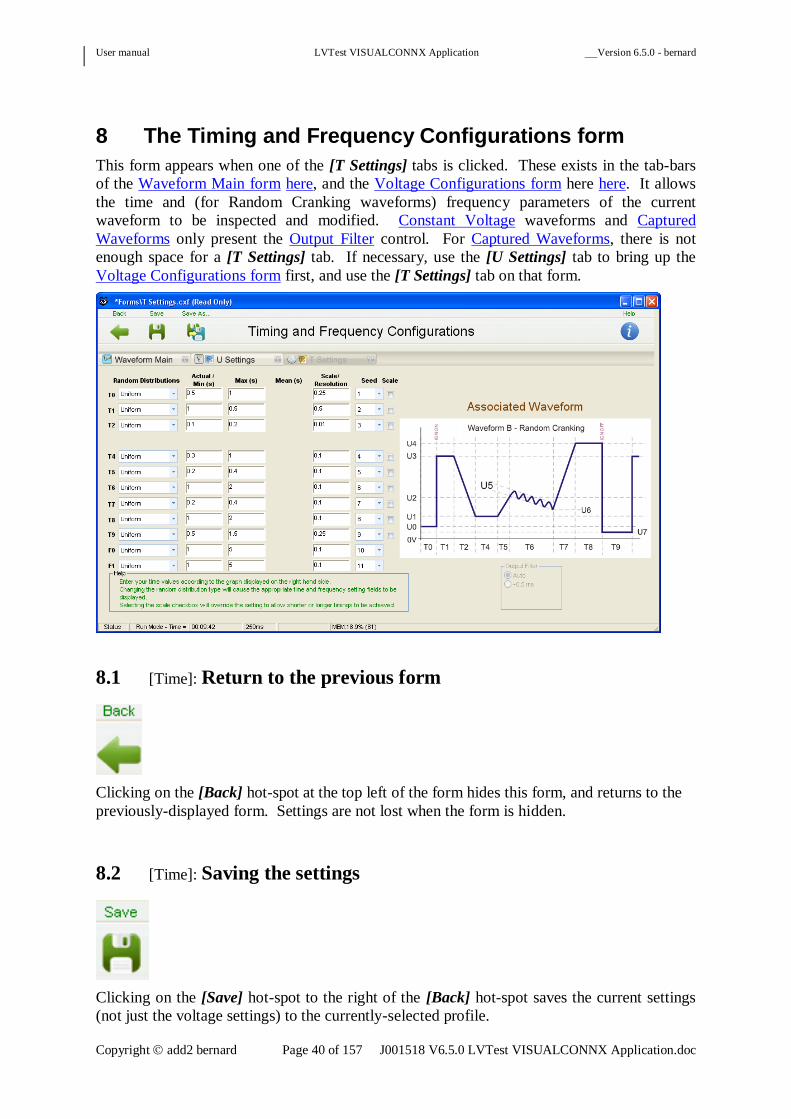
User manual LVTest VISUALCONNX Application Version 6.5.0 - bernard
Copyright add2 bernard Page 40 of 157 J001518 V6.5.0 LVTest VISUALCONNX Application.doc
8 The Timing and Frequency Configurations form
This form appears when one of the [T Settings] tabs is clicked. These exists in the tab-bars
of the Waveform Main form here, and the Voltage Configurations form here here. It allows
the time and (for Random Cranking waveforms) frequency parameters of the current
waveform to be inspected and modified. Constant Voltage waveforms and Captured
Waveforms only present the Output Filter control. For Captured Waveforms, there is not
enough space for a [T Settings] tab. If necessary, use the [U Settings] tab to bring up the
Voltage Configurations form first, and use the [T Settings] tab on that form.
8.1 [Time]: Return to the previous form
Clicking on the [Back] hot-spot at the top left of the form hides this form, and returns to the
previously-displayed form. Settings are not lost when the form is hidden.
8.2 [Time]: Saving the settings
Clicking on the [Save] hot-spot to the right of the [Back] hot-spot saves the current settings
(not just the voltage settings) to the currently-selected profile.

User manual LVTest VISUALCONNX Application Version 6.5.0 - bernard
Copyright add2 bernard Page 41 of 157 J001518 V6.5.0 LVTest VISUALCONNX Application.doc
To save to a different profile, use the [Save As…] hot-spot. If the profile is saved
successfully, it will become the currently-selected profile.
8.3 [Time]: Viewing the application help document
Clicking on the [Help] hot-spot at the top right of the form brings up a WindowsTM
Help
document for the application.
8.4 [Time]: The tab-bar
Below the title and the row of hot-spots is a tab-bar. The tabs in it can be clicked to bring up
other forms.
Clicking on the [Waveform Main] tab in the tab-bar brings up the Waveform Main form.
Clicking on the [U Settings] tab in the tab-bar brings up the Voltage Configurations form.
8.5 [Time]: Times and frequencies defining the waveform
The T Parameter controls fill the upper part of the form below the tab-bar. There is a line of
controls for each Time parameter Tn used for the current waveform. Additionally, for a
Random Cranking waveform there are also two lines of F Parameter controls F0 and F1 for
the frequency of the sinusoid.

User manual LVTest VISUALCONNX Application Version 6.5.0 - bernard
Copyright add2 bernard Page 42 of 157 J001518 V6.5.0 LVTest VISUALCONNX Application.doc
See Settings and Randomisation for details. The choices of random distribution and seed
value are discrete (from pull-down menus). The other settings range from 0s to 65.535s in
steps of 1ms, for the time values, and from 0 Hz to 250 Hz in units of 0.1Hz for the frequency
values.
Changes to these settings made while a cycle is playing will not take effect until the next
following cycle. However, changes to seed values will not take effect until the next reset.
8.5.1 [Main]: Timing Parameters for Micro-Cutouts waveforms
With Micro-Cutouts waveforms selected, some additional controls are available, and some
others have slightly modified behaviour.
There is no T0 step, and it cannot be configured. Only T1 and T3 are available in the usual
way. At present (V5.0.0 of the firmware) these cannot be randomised or scaled, though it is
intended to supply both features in later releases. T2 is used to specify the basic time interval
used for the pulse-train, in association with a scaling factor. This is the width of a pulse. The
usual scaling factors are not available. Instead, there is a choice as shown in the following
picture:
The range of multiples of this scaling factor available depends on the choice of unit. At
present (V5.0.0 of the firmware) the limits are
100ns: 10 - 16383
1us: 1 – 13107
1ms: 1 – 104
4ms: 1 – 104

User manual LVTest VISUALCONNX Application Version 6.5.0 - bernard
Copyright add2 bernard Page 43 of 157 J001518 V6.5.0 LVTest VISUALCONNX Application.doc
Near the middle of the form are the main pulse-train shape controls:
The Gap Counts controls are used to characterise the shape of the pulse-train, in association
with the Pulse High tick-box on the Voltage Settings form. If the pulses are high (voltage
Low U + Pulse) then the gaps are low (Low U), and vice-versa.
At the end of the T1 time-step (at the high voltage Low U + Pulse) the first pulse begins, and
lasts for one time-interval. All pulses except the last are followed by a gap. The first gap
lasts for First Gap Count time-intervals. After all gaps except the last there is another pulse,
which again lasts for one time-interval, and then another gap. The width of the gap changes
by one time-interval at a time, increasing or decreasing as necessary, until it reaches the Last
Gap Count after the last pulse. However, at the point where the last gap would be expected to
start, the pulse-train stops, and the high voltage Low U + Pulse is sustained for the T3 time-
step instead.
If the First and Last Gap Counts are equal, then there is only one pulse, and there is no real
“gap” at all. Otherwise, the total number of pulses generated will be one greater than the
absolute difference between the First Gap Count and the Last Gap Count. If the Last Gap
Count is greater than the First Gap Count, the gaps increase in size by one time-interval
(pulse-width) per pulse; if the First Gap Count is greater than the Last Gap Count, the gaps
increase in size by one time-interval per pulse.
If Pulse High is selected then the first pulse continues the high voltage of T1 and the last
voltage leads directly into the high voltage of T3, so the number of properly isolated pulses
with two distinct edges is reduced. As pathological cases, if just one pulse is generated then
the Low U voltage will not appear at all, and if two pulses are generated then the waveform is
effectively just a single low-going pulse whose width is First Gap Count time-intervals.
8.6 [Time]: Scaling the duration of time-steps
The column of tick-boxes headed “Scale” is used to support long time-steps. The effect of
placing a tick in the box is to bring up (in place of the Resolution text-box) a pull-down list of
multipliers. The selected multiplier is applied to all the time settings (minimum, maximum
and mean) for that row of controls. Un-ticking the box restores the Resolution settings. It is
not possible to set the Resolution to anything but the minimum value while using a multiplier.
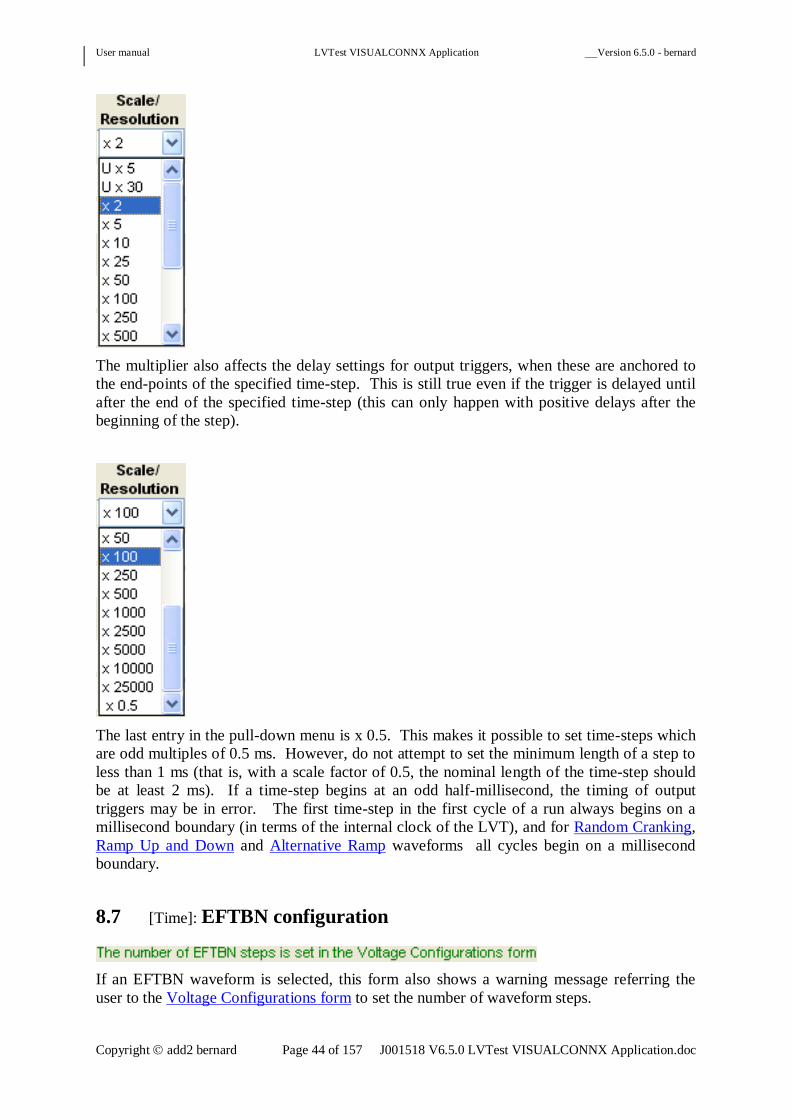
User manual LVTest VISUALCONNX Application Version 6.5.0 - bernard
Copyright add2 bernard Page 44 of 157 J001518 V6.5.0 LVTest VISUALCONNX Application.doc
The multiplier also affects the delay settings for output triggers, when these are anchored to
the end-points of the specified time-step. This is still true even if the trigger is delayed until
after the end of the specified time-step (this can only happen with positive delays after the
beginning of the step).
The last entry in the pull-down menu is x 0.5. This makes it possible to set time-steps which
are odd multiples of 0.5 ms. However, do not attempt to set the minimum length of a step to
less than 1 ms (that is, with a scale factor of 0.5, the nominal length of the time-step should
be at least 2 ms). If a time-step begins at an odd half-millisecond, the timing of output
triggers may be in error. The first time-step in the first cycle of a run always begins on a
millisecond boundary (in terms of the internal clock of the LVT), and for Random Cranking,
Ramp Up and Down and Alternative Ramp waveforms all cycles begin on a millisecond
boundary.
8.7 [Time]: EFTBN configuration
If an EFTBN waveform is selected, this form also shows a warning message referring the
user to the Voltage Configurations form to set the number of waveform steps.

User manual LVTest VISUALCONNX Application Version 6.5.0 - bernard
Copyright add2 bernard Page 45 of 157 J001518 V6.5.0 LVTest VISUALCONNX Application.doc
8.8 [Time]: The waveform diagram
The right-hand part of the form below the tab-bar shows a graph which shows schematically
the waveform type, and identifies the index numbers of the timing settings which apply to the
currently selected waveform. This is especially important for the Random Cranking
waveform. For historical reasons the labelling of the voltage values has no obvious
relationship with the time-steps with which they are associated.
A Captured Waveform has only a single time-step, T1.
T0 is only used at the beginning of Cycle 1, and even then only if the Start Cycle is set to 0.
T3 is not used for a Random Cranking waveform Apart from this, the time-steps occur
consecutively in order from T1 up to the maximum used for the current waveform.
8.9 [Time]: The Help-text
The lower left part of the form shows a brief Help message.

User manual LVTest VISUALCONNX Application Version 6.5.0 - bernard
Copyright add2 bernard Page 46 of 157 J001518 V6.5.0 LVTest VISUALCONNX Application.doc
8.10 [Time]: The Output Filter control
This control is often disabled, and will be shown like this.
If the LVTGO-VBS target has sufficiently recent firmware (at least 5.1.0) and has additional
output filtering options, it will be enabled like this:
In this case, the unit has a fast output stage, but this can be filtered down for smoother ramps,
or to meet specific requirements for slower edges. The filter times quoted are minimum
times between 10% and 90% of a requested voltage change. The ~0.5ms output filter is for
backward compatibility with older hardware. There may also be a lighter filter, with only
10 µs filter time. The ~0.5ms filter is not available for Micro-Cutouts and should not be
selected (the effect is actually to disable the 10 µs filter).
Auto is almost always a safe option. It uses the slowest available filter for waveforms
containing ramps, the fastest available filter for EFTBN waveforms and captured waveforms
with no interpolation, and the nearest filter available to 10 µs filter time for Micro-Cutouts.
[Misc]: The maximum-current controls
The Current(H) MAX display shows the maximum recorded load-circuit current, as taken
from the readings also sent to the strip-chart.
The [Clear] button to the right of this control is used to re-set the maximum to 0.
User manual LVTest VISUALCONNX Application Version 6.5.0 - bernard
Copyright add2 bernard Page 47 of 157 J001518 V6.5.0 LVTest VISUALCONNX Application.doc
8.11 [Time]: Waveform-specific details
Further details specific to each type of wave-form can be found at
EFTBN waveform
Random Cranking waveform
Ramp Up and Down waveform
Constant Voltage waveforms have no timing or frequency parameters
Alternative Ramp waveform
Captured Waveforms have only an unmodifiable time-step T1
Micro-Cutouts waveform.

User manual LVTest VISUALCONNX Application Version 6.5.0 - bernard
Copyright add2 bernard Page 48 of 157 J001518 V6.5.0 LVTest VISUALCONNX Application.doc
9 Settings and Randomisation
Where settings are selected from a menu, they take effect immediately. Settings which are
typed in by the user (e.g., voltages defining a waveform) usually follow a two-stage process.
When modified, they show up with a coloured background (the colour can be set as a
VISUALCONNX setting). The user can commit to the modified value by pressing the Enter
key, when the text background reverts to its normal colour (usually white). Moving the focus
to a different control without pressing Enter abandons any changes and the field reverts to the
previous value.
Timing, voltage and frequency settings may be randomised, where appropriate, to give a
repeatable but random based distribution of parameters. The controls which use
randomisation are on the Voltage Configurations and Timing and Frequency Configurations
forms (these also contain other controls). Frequency parameters are only used for a Random
Cranking waveform. These settings, exceptionally, will only take effect when the next cycle
begins (including the case where the LVTGO-VBS is stopped and is re-started from the
application). The seed settings are a further exception, as they only take effect when the
LVTGO-VBS is next started from a reset.
Captured waveforms have no numbered U or T settings. Each waveform has a single time-
step, T1, and its length is derived from the stored data. However, the global constraints
(maximum voltage, voltage after test, ground offset, and fast-output control) are still
available.
Micro-Cutouts waveforms have currently (Firmware V5.0.0) no support for randomisation,
and the only support for scaling is for the pulse-width, which is T2 scaled by the time-unit.
The present intention is to introduce scaling on the T1 and T3 time-steps, but not to allow the
“scale according to voltage difference” options or scaling by 0.5.
Each of the parameters is configured using a standard set of controls occupying one line of
the configuration form. The first control specifies the type of randomisation to be used (if
any). Controls with no effect on the current type of randomisation are hidden.
The following random distributions are available:

User manual LVTest VISUALCONNX Application Version 6.5.0 - bernard
Copyright add2 bernard Page 49 of 157 J001518 V6.5.0 LVTest VISUALCONNX Application.doc
9.1 [Settings]: Fixed (no randomisation)
This only allows the actual voltage or time to be entered
9.2 [Settings]: Uniformly distributed
This allows the actual voltage or time to be randomised with a uniform distribution.
9.3 [Settings]: Normal distributions
These allow the actual voltage or time to be randomised with a normal distribution. The
mean of the distribution must be entered. There is a range of variances available (relative to
the square of the mean value): low, medium and high. Extreme values are clipped to the
specified minimum and maximum. The mean must not lie outside these values.

User manual LVTest VISUALCONNX Application Version 6.5.0 - bernard
Copyright add2 bernard Page 50 of 157 J001518 V6.5.0 LVTest VISUALCONNX Application.doc
9.4 [Settings]: 1/x2 distribution
This allows the voltage or time parameter to be randomised with a 1/x2 distribution curve.
This is a uniform distribution in which the variates x are replaced with transformed variates
y = 1/x2: the distribution of x is restricted to values which keep y within range.
This distribution is designed to meet the requirements of the JaguarLandRover CI265 Test
Procedure for immunity to transients (Waveform A). A previous version of this distribution
which does not correspond exactly is still available, under the name Old 1/x^2. This is only
provided for backward compatibility with existing test specifications.
Do not set a minimum value of 0 for this distribution. Only zero values will be generated.
9.5 [Settings]: Random seeds
Each possible seed value starts the random-number generator used at a different point of its
cycle. For normal distributions the sequence has about 10^9 members; for the uniform and
exponential distributions there are 231
– 2 members. In practice the sequence is unlikely to
work through a complete cycle. Varying the seed is useful to cover a wider range of cases
over relatively short runs.
The seed values are not meant to be changed during a run. They will only be updated
internally in the LVTGO-VBS when they are initialised for Cycle 1 – that is, when starting to
play waveforms after a reset.

User manual LVTest VISUALCONNX Application Version 6.5.0 - bernard
Copyright add2 bernard Page 51 of 157 J001518 V6.5.0 LVTest VISUALCONNX Application.doc
9.6 [Settings]: Resolution
It is possible to set a “resolution” for each randomised value, except for Time settings which
are scaled. Values resulting from the random-number generator will be rounded to a value
equal to the minimum value plus some integral multiple of the resolution (except for the
1/x^2 distribution, mentioned later). The value chosen will not exceed the maximum value,
but otherwise will be the nearest possible value meeting the constraints. Zero is permitted,
and gives the finest available resolution (1 ms for Time settings, 1 mV for Voltage settings,
0.1 Hz for Frequency settings).
This can affect the voltage constraints on random cranking.
Exceptionally, all values generated from the 1/x^2 distribution are multiples of the
resolution. These will not lie outside the range [Min, Max], but if the minimum is not a
multiple of the resolution the behaviour is different.
9.7 [Settings]: Scaling Time Settings
Timing parameters also have an option for scaling. This affects the minimum, maximum and
mean settings for that parameter. Choosing the scaling option forces the resolution to be the
minimum available resolution (1ms x the scaling factor chosen). To use scaling, tick the tick-
box at the right-hand end of the row of controls for the specified Time parameter, under the
Scale heading. This brings up a pull-down menu of the available scale factors, in place of the
text-box for specifying the resolution.
The pull-down menu also contains two special items at the beginning: U x 5 and U x 30.
These are used to implement ramps with special slopes prescribed by the JLR Test Procedure.
U x 5 gives a ramp of slope 5 s / V, and U x 30 gives a ramp of slope 30 s / V. If the time-
step is NOT a ramp, then these are equivalent to x 5 and x 10 respectively. U x 30 is NOT
equivalent to T x 30 for non-ramps. If these values are selected, and the time-step really is a
ramp, then the other control settings for this time-step are ignored. It is recommended that
these special settings not be used at all except for ramps.
Two special considerations should be noted. To ensure that output triggers can be configured
for any point in a (possibly very long) time-step, when an output trigger is configured to fire
at a specified offset from the end of a step, forwards from the start or backwards from the
end, the nominal offset is multiplied by the applicable scale factor.

User manual LVTest VISUALCONNX Application Version 6.5.0 - bernard
Copyright add2 bernard Page 52 of 157 J001518 V6.5.0 LVTest VISUALCONNX Application.doc
Also, it is possible for one of the special U x 5 or U x 30 multipliers to be applied to a ramp
step where there is no voltage difference. This, uniquely, produces a zero-length time-step.
In fact, this is not achievable, and the nominal 0 ms time-step is actually 1ms long. This is
reflected in the values reported for the calculated parameter settings in the Waveform Main
form.

User manual LVTest VISUALCONNX Application Version 6.5.0 - bernard
Copyright add2 bernard Page 53 of 157 J001518 V6.5.0 LVTest VISUALCONNX Application.doc
10 The Parameter Monitoring form
This form appears when the [Param. Graphing] tab is clicked on the tab-bar of the Waveform
Main form. It supplies the data for the Parameters display on that form, and is of limited use
in itself. However, up to two parameters may be chosen to be monitored on the strip-chart.
These values are updated when they arrive, and not at the end of the cycle (as happens on the
Parameters display). If any parameter has been chosen to be displayed, the low 16 bits of the
cycle number (wrapping round from 65,535 to 0) are displayed also.
10.1 [Parameters]: Return to the previous form
Clicking on the [Back] hot-spot at the top left of the form hides this form, and returns to the
previously-displayed form.
10.2 [Parameters]: Viewing the application help document
Clicking on the [Help] hot-spot at the top left of the form brings up a WindowsTM
Help
document for the application.

User manual LVTest VISUALCONNX Application Version 6.5.0 - bernard
Copyright add2 bernard Page 54 of 157 J001518 V6.5.0 LVTest VISUALCONNX Application.doc
10.3 [Parameters]: The tab-bar
Below the title and the row of hot-spots is a tab-bar. The single active tab in it can be clicked
to bring up the Waveform Main form
Clicking on the [Waveform Main] tab in the tab-bar brings up the Waveform Main form.
10.4 [Parameters]: Selecting parameters to inspect
The first row controls the choice of the first parameter to inspect (shown on the strip-chart
with a red line). The second row controls the second parameter to inspect (shown on the
strip-chart with a blue line). The first control chooses the type of the parameter (None,
Voltage, Time or Frequency). If the type is not None then the second control is visible, and
is used to select the index number.

User manual LVTest VISUALCONNX Application Version 6.5.0 - bernard
Copyright add2 bernard Page 55 of 157 J001518 V6.5.0 LVTest VISUALCONNX Application.doc
10.5 [Parameters]: The main parameter values strip-chart
The main strip-chart shows the values of up to two selected parameters. These are the
calculated values after randomisation. This display shows the selected parameters in native
units (millivolts, milliseconds or decihertz), not scaled as in the Parameters display on the
Waveform Main form. It is updated more promptly than the Parameters display, which is
only updated at the end of a waveform cycle.
The legend at the left shows the pen-colours used for the data shown in the strip-chart.
10.6 [Parameters]: Controlling parameter streaming
This control can be used to control whether parameters are streamed. Normally they are
streamed. Suppressing streaming is only useful if cycles occur very rapidly (e.g., for a “rusty
file” test). If parameters are not streamed, the parameter display on the Waveform Main
form will be empty, and parameter logging will not be available. If parameters are already
being logged, this control is disabled.
Parameter streaming is not possible for Constant Voltage or Captured Waveform waveforms,
and the control is normally not available when playing these waveforms. As a special case,
the control is locked ”on” even for these waveforms if parameters are already being logged
for another waveform type and these waveforms are selected without stopping the log.
This control is available, and works, for Micro-Cutouts waveforms, but is not very useful. It
will be slightly more useful when the T1 and T3 time-steps can be scaled, and only important
if any of the voltage parameters come to be randomised. The present behaviour is to return
Low U as U1 and Pulse as U2. The time returned for T2 is the raw numerical U2 value, with
no adjustment for the selected time-unit.

User manual LVTest VISUALCONNX Application Version 6.5.0 - bernard
Copyright add2 bernard Page 56 of 157 J001518 V6.5.0 LVTest VISUALCONNX Application.doc
11 The Input Trigger Configuration form
This form appears when the [Trigger Configuration] tab is clicked in the tab-bar of the
Waveform Main form. Access to the Output Trigger Configuration form is from the [Output
Triggers] tab in the tab-bar on this form. Input and output triggers are independent.
Significant incompatible changes to CAN input triggering have been introduced since
previous versions of the firmware and this application. If you have used CAN input triggers
in the past, please read this chapter carefully. See the section on Changes to the COM Input
trigger interface in the chapter on the Scripting using the COM interface for further
information.
Incompatible change from previous versions (new in V4.0.0 of the GUI)
The waveform is now always left waiting for a trigger when stopped. In particular, stopping
a particular cycle and then resuming at its beginning requires the same trigger (if any) as if
the playing proceeded from a previous cycle.
Only those controls relevant to the currently-chosen trigger options are enabled. In a few
cases, where different controls are displayed according to the currently-chosen trigger
options, none will be displayed if it does not apply. This picture shows a fairly full set, with a
user-configured CAN messages used as an input trigger.
11.1 [Input Triggers]: Return to the previous form
Clicking on the [Back] hot-spot at the top left of the form hides this form, and returns to the
previously-displayed form.

User manual LVTest VISUALCONNX Application Version 6.5.0 - bernard
Copyright add2 bernard Page 57 of 157 J001518 V6.5.0 LVTest VISUALCONNX Application.doc
11.2 [Input Triggers]: Saving the settings
Clicking on the [Save] hot-spot to the right of the [Back] hot-spot saves the current settings
(not just the trigger settings) to the currently-selected profile.
To save to a different profile, use the [Save As…] hot-spot. If the profile is saved
successfully, it will become the currently-selected profile.
11.3 [Input Triggers]: Viewing the application help document
Clicking on the [Help] hot-spot at the top right of the form brings up a WindowsTM
Help
document for the application.
11.4 [Input Triggers]: The tab-bar
Below the title and the row of hot-spots is a tab-bar.
Clicking on the [Waveform Main] tab in the tab-bar brings up the Waveform Main form.
Clicking on the [Output Triggers] tab in the tab-bar brings up the Output Triggers form.
11.5 [Input Triggers]: Input triggers
At the beginning of each cycle actually played (not cycles merely calculated up to the
specified Start Cycle) the LVTGO-VBS unit will wait for an input trigger to be available.

User manual LVTest VISUALCONNX Application Version 6.5.0 - bernard
Copyright add2 bernard Page 58 of 157 J001518 V6.5.0 LVTest VISUALCONNX Application.doc
If a trigger of the currently-configured type arrives and is detected on the LVTGO-VBS unit,
it is queued until the next cycle is ready to start, when a queued trigger will be consumed and
the next cycle will start playing. During this interval (which may be less than 1ms if the unit
is already ready to start the next waveform cycle) the trigger can be revoked (removed from
the queue).
There are several supported input trigger sources, and several supported input trigger modes
for interpreting them as trigger or revocation signals.
The Input Trigger frame displays all the settings for the currently-selected input trigger.
The Input Type option-group specifies whether input triggers are required, and if so what
type of trigger must be supplied..
None (free-run) means that the unit plays cycles without waiting for an external trigger. To
be precise, the unit is still triggered, but with a special internal trigger source which generates
triggers on demand. This explains the occasional appearance of Waiting for Trigger in the
Current Step display on the Waveform Main form, even when the input type here is None.
Analogue HIL Input means that the trigger is expected on the input HIL3 line (Pin 5 on the
15-pin I/O Connection A). Voltages above 2.5V are treated as line high, and voltages below
2.5V are treated as line low. The voltage is sampled every millisecond. Moreover, the line is
debounced so after a transition (in either direction) between line high and line low the line is
not sampled further for 100 ms. It is therefore possible for fast spikes on the line to produce
spurious trigger states (or not). See the LVTGO-VBS Specification Sheet for details.

User manual LVTest VISUALCONNX Application Version 6.5.0 - bernard
Copyright add2 bernard Page 59 of 157 J001518 V6.5.0 LVTest VISUALCONNX Application.doc
The Input Analogue Mode option-group appears when Analogue HIL Input is selected.
The trigger mode can be level-sensitive or edge-sensitive. A level-sensitive trigger depends
only on the current line-high or line-low state (after debouncing). An edge-sensitive trigger
is set by transition between line-high and line-low going in the correct sense, and reset either
by an opposite-going edge or by actually being consumed to start a new waveform cycle,
whichever occurs earlier.
Target CAN message means that the message is received over the Target CAN bus.
Communication between the LVTest Application and the LVTGO-VBS unit normally uses
the Host CAN bus.
The Input CANID Type controls appear when Target CAN message is selected. They enable
the user to specify the CAN ID, whether it is a Standard or an Extended CAN ID, and the bit
number to inspect. If the CAN ID is small enough (less than 2048) to be either a Standard or
an Extended CAN ID, only the configured type will be recognised as a trigger message. If
the CAN ID is too large to be a Standard CAN ID, but a Standard CAN ID is configured,
the warning message ID too large is displayed in red, as shown.
All parts of the message except the specified bit are ignored. The specified bit index
increases from low bit to high bit in each byte of the message contents, and from early bytes
to late bytes.
The Input CAN Mode option-group appears when Target CAN message is selected. There
are two trigger modes available.
Bit High means that a “high” (1) bit in the specified bit of the message is an incoming
trigger. A “low” (0) bit in the same location revokes a previously-sent trigger, if it has not
already been consumed by starting a cycle.
Bit Low means that a “low” (0) bit in the specified bit of the message is an incoming trigger.
A “high” (1) bit in the same location revokes a previously-sent trigger, if it has not already
been consumed by starting a cycle.
11.6 [Input Triggers]: The Help-text
A short Help message is displayed at the lower left of the form, below the other controls.

User manual LVTest VISUALCONNX Application Version 6.5.0 - bernard
Copyright add2 bernard Page 60 of 157 J001518 V6.5.0 LVTest VISUALCONNX Application.doc
11.7 [Input Triggers]: The Obsolete Default CAN trigger
Previously, a Default CAN trigger existed, which could be used to control triggering from the
application. This could only be used from scripting. The Ramp Up and Down waveform
used it to re-configure the U2 voltage parameter from cycle to cycle. This trigger was only
available as an alternative to the other user triggers, and so the Ramp Up and Down
waveform could not be externally triggered. This trigger option is now intended for use as a
Configuration trigger, to ensure that a waveform being played will halt at the beginning of
each new cycle for new configuration options to be sent if desired. It has been made
independent of the other input triggers, and has been removed from this form entirely. This
means that Ramp Up and Down waveforms can now have external triggers.
The Configuration Trigger is an output trigger, and is documented here in the next chapter.

User manual LVTest VISUALCONNX Application Version 6.5.0 - bernard
Copyright add2 bernard Page 61 of 157 J001518 V6.5.0 LVTest VISUALCONNX Application.doc
12 The Output Trigger Configuration form
This form appears when the [Output Triggers] tab is clicked in the tab-bar of the Input
Triggers form. It allows output triggers to be configured. Output triggers are independent of
input triggers.
Only those controls relevant to the currently-chosen trigger options are enabled. In a few
cases, where different controls are displayed according to the currently-chosen trigger
options, none will be displayed if it does not apply. This picture shows a fairly full set, with a
user-configured CAN message used as an output trigger.
12.1 [Output Triggers]: Return to the previous form
Clicking on the [Back] hot-spot at the top left of the form hides this form, and returns to the
previously-displayed form.
12.2 [Output Triggers]: Saving the settings
Clicking on the [Save] hot-spot to the right of the [Back] hot-spot saves the current settings
(not just the trigger settings) to the currently-selected profile.

User manual LVTest VISUALCONNX Application Version 6.5.0 - bernard
Copyright add2 bernard Page 62 of 157 J001518 V6.5.0 LVTest VISUALCONNX Application.doc
To save to a different profile, use the [Save As…] hot-spot. If the profile is saved
successfully, it will become the currently-selected profile.
12.3 [Output Triggers]: Viewing the application help document
Clicking on the [Help] hot-spot at the top right of the form brings up a WindowsTM
Help
document for the application.
12.4 [Output Triggers]: The tab-bar
Below the title and the row of hot-spots is a tab-bar.
Clicking on the [Waveform Main] tab in the tab-bar brings up the Waveform Main form.
Clicking on the [Input Triggers] tab in the tab-bar brings up the Input Triggers form.

User manual LVTest VISUALCONNX Application Version 6.5.0 - bernard
Copyright add2 bernard Page 63 of 157 J001518 V6.5.0 LVTest VISUALCONNX Application.doc
12.5 [Output Triggers]: Using the Additional Configuration Trigger for
scripted configuration changes
The underlying mechanisms for supporting the Configuration Trigger for Ramp Up and
Down waveforms have been made more robust. It is now much easier for users to use the
COM interface to re-configure (other) waveforms while they are being played. See Changes
to the COM input trigger interface since earlier releases for further details. When the
LVTGO-VBS is waiting for a configuration trigger, it shows Waiting for Config. Trigger in
the Current Step display on the Waveform Main form. On receiving a configuration trigger,
it will proceed to trigger as configured; a combination of a Configuration Trigger and Free
Running will only wait for the configuration trigger at the start of a new cycle. Otherwise it
will wait until a trigger has been sent. It may have already been sent before waiting for the
Configuration Trigger.
Users who wish to use a Configuration Trigger in combination with an Extremely Fast
Transient Burst Noise waveform must note that U1 settings are only updated when a cycle is
(re-)started, but U1 is set at the end of a cycle to be correct at the beginning of the next cycle.
For this reason, the U1 setting current when a cycle is (re-)started from the application (rather
than from a trigger) will be used for the next following U1 and also for the U1 voltage which
begins the next following cycle. It may be necessary to configure a dummy cycle initially
which is used to set the U1 value for the beginning of the first real test cycle following. This
problem is re-created whenever a cycle is stopped from the application and re-started; that is,
the current U1 settings when re-starting are used both for that cycle and for the beginning of
the next following cycle. This does not prevent randomisation from changing the U1 voltage.
It is unusual, but possible, to use randomised settings while explicitly changing the
configurations using the Configuration Trigger. On the other hand, it is unusual to stop and
re-start in the course of an Extremely Fast Transient Burst Noise waveform.
For an EFTBN waveform, there is a special consideration which applies to changing the U1
setting while the cycle is playing. Because each cycle ends by driving the voltage to the U1
value for the next following cycle, the U1 settings set when a cycle is (re-)started will still be
used for the next following cycle. This does not prevent the same settings producing different
U1 values because of randomisation, but it does affect the use of the Configuration Trigger.
12.6 [Output Triggers]: Triggering Ramp Up and Down waveforms
This uses the new Configuration Trigger, where previously it used the old Default CAN
trigger. This change is almost completely transparent to users. The main difference is that it
is now possible to use an additional user input trigger. Existing Ramp Up and Down profiles
included by add2 with the LVTest Application always specified the use of the “Default
CAN” trigger, but in fact forced the use of it whatever the profile specified. The current
version of the application will respect any other setting in the profile, but a “Default CAN”
setting will be replaced with “Free Run” (this may be written back to the profile to change it,
but this is backward-compatible).
The changes in the CAN triggering mechanisms mean that the firmware MUST be updated to
at least version 3.0.0 in order to play Ramp Up and Down waveforms correctly.

User manual LVTest VISUALCONNX Application Version 6.5.0 - bernard
Copyright add2 bernard Page 64 of 157 J001518 V6.5.0 LVTest VISUALCONNX Application.doc
12.7 [Output Triggers]: Output triggers
The Output Type option-group specifies whether output triggers are emitted, and if so the
output mechanism used for the trigger.
The point at which the trigger should be emitted is defined by the following set of controls:
Here the trigger occurs 0ms after the point at which the waveform starts time-step T0. This is
rather specialised, as T0 only occurs at the beginning of Cycle 0, and even then only if the
starting cycle is 0 rather than 1: it does not occur at all for Captured or Micro-Cutouts
waveforms. To trigger at the beginning of each cycle, use T1.
Time spent waiting for a trigger is between cycles, not at the end of the previous cycle. The
“waiting for a trigger” state (like the “stopped”, “paused”, “calculating non-played cycles”
and “checking cranking voltages” states) cannot be selected for triggering. A trigger may
only be configured to be emitted at some time within one of the numbered Tn states which
can be configured on the Timing and Frequency Configurations form. Time spent paused is
not counted towards the delay. Remember that Stop followed by Play will re-start at the
beginning of the current cycle.
An offset of 0ms will actually send the trigger just before the output voltage is first driven to
reflect the new step, except for the first time-step of an EFTBN or ramp waveform (or, not
very usefully, a fixed battery voltage). If the defined step is short, the trigger may be deferred
into a later step, but not into the next cycle. However, if the defined step never occurs (e.g.,
T3 in a random cranking waveform) the trigger will not be emitted.
Micro-cutouts waveforms have accurately-timed pulse-streams, but the beginning and end of
the pulse-streams are not very tightly synchronised with the mechanism for generating output
triggers. At present (V5.0.0 of the firmware) there can be up to two milliseconds of “drift”
between the end of step T1 and the beginning of step T3. This affects triggers which are
anchored to step T2, to the end of step T1, or to the beginning of step T3.
Alternatively, the trigger can be timed backwards from the end of the specified time-step.
The controls then look like this:

User manual LVTest VISUALCONNX Application Version 6.5.0 - bernard
Copyright add2 bernard Page 65 of 157 J001518 V6.5.0 LVTest VISUALCONNX Application.doc
The length of a playing step is not calculated (even if it is a fixed value) until the beginning
of the step. This means that a trigger will never be emitted before the beginning of the step to
which it is anchored. If a configured offset before the end of a step turns out to be less than
the total length of the step, the trigger will be emitted as soon as this is known (typically
within 1ms of the voltage being driven).
Time spent paused is, again, not counted towards the delay – nor can it be, of course.
Positive and negative offsets cannot both be set at once. However, the application stores the
last-used offset value for each, so switching between “after start” offsets and “before end”
offsets will bring up the previously-used value.
The clock used for emitting output triggers ticks every complete millisecond. If the end of
the step to which it is anchored falls in the middle of these milliseconds, the trigger may be
output up to 0.5ms early or late. The beginning of every Random Cranking or Ramp cycle is
on a millisecond boundary: a run of EFTBN cycles always begins on a millisecond boundary.
A pause is always for a number of milliseconds, and will not make a difference to this.
12.8 [Output Triggers]: Triggering on a scaled time-step
If the time-step from which the offset is measured is scaled, then the delay time is also scaled
accordingly. This allows triggers to be emitted at any point during a long time-step, but it
also means that the delay shown or entered on the control is misleading. Unfortunately, the
scaling on the time-step and the setting of the delay are on separate forms and may happen in
either order, so any way of presenting the delay with scaling may be misleading.
12.9 [Output Triggers]: Output triggers - analogue
Output triggers take the form of an analogue pulse or a user-configured CAN message.
If an analogue trigger is chosen, the following controls are enabled:
The pulse width can range from 1ms to 65.535 s, in 1ms steps. The pulse is a square pulse of
5V amplitude on the selected output. The outputs are to Pin 1 or Pin 2 of the output D-Sub
15 connector of the LVT.

User manual LVTest VISUALCONNX Application Version 6.5.0 - bernard
Copyright add2 bernard Page 66 of 157 J001518 V6.5.0 LVTest VISUALCONNX Application.doc
Formerly, Pin 1, when not selected for triggering, was used to report the heat-sink
temperature. Pin 2, when not selected for triggering, was used to report the trip state. This is
no longer true; when not in use, the output voltage should be about 0V on these pins.
However, Pin 1 is used internally for Micro-Cutouts waveforms, and Pin 2 will be used
internally for Nano-Cutouts waveforms (not yet implemented). See the
Output_Triggers_Disconnect_Warning later.
12.10 [Output Triggers]: Output triggers – CAN
If the output trigger is selected to be a user-configured CAN trigger, the following controls
are enabled:
It is possible to send a CAN frame of any permitted length, with a “payload” of from 0 to 8
bytes. However, if the length is 0 bytes the editable Message Contents field will be disabled
(as it appears here). Warning messages are displayed if the CAN ID is too large or if the
message contents have the wrong length. The square brackets used for the Message
Contents may be omitted, but will be used when displaying the message in the control after
editing it.
There is an important difference between the input and output forms of user-configured CAN
triggers. An input trigger carries level information which is interpreted in terms of the trigger
type. An incoming CAN message, depending on its contents and on the trigger type, may
cause a trigger, or no trigger, or cancel a previously-issued trigger. The model for outgoing
triggers is much simpler. The appearance of the configured message is itself the trigger, and
the LVT itself has no way to reverse or revoke the trigger.
At the end of a cycle any current trigger is re-set. This only makes a difference if an
analogue trigger pulse begins very nearly at the end of the last stage of the waveform, and is
cut short at the end of it. This does not depend on whether the cycle ends waiting for a
trigger or not.
12.11 [Output Triggers]: Additional analogue triggers
There is an alternative way to configure analogue output triggers, though it is not supported
in versions of the firmware before 1.4.0. It is in many ways more flexible than the existing
simple pulse-generator, but is incompatible with it: the associated controls for Pin 1 and Pin 2
will not appear if the output trigger is already configured to use an analogue pulse on Pin 1 or
Pin 2. The Pin 3 and Pin 4 output triggers are independent of any other output triggers.

User manual LVTest VISUALCONNX Application Version 6.5.0 - bernard
Copyright add2 bernard Page 67 of 157 J001518 V6.5.0 LVTest VISUALCONNX Application.doc
A condensed set of controls is shown in the lower left-hand corner of the form. These
controls are divided into eight sets, configuring arising and a falling edge for each of the
output pins. Pins may not be available for three reasons:
(a) the target hardware configuration may not support them (Pins 3 and 4 are not supported
on most LVTGO-VBS units), or the hardware configuration may not have been read
successfully from the target.
(b) Pin 1 and Pin 2 will be disabled if either of these pins is used as a pulse output trigger.
(c) Warning: Pin 1 triggers (of either form) are disabled if Micro-Cutouts waveforms are
selected; Pin 1 must be disconnected from any trigger circuitry in use. Pin 2 triggers (of
either form) are disabled if Nano-Cutouts waveforms are selected; Pin 2 must be
disconnected from any trigger circuitry in use.
Any triggers that are currently not available for any of these reasons are represented as a row
of visibly disabled controls.
In addition, an available pin can be disabled (e.g., while it is being configured). This is
controlled by the Enable tick-box at the left-hand end of the associated row of controls.
The configurations for output pins 1 to 4 are similar but independent, each on its own labelled
line of controls. They are divided into Rising Edge and Falling Edge settings. The interface
is a condensed version of the analogue-trigger interface. The choice between timing after the
start of a step or before the end of a step is still present, but is represented by a tick-box under
the heading Offset Negative (ticked for “negative” delays, before the end of the step, and left
clear for “positive” delays, after the start of the step). Edges timed from the end of a step will
not actually be driven until the step begins and its length is known (typically within 1ms of
the voltage being driven).
Configuring these triggers causes an initial voltage to be driven to the associated output. To
prevent this from oscillating while the trigger is being configured, or because the associated
output is not to be used for triggering, the triggers for each pin can be disabled. Simply un-
tick the Enable tick-box at the beginning of the relevant line of controls. If the trigger is not
enabled, and the pin is not in use for Micro-Cutouts or Nano-Cutouts, the output on the pin
should be about 0V.

User manual LVTest VISUALCONNX Application Version 6.5.0 - bernard
Copyright add2 bernard Page 68 of 157 J001518 V6.5.0 LVTest VISUALCONNX Application.doc
The rising edge (High) and falling edge (Low) may occur in either order. If both edges occur
during the same millisecond time interval no pulse is emitted (the trigger output is not
updated in between the two edges), but the final voltage level will be low, so there may be a
falling edge. The initial trigger level after modifying the configuration, or after Enabling a
configuration already modified, is determined as follows. The trigger level attempts to reflect
the expected state at the end of a waveform cycle. If the waveform steps to which the edges
are anchored are not the same, the edge tied to the earlier step is assumed to occur earlier than
the edge tied to the later step. If the edges are anchored to opposite ends of the same step
(that is, one of them is triggered some time after the start of the step, and the other is
triggered some time before the end of the step) then the initial level is arbitrarily chosen to be
low. If the edges are anchored to the same end of the same step, they are treated as occurring
in the order implied by the specified delays.
This simple heuristic can yield the wrong initial voltage, especially if configuring a trigger
while the waveform is not stopped. However, once one of the configured edges has been
generated the subsequent behaviour should be correct.
If both edges are anchored to the same end of the same step, and with the same delay, then
they will always occur simultaneously (if ever). In this case the trigger level is held
permanently low and will not vary. This may be useful simply to suppress the usual analogue
output for the pin when no trigger is to be emitted.
The timer waiting for an edge to be emitted is reset at the beginning of the step to which the
edge is anchored. This means that if a positive delay has not timed out by the time the step is
re-entered on the next cycle the edge will not be emitted.

User manual LVTest VISUALCONNX Application Version 6.5.0 - bernard
Copyright add2 bernard Page 69 of 157 J001518 V6.5.0 LVTest VISUALCONNX Application.doc
12.12 [Output Triggers]: The Help-text
A fairly long Help message is displayed in the right-hand side of the form, below the tab-bar.
12.13 [Output Triggers]: Changes to Controls for Micro-Cutouts
If a Micro-Cutouts waveform is selected, then Pin 1 will be disabled irrespective of any other
settings: the following controls are updated to reflect this:

User manual LVTest VISUALCONNX Application Version 6.5.0 - bernard
Copyright add2 bernard Page 70 of 157 J001518 V6.5.0 LVTest VISUALCONNX Application.doc

User manual LVTest VISUALCONNX Application Version 6.5.0 - bernard
Copyright add2 bernard Page 71 of 157 J001518 V6.5.0 LVTest VISUALCONNX Application.doc
13 The Miscellaneous Settings form
This form is reached by clicking on the [Misc. Settings] tab in the tab-bar of the Waveform
Main form.
This form provides diagnostic information such as the measured output currents and voltages,
the battery supply voltage, and the heat-sink temperature of the LVTGO-VBS. It also gives
access to the Errors and Special Values form, the Trip Status form, and the HIL Inputs form.
This group of forms is not necessary for routine playing of simulations.
13.1 [Misc]: Return to the previous form
Clicking on the [Back] hot-spot at the top left of the form hides this form, and returns to the
previously-displayed form.
13.2 [Misc]: Navigating to specific forms
Clicking on the [Special Values] hot-spot to the right of the [Back] hot-spot brings up the
Error Status and Special Values form.
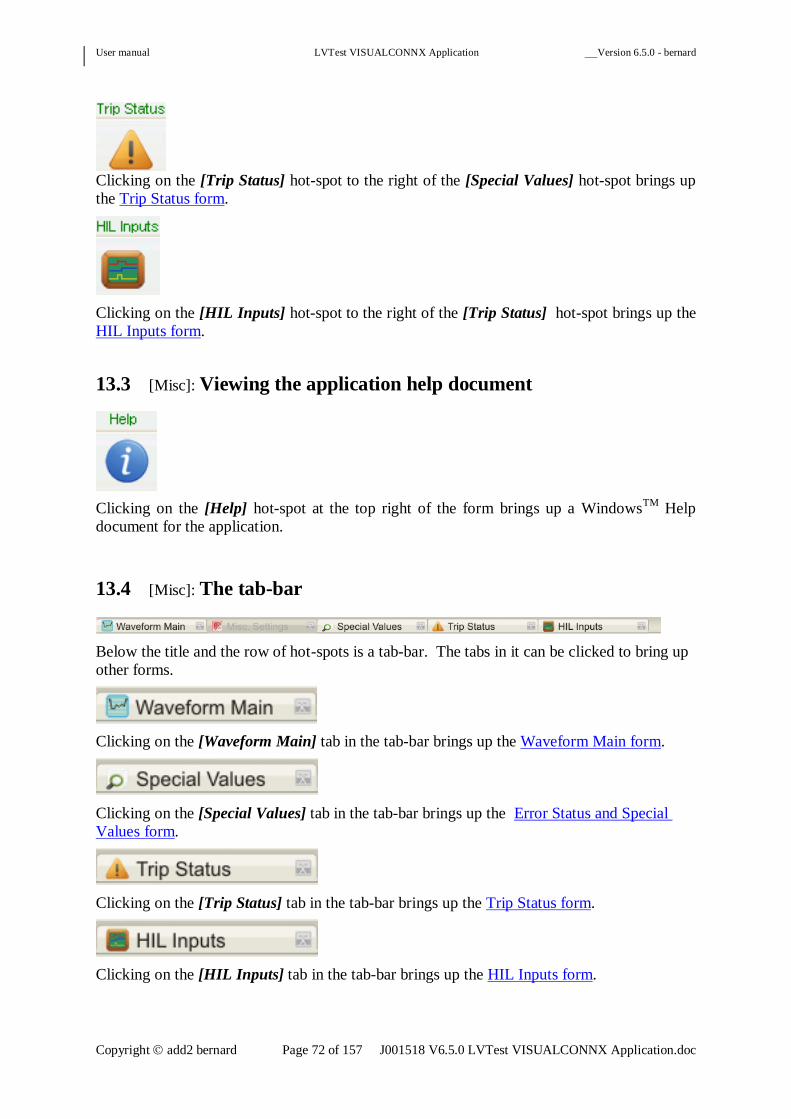
User manual LVTest VISUALCONNX Application Version 6.5.0 - bernard
Copyright add2 bernard Page 72 of 157 J001518 V6.5.0 LVTest VISUALCONNX Application.doc
Clicking on the [Trip Status] hot-spot to the right of the [Special Values] hot-spot brings up
the Trip Status form.
Clicking on the [HIL Inputs] hot-spot to the right of the [Trip Status] hot-spot brings up the
HIL Inputs form.
13.3 [Misc]: Viewing the application help document
Clicking on the [Help] hot-spot at the top right of the form brings up a WindowsTM
Help
document for the application.
13.4 [Misc]: The tab-bar
Below the title and the row of hot-spots is a tab-bar. The tabs in it can be clicked to bring up
other forms.
Clicking on the [Waveform Main] tab in the tab-bar brings up the Waveform Main form.
Clicking on the [Special Values] tab in the tab-bar brings up the Error Status and Special
Values form.
Clicking on the [Trip Status] tab in the tab-bar brings up the Trip Status form.
Clicking on the [HIL Inputs] tab in the tab-bar brings up the HIL Inputs form.

User manual LVTest VISUALCONNX Application Version 6.5.0 - bernard
Copyright add2 bernard Page 73 of 157 J001518 V6.5.0 LVTest VISUALCONNX Application.doc
13.5 [Misc]: The Cycle-number streaming control
The [Auto Cycle Type] radio-buttons at the left below the tab-bar control the return of
progress information from the LVT. Information not configured to be returned is not shown
on the Waveform Main form.
If the LVT is stopped (not necessarily if it is paused), this information is always sent
promptly from the LVTGO-VBS unit.
The As Polled setting causes the current cycle number and step to be polled at the frequency
set by the Read Graph Interval control on the Main Menu. This is normally only used for
very fast EFTBN waveforms“rattle tests” where steps, and indeed entire cycles, are so
frequent that the data-stream becomes too fast to handle.
The Every New Cycle setting causes the current cycle number (and step) to be sent from the
LVTGO-VBS unit each time a new cycle begins, or the unit enters a Stopped state (trip states
and pauses are not, in themselves, Stopped states). If the Configuration Trigger is enabled,
this option causes the cycle number and step to be sent at additional times, indicating not
only a change in cycle number but also when the unit is and is not ready to be configured for
the next cycle.
The Every New Step setting sends the current cycle-number and step to be sent each time the
LVTGO-VBS unit enters a new step (or enters or leaves the Paused state). This is normal
and recommended for all waveforms other than very fast EFTBN waveforms, or
(conceivably) captured waveforms only a few milliseconds long.
Settings re-named since earlier versions
The settings on this control have not changed, although their descriptions have. As polled was
previously Never. This was correct (because the data is being polled instead of being
streamed automatically) but misleading (because it suggests that the information was not
being sent). Every New Cycle was previously Every New Frame, which was simply a slip.
Every New Step was previously Every New Phase, reflecting an older term which has been
abandoned elsewhere in the interface.

User manual LVTest VISUALCONNX Application Version 6.5.0 - bernard
Copyright add2 bernard Page 74 of 157 J001518 V6.5.0 LVTest VISUALCONNX Application.doc
13.6 [Time]: The GO Feedback control
This control allows the user to choose the way in which the LVTGO-VBS unit responds to
irregular ground-offset voltages detected at the unit.
If you are not using a ground offset, then you should always pick None here. You should
also use the supply ground for the device under test: that is, the VGND (0V) terminal at the front
on a rack-mounted LVTGO-VBS unit, and the GND IN terminal at the back on a free-
standing unit.
If you are controlling the ground offset away from zero, you should use the GND OUT
terminal for the device under test.
The ground-offset output GND OUT is always driven directly from the intended voltage.
Raw adjusts the VB OUT voltage to compensate for the difference between the target ground-
offset and the ground-offset voltage actually read. None ignores the ground-offset voltage
read-back entirely. It is intended for use when there is a great deal of noise in the ground-
offset line, or the target VBatt voltage is modifying the ground-offset, and itself changing too
fast for the feedback to work usefully. Smoothed is useful when the target VBatt voltage is
not changing very rapidly, and the ground-offset circuit is moderately noisy.
In general, Smoothed is the safest option if you are using a non-zero ground offset.
13.7 [Misc]: The logging-compression controls
These are a pair of controls which work together to control the lossiness of compressed
logging for the voltage output and readbacks (parameter values, when logged, are compressed
losslessly, and these controls do not affect this). For full details, please see
VisualConnx.chm.
When the Compress option controlled by the Compressed tick-box on the Waveform Main
form is selected (the tick-box is ticked), lossy compression is used on the data. The first
value encountered is logged. Subsequent values will be logged if they differ from the last
logged value by the specified fraction of the total range for the control, or failing that the
data-stream is down-sampled by the specified factor.
The rate at which these logged values are sent back from the LVTGO-VBS is set using the
Main Readback Interval (ms) control on the Main Menu. Downsampling by a factor n is
performed by selecting every nth value to save to the log.

User manual LVTest VISUALCONNX Application Version 6.5.0 - bernard
Copyright add2 bernard Page 75 of 157 J001518 V6.5.0 LVTest VISUALCONNX Application.doc
The left-hand control sets the smallest change in data being logged which guarantees that the
new value is retained in the log. It is expressed as a percentage of the total range of values
allowed for the control being logged, by which the value has to change since the last logged
value in order to be logged. Each the loggable values has 256 possible reported values.
For the main voltage values and the input voltage readback the range is 0V to 25.5V in 0.1V
steps.
For the Ground Offset values, the range is 0V to 2.55V in 0.01V steps.
For the Current readback, the range is 0A to 127.5A in 0.5A steps.
For the Temperature readback, it is -40 °C to 215 °C in 1 °C steps.
The right-hand control is used to modify the rate of data-logging when a logged value does
not change outside the window set by the threshold control. With the given setting of 1000,
only one sample point in every thousand is saved to the log.
13.8 [Misc]: The data-retention control
This control sets the maximum amount of data which is retained on the strip-charts which
display streaming data. These are the readbacks strip-chart on this form, and the main output
strip-chart on the Waveform Main form.

User manual LVTest VISUALCONNX Application Version 6.5.0 - bernard
Copyright add2 bernard Page 76 of 157 J001518 V6.5.0 LVTest VISUALCONNX Application.doc
13.9 [Misc]: The readbacks strip-chart
Below the tab-bar, this form is largely taken up with a strip-chart showing several values
streamed from the LVTGO-VBS unit. These include the measured temperature at the heat-
sink, the measured ground-offset and load voltages, and the currents measured in both the
ground-offset and load circuits (which should be equal). All these are scaled over the range 0
– 255.
Temperature – measured at the heat-sink / 1 ºC + 40
That is, 0 represents -40 ºC and 255 represents 215 ºC
Input Voltage – the measured input battery voltage / 0.1V.
GO Target – the intended ground-offset voltage / 0.01 V.
Current (H) – the measured current through the load / 0.5A
Current (L) – the measured current through the ground-offset circuit / 0.5A
Voltage (H) – the measured voltage across the load / 0.1V.
Voltage (L) – the measured ground-offset voltage / 0.01V.
Current (H) should be equal to Current (L).
The Strip-chart has a legend, as follows:
This shows the pen colours used to draw each of the readback values on the strip-chart, and
the latest readback value, scaled to appropriate units.

User manual LVTest VISUALCONNX Application Version 6.5.0 - bernard
Copyright add2 bernard Page 77 of 157 J001518 V6.5.0 LVTest VISUALCONNX Application.doc
14 The Error Status and Special Values form
This form is reached by clicking on the [Special Values] hot-spot, or on the [Special Values]
tab in the tab-bar, of the Miscellaneous Settings form.
It shows information returned by the LVTGO-VBS unit about its error status, some
identifying information about the unit's hardware and firmware, and gives limited access to
some special settings. In particular, it gives read-only access to a large number of settings.
This form also gives access to the Trip Status form, and the HIL Inputs form. This group of
forms is not necessary for routine playing of simulations.
14.1 [Special]: Return to the previous form
Clicking on the [Back] hot-spot at the top left of the form hides this form, and returns to the
previously-displayed form.
14.2 [Special]: Navigating to specific forms
Clicking on the [Trip Status] hot-spot to the right of the [Back] hot-spot brings up the Trip
Status form.

User manual LVTest VISUALCONNX Application Version 6.5.0 - bernard
Copyright add2 bernard Page 78 of 157 J001518 V6.5.0 LVTest VISUALCONNX Application.doc
Clicking on the [HIL Inputs] hot-spot to the right of the [Trip Status] hot-spot brings up the
HIL Inputs form.
14.3 [Special]: Viewing the application help document
Clicking on the [Help] hot-spot at the top right of the form brings up a WindowsTM
Help
document for the application.
14.4 [Special]: The tab-bar
Below the title and the row of hot-spots is a tab-bar. The tabs in it can be clicked to bring up
other forms.
Clicking on the [Waveform Main] tab in the tab-bar brings up the Waveform Main form.
Clicking on the [Misc. Settings] tab in the tab-bar brings up the Miscellaneous Settings form.
Clicking on the [Special Values] tab in the tab-bar brings up the Error Status and Special
Values form.
Clicking on the [Trip Status] tab in the tab-bar brings up the Trip Status form.
Clicking on the [HIL Inputs] tab in the tab-bar brings up the HIL Inputs form.

User manual LVTest VISUALCONNX Application Version 6.5.0 - bernard
Copyright add2 bernard Page 79 of 157 J001518 V6.5.0 LVTest VISUALCONNX Application.doc
14.5 [Special]: Error status
The main display on the left below the tab-bar shows Error Status Information. This shows
errors other than hardware errors such as trips. These are either errors in the CAN
communication channel, or in the contents of CAN messages received. There is also a bit
which records when a trip has occurred. When an error status message is sent, the
corresponding bit is cleared in the LVT, so it disappears from the current error message when
it is next sent. This applies even to the trip bit if the trip is still present when the next error
status message is sent.
Normally the error status is updated to the application without user intervention. However,
an update can be forced by pressing the [Update Error Status] button. This may lead to an
entirely blank message (with no errors to report).

User manual LVTest VISUALCONNX Application Version 6.5.0 - bernard
Copyright add2 bernard Page 80 of 157 J001518 V6.5.0 LVTest VISUALCONNX Application.doc
So that old error states are not simply lost, the display shows two columns of simulated
LEDs. The left-hand column shows the last reported error status. The right-hand column is
initially all clear, and shows cumulatively all the trips which have been reported. The [Clear
Error History] button can be used to clear all the entries in the cumulative display. The LED
showing red in the cumulative display shows that the a trip has previously occurred, but that
the trip state is not current.
Incompatible firmware
The Bad Firmware Version error is important. It can arise because the firmware is
incompatible with the current version of the GUI, or because it does not seem to match the
hardware of the LVTGO-VBS unit. In this case, unusually, all the LVTGO-VBS outputs are
driven to zero (as if the unit were tripping), but there is no indication on the Status LED of a
trip.
Spurious errors
The Bad Other Setting error reported above is not necessarily evidence of software failure or
of corruption in the CAN communication. Configuration settings are typically updated
piecemeal, and this can give rise to intermediate configuration states which are rejected as
inconsistent (this is especially common when adjusting the pulse width of an analogue output
trigger). Similarly, the Special Value Bad Value error probably arose because a request to
read a value occurred when the value to be read had not yet been configured. Unless these
errors persist, they can be ignored.
14.6 [Special]: Version numbers
The upper right-hand part of the form shows the serial number of the LVTGO-VBS unit, and
the version numbers and build dates of the firmware and the boot-code. There is also some
hardware ID information which is used when re-flashing the unit. Please include this
information in error reports to add2 Ltd.

User manual LVTest VISUALCONNX Application Version 6.5.0 - bernard
Copyright add2 bernard Page 81 of 157 J001518 V6.5.0 LVTest VISUALCONNX Application.doc
14.7 [Special]: Make settings persistent
In the middle of the form are the Make Settings Persistent controls. They can be used to
save some values to the Flash ROM on the LVTGO-VBS unit after modifying them.
The [T U and F Parameters] button sets the initial state (at power on) of the waveform
generator. These settings are of limited use. The LVTGO-VBS unit powers on in an
analogue control mode in which the saved waveform is not played, and these settings are
overwritten by the host application after loading a waveform profile.
The [Wave Generator Settings] button saves several additional parameters governing the
behaviour of the waveform generator. Specifically, the saved items are
the waveform type
the number of EFTBN steps
the Max Output Voltage
the Voltage After Test
the Fast Output setting
The first is chosen from the Main Menu; the others are set on the Voltage Configurations
form.
The Serial Number can also be saved (after modifying it with the Special Values interface, as
described later).
The [HIL CAN Base ID] button is used to save the current state of the base ID (as set from
the Special values interface).
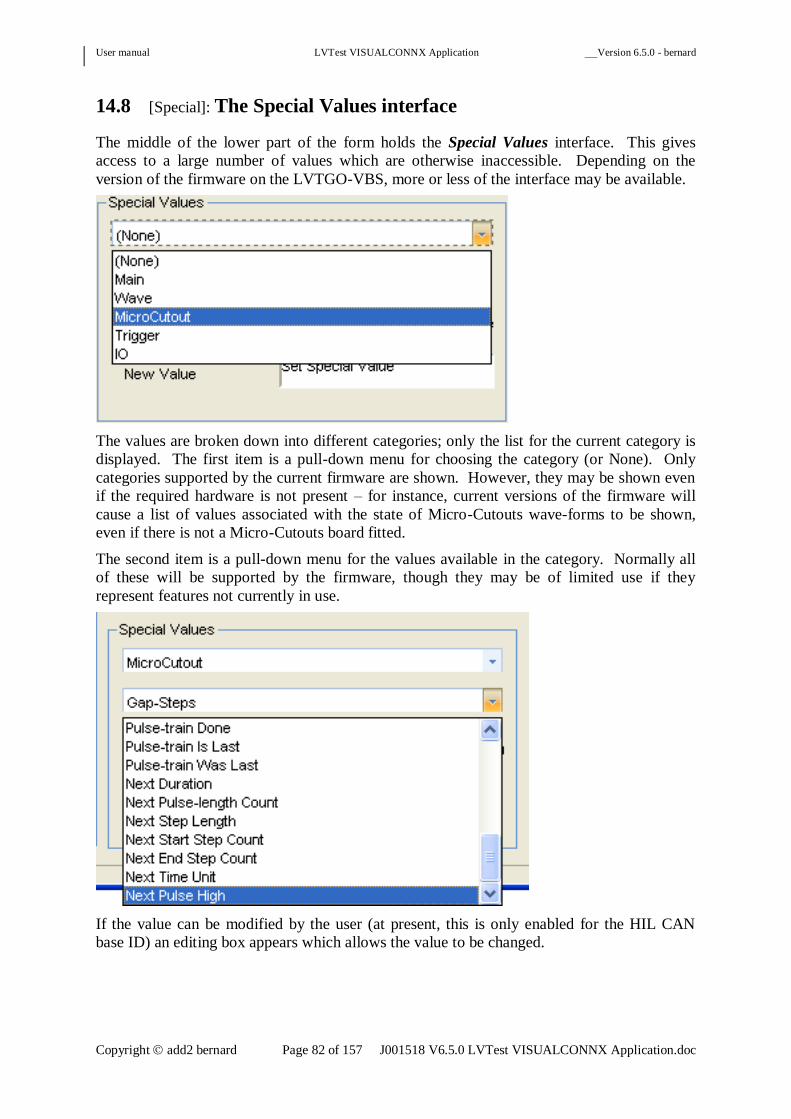
User manual LVTest VISUALCONNX Application Version 6.5.0 - bernard
Copyright add2 bernard Page 82 of 157 J001518 V6.5.0 LVTest VISUALCONNX Application.doc
14.8 [Special]: The Special Values interface
The middle of the lower part of the form holds the Special Values interface. This gives
access to a large number of values which are otherwise inaccessible. Depending on the
version of the firmware on the LVTGO-VBS, more or less of the interface may be available.
The values are broken down into different categories; only the list for the current category is
displayed. The first item is a pull-down menu for choosing the category (or None). Only
categories supported by the current firmware are shown. However, they may be shown even
if the required hardware is not present – for instance, current versions of the firmware will
cause a list of values associated with the state of Micro-Cutouts wave-forms to be shown,
even if there is not a Micro-Cutouts board fitted.
The second item is a pull-down menu for the values available in the category. Normally all
of these will be supported by the firmware, though they may be of limited use if they
represent features not currently in use.
If the value can be modified by the user (at present, this is only enabled for the HIL CAN
base ID) an editing box appears which allows the value to be changed.

User manual LVTest VISUALCONNX Application Version 6.5.0 - bernard
Copyright add2 bernard Page 83 of 157 J001518 V6.5.0 LVTest VISUALCONNX Application.doc
Edit the value in the editable field below, in the usual way. The modified value should
appear in the non-editable field above when the LVT reports it as changed.
HIL CAN messages are used for real-time voltage control and parameter value reporting. It
may be useful to change the base address to avoid clashes with existing message IDs on the
Target CAN bus. However, if the value is changed it will not then be possible to monitor the
parameter values using VISUALCONNX without special re-configuration.
When the value is reported as changed successfully, it can be made the permanent default on
the LVTGO-VBS unit using the [HIL CAN Base ID] button on this form.
14.9 [Special]: The output-range controls
These controls are for cases in which the LVT output must be restricted as input to an
external amplifier, which applies its own gain to the input. The setting is not saved as part of
any profile, but to the main LVTest.ini file for the installation. The LVT will operate
normally, except that it will limit its output voltage to the specified range (or the maximum
output voltage). The voltage readbacks will be reported as though already given the stated
scaling. However, the actual voltage delivered out of the VBatt terminal will be as
configured, subject to this limit.
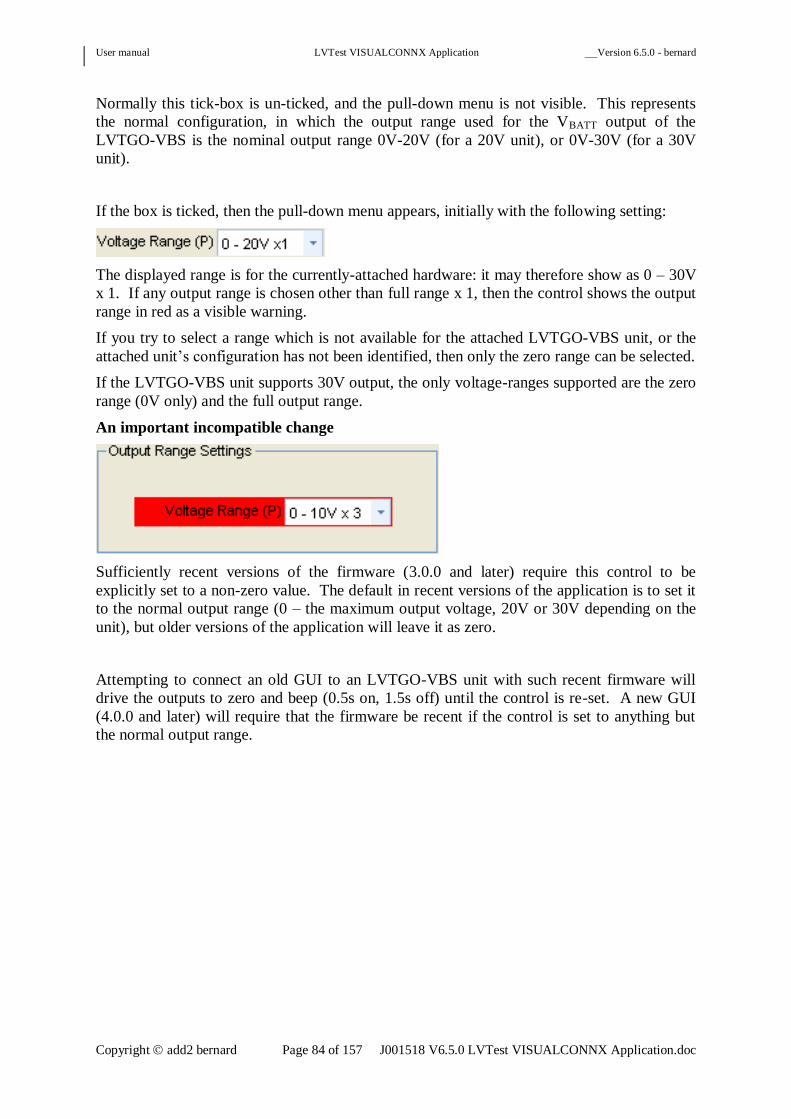
User manual LVTest VISUALCONNX Application Version 6.5.0 - bernard
Copyright add2 bernard Page 84 of 157 J001518 V6.5.0 LVTest VISUALCONNX Application.doc
Normally this tick-box is un-ticked, and the pull-down menu is not visible. This represents
the normal configuration, in which the output range used for the VBATT output of the
LVTGO-VBS is the nominal output range 0V-20V (for a 20V unit), or 0V-30V (for a 30V
unit).
If the box is ticked, then the pull-down menu appears, initially with the following setting:
The displayed range is for the currently-attached hardware: it may therefore show as 0 – 30V
x 1. If any output range is chosen other than full range x 1, then the control shows the output
range in red as a visible warning.
If you try to select a range which is not available for the attached LVTGO-VBS unit, or the
attached unit’s configuration has not been identified, then only the zero range can be selected.
If the LVTGO-VBS unit supports 30V output, the only voltage-ranges supported are the zero
range (0V only) and the full output range.
An important incompatible change
Sufficiently recent versions of the firmware (3.0.0 and later) require this control to be
explicitly set to a non-zero value. The default in recent versions of the application is to set it
to the normal output range (0 – the maximum output voltage, 20V or 30V depending on the
unit), but older versions of the application will leave it as zero.
Attempting to connect an old GUI to an LVTGO-VBS unit with such recent firmware will
drive the outputs to zero and beep (0.5s on, 1.5s off) until the control is re-set. A new GUI
(4.0.0 and later) will require that the firmware be recent if the control is set to anything but
the normal output range.

User manual LVTest VISUALCONNX Application Version 6.5.0 - bernard
Copyright add2 bernard Page 85 of 157 J001518 V6.5.0 LVTest VISUALCONNX Application.doc
15 The Trip Status form
This form is reached by clicking on the [Trip Status] hot-spot, or on the [Trip Status] tab in
the tab-bar, of the Miscellaneous Settings form, and the corresponding hot-spots and tabs in
various other forms only reached from that form.
It shows the trip status and thermal status of the LVTGO-VBS unit, and can be used to
retrieve the history of its trip status (including time-stamps). It can also be used to clear the
special slow beep and flash which indicates that a trip has previously occurred on the unit.
This form also gives access to the Errors and Special Values form and the HIL Inputs form.
This group of forms is not necessary for routine playing of simulations.
15.1 [Trips]: Return to the previous form
Clicking on the [Back] hot-spot at the top left of the form hides this form, and returns to the
previously-displayed form.
15.2 [Trips]: Navigating to specific forms

User manual LVTest VISUALCONNX Application Version 6.5.0 - bernard
Copyright add2 bernard Page 86 of 157 J001518 V6.5.0 LVTest VISUALCONNX Application.doc
Clicking on the [Special Values] hot-spot to the right of the [Back] hot-spot brings up the
Error Status and Special Values form.
Clicking on the [HIL Inputs] hot-spot to the right of the [Special Values] hot-spot brings up
the HIL Inputs form.
15.3 [Trips]: Viewing the application help document
Clicking on the [Help] hot-spot at the top right of the form brings up a WindowsTM
Help
document for the application.
15.4 [Trips]: The tab-bar
Below the title and the row of hot-spots is a tab-bar. The tabs in it can be clicked to bring up
other forms.
Clicking on the [Waveform Main] tab in the tab-bar brings up the Waveform Main form.
Clicking on the [Misc. Settings] tab in the tab-bar brings up the Miscellaneous Settings form.
Clicking on the [Special Values] tab in the tab-bar brings up the Error Status and Special
Values form.
Clicking on the [HIL Inputs] tab in the tab-bar brings up the HIL Inputs form.

User manual LVTest VISUALCONNX Application Version 6.5.0 - bernard
Copyright add2 bernard Page 87 of 157 J001518 V6.5.0 LVTest VISUALCONNX Application.doc
15.5 [Trips]: Inspecting the trip state
The display at the upper right shows the current trip state and, below it, a cumulative display
maintained by the host application showing which trips have previously been reported. This
is separate from the information held in the trip log on the LVTGO-VBS unit itself, and is not
cleared if the trip-log is erased.
The Trip LED on the Waveform Main form is lit when the LVTGO-VBS unit reports that it
is in a tripped state. This is not strictly the same as the behaviour of the TRIP LED on the
LVTGO-VBS unit itself. The TRIP LED indicates by a flashing sequence the highest-
priority trip currently active, and in the absence of a trip it will also flash slowly if a trip has
previously occurred (and not been cleared from the GUI). Some states which are not strictly
trips are indicated similarly. The corresponding information can be found in the trip displays
on this form, or in the Errors and Special Values form, as noted in the next section.
15.6 [Trips]: Trip-like behaviour
Under some circumstances, the LVTGO-VBS holds its outputs to zero, even though a trip is
not reported. There are two ways in which this can happen.
Firstly, if the LVTGO-VBS has started to be configured from the LVTest application, but the
output voltage range has not been configured, the unit may hold its VB OUT and GND OUT
voltages at zero. In this state, the TRIP LED on the LVTGO-VBS unit flashes and the
sounder buzzes at 0.5Hz, with a 25% duty-cycle. Strictly, this is to protect the output
hardware from accidentally exceeding the intended output voltage limit, and this is not a trip
(which is to protect the LVTGO-VBS unit itself). This will happen if the LVTest Application
version is older than 3.0, or if the relevant configuration message has been lost, perhaps
because the LVTest Application was started before the LVTGO-VBS unit has finished
switching on. Ensure that the application version is at least 3.0 and re-start it.
Secondly, if the firmware is incompatible with the LVTest Application or with the detected
hardware of the LVTGO-VBS unit itself, the LVTGO-VBS unit will silently hold its outputs
at zero. The TRIP LED on the LVTGO-VBS unit shows no activity, except perhaps the very
slow pulse indicating that a trip has previously occurred. The Errors and Special Values form
(reached from the Miscellaneous Settings form) will show a red light in the Bad Firmware
Version line of the Errors display. Try stopping and re-starting the GUI.

User manual LVTest VISUALCONNX Application Version 6.5.0 - bernard
Copyright add2 bernard Page 88 of 157 J001518 V6.5.0 LVTest VISUALCONNX Application.doc
15.7 [Trips]: Inspecting the trip log
Minimising the trip log at the left produces
this display. Entries for trips recorded after
the beginning of the log are removed, and
the trip state added into the oldest entry,
which is cumulative from the specified
time.
Erasing the trip log rather than minimising
it produces this display. The log consists
only of the initial cumulative entry. No
trips are shown except those which were
current when the log was erased (in this
case, none). The time-stamp for the
cumulative entry is updated to show the
time at which it was erased.
The large display at the left shows the trip log. This is not updated automatically, but must be
fetched by pressing the [Refresh Trip Log] button. The result should be a list of entries, each
of which begins with a count of seconds since the LVTGO-VBS firmware started to run,
followed by the trips. The last entry (and only the last entry) should have the right-hand LED
lit, to show that it is a cumulative entry (when the trip log becomes full, the cumulative entry
is updated with the entries lost from the log).
All entries may be collapsed into a single cumulative entry by pressing the [Minimise Trip
Log] button.

User manual LVTest VISUALCONNX Application Version 6.5.0 - bernard
Copyright add2 bernard Page 89 of 157 J001518 V6.5.0 LVTest VISUALCONNX Application.doc
The entire log (including the cumulative entry) can be cleared by pressing the [Erase Trip
Log] button. This is in red because it permanently removes all the history from the LVTGO-
VBS unit. The cumulative entry is re-started, and its time-stamp is updated to show that
previous entries have been removed. This also clears the cumulative record maintained by
the LVTest Application (in the Cumulative line of the Trip State box below the middle of the
tab-bar).
If a trip has occurred, the LVTGO-VBS unit flashes the Trip LED and sounds the buzzer
briefly every few seconds if no trip is current. This state can be re-set (so that the unit is
silent) by pressing the [Reset Buzzer] button.
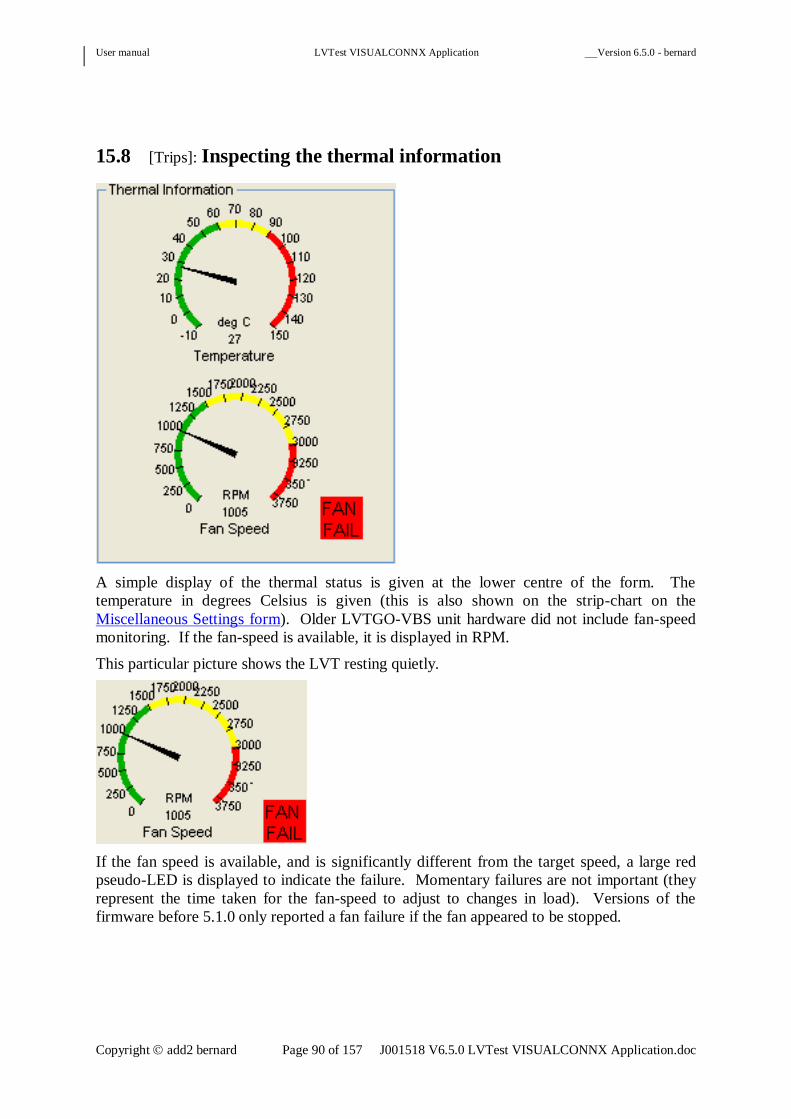
User manual LVTest VISUALCONNX Application Version 6.5.0 - bernard
Copyright add2 bernard Page 90 of 157 J001518 V6.5.0 LVTest VISUALCONNX Application.doc
15.8 [Trips]: Inspecting the thermal information
A simple display of the thermal status is given at the lower centre of the form. The
temperature in degrees Celsius is given (this is also shown on the strip-chart on the
Miscellaneous Settings form). Older LVTGO-VBS unit hardware did not include fan-speed
monitoring. If the fan-speed is available, it is displayed in RPM.
This particular picture shows the LVT resting quietly.
If the fan speed is available, and is significantly different from the target speed, a large red
pseudo-LED is displayed to indicate the failure. Momentary failures are not important (they
represent the time taken for the fan-speed to adjust to changes in load). Versions of the
firmware before 5.1.0 only reported a fan failure if the fan appeared to be stopped.

User manual LVTest VISUALCONNX Application Version 6.5.0 - bernard
Copyright add2 bernard Page 91 of 157 J001518 V6.5.0 LVTest VISUALCONNX Application.doc
16 The HIL Inputs form
This form is reached by clicking on the [HIL Inputs] hot-spot, or on the [HIL Inputs] tab in
the tab-bar, of the Miscellaneous Settings form, and the corresponding hot-spots and tabs in
various other forms only reached from that form.
This form also gives access to the Errors and Special Values form and the Trip Status form.
This group of forms is not necessary for routine playing of simulations.
This form is not normally useful. It provides real-time diagnostic information when using the
HIL analogue inputs to control the LVTGO-VBS unit. See the LVTGO-VBS Specification
Sheet for more details.
16.1 [HIL]: Return to the previous form
Clicking on the [Back] hot-spot at the top left of the form hides this form, and returns to the
previously-displayed form.

User manual LVTest VISUALCONNX Application Version 6.5.0 - bernard
Copyright add2 bernard Page 92 of 157 J001518 V6.5.0 LVTest VISUALCONNX Application.doc
16.2 [HIL]: Navigating to specific forms
Clicking on the [Special Values] hot-spot to the right of the [Back] hot-spot brings up the
Error Status and Special Values form.
Clicking on the [Trip Status] hot-spot to the right of the [Special Values] hot-spot brings up
the Trip Status form.
16.3 [HIL]: Viewing the application help document
Clicking on the [Help] hot-spot at the top right of the form brings up a WindowsTM
Help
document for the application.
16.4 [HIL]: The tab-bar
Below the title and the row of hot-spots is a tab-bar. The tabs in it can be clicked to bring up
other forms.
Clicking on the [Waveform Main] tab in the tab-bar brings up the Waveform Main form.
Clicking on the [Misc. Settings] tab in the tab-bar brings up the Miscellaneous Settings form.
Clicking on the [Special Values] tab in the tab-bar brings up the Error Status and Special
Values form.

User manual LVTest VISUALCONNX Application Version 6.5.0 - bernard
Copyright add2 bernard Page 93 of 157 J001518 V6.5.0 LVTest VISUALCONNX Application.doc
Clicking on the [Trip Status] tab in the tab-bar brings up the Trip Status form.
16.5 [HIL]: Viewing the application help document
Clicking on the [Help] hot-spot at the top left of the form brings up a WindowsTM
Help
document for the application.
16.6 [HIL]: The HIL inputs shown numerically, and as binary data
The upper line displays the most recently reported numerical values (0 – 255) of the HIL
inputs.
The two LEDs show the Fast Output and Trigger inputs, treated as binary data. They are
compared against the critical threshold 2.5V (64 in the units of the upper line). The values
read are sampled at roughly 1ms intervals, and after a transition further transitions are
suppressed for 100ms. This debounced reading is shown on the LEDs.
To the left of the numerical display is a legend:
To the left of the LED display is a legend:
16.7 [HIL]: Setting the HIL readback interval
This control is used to set the frequency with which the HIL inputs are sampled. If the
frequency is set to zero then no HIL information will be available.

User manual LVTest VISUALCONNX Application Version 6.5.0 - bernard
Copyright add2 bernard Page 94 of 157 J001518 V6.5.0 LVTest VISUALCONNX Application.doc
16.8 [HIL]: Selecting the HIL input to show on the Waveform Main
form
A set of radio-buttons can be used to select one of the HIL inputs (or none of them) to be
monitored on the Waveform Main form. The voltage reading is updated at the specified
frequency.
If the input selected is HIL2 or HIL3 then the display on the Waveform Main form also
shows the interpretation of the same input as a digital signal, as also shown in the HIL inputs
as interpreted display. HIL2 can be used to control the Fast Output setting, though this is
now little used. HIL3 is still important as an analogue trigger input. See the Trigger
Configuration form for further details.
16.9 [HIL]: The HIL strip-chart
The lower part of the form is taken up with a large strip-chart. This shows the same
information as the numerical display, but over time. For each of the graphs, 0 represents 0V
on the external I/O connector pin and 256 (just off the top of the scale) represents 10V.
The preceding diagram shows the Trigger input driven from a fairly rough square wave. The
other inputs are floating near ground, and too low to appear in the strip-chart.
Below the strip-chart is a legend, showing the colours used for the different HIL inputs.
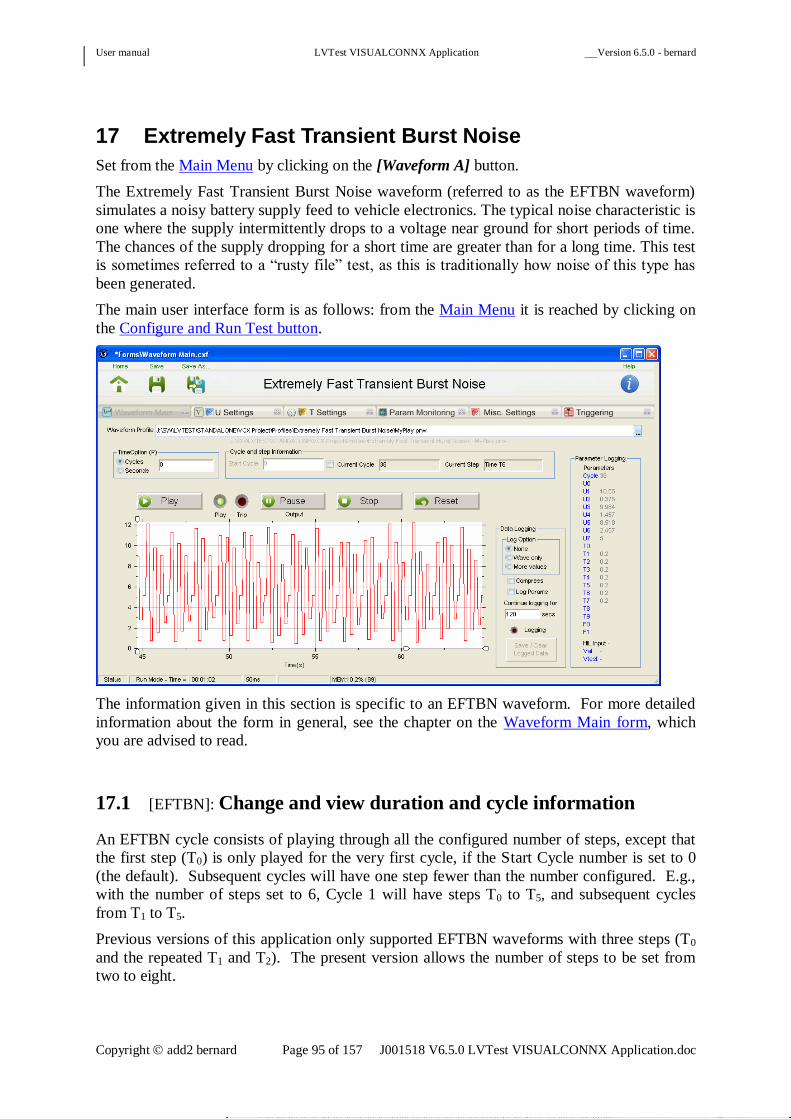
User manual LVTest VISUALCONNX Application Version 6.5.0 - bernard
Copyright add2 bernard Page 95 of 157 J001518 V6.5.0 LVTest VISUALCONNX Application.doc
17 Extremely Fast Transient Burst Noise
Set from the Main Menu by clicking on the [Waveform A] button.
The Extremely Fast Transient Burst Noise waveform (referred to as the EFTBN waveform)
simulates a noisy battery supply feed to vehicle electronics. The typical noise characteristic is
one where the supply intermittently drops to a voltage near ground for short periods of time.
The chances of the supply dropping for a short time are greater than for a long time. This test
is sometimes referred to a “rusty file” test, as this is traditionally how noise of this type has
been generated.
The main user interface form is as follows: from the Main Menu it is reached by clicking on
the Configure and Run Test button.
The information given in this section is specific to an EFTBN waveform. For more detailed
information about the form in general, see the chapter on the Waveform Main form, which
you are advised to read.
17.1 [EFTBN]: Change and view duration and cycle information
An EFTBN cycle consists of playing through all the configured number of steps, except that
the first step (T0) is only played for the very first cycle, if the Start Cycle number is set to 0
(the default). Subsequent cycles will have one step fewer than the number configured. E.g.,
with the number of steps set to 6, Cycle 1 will have steps T0 to T5, and subsequent cycles
from T1 to T5.
Previous versions of this application only supported EFTBN waveforms with three steps (T0
and the repeated T1 and T2). The present version allows the number of steps to be set from
two to eight.

User manual LVTest VISUALCONNX Application Version 6.5.0 - bernard
Copyright add2 bernard Page 96 of 157 J001518 V6.5.0 LVTest VISUALCONNX Application.doc
This waveform tends to be run over a very large number of cycles with very short steps
(hence the “Extremely Fast” in the name, although relatively low square-waves can also be
generated). It is normally most convenient to play the waveform for a specified number of
seconds, rather than for a specified number of cycles.
The timing settings can be inspected and modified using the Timing and Frequency
Configurations form.
17.2 [EFTBN]: Modify the voltage parameters
Click on the [U Settings] tab in the tab-bar of the Waveform Main form or the Timing and
Frequency Configurations form to bring up the following form:
For more detailed information about this form in general, see the chapter on the Voltage
Configurations form, which you are advised to read.
Only the controls applying to the configured number of steps are visible.
For an EFTBN waveform, there is a special consideration which applies to changing the U1
setting while the cycle is playing. Because each cycle ends by driving the voltage to the U1
value for the next following cycle, the U1 settings set when a cycle is (re-)started will still be
used for the next following cycle. This does not prevent the same settings producing different
U1 values because of randomisation, but it does affect the use of the Configuration Trigger.
17.2.1 [EFTBN]: Setting the number of steps
You can change the number of steps in the EFTBN waveform with the control at the top left
of this form. This control is only visible when an EFTBN waveform has been selected.
Enter the voltages required, as using the waveform diagram as a reference for each voltage.
The range of voltages for each of the U values is from 0V to 30V, in multiples of 1 mV.
If a 20V LVTGO-VBS unit, or one which for some reason cannot have its output range
identified, is attached, then the range of voltages is limited to 0V – 20V.

User manual LVTest VISUALCONNX Application Version 6.5.0 - bernard
Copyright add2 bernard Page 97 of 157 J001518 V6.5.0 LVTest VISUALCONNX Application.doc
Values entered are not lost when the step-count changes, so this may be changed at any point.
Of course, if the step-count must be increased, until it is set to the new value some of the
associated controls will not be accessible.
The transitions between successive U values are abrupt steps, not ramps.
17.3 [EFTBN]: Modify the time parameters
Click on the [T Settings] tab in the tab-bar of the Waveform Main form or the Voltage
Configurations form to bring up the following form:
For more detailed information about this form in general, see the chapter on the Timing and
Frequency Configurations form, which you are advised to read.
The number of controls shown for an EFTBN waveform depends on the number of time-steps
set on the Voltage Configurations form. The following message appears on the form to
remind the user.

User manual LVTest VISUALCONNX Application Version 6.5.0 - bernard
Copyright add2 bernard Page 98 of 157 J001518 V6.5.0 LVTest VISUALCONNX Application.doc
18 Random Cranking Waveform
Set from the Main Menu by clicking on the [Waveform B] button.
The Random Cranking Waveform simulates the battery supply feed to vehicle electronics
during an engine start cycle.
The main user interface form is as follows: from the Main Menu it is reached by clicking on
the [Configure and Run Test] button.
The information given in this section is specific to a Random Cranking waveform. For more
detailed information about the form in general, see the chapter on the Waveform Main form,
which you are advised to read.
18.1 [Crank]: Change and view duration and cycle information
A Random Cranking cycle consists of playing through the steps T1 – T2 and T4 – T9 (T3 is not
used). Cycle 1 also contains a T0 period, which can be suppressed by setting a Start Cycle of
1 instead of 0.
This waveform tends to have relatively long cycles of varying length. It is normally most
convenient to play the waveform for a specified number of cycles, rather than for a specified
number of seconds.

User manual LVTest VISUALCONNX Application Version 6.5.0 - bernard
Copyright add2 bernard Page 99 of 157 J001518 V6.5.0 LVTest VISUALCONNX Application.doc
18.2 [Crank]: Modify the voltage parameters
Click on the [U Settings] tab in the tab-bar of the Waveform Main form or the Timing and
Frequency Configurations form to bring up the following form:
For more detailed information about this form in general, see the chapter on the Voltage
Configurations form, which you are advised to read.
For a Random Cranking waveform, the transitions from Uo or U7 to U3 at the beginning of T1,
and from U4 to U7 at the beginning of T9, are abrupt steps, not ramps. The others are ramps.
The U parameters are numbered in a rather confusing order. Use the diagram shown to see
which U parameter controls the voltage during which T step in the waveform.

User manual LVTest VISUALCONNX Application Version 6.5.0 - bernard
Copyright add2 bernard Page 100 of 157 J001518 V6.5.0 LVTest VISUALCONNX Application.doc
18.3 [Crank]: Voltage constraints for Random Cranking
For Random Cranking waveforms, the Voltage Configurations form cannot cease to be
visible on the top (using a navigation hot-spot, or a tab in the tab-bar) without causing some
constraints on the settings to be checked. A message-box may be produced warning about
constraints which may be violated, giving the opportunity to adjust the settings before
continuing. The same check is made before trying to save the settings from the same form.
The constraints are
U2 ≥ U5 / 2
U6 ≥ U5 / 2
U5 is the total amplitude (peak to trough) of the sine-wave component. This ensures that the
envelope of the sinusoid cannot descend below 0V.
Here is a sample message-box.
The cases in which the specified range (minimum to maximum) of the voltages always
violate the constraints, and those in which some extreme values do not violate them, are
distinguished. A report that a constraint is “never” satisfied means that if the LVT attempts
to play the waveform it will always appear to hang with the current step showing as
“Checking Voltages” on the Waveform Main form, as it repeatedly tries new random values
to satisfy the constraints. A constraint which is “sometimes” satisfied can produce arbitrarily
large delays at the beginning of the cycle until the constraint is satisfied.
Setting a resolution greater than 1mV may limit the effective range so that a setting reported
as “sometimes”not satisfying a rule may in fact always satisfy it (or never satisfy it). In
principle an extreme case of a normal distribution might also in practice not be encountered
(or not within a reasonable number of iterations). However, the definite statement “the
waveform will not play” should always be correct, and if no warning is given the waveform
should never need to be recalculated.

User manual LVTest VISUALCONNX Application Version 6.5.0 - bernard
Copyright add2 bernard Page 101 of 157 J001518 V6.5.0 LVTest VISUALCONNX Application.doc
18.4 [Crank]: Modify the time and frequency parameters
Click on the [T Settings] tab in the tab-bar of the Waveform Main form or the Voltage
Configurations form to bring up the following form:
For more detailed information about this form in general, see the chapter on the Timing and
Frequency Configurations form, which you are advised to read.
T3 is not used in a Random Cranking waveform; F0 and F1 are not used for any other
waveform type.
The frequency parameters F0 and F1 specify the initial and final frequency of the sinusoid in
step T6. This is in Hz; the range is in steps of 0.1Hz from 0.1Hz to 250Hz. The frequency
changes with uniform angular acceleration.

User manual LVTest VISUALCONNX Application Version 6.5.0 - bernard
Copyright add2 bernard Page 102 of 157 J001518 V6.5.0 LVTest VISUALCONNX Application.doc
19 Ramp Up and Down
Set from the Main Menu by clicking on the [Waveform C] button.
The Ramp Waveform simulates the battery supply feed to vehicle electronics during a slow
discharge and charging cycle. This waveform was introduced with version 3.0.9 of the
Application, and version 1.3.5 of the firmware. It is intended to implement the requirements
of the JLR Test Procedure more accurately than the previous Ramp Up and Down waveform,
which is still available under a new name as the Alternative Ramp waveform..
The main user interface form is as follows: from the Main Menu it is reached by clicking on
the Configure and Run Test button.
This waveform differs from the Alternative Ramp waveform in using fixed slopes for the
ramps, and deriving the duration of the ramps from the voltage differences used. It does not
support user control of the slope or duration of the ramps. Following the Test Procedure, it
varies the voltage reached between the ramps through a range of successive values. Starting
with Version 3.0.0 of the firmware (Version 4.0.0 of the application) this uses the
Configuration Trigger mechanism. The principal change is that this can now be combined
with other input triggers. See Triggering Ramp Up and Down waveforms for more details.
If greater flexibility is required, it is recommended that the Alternative Ramp waveform be
used with COM scripting.
The information given in this section is specific to a Ramp Up and Down waveform. For
more detailed information about the form in general, see the chapter on the Waveform Main
form, which you are advised to read.
19.1 [Ramp]: Change and view duration and cycle information
A Ramp Up and Down cycle consists of playing through the steps T1 – T5. Cycle 1 also
contains a T0 period, which can be suppressed by setting a Start Cycle of 1 instead of 0.

User manual LVTest VISUALCONNX Application Version 6.5.0 - bernard
Copyright add2 bernard Page 103 of 157 J001518 V6.5.0 LVTest VISUALCONNX Application.doc
This waveform tends to have relatively long cycles of varying length. It is normally most
convenient to play the waveform for a specified number of cycles, rather than for a specified
number of seconds.
19.2 [Ramp]: Modify the voltage parameters
Click on the [U Settings] tab in the tab-bar of the Waveform Main form or the Timing and
Frequency Configurations form to bring up the following form:
The information given in this section is specific to a Ramp Up and Down waveform. For
more detailed information about the form in general, see the chapter on the Voltage
Configurations form, which you are advised to read.
There may be an abrupt change of voltage between U0 and U1 in the very first cycle, and
when moving from the U3 voltage at the end of one cycle to the U1 voltage at the beginning of
the next. All other voltage changes should be gradual.
The U2 settings are shown differently from the other voltage settings. The U2 value is not
randomised, but programmed to vary from the Maximum value down to the Minimum value
in steps of the Resolution in successive cycles. The actual voltage used is based on the
current U2 settings and the cycle number. The waveform will stop if the Minimum voltage is
already low.
While a test is running, the U2 Minimum control will show the currently-used value. If the
test is stopped, the minimum value will be restored to the control. Saving the current settings
(even while a test is running) will record the minimum value as configured, not whatever
value of U2 happens to be current.

User manual LVTest VISUALCONNX Application Version 6.5.0 - bernard
Copyright add2 bernard Page 104 of 157 J001518 V6.5.0 LVTest VISUALCONNX Application.doc
19.3 [Ramp]: Modify the time parameters
Click on the [T Settings] tab in the tab-bar of the Waveform Main form or the Voltage
Configurations form to bring up the following form:
For more detailed information about the form in general, see the chapter on the Timing and
Frequency Configurations form, which you are advised to read.
For a Ramp Up and Down waveform, it is usually specify a limiting number of cycles than to
a limiting number of seconds. The end-point reached after setting a time in seconds depends
on the Start Cycle and also on time spent inside cycles which are Stopped and then resumed
with [Play].
The ramp time-steps T2 and T4 have slopes as required by the JLR Test Procedure, that is 30 s
/ V for T2 and 5 s / V for T4. This means that the duration of these steps is determined by the
voltage differences between U1 and (the current value of) U2, and (the current value of) U2
and U3. There is therefore no user control of the time-steps T2 and T4.
The slopes are maintained accurately even if U1 and U3 are randomised: the voltage
difference used is the actual difference between the current values for each cycle.
See also the section on Scaling in the Trigger Configuration form.

User manual LVTest VISUALCONNX Application Version 6.5.0 - bernard
Copyright add2 bernard Page 105 of 157 J001518 V6.5.0 LVTest VISUALCONNX Application.doc
20 Constant Voltage
Set from the Main Menu by clicking on the Waveform D button.
This waveform allows you to set a constant voltage to be sustained indefinitely. Pressing on
the Increase or decrease will add/remove 0.1V respectively. The voltage may also be entered
as a number – Remember to press the [ENTER] key to send to value to the unit when
entering the value.
The main user interface form is as follows: from the Main Menu it is reached by clicking on
the [Configure and Run Test] button.

User manual LVTest VISUALCONNX Application Version 6.5.0 - bernard
Copyright add2 bernard Page 106 of 157 J001518 V6.5.0 LVTest VISUALCONNX Application.doc
20.1 [Constant]: Modify the voltage parameters
Click on the [U Settings] tab in the tab-bar of the Waveform Main form to bring up the
following form:
Although U0 (as for all waveform types other than Captured Waveform) can notionally be
randomised, it will only be generated once.
The other settings have their usual effect.
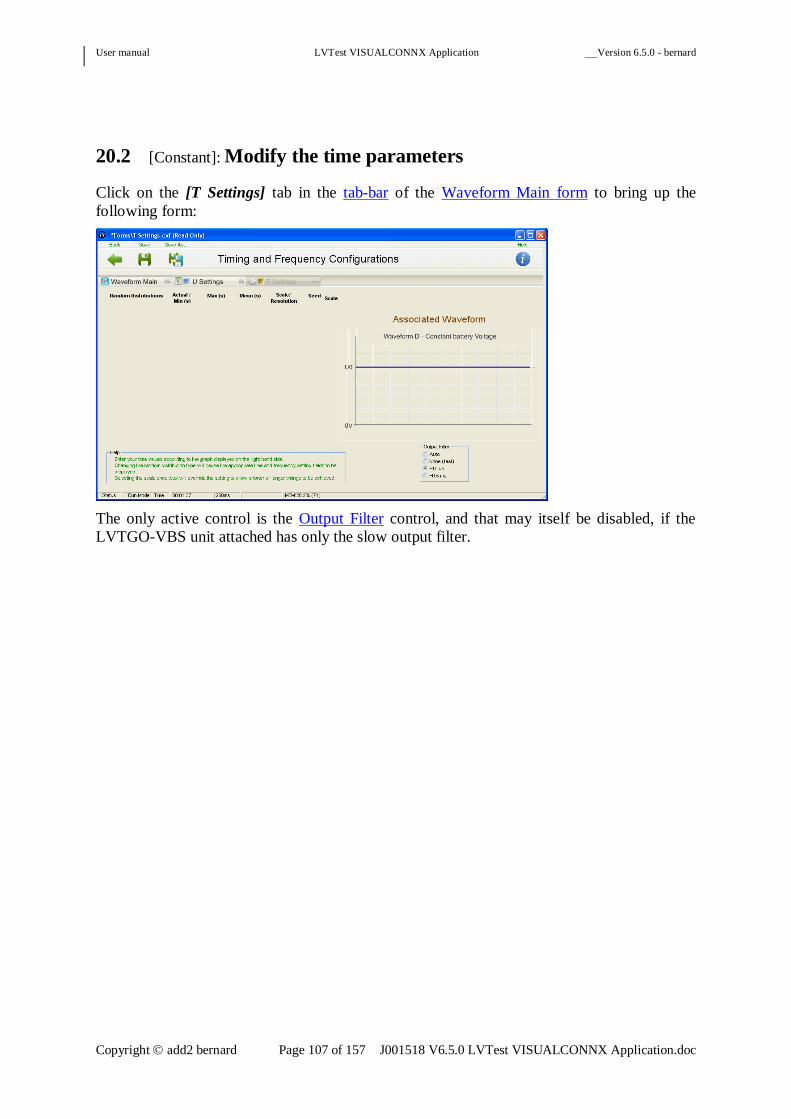
User manual LVTest VISUALCONNX Application Version 6.5.0 - bernard
Copyright add2 bernard Page 107 of 157 J001518 V6.5.0 LVTest VISUALCONNX Application.doc
20.2 [Constant]: Modify the time parameters
Click on the [T Settings] tab in the tab-bar of the Waveform Main form to bring up the
following form:
The only active control is the Output Filter control, and that may itself be disabled, if the
LVTGO-VBS unit attached has only the slow output filter.

User manual LVTest VISUALCONNX Application Version 6.5.0 - bernard
Copyright add2 bernard Page 108 of 157 J001518 V6.5.0 LVTest VISUALCONNX Application.doc
21 Alternative Ramp
Set from the Main Menu by clicking on the [Free Ramp] button.
The Alternative Ramp Waveform simulates the battery supply feed to vehicle electronics
during a slow discharge and charging cycle. It differs from the Ramp Up and Down
waveform in allowing control of the duration (and so of the slope) of the ramps. It does not
support programmed variation of any of the voltages (though any can be randomised). It
does not impose any special triggering requirements.
The main user interface form is as follows: from the Main Menu it is reached by clicking on
the Configure and Run Test button.
For more detailed information about this form in general, see the chapter on the Waveform
Main form, which you are advised to read.
There are no special peculiarities of the settings for the Alternative Ramp waveform.

User manual LVTest VISUALCONNX Application Version 6.5.0 - bernard
Copyright add2 bernard Page 109 of 157 J001518 V6.5.0 LVTest VISUALCONNX Application.doc
21.1 [Alt. Ramp]: Change and view duration and cycle information
An Alternative Ramp cycle consists of playing through the steps T1 – T5.
This waveform tends to have relatively long cycles of varying length. It is normally most
convenient to play the waveform for a specified number of cycles, rather than for a specified
number of seconds.
21.2 [Alt. Ramp]: Modify the voltage parameters
Click on the [U Settings] tab in the tab-bar of the Waveform Main form or the Timing and
Frequency Configurations form to bring up the following form:
The information given in this section is specific to an Alternative Ramp waveform. For more
detailed information about the form in general, see the chapter on the Voltage Configurations
form, which you are advised to read.
There may be an abrupt change of voltage between U0 and U1 in the very first cycle, and
when moving from the U3 voltage at the end of one cycle to the U1 voltage at the beginning of
the next. All other voltage changes should be gradual.

User manual LVTest VISUALCONNX Application Version 6.5.0 - bernard
Copyright add2 bernard Page 110 of 157 J001518 V6.5.0 LVTest VISUALCONNX Application.doc
21.3 [Alt. Ramp]: Modify the time parameters
Click on the [T Settings] tab in the tab-bar of the Waveform Main form or the Voltage
Configurations form to bring up the following form:
The information given in this section is specific to an Alternative Ramp waveform. For more
detailed information about the form in general, see the chapter on the Timing and Frequency
Configurations form, which you are advised to read.
It is usually more useful to limit this wave-form to a given number of cycles than to a specific
length of time. The end-point reached after setting a time in seconds depends on the Start
Cycle and also on time spent inside cycles which are Stopped and then resumed with [Play].

User manual LVTest VISUALCONNX Application Version 6.5.0 - bernard
Copyright add2 bernard Page 111 of 157 J001518 V6.5.0 LVTest VISUALCONNX Application.doc
22 Captured Waveforms
Set from the Main Menu by clicking on the [Captured Waveforms] button.
This selection is used to replay previously captured waveforms which have been stored on the
LVTGO-VBS unit. These are typically recorded cranking waveforms, but the only general
restrictions are that the sample interval must be a multiple of 0.5ms from 0.5ms to 32.7675s,
and the voltage must lie between 0V and the maximum output voltage of the unit (20V or
30V). Voltages over 20V will saturate at 20V on a 20V unit, though without an error. The
main user interface form is as follows: from the Main Menu it is reached by clicking on the
[Configure and Run Test] button.
For more detailed information about this form in general, see the chapter on the Waveform
Main form, which you are advised to read.
The information given in this section is specific to Captured waveforms.
No more than 64 waveforms may be stored at once. Waveforms are selected to be played by
their index number.
Only voltage data may be played back, at a resolution specified as 4, 8 or 12 bits. These are,
for VBatt data, taken over a configured range of integral volts lying in the range 0V to 30V
(e.g., from 7V to 15V). The output stage of 20V LVTGO-VBS units is only capable of
approximately 22mV resolution. 30V LVTGO-VBS units have an output resolution of
approximately 8.3mV. , and there will be rounding to the nearest available output voltage. It
is normal to have VBatt data or VBatt Data with Ground-offset data together. Ground-offset
data by itself is possible, but at present there is no way to control the VBatt voltage while
ground-offset data only are being replayed; VBatt can only be a fixed voltage.
No more than 64K of wave data can be stored in the LVT, including metadata and header
information. The amount of re-playing time this represents is difficult to summarise, as it
depends on character of the original data and of the sampling options used.

User manual LVTest VISUALCONNX Application Version 6.5.0 - bernard
Copyright add2 bernard Page 112 of 157 J001518 V6.5.0 LVTest VISUALCONNX Application.doc
Several controls are only shown on this form for Captured Waveforms.
See Selecting and pre-viewing Captured Waveforms for details of these controls.
22.1 [Captured]: Change and view duration and cycle information
A Captured Waveform cycle consists simply of playing through the captured data from
beginning to end. At present there is no provision for parametrising the data.
22.2 [Captured]: Modify the voltage parameters
Click on the [U Settings] tab in the tab-bar of the Waveform Main form to bring up the
following form:
The information given in this section is specific to a Captured Waveform. For more detailed
information about the form in general, see the chapter on the Voltage Configurations form,
which you are advised to read,
There are no voltage parameters which control parts of the waveform. However, there are
global settings for the voltage after test, the maximum voltage, and the ground-offset voltage,
and a control for enabling or disabling fast output.
As usual, clicking on the [Pause] button on the Waveform Main form in the middle of a
waveform will sustain the current output voltage until it is re-started with the [Play] button..
When not actually re-playing the voltage data or paused, the output voltage is the voltage
after test. This means that the behaviour when waiting for a trigger is different for a Captured
Waveform than for other waveform types.

User manual LVTest VISUALCONNX Application Version 6.5.0 - bernard
Copyright add2 bernard Page 113 of 157 J001518 V6.5.0 LVTest VISUALCONNX Application.doc
22.3 [Captured]: Modify the time parameters
The only active control on the Timing and Frequency Configurations form for Captured
Waveforms is the Output Filter control. To save space, there is no [T Settings] tab in the tab-
bar for this (Waveform Main) form. If you need the Output Filter control, it can be reached
using the [T Settings] tab on the Voltage Configurations form, which can itself be reached
using the [U Settings] tab on this form. The form looks like this:
See also the Captured Waveform controls in the Waveform Main form for selecting a
waveform to play and seeing a preview of the selected waveform. All captured waveforms
consist of a single nominal T1 step. Output triggers may be anchored to this step as usual.
22.4 [Captured]: Importing, Resampling and Managing Captured
Waveforms
The Waveform Main form only controls the re-playing of captured waveforms. The tab-bar
gives links to the Captured Import form, which allows the user to import CSV-formatted
captured data into a form where the application can handle it, and the Captured Transfer
form, which allows the user to inspect and manage the captured waveforms stored on the
LVTGO-VBS unit. In addition, there is a Captured Resample form, which is used to
resample the imported data into the final form actually stored on the LVTGO-VBS unit.
Access to this form is by using the [Captured Resample] tab on the other two forms. There
is no direct access to this form from the Waveform Main form.

User manual LVTest VISUALCONNX Application Version 6.5.0 - bernard
Copyright add2 bernard Page 114 of 157 J001518 V6.5.0 LVTest VISUALCONNX Application.doc
23 Micro-Cutouts Waveforms
Set from the Main Menu by clicking on the [Micro-Cutouts] button.
This selection is used to play accurately-timed short pulse-trains.
For more detailed information about this form in general, see the chapter on the Waveform
Main form, which you are advised to read.
The information given in this section is specific to Micro-Cutouts waveforms.

User manual LVTest VISUALCONNX Application Version 6.5.0 - bernard
Copyright add2 bernard Page 115 of 157 J001518 V6.5.0 LVTest VISUALCONNX Application.doc
23.1 Micro-Cutouts Preview
The Show Preview control appears on this form when Micro-Cutouts are selected. If it is
selected (ticked) the preview pane appears, as follows:
The Micro-Cutouts waveform preview only shows the pulse-train in the middle of the cycle.
The T1 step before the pulse-train is represented as two time-intervals, and the T3 step after it
is represented as two time-intervals after it. T1 and T3 may actually be shorter than this. The
time-units in use are not shown: the time-intervals are defined by the numerical value of T2
multiplied by the time-unit.
23.2 [Captured]: Change and view duration and cycle information
A Micro-Cutouts Waveform cycle consists of an initial T1 stage playing a high voltage, an
intermediate stage during which a pulse-train oscillates between the high voltage and a lower
voltage, and finally a T3 stage during which the high voltage is sustained.
23.3 [Captured]: Modify the voltage parameters
Click on the [U Settings] tab in the tab-bar of the Waveform Main form to bring up the
following form:

User manual LVTest VISUALCONNX Application Version 6.5.0 - bernard
Copyright add2 bernard Page 116 of 157 J001518 V6.5.0 LVTest VISUALCONNX Application.doc
The waveform diagram exists in two forms. The form shown above is displayed when the
Pulse High option is selected (ticked). If it is unselected, the following diagram is shown
instead:
The information given in this section is specific to a Micro-Cutouts Waveform. For more
detailed information about the form in general, see the chapter on the Voltage Configurations
form, which you are advised to read,
There are currently just two voltages which define the intended waveform profile. These are
the U1 and U2 voltages, re-labelled as Low U and Pulse. Low U is the lower voltage: Low U
+ Pulse is the upper voltage, which is used as the “voltage after test” voltage whenever a
pulse-train is not being driven. The usual global settings are available for the maximum
voltage and the ground-offset voltage, and a control for enabling or disabling fast output. For
Micro-Cutouts waveforms, the voltage after test control is only for information: it shows the
high voltage, Low U + Pulse. This is, as usual, subject to the maximum voltage limit.
There is an additional control, which determines whether the voltage is normally high with
low-going pulses, or normally low with high-going pulses. Details can be found here. In
either case, the voltage during the T1 and T3 steps (before and after the pulse-train
respectively) is always the higher of the two voltages, just as it is used for the voltage after
test.
As usual, clicking on the [Pause] button on the Waveform Main form in the middle of a
waveform will sustain the current output voltage until it is re-started with the [Play] button..
When not actually re-playing the voltage data or paused, the output voltage is the high
voltage. As previously noted, this is the high voltage based on the current value of the Low
U and Pulse settings.

User manual LVTest VISUALCONNX Application Version 6.5.0 - bernard
Copyright add2 bernard Page 117 of 157 J001518 V6.5.0 LVTest VISUALCONNX Application.doc
23.4 [Captured]: Modify the time parameters
Click on the [T Settings] tab in the tab-bar of the Waveform Main form or the Voltage
Configurations form to bring up the following form:
In this form, like the Voltage Settings form, the waveform diagram will change according to
the current choice of pulse polarity in the Voltage Settings form.
The information given in this section is specific to a Micro-Cutouts waveform. For more
detailed information about the form in general, see the chapter on the Timing and Frequency
Configurations form, which you are advised to read.
This waveform is rather different from the other waveforms in its use of the time parameters.
There is no initial T0 step at the beginning of Cycle 1. There are only T1, T2 and T3 steps. At
present, no randomisation is supported, and T1 and T3 cannot be scaled. T2 is required to be
scaled by a time-unit, set from a pull-down menu. T2 multiplied by the time-unit sets the
basic time-interval of a pulse-train, in which pulses one time-step wide are separated by gaps
which are multiples of one time-interval wide.
Two special controls appear on this form for Micro-Cutouts waveforms only. See the First
Gap Count and Last Gap Count controls on the Timing and Frequency Configurations form
for more details on specifying the number of pulses and the size of the gaps between the
pulses in the pulse-train.

User manual LVTest VISUALCONNX Application Version 6.5.0 - bernard
Copyright add2 bernard Page 118 of 157 J001518 V6.5.0 LVTest VISUALCONNX Application.doc
24 The Captured Import form
This form can be reached by clicking on one of the [Captured Import] tabs. These can be
found in the tab-bar of the Waveform Main form when the currently-selected waveform type
is Captured Waveform, the tab-bar of the Captured Resample form and the tab-bar of the
Captured_Transfer form.
This form is used to import external data into a form which can be directly manipulated by
the LVTest Application. Only after importing can it be re-sampled into a form which can be
directly stored on and replayed from the LVTGO-VBS unit.
After importing waveforms and saving them, the next step is usually to go to the Captured
Resample form to re-sample them.
Preliminary warning:
There is a difference between the "current selection" (all the items highlit in the Imported
Waveforms list-box) and the "currently-selected waveform", which is normally the single
waveform most recently clicked on in the list. Neither is related to the waveform currently
selected for playing in the Waveform Main form.
Where information applicable to a single waveform is displayed, it is for the currently-
selected waveform. This information appears in the Waveform Details display.

User manual LVTest VISUALCONNX Application Version 6.5.0 - bernard
Copyright add2 bernard Page 119 of 157 J001518 V6.5.0 LVTest VISUALCONNX Application.doc
24.1 [Import]: Scanning the current waveform directory
Initially, whenever the currently-chosen waveform folder changes, and when actions in
another form threaten to modify the contents of that directory, the form will scan the folder
contents. This has no apparent effect on this form, but it affects checking to prevent
accidentally re-importing data. A warning may be issued at this time if a change in the folder
has revealed an earlier import from the same source file.
Scanning the folder contents may take some time. While it happens, most of the controls on
the form are disabled, and this warning label appears over the upper part of the form.
After scanning, the old selection in the Imported Waveforms list-box will be lost and the
currently-selected waveform is merely the waveform most recently processed, which may be
anywhere in the list.
24.2 [Import]: Return to the previous form
Clicking on the [Back] hot-spot at the top left of the form hides this form, and returns to the
previously visible form. Settings are not lost when the form is hidden
24.3 [Import]: Viewing the application help document
Clicking on the [Help] hot-spot at the top right of the form brings up a WindowsTM
Help
document for the application.

User manual LVTest VISUALCONNX Application Version 6.5.0 - bernard
Copyright add2 bernard Page 120 of 157 J001518 V6.5.0 LVTest VISUALCONNX Application.doc
24.4 [Import]: The tab-bar
Below the title and the row of hot-spots is a tab-bar. The tabs in it can be clicked to bring up
other forms. The tab-bar for this form exists in two versions, depending on the currently-
selected waveform type.
Clicking on the [Waveform Main] tab in the tab-bar brings up the Waveform Main form.
Clicking on the [Captured Resample] tab in the tab-bar brings up the Captured Resample
form.
Clicking on the [Captured Transfer] tab in the tab-bar brings up the Captured Transfer form.
24.5 [Import]: Destination Folder control
The Destination Folder text-box is may be edited to change the waveform folder into which
waveforms are imported. The application checks for cases in which waveforms have already
been imported into this folder (this check is made when the folder changes, and when a
waveform is actually imported).
As well as typing in the folder path directly into the editable part of the control, you may
click on the button labelled with an ellipsis [...] to browse to a folder. You will be given the
opportunity to create a new folder. This cannot be done just by typing into the control, to
prevent accidental mis-typing producing new empty folders.
24.6 [Import]: Action Buttons
The [Import CSV Files...] button brings up a dialogue-box in which the user can navigate to
the CSV-format files to be imported. Multiple files can be selected in a single folder using
the Control and Shift modifiers in the usual way. Ctrl-A has its usual effect and selects every
file displayed for the folder.

User manual LVTest VISUALCONNX Application Version 6.5.0 - bernard
Copyright add2 bernard Page 121 of 157 J001518 V6.5.0 LVTest VISUALCONNX Application.doc
The format of the CSV file is restricted. The field separator must be a comma. The tabular
data must be preceded by a single line giving headings for the fields (columns). The field
headings must match “Offset” for Ground Offset data, “Voltage” for the battery output
voltage, and “Time” for the time-stamp data. None of the headings is required, though at
least one of Ground Offset or Battery voltage data must be present. No heading may occur
twice, and all other fields in the line must be blank. Leading and trailing white-space will be
trimmed, and the matching is not case-sensitive. A line which does not meet these
requirements is not taken to be a header line. The tabular data may contain data in additional
fields (not those with entries in the header line); these data will be ignored. However, the
designated fields must contain data starting immediately after the header line. Trailing lines
in which all the designated fields are not numerical will be removed, but there must be no
other missing or non-numerical values.
Optionally, additional lines may occur before the header line. The first non-blank line found
before the header line will be used as a text description of the waveform. It is kept with the
waveform data, and can be used to identify it, even when it is stored on the LVGTO-VBS
unit itself.
The selected files will be imported (unless the user cancels, or an error occurs). Another
effect of this control is to remove any current selection in the Imported Waveforms list-box.
Any items successfully imported will form the new selection after the process has finished.
After importing the data, when a waveform is the currently-selected waveform its description
can be edited in the Description control on this form. The description is applied to the
waveform (including all re-sampled versions of it). The Captured Resample form also
contains a Description control, and it can be edited there too. However, it is probably most
useful to edit the description when it is first imported.
Warnings are issued if a waveform appears to have been imported already. Feel free to ignore
the warning and continue (click on the "No" button). You have the opportunity to inspect the
imported waveforms and remove them if they are in fact duplicates. In any case, the
imported waveform is treated as new (it has its own GUID and may be given its own
different Description). The existing imported waveform will not be affected.
This button is normally enabled except when an operation is already in progress. If it is
drawn in grey, it is temporarily disabled.
The [Remove Selection] button removes the current selection from the Imported Waveforms
list-box and deletes the imported data.
This button is disabled if an operation is already in progress, or if there is no current selection
in the Imported Waveforms list-box. If it is drawn in grey, it is disabled.
The [Save Selection] button removes the current selection from the Imported Waveforms
ListBox and stores it in the currently-selected Destination Folder. It is possible that the
GUID first assigned to the imported waveform will have to be changed at this point. If this
happens, a warning is issued to the Activity Log.
This button is disabled if an operation is already in progress, or if there is no current selection
in the Imported Waveforms ListBox. If it is drawn in grey, it is disabled.
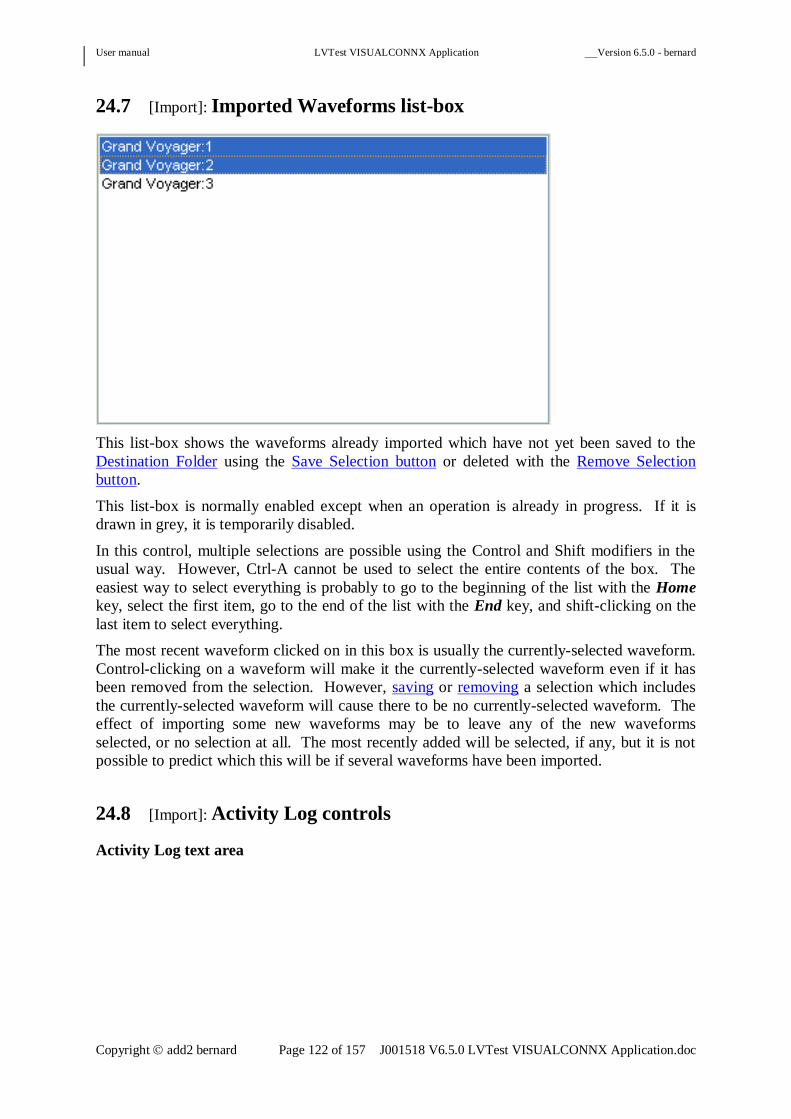
User manual LVTest VISUALCONNX Application Version 6.5.0 - bernard
Copyright add2 bernard Page 122 of 157 J001518 V6.5.0 LVTest VISUALCONNX Application.doc
24.7 [Import]: Imported Waveforms list-box
This list-box shows the waveforms already imported which have not yet been saved to the
Destination Folder using the Save Selection button or deleted with the Remove Selection
button.
This list-box is normally enabled except when an operation is already in progress. If it is
drawn in grey, it is temporarily disabled.
In this control, multiple selections are possible using the Control and Shift modifiers in the
usual way. However, Ctrl-A cannot be used to select the entire contents of the box. The
easiest way to select everything is probably to go to the beginning of the list with the Home
key, select the first item, go to the end of the list with the End key, and shift-clicking on the
last item to select everything.
The most recent waveform clicked on in this box is usually the currently-selected waveform.
Control-clicking on a waveform will make it the currently-selected waveform even if it has
been removed from the selection. However, saving or removing a selection which includes
the currently-selected waveform will cause there to be no currently-selected waveform. The
effect of importing some new waveforms may be to leave any of the new waveforms
selected, or no selection at all. The most recently added will be selected, if any, but it is not
possible to predict which this will be if several waveforms have been imported.
24.8 [Import]: Activity Log controls
Activity Log text area

User manual LVTest VISUALCONNX Application Version 6.5.0 - bernard
Copyright add2 bernard Page 123 of 157 J001518 V6.5.0 LVTest VISUALCONNX Application.doc
This text-area displays information about operations performed in this form. The activity log
cannot be edited, but text in it can be selected and copied into the Clipboard to be pasted
elsewhere.
The [Clear Log] button erases the existing contents of the Activity Log
The Verbose Logging tick-box controls the amount of information given in the Activity Log.
The control is normally off, and only errors (on their first detection) and summary
information are reported in the log.
If the box is ticked, then errors are tracked in much more detail. The additional information
is normally only of use to add2 staff in understanding a failure.

User manual LVTest VISUALCONNX Application Version 6.5.0 - bernard
Copyright add2 bernard Page 124 of 157 J001518 V6.5.0 LVTest VISUALCONNX Application.doc
24.9 [Import]: Waveform Details display
Graph
When there is a currently-selected waveform, it is displayed here, together with information
about its voltage range and its time-range. The Description of the waveform appears below
the graph as a title.
When there is no currently-selected waveform, the graph is blank.
The Description text-box shows the descriptive text for the currently-selected waveform. It
is blank if there is no currently-selected waveform. By default, this is based on the header
lines in the file from which the data was imported. If no header is found, the path to the
imported file is used instead.
The contents of this text-box can be edited. This gives you the opportunity to edit the
description field to anything you find more convenient. This is part of the data for each
derived waveform which is sent to the LVTGO-VBS unit. The intention is that it can be used
to identify the original data, even if read from the LVTGO-VBS without any additional
information. An unnecessarily long description wastes space on the LVTGO-VBS unit for
each converted version of the waveform stored.

User manual LVTest VISUALCONNX Application Version 6.5.0 - bernard
Copyright add2 bernard Page 125 of 157 J001518 V6.5.0 LVTest VISUALCONNX Application.doc
The GUID text-box shows the identifier assigned to a waveform when it is imported.This is a
GUID ("Globally Unique Identifier"). This cannot be edited, and it remains a unique
identifier of the waveform for the internal use of the LVTGO-VBS suite. This is also stored
with each waveform on the LVTGO-VBS unit, and can be used to resolve ambiguities where
multiple waveforms have the same description. The GUID will only be changed if (which is
exceedingly unlikely) it clashes with a GUID already used in the Destination Folder when
saved.
24.10 [Import]: Progress Bar
The Progress bar shows the application working through multiple waveforms when
importing, saving or removing waveforms.
24.11 [Import]: Help frame
The Help frame contains a very short help message.

User manual LVTest VISUALCONNX Application Version 6.5.0 - bernard
Copyright add2 bernard Page 126 of 157 J001518 V6.5.0 LVTest VISUALCONNX Application.doc
25 The Captured Resample form
This form can be reached by clicking on one of the [Captured Resample] tabs. These can be
found in the tab-bar of the Captured Import form and the tab-bar of the Captured Transfer
form.
This form is used to resample data from the raw form imported using the Captured Import
form into a form which can be directly stored on the LVTGO-VBS unit using the controls on
the Captured Transfer form. The next step after resampling is normally to go to that form.
See also the chapter on the General discussion of the resampling process.
Preliminary warning:
There is a difference between the "current raw selection" (all the items highlit in the Raw
Data list-box), the "current sampled selection" (all the items highlit in the Sampled Data list-
box), and the "currently-selected waveform", which is normally the single waveform most
recently clicked on in either list. None of them is related to the waveform currently selected
for playing in the Waveform Main form. The intention is that users can check the features of
a particular waveform without selecting it (or anywhere in the current selection) by control-
clicking on it to bring up its details and then control-clicking again to restore its previous
selection state.
25.1 [Resample]: Scanning
Initially, whenever the currently-chosen waveform folder changes, and when actions in
another form threaten to modify the contents of that folder, the form will re-scan the folder
contents. This will re-load the contents of the two list-boxes (Raw Data on the left, and
Sampled Data on the right), which represent different views of the waveforms stored in the
currently-chosen waveform folder.

User manual LVTest VISUALCONNX Application Version 6.5.0 - bernard
Copyright add2 bernard Page 127 of 157 J001518 V6.5.0 LVTest VISUALCONNX Application.doc
Scanning the folder may take some time. While it happens, most of the controls on the form
are disabled, and the warning label above appears over the upper part of the form.
After scanning, the old selections in the list-boxes will be lost and the currently-selected
waveform is merely the waveform most recently processed, which may be anywhere in the
list.
25.2 [Resample]: Return to the previous form
Clicking on the [Back] hot-spot at the top left of the form hides this form, and returns to the
previously visible form. Settings are not lost when the form is hidden.
25.3 [Resample]: Viewing the application help document
Clicking on the [Help] hot-spot at the top right of the form brings up a WindowsTM
Help
document for the application.
25.4 [Resample]: The tab-bar
Below the title and the row of hot-spots is a tab-bar. The tabs in it can be clicked to bring up
other forms.
Clicking on the [Waveform Main] tab in the tab-bar brings up the Waveform Main form.

User manual LVTest VISUALCONNX Application Version 6.5.0 - bernard
Copyright add2 bernard Page 128 of 157 J001518 V6.5.0 LVTest VISUALCONNX Application.doc
Clicking on the [Captured Import] tab in the tab-bar brings up the Captured Import form.
Clicking on the [Captured Transfer] tab in the tab-bar brings up the Captured Transfer form.
25.5 [Resample]: Waveform Folder control
This may be used to change the waveform folder currently used. The lists of raw waveforms
and sampled waveforms in the list-boxes reflect the contents of the currently-chosen
waveform folder.
As well as typing in the folder path directly into the editable part of the control, you may
click on the button labelled with an ellipsis “…” to browse to a folder.
25.6 [Resample]: The list-boxes
The Raw Data (left-hand) list-box shows the waveforms found while scanning the current
directory which represent the user's original imported source data. Resampling is (at present)
only possible from source data, though it is possible to have resampled data with no source
data associated.
This list-box is normally enabled except when an operation is already in progress. If it is
drawn in grey, it is temporarily disabled.
In this list-box, multiple selections are possible using the Control and Shift modifiers in the
usual way. However, Ctrl-A cannot be used to select the entire contents of the box. The
easiest way to select everything is probably to press the [Home] button on your keyboard to
go to the top of the list, selecting the first item, pressing the [End] button on your keyboard to
go to the end of the list, and shift-clicking on the last item to select up to and including it.

User manual LVTest VISUALCONNX Application Version 6.5.0 - bernard
Copyright add2 bernard Page 129 of 157 J001518 V6.5.0 LVTest VISUALCONNX Application.doc
The most recent waveform clicked on in this list-box (or in the Sampled Data list-box next
following) is usually the currently-selected waveform. Control-clicking on a waveform will
make it the currently-selected waveform even if it has been removed from the selection.
However, deleting the current selection in either list-box (in this case, using the [<<Delete]
button), if it includes the currently-selected waveform, will cause there to be no currently-
selected waveform.
The Sampled Data (right-hand) list-box shows the waveforms found while scanning the
current directory which have been resampled into a form which can be stored and replayed on
the LVTGO-VBS.
This list-box is normally enabled except when an operation is already in progress. If it is
drawn in grey, it is temporarily disabled.
In this list-box, multiple selections are possible using the Control and Shift modifiers in the
usual way. However, Ctrl-A cannot be used to select the entire contents of the box. The
easiest way to select everything is probably to press the [Home] button on your keyboard to
go to the top of the list, selecting the first item, pressing the [End] button on your keyboard to
go to the end of the list, and shift-clicking on the last item to select up to and including it.
The most recent waveform clicked on in this list-box (or in the Raw Waveform list-box just
preceding) is usually the currently-selected waveform. Control-clicking on a waveform will
make it the currently-selected waveform even if it has been removed from the selection.
Deleting the current selection in either list-box (in this case, using the [Delete>>] button), if it
includes the currently-selected waveform, will cause there to be no currently-selected
waveform.
25.7 [Resample]: Space Used frame
The Space Used frame contains a single control, a percentage box labelled Selection.

User manual LVTest VISUALCONNX Application Version 6.5.0 - bernard
Copyright add2 bernard Page 130 of 157 J001518 V6.5.0 LVTest VISUALCONNX Application.doc
The Selection percentage-box shows the fraction of the total storage available on an LVTGO-
VBS represented by the current selection of sampled waveforms. If the amount is too large
to fit (over 100%) the percentage box shows 100%, but within a red ring.
25.8 [Resample]: Activity Log Controls
The Activity Log records information about operations performed in this form.
The activity log cannot be edited, but text in it can be selected and copied into the Clipboard
to be pasted elsewhere.
The [Clear Log] button erases the existing contents of the Activity Log.
The Verbose Logging tick-box controls the amount of information given in the Activity Log.
The control is normally off, and only errors (on their first detection) and summary
information are reported in the log. If the box is ticked, then errors are tracked in much more
detail. The additional information is normally only of use to add2 staff in understanding a
failure.
25.9 [Resample]: Action Buttons
The [<<Delete] is button erases the current raw selection, removing the associated files and
any resampled version of the same waveform. If sampled versions exist, the user is asked
whether to leave the waveform unmodified or to delete everything. The cleanest way to
remove a waveform entirely is to remove its sampled versions (using the [Delete>>] button
following) first, then this button. It is possible that a warning will still be issued. This
represents sampled versions of the waveform which are not recognised, perhaps because they
are produced by a later version of the software, perhaps because they have become corrupt.
This button is disabled if an operation is already in progress, or if there is no current selection
in the Raw Waveform list-box If it is drawn in grey, it is disabled.

User manual LVTest VISUALCONNX Application Version 6.5.0 - bernard
Copyright add2 bernard Page 131 of 157 J001518 V6.5.0 LVTest VISUALCONNX Application.doc
The [Delete>>] button erases the current sampled selection. Since a waveform can always be
re-sampled, this is not seen as critical, and will generate no warnings (unless the deletion fails
for some reason).
This button is disabled if an operation is already in progress, or if there is no current selection
in the Raw Waveform list-box. If it is drawn in grey, it is disabled.
The [Resample>>] button applies the current settings in the Sampling controls to the current
raw selection. Duplicates (waveforms already sampled with the same options) will be
discarded. See the General discussion of the resampling process for details of this operation.
This button is enabled when there is a current raw selection in the Raw Waveform list-box ,
and there is not an operation already in progress. If it is drawn in grey, it is temporarily
disabled.
The [Save as File...>>] button saves the current sampled selection to a list file, with
extension TSL. It will only allow the file to be saved in the current waveform folder. The
intention is that these files can later be loaded using the Select By File... button, in the
Captured Transfer form, and used to set a selection to be sent to the LVTGO-VBS unit.
This button is enabled when there is a current sampled selection in the Sampled Waveform
list-box, and there is not an operation already in progress. If it is drawn in grey, it is
temporarily disabled.
25.10 [Resample]: Waveform Data frame
The Waveform Data frame contains two items for the currently-specified waveform (or are
blank if there is none).
The Description text-box shows the descriptive text for the currently-selected waveform in
this form, or blank if none is selected. It may be edited here, or in the Captured Import form.
The description is of the waveform, and is common to the raw data and all of its sampled
versions. See the Description control in the Captured Import form for more information.
The GUID text-box shows a guaranteed persistent identifier for the currently-selected
waveform. It is assigned when a waveform is imported, and cannot be changed subsequently.
See the description of the GUID control in the Captured Import form for more information.

User manual LVTest VISUALCONNX Application Version 6.5.0 - bernard
Copyright add2 bernard Page 132 of 157 J001518 V6.5.0 LVTest VISUALCONNX Application.doc
25.11 [Resample]: Graph
When there is a currently-selected waveform, it is displayed here, together with information
about its voltage range and its time-range. A copy of the Description text for the waveform
appears below the graph as a title.
When there is no currently-selected waveform, the graph is blank. The amount of additional
information depends on whether the currently-selected waveform is Raw (in the left-hand
Raw Waveforms list-box) or Sampled (in the right-hand Sampled Waveforms list-box).
The display of resampling settings
For a sampled waveform, the settings shown in the second line of the graph header reflect
those actually used, rather than those requested. For instance, if there was no ground-offset
data present, the number of GO bits will be listed as 0 no matter how many were configured
when the resampling was performed. The number of repeat-count bits may also be smaller
than requested. See Special considerations for repeat-counts for details.
25.12 [Resample]: Help Text
This contains a very short help message.

User manual LVTest VISUALCONNX Application Version 6.5.0 - bernard
Copyright add2 bernard Page 133 of 157 J001518 V6.5.0 LVTest VISUALCONNX Application.doc
25.13 [Resample]: Progress Bar
The Progress bar shows the application working through multiple waveforms when deleting
raw waveforms, deleting sampled waveforms, or resampling.
25.14 [Resample]: Quick Help
The Quick Help tick-box controls whether the following help-message appears.
QuickHelp text
This is a short help message, which appears when the preceding Quick Help tick-box is
ticked.

User manual LVTest VISUALCONNX Application Version 6.5.0 - bernard
Copyright add2 bernard Page 134 of 157 J001518 V6.5.0 LVTest VISUALCONNX Application.doc
25.15 [Resample]: Resampling Controls
This frame contains a number of controls which configure the process of sampling
waveforms.
The VBatt Bits pull-down menu controls the precision with which the main output voltage is
stored after resampling.. The voltage values are by default expressed as a fraction of the
range 0V to 20V of the LVTGO-VBS unit (for maximum compatibility with old firmware).
However, the range may be changed with the control below:
This menu lets you choose the number of bits used to record the information. 0 bits means
that the information will be omitted. If there is no VBatt data in the imported waveform data,
then this will be treated as 0. It is not normally useful to drive the LVTGO-VBS unit with no
VBatt data, but it is possible to drive a controlled ground-offset without it. If no voltage data
at all is both present in the raw data and selected in the pull-down menus, no sampling will be
attempted.
The Limits controls specify the ends of the range of VBatt voltages used. This means that
waveforms which only use part of the available output range need not waste bits of precision.
For instance, if only the range 8V – 13V is of interest, then restricting the waveform to this
range (voltages outside this range will saturate at its limits) will in effect give an extra 2 bits
of precision. This is also the only way to use the full output range of a 30V unit. However,
only LVTGO-VBS units with firmware of version 4.0.0 or higher will be able to play
waveforms with a range other than 0V to 20V, and if the LVTGO-VBS has an output range
of only 20V then the output will saturate at 20V. In any case, the output is subject to the
maximum voltage and also to any restricted output range setting. The LVTGO-VBS unit’s
output control is not made more sensitive by this setting. 30V units have approximately 3600
distinguished output values for VBatt, and 20V units have approximately 900 (subject to
calibration).
No attempt is made to restrict re-sampling to output ranges which are possible with the
currently-attached unit, as the user may wish to re-sample for several possible output units at
once.
The VGO Bits pull-down menu controls the precision with which the ground-offset voltage is
stored after resampling.. The voltage values are expressed as a fraction of the output ground-
offset range of the LVTGO-VBS unit, 2.5V.
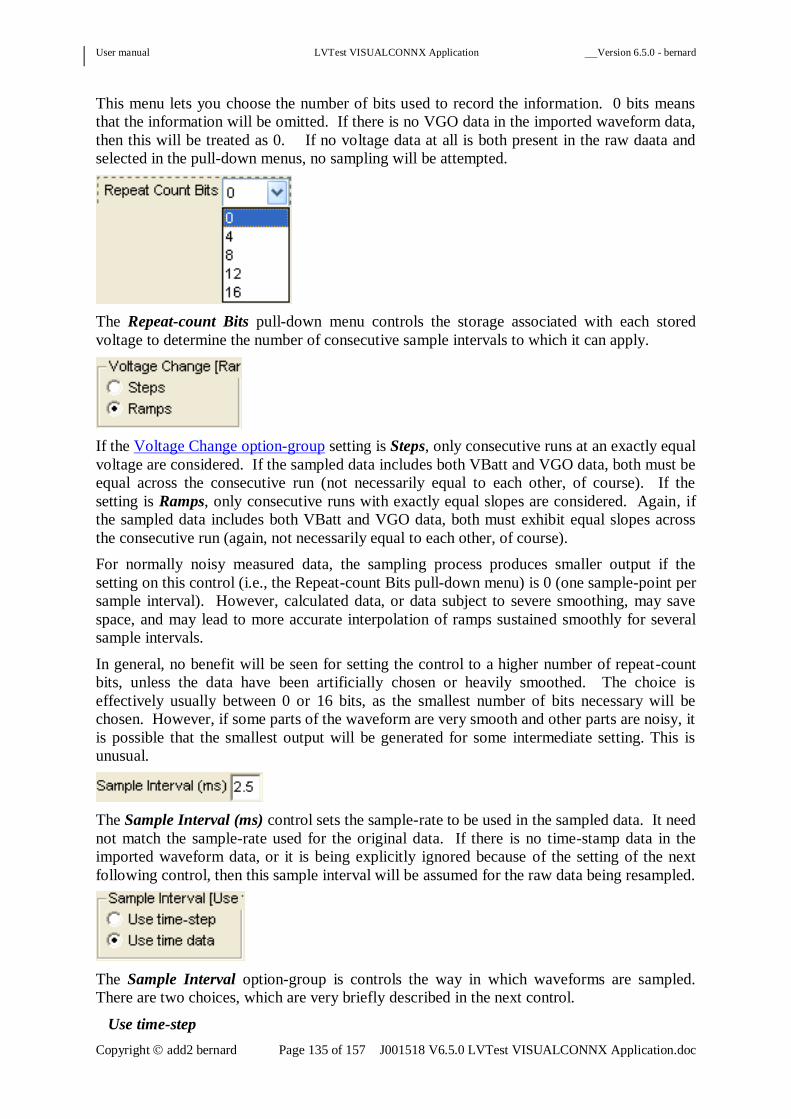
User manual LVTest VISUALCONNX Application Version 6.5.0 - bernard
Copyright add2 bernard Page 135 of 157 J001518 V6.5.0 LVTest VISUALCONNX Application.doc
This menu lets you choose the number of bits used to record the information. 0 bits means
that the information will be omitted. If there is no VGO data in the imported waveform data,
then this will be treated as 0. If no voltage data at all is both present in the raw daata and
selected in the pull-down menus, no sampling will be attempted.
The Repeat-count Bits pull-down menu controls the storage associated with each stored
voltage to determine the number of consecutive sample intervals to which it can apply.
If the Voltage Change option-group setting is Steps, only consecutive runs at an exactly equal
voltage are considered. If the sampled data includes both VBatt and VGO data, both must be
equal across the consecutive run (not necessarily equal to each other, of course). If the
setting is Ramps, only consecutive runs with exactly equal slopes are considered. Again, if
the sampled data includes both VBatt and VGO data, both must exhibit equal slopes across
the consecutive run (again, not necessarily equal to each other, of course).
For normally noisy measured data, the sampling process produces smaller output if the
setting on this control (i.e., the Repeat-count Bits pull-down menu) is 0 (one sample-point per
sample interval). However, calculated data, or data subject to severe smoothing, may save
space, and may lead to more accurate interpolation of ramps sustained smoothly for several
sample intervals.
In general, no benefit will be seen for setting the control to a higher number of repeat-count
bits, unless the data have been artificially chosen or heavily smoothed. The choice is
effectively usually between 0 or 16 bits, as the smallest number of bits necessary will be
chosen. However, if some parts of the waveform are very smooth and other parts are noisy, it
is possible that the smallest output will be generated for some intermediate setting. This is
unusual.
The Sample Interval (ms) control sets the sample-rate to be used in the sampled data. It need
not match the sample-rate used for the original data. If there is no time-stamp data in the
imported waveform data, or it is being explicitly ignored because of the setting of the next
following control, then this sample interval will be assumed for the raw data being resampled.
The Sample Interval option-group is controls the way in which waveforms are sampled.
There are two choices, which are very briefly described in the next control.
Use time-step

User manual LVTest VISUALCONNX Application Version 6.5.0 - bernard
Copyright add2 bernard Page 136 of 157 J001518 V6.5.0 LVTest VISUALCONNX Application.doc
This ignores any time-stamp data present in the imported waveform, and treats the voltage
data as though it had uniform sample intervals equal to the configured Sample Interval (ms).
This is provided for backward compatibility, and is not normally useful.
Use time data
This uses the time-stamp data imported with the waveform. If there is no time-stamp data, it
acts like Use time-step - that is, the samples are assumed to have uniform sample intervals
equal to the configured Sample Interval (ms). This is the default setting, and should normally
be used.
Sample Interval Source text
or
A very brief explanation of the option currently selected in the previous control.
The Voltage Change option-group controls the way in which waveforms are sampled. There
are two possible settings. A very brief explanation of the current setting appears in the next
control following.
Steps
This setting tries to break down the waveform into consecutive runs of constant voltage. This
is only very rarely more efficient than the alternative, unless the waveform is explicitly
constructed as a succession of steady voltage levels.
Ramps
This setting is the default, and is much more generally useful. It attempts to express the
waveform voltages as a succession of segments, joined end-to-end, with uniform slopes along
each segment.
If the Repeat-count Bits pull-down menu setting is 0, then the Steps option may be very
slightly more space-efficient than the Ramps option. Do be aware, however, that when using
the Ramps option the voltages will be interpolated every 0.5ms, if the sample interval is
larger than this.
Voltage Change mode text
or
A very brief explanation of the current setting in the preceding control.

User manual LVTest VISUALCONNX Application Version 6.5.0 - bernard
Copyright add2 bernard Page 137 of 157 J001518 V6.5.0 LVTest VISUALCONNX Application.doc
26 General discussion of the resampling process
The following pages describe the way in which imported waveform data is re-sampled, and
the exact effect of the different settings available.
26.1 [Discussion]: Precision settings for the voltages
All controls mentioned are on the Captured Resampling form, unless otherwise stated.
Ground Offset voltages, if Ground Offset data are available, are expressed as fractions of the
range from 0V to 2.5V. VBatt data, if available, is expressed as a fraction of the specified
range. A range of zero length may be specified (though it isn’t very useful). This will simply
output the specified voltage while the captured waveform plays, subject to the usual limits on
the output voltage. The voltage after test setting is not restricted to this range, as it is not part
of the waveform data.
If a LVTGO-VBS unit has firmware older than V4.0.0, it will only be able to play waveforms
for which the VBatt range is 0V – 20V. This is not necessarily the range of the actual wave
data, but the limit set while re-sampling. Voltages outside the specified range which are
found in the data produce warnings, and an opportunity to abandon the current re-sampling
attempt. If the user elects to continue, voltages saturate at the specified limits.
The maximum voltage stored for the waveform is independent of the currently-selected
Output Voltage Range setting, and of the currently-configured Maximum Voltage setting.
However, the actual voltage output is limited by both, and (of course) by the hardware limits
of the particular LVTGO-VBS unit used.
The VBatt Bits pull-down menu and the VGO Bits pull-down menu specifying the precision
to which the voltages in the imported data are retained during resampling. VBatt is the main
output voltage, while VGO is the ground-offset.
The voltages are rounded to the nearest multiple of the least-significant bit, and checked
against the physical limits of the LVTGO-VBS unit. There is one exception. The maximum
attainable voltage is just below the nominal output limit, and voltages above this limit will be
rounded down. For example, if 8 bits of precision are used for the VBatt output, with the
default range from 0V to 20V, then the actual maximum voltage will be 20V(1 - 2-8
) or about
19.922V.
Selecting 0 Bits in the VBatt Bits pull-down menu omits the VBatt data entirely. Similarly,
selecting 0 bits in the VGO Bits pull-down menu omits the VGO data entirely. If the effect is
to end up with no voltage data at all, then no sampling will be attempted.
It is not normally useful to drive the LVTGO-VBS unit with no VBatt data, but it is possible
to drive a controlled ground-offset without it.
26.2 [Discussion]: Options for the time-stamp data
All controls mentioned are on the Captured Resampling form.

User manual LVTest VISUALCONNX Application Version 6.5.0 - bernard
Copyright add2 bernard Page 138 of 157 J001518 V6.5.0 LVTest VISUALCONNX Application.doc
The existing time-stamps imported with the data, if any, may be ignored by setting the
Sample Interval option-group to Use time-step, when the voltage data provided will be
assumed to be at uniform intervals of the Sample Interval (ms). This will also be assumed if
there are no time-stamps in the imported data. Otherwise, any time-stamps supplied with the
data are reduced by the first time-stamp, so the initial sample starts at time 0, and are reduced
to the nearest multiple of the configured Sample Interval (ms).
26.3 [Discussion]: The stages of re-sampling
All controls mentioned are on the Captured Resampling form.
Fitting to the sample interval
If the original data are not sampled uniformly at intervals of the Sample Interval (ms) then
up-sampling or down-sampling – or even both at different parts of the waveform - will be
performed.
The algorithm for down-sampling tries to preserve the original characteristics of the data (it
does not simply discard “excess” data-items). In particular, where data-points have to be lost,
the algorithm tries to identify a replacement for the original data which preserves the initial
and final voltages and preserves any intermediate maximum voltage which is greater than
either and any intermediate minimum voltage which is lower than either. If both an
intermediate maximum and an intermediate minimum occur, they are kept in their original
time-order.
Identifying runs in the voltage data
The resulting envelope(s) of the waveform are consolidated into consecutive runs. There
may be two envelopes because both VBatt and VGO data may be present. Consolidation is
unlikely with real noisy data, as no approximations are allowed. If the Voltage Change
option-group setting is Steps, only consecutive runs at an exactly equal voltage are
consolidated. If the setting is Ramps, only consecutive runs with exactly equal slopes are
consolidated. If both VGO and VBatt data are present, then consolidation is only possible
when both envelopes provide consecutive runs which can be combined.
Please note that a "step" and a "ramp" are not equivalent, even if they are carried out over a
single sample-interval, if the sample-interval is more than the minimum (0.5ms). A "step"
will in this case sustain its initial voltage for the whole of the sample interval, while a "ramp"
will stay at the initial voltage for just 0.5ms, then change progressively every 0.5ms towards
the final voltage. That is, even though the stored sample interval may be much larger, the
voltage output by the LVTGO-VBS unit is controlled every 0.5ms, although this not obvious
if the voltage remains constant.
Re-splitting to fit the repeat count
Finally, the time-intervals between points in the resulting envelope(s) are re-split into the
longest runs allowed by the current repeat-count setting. The repeat-count only specifies a
length of time during which a constant voltage is sustained if the Voltage Change option-
group setting is Steps. If the setting is Ramps, which is the default and more usual, the name
is a slight misnomer. It specifies an interval, as a multiple of the configured Sample Interval
(ms), over which the LVTGO-VBS firmware will interpolate linearly between the end-points.
Of course, it is still possible for the voltage to be equal at the end-points.

User manual LVTest VISUALCONNX Application Version 6.5.0 - bernard
Copyright add2 bernard Page 139 of 157 J001518 V6.5.0 LVTest VISUALCONNX Application.doc
If the Repeat-count Bits pull-down menu is set to 0, no repeat-count information is saved, and
samples must be stored for each consecutive multiple of the configured Sample Interval (ms).
If the number of bits is larger, the largest repeat-count available is 2^(number of bits) – 1.
If the voltage envelope(s) of the waveform contain runs longer than this maximum repeat-
count, the run will be subdivided.
If the Voltage Change option-group setting is Steps , this is simply a matter of chopping the
run of constant voltages into the maximum lengths possible, with possibly a shorter run at the
end. If the setting is Ramps, the intermediate points chosen for sub-dividing the run are
chosen to give the most accurate possible slopes for the VBatt data (if present), or the VGO
data (otherwise), subject to the maximum repeat-count.
If, after splitting up the runs to avoid exceeding the maximum repeat-count, the resulting
maximum repeat-count can be accommodated with a smaller number of repeat-count bits,
then the smaller number is used.
26.4 [Discussion]: Special considerations for repeat-counts
All controls mentioned are on the Captured Resampling form.
Usually, if the waveform allows the use of repeat-counts usefully at all, it is best to pick a
very high maximum repeat-count (i.e., a relatively large value in the Repeat-count Bits pull-
down menu) and see what happens. However, it may happen that there is a long run of
uniform voltages somewhere in the waveform which will keep the maximum repeat-count
high. In that case, it may be worth trying a smaller number of repeat-count bits to see
whether it is more space-efficient (it will not be more accurate in interpolating intermediate
voltages, and will generally be less so). This depends on the precision to which the voltages
are being sampled.
For real captured data, it is almost always worth re-sampling with the Repeat-count Bits pull-
down menu set to 0. There will almost always be a run of at least 2 sample intervals, which
will prevent the repeat-count falling to uniform steps of length 1, but using no repeat-counts
is almost certainly the best way to make the resulting waveform use as little space as
possible.
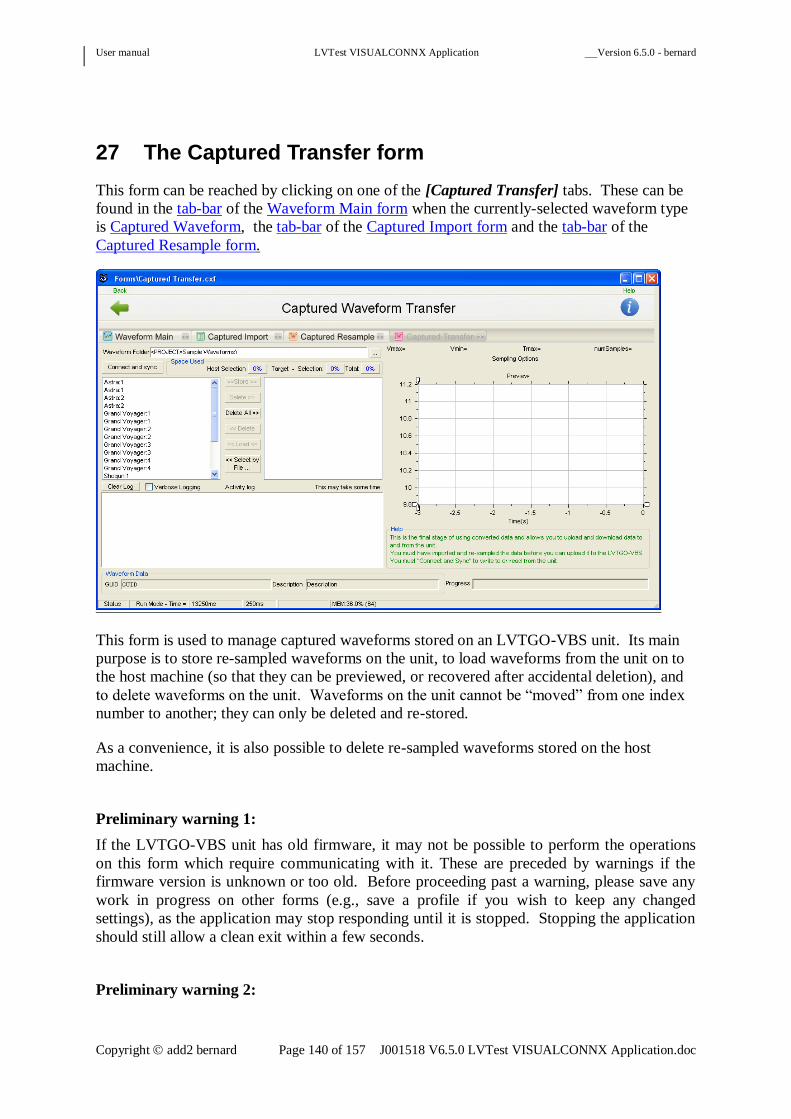
User manual LVTest VISUALCONNX Application Version 6.5.0 - bernard
Copyright add2 bernard Page 140 of 157 J001518 V6.5.0 LVTest VISUALCONNX Application.doc
27 The Captured Transfer form
This form can be reached by clicking on one of the [Captured Transfer] tabs. These can be
found in the tab-bar of the Waveform Main form when the currently-selected waveform type
is Captured Waveform, the tab-bar of the Captured Import form and the tab-bar of the
Captured Resample form.
This form is used to manage captured waveforms stored on an LVTGO-VBS unit. Its main
purpose is to store re-sampled waveforms on the unit, to load waveforms from the unit on to
the host machine (so that they can be previewed, or recovered after accidental deletion), and
to delete waveforms on the unit. Waveforms on the unit cannot be “moved” from one index
number to another; they can only be deleted and re-stored.
As a convenience, it is also possible to delete re-sampled waveforms stored on the host
machine.
Preliminary warning 1:
If the LVTGO-VBS unit has old firmware, it may not be possible to perform the operations
on this form which require communicating with it. These are preceded by warnings if the
firmware version is unknown or too old. Before proceeding past a warning, please save any
work in progress on other forms (e.g., save a profile if you wish to keep any changed
settings), as the application may stop responding until it is stopped. Stopping the application
should still allow a clean exit within a few seconds.
Preliminary warning 2:

User manual LVTest VISUALCONNX Application Version 6.5.0 - bernard
Copyright add2 bernard Page 141 of 157 J001518 V6.5.0 LVTest VISUALCONNX Application.doc
There is a difference between the "current host selection" (all the items highlit in the Host
Data list-box), the "current target selection" (all the items highlit in the Target Data list-box),
and the "currently-selected waveform", which is normally the single waveform most recently
clicked on in either list.
27.1 [Transfer]: Scanning
Initially, whenever the currently-chosen waveform folder changes, and when actions in
another form threaten to modify the contents of that folder, the form will re-scan the folder
contents. This will re-load the contents of the left-hand list-box (the Host Data list-box). It
has no effect on the right-hand list-box (the Target Data list-box) which shows the waveforms
stored on the LVT.
Changing the currently-chosen waveform folder will not alter the target list, since the
contents of the target have not changed. However, it may no longer be possible to display a
graph of a waveform on the target, if the waveform has not already been imported into the
new folder.
The [Connect and Sync] button will force any sampled waveforms on the target but not in the
current folder to be imported. These have no associated raw data, and will only appear in the
Host Data list-box in this form, and in the Sampled Data list-box in the Captured Resample
form..
Scanning the folder may take some time. While it happens, most of the controls on the form
are disabled, and this warning label appears over the upper part of the form.
After scanning, the old selections in the Host Data list-box will be lost, and the currently-
selected waveform is merely the waveform most recently processed, which may be anywhere
in the list.
27.2 [Transfer]: Return to the previous form
Clicking on the [Back] hot-spot at the top left of the form hides this form, and returns to the
previously visible form. Settings are not lost when the form is hidden.

User manual LVTest VISUALCONNX Application Version 6.5.0 - bernard
Copyright add2 bernard Page 142 of 157 J001518 V6.5.0 LVTest VISUALCONNX Application.doc
27.3 [Transfer]: Viewing the application help document
Clicking on the [Help] hot-spot at the top right of the form brings up a WindowsTM
Help
document for the application.
27.4 [Transfer]: The tab-bar
Below the title and the row of hot-spots is a tab-bar. The tabs in it can be clicked to bring up
other forms.
Clicking on the [Waveform Main] tab in the tab-bar brings up the Waveform Main form.
Clicking on the [Captured Import] tab in the tab-bar brings up the Captured Import form.
Clicking on the [Captured Resample] tab in the tab-bar brings up the Captured Resample
form.
27.5 [Transfer]: Waveform Folder control
This may be used to change the waveform folder currently used. The list of sampled
waveforms in the left-hand Host Data list-box reflects the contents of the currently-chosen
waveform folder.
As well as typing in the folder path directly into the editable part of the control, you may
click on the button labelled with an ellipsis "…" to browse to a folder.
27.6 [Transfer]: The list-boxes
There are two list-boxes on this form, occupying the middle of the left-hand side, separated
by a column of buttons. They are not labelled.

User manual LVTest VISUALCONNX Application Version 6.5.0 - bernard
Copyright add2 bernard Page 143 of 157 J001518 V6.5.0 LVTest VISUALCONNX Application.doc
The left-hand list-box is the Host Data list-box
It shows the resampled waveforms detected while scanning the current directory which can
be stored on the LVTGO-VBS.
The right-hand list-box is the Target Data list-box
It shows the resampled waveforms successfully read from the LVTGO-VBS after clicking on
the [Connect and Sync] button, or subsequently with the [Load] button.
27.7 [Transfer]: Activity Log Controls
Activity Log text-box

User manual LVTest VISUALCONNX Application Version 6.5.0 - bernard
Copyright add2 bernard Page 144 of 157 J001518 V6.5.0 LVTest VISUALCONNX Application.doc
Normally, this records information about operations performed in this form.
The activity log cannot be edited, but text in it can be selected and copied into the Clipboard
to be pasted elsewhere.
The [Clear Log] button erases the existing contents of the Activity Log.
Verbose Logging
The Verbose Logging tick-box controls the amount of information given in the Activity Log.
This control is normally off (unticked), and only errors (on their first detection) and summary
information are reported in the log. If the box is ticked, then errors are tracked in much more
detail. The additional information is normally only of use to add2 staff in understanding a
failure.
27.8 [Transfer]: Action Buttons
The [Connect and Sync] button reads all the waveforms currently held on an attached
LVTGO-VBS unit and, if not present in the currently-selected waveform folder, it imports
them and saves them. As only the sampled data is available, it is not possible to re-sample
from it, but it can be displayed like any other sampled waveform. Some information about
the source of the data is lost (e.g., the original imported file-name). However, the GUID and
Description are stored with the waveform, and can be used to identify the original imported
data, if it is present in another folder.
If the waveform contents are not recognised (possibly because they were created with a more
recent version of the application), then the resulting waveform entry will be blank.
The waveform entry is not empty, but it may be re-used if a waveform is added to the unit. It
may also cause the amount of storage currently used on the LVTGO-VBS to be larger than
expected given the visible waveforms.
This button is normally enabled except when an operation is already in progress. If it is
drawn in grey, it is temporarily disabled.

User manual LVTest VISUALCONNX Application Version 6.5.0 - bernard
Copyright add2 bernard Page 145 of 157 J001518 V6.5.0 LVTest VISUALCONNX Application.doc
The [>> Store >>] button stores the current host selection to the current target selection on
the LVTGO-VBS unit. If the target selection includes waveforms currently stored on the
target, the operation will not proceed.
If the current target selection contains fewer indexed waveforms on the target than sampled
waveforms in the host selection, unused waveform indices with higher numbers on the target
will be selected for you. If the target selection is empty, the search for unused waveform
indices starts with index 1. If there are not enough unused waveform indices, or the host
selection is too large to fit on the free space on the target, then no waveforms will be stored
on the LVTGO-VBS unit.
At present, waveforms maybe over-written on the target unit because they were not
successfully imported from the LVTGO-VBS unit to the host, perhaps because of a
communication failure, and perhaps because they are in a later format than the LVT
Application can handle. This will be made safer in a future release.
This button is only enabled when there is a current host selection in the left-hand Host Data
list-box, the [Connect and Sync] button has been clicked,, and no other operation is already in
progress. If it is drawn in grey, it is temporarily disabled.
Firmware older than V4.0.0 will store waveforms with output voltage ranges other than 0V –
20V, but will not be able to play them. Firmware at least as recent as V4.0.0 will also accept
waveforms with maximum output voltages above 20V, even if in fact they will have to
saturate the output at 20V.
The [Delete All >>] button can be used to clear all waveforms stored on an attached LVTGO-
VBS unit (if its firmware is sufficiently recent) without having to load any of them to the
application first. In particular, it will delete all waveforms whether or not they are corrupt or
use an unrecognised format. This operation is especially useful before using the [Select by
File...] button to specify a set of waveforms to be sent to the attached LVTGO-VBS unit.
Most operations involving the target will still require you to click on the [Connect and Sync]
button, partly to confirm that the waveforms have indeed been deleted from the target, and
partly to confirm that communication is proceeding normally. However, this synchronisation
operation is quick if there are no waveforms on the attached unit.
This button is normally enabled except when an operation is already in progress. If it is
drawn in grey, it is temporarily disabled.
The [<< Delete] button deletes the current host selection of sampled waveforms from the
waveform files containing them.
This button is normally enabled if there is a host selection in the left-hand Host Data list-box,
unless an operation is already in progress.
The [Delete >>] button deletes the current target selection of sampled waveforms from the
LVTGO-VBS unit. Waveforms not read successfully from the LVTGO-VBS may be deleted
using this button. This does mean that deleting an apparently missing waveform may silently
delete information from the LVTGO-VBS.

User manual LVTest VISUALCONNX Application Version 6.5.0 - bernard
Copyright add2 bernard Page 146 of 157 J001518 V6.5.0 LVTest VISUALCONNX Application.doc
This cannot be used (the Target Data list-box will be empty) if the [Connect and Sync] button
button has not previously been clicked. In this, it is unlike the [Delete All Target] button
previously mentioned.
This button is normally enabled if there is a current target selection in the right-hand Target
Data list-box, unless an operation is already in progress.
This button is only enabled if there has been a [Connect and Sync] operation performed for
the currently-selected waveform folder, there is a target selection in the right-hand Target
Data list-box, and no other operation is already in progress.
The [<<Load<<] button fetches the current target selection in the right-hand Target Data list-
box. It is in effect a selective version of [Connect and Sync]. It does require the [Connect
and Sync] button to have been clicked first. That should fetch all the waveforms from the
target, but if the operation reports errors it makes it possible to re-try with waveforms that
failed.
Waveforms which are corrupt, not recognised, or not successfully read from the LVTGO-
VBS unit are not shown in the list, but will still occupy storage on the unit.
Waveforms can be read from units even if they are unable to play them (e.g., waveforms with
VBatt ranges other than 0V – 20V, on units with firmware older than V4.0.0). Similarly,
even if a 20V unit is unable to drive the requested voltages above 20V, the waveform data on
the unit is still intact and can be fetched. However, versions of the GUI older than V5.0.0
will treat all waveforms with ranges other than 0V – 20V as corrupt, and not display them.
The [Select by File...] button loads a list file, with extension TSL, and uses it to specify the
current host selection in the left-hand Host Data list-box. Any items in the list which cannot
be matched in the current waveform folder will generate a warning. This normally means that
they have been deleted since the list was saved. The file can only be loaded from the current
waveform folder.
The normal sequence for cleanly installing completely new waveforms on the target is
[Delete All Target] button
[Connect and Sync] button
[Select by File...] button
[>> Store >>] button
See the description of the [Save as File...] button on the Captured Resample form.
This button is normally enabled if no other operation is already in progress.
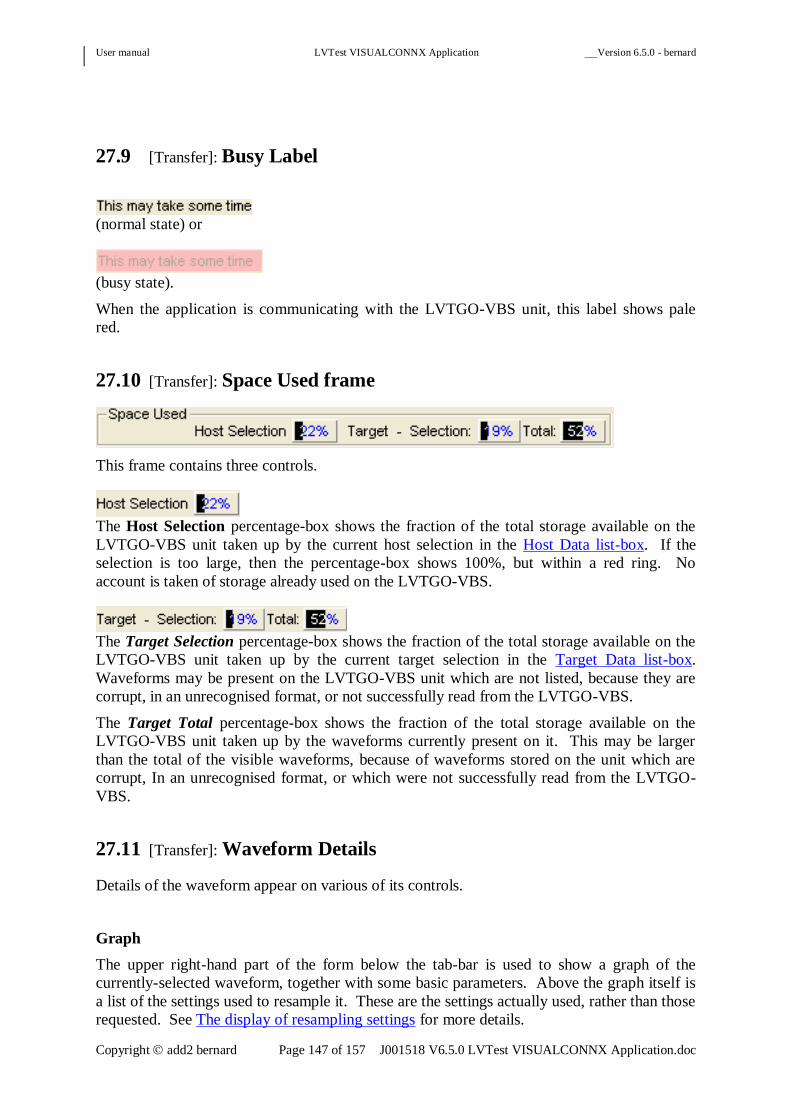
User manual LVTest VISUALCONNX Application Version 6.5.0 - bernard
Copyright add2 bernard Page 147 of 157 J001518 V6.5.0 LVTest VISUALCONNX Application.doc
27.9 [Transfer]: Busy Label
(normal state) or
(busy state).
When the application is communicating with the LVTGO-VBS unit, this label shows pale
red.
27.10 [Transfer]: Space Used frame
This frame contains three controls.
The Host Selection percentage-box shows the fraction of the total storage available on the
LVTGO-VBS unit taken up by the current host selection in the Host Data list-box. If the
selection is too large, then the percentage-box shows 100%, but within a red ring. No
account is taken of storage already used on the LVTGO-VBS.
The Target Selection percentage-box shows the fraction of the total storage available on the
LVTGO-VBS unit taken up by the current target selection in the Target Data list-box.
Waveforms may be present on the LVTGO-VBS unit which are not listed, because they are
corrupt, in an unrecognised format, or not successfully read from the LVTGO-VBS.
The Target Total percentage-box shows the fraction of the total storage available on the
LVTGO-VBS unit taken up by the waveforms currently present on it. This may be larger
than the total of the visible waveforms, because of waveforms stored on the unit which are
corrupt, In an unrecognised format, or which were not successfully read from the LVTGO-
VBS.
27.11 [Transfer]: Waveform Details
Details of the waveform appear on various of its controls.
Graph
The upper right-hand part of the form below the tab-bar is used to show a graph of the
currently-selected waveform, together with some basic parameters. Above the graph itself is
a list of the settings used to resample it. These are the settings actually used, rather than those
requested. See The display of resampling settings for more details.

User manual LVTest VISUALCONNX Application Version 6.5.0 - bernard
Copyright add2 bernard Page 148 of 157 J001518 V6.5.0 LVTest VISUALCONNX Application.doc
When there is a currently-selected waveform, it is displayed here, together with information
about its voltage range and its time-range, and the currently-used resampling options. A copy
of the Description text for the waveform appears below the graph as a title.
The Waveform Data frame contains two controls, showing information for the currently-
selected waveform.
The GUID display shows a guaranteed persistent identifier for the currently-selected
waveform. It is assigned when a waveform is imported, and cannot be changed subsequently.
See the GUID display on the Captured Import form for more information.
Description
The Description display shows the descriptive text associated with the currently-selected
waveform in this form, or is empty if no waveform is selected. It cannot be edited here (it
may be on the target, where it cannot be modified). However, a local copy may be edited
using the Description text-box on the Captured Resample form. The description is of the
waveform, and is common to the raw data and to all the sampled versions of the waveform.
See the account of the Description text-box on the Captured Import form for more details.

User manual LVTest VISUALCONNX Application Version 6.5.0 - bernard
Copyright add2 bernard Page 149 of 157 J001518 V6.5.0 LVTest VISUALCONNX Application.doc
27.12 [Transfer]: Help frame
The Help frame contains a very short help message.
27.13 [Transfer]: Progress Bar
The Progress bar shows the application working through multiple waveforms when
Storing sampled waveforms on the target
Connecting and Syncing
Deleting selected sampled waveforms from the host
Deleting all waveforms from the target
Deleting selected waveforms from the target
Loading waveforms from the target

User manual LVTest VISUALCONNX Application Version 6.5.0 - bernard
Copyright add2 bernard Page 150 of 157 J001518 V6.5.0 LVTest VISUALCONNX Application.doc
28 Replaying problematic waveform cycles
It is common for the unit to be used to repeat a specified waveform with randomised
parameters over a large number of cycles. If one of the test cycles appears to cause problems
in a device under test, it is convenient to be able to reproduce the cycle without having to
play through the sequence from the beginning. There are three options.
Firstly, if the problem is detected before the waveform cycle is complete, it can be re-started
from the beginning of the current cycle by using the [Stop] and [Play] buttons on the
Waveform Main form.
Secondly, the problematic cycle number can be noted on the Current Cycle display on the
Waveform Main form. The instructions here show how to set up the waveform to re-start
from the required cycle. The [Reset] and [Play] buttons on the Waveform Main form can
then be used to resume. It is often best to resume before the cycle during which problems
were observed, in case the previous test cycle contributed to the problem.
Thirdly, the parameter value actually calculated and used by the LVT for each cycle are
streamed to the application, which can log them (or the user can log the CAN traffic directly).
Testing can then resume with values in narrow bands around the values actually used when
the problem was noted.
User manual LVTest VISUALCONNX Application Version 6.5.0 - bernard
Copyright add2 bernard Page 151 of 157 J001518 V6.5.0 LVTest VISUALCONNX Application.doc
29 Test standards
Many standard tests can be met using either captured waveforms or suitably parametrised
generated waveforms. It is add2 policy to extend its coverage of these, in the form of
captured waveforms and profiles supplied with the LVT Application. The profiles are
distributed through the relevant parts of the profile tree, mostly in their own subdirectories.
Please let us know of any other standards you would like us to meet.
Although the Captured Waveform mechanism can be used for nearly any single waveform, it
does not support randomisation. Additionally, it is hard to specify a degree of quantisation
accuracy in voltage or in time which is good enough for all purposes without making the
resulting data very bulky – perhaps actually too large to be stored on the LVTGO-VBS unit at
all.
The tests specified for CI260 and Section 9.2.16 of the GM test specification GMW 3172 are
met with captured waveforms. They have their own sub-directories in the <Project
Directory>\Sample Sources and <Project directory>\Sample Waveforms directories. Care
has been taken to keep the resulting sampled waveforms as small as possible, while
minimising quantisation errors.
The randomised “rusty file” tests (“Waveform A”) required for CI 265 exist in two copies, as
the test specification was revised at the beginning of 2011, although this family of tests was
not affected. Each copy is in its own dated sub-directory within <Project
directory>\Profiles\Extremely Fast Transient Burst Noise\ . The only difference between the
different profiles in each set is the maximum allowed time between voltage transitions.
The older-dated directory contains another family of profiles, provided for backward
compatibility with previous releases. The only difference is that the high and low voltages
were accidentally transposed. They are in
<Project directory>\Profiles\Extremely Fast Transient Burst Noise\CI265-
2009.05.18\OldErroneousWaveformA\
Most of the profiles provided for Micro-Cutouts are in the CI260 sub-directory.
The profile for the Ramp Test (“Waveform C”) for CI265 is found in two dated sub-
directories for historic reasons, but this test was not affected.
Several different test specifications specify versions of Random Cranking waveforms. In
particular, the very coarsely sampled Random Cranking waveforms of section 9.2.17 of GM
standard GMW3172 are actually realised as synthetic Captured Waveforms.
Additional standards supported:
“Waveform B” of CI265 was originally specified with some parameters missing and some
misprints, so the changes between the two dated versions are important. In addition, the later
specification from the beginning of 2011 is matched with a profile specifically for generating
waveforms B, C and D simultaneously, using relays driven from specially-configured trigger
outputs to derive the B and C outputs from (the usual) output D.
Broadly similar in conception to the CI265 BCD outputs, but very different in detail, the
cranking profile outputs for Ford’s CI 230 test drive outputs A, B, C and D simultaneously on
suitably capable LVT hardware.
Section 9.2.3 of the GM specification GMW3172 is a sharply simplified Random Cranking
waveform, but it can still be met by flattening the sinusoid to zero amplitude.
User manual LVTest VISUALCONNX Application Version 6.5.0 - bernard
Copyright add2 bernard Page 152 of 157 J001518 V6.5.0 LVTest VISUALCONNX Application.doc
Section 2.4 of the ISO standard ISO-7637 (with variants for 12V and 24V battery supplies) is
also supported.
CI 265 is fully supported: coverage of CI 260 is not complete, and at present is divided
between Micro-Cutouts and Captured Waveforms.
29.1 CI 230 – some special observations
The test specification leaves several aspects of the waveform undefined. The CI230_ABCD
profile follows the Ford specification, with the following additional features.
The T0 step before the start of the first cycle, and the T9 step in between cycles, are used to
hold the D waveform output at U3 (12.5V) for three seconds. In addition, the A output
produces its first pulse starting 500ms after the start of time-step T1. The second pulse on the
A output ends at the end of the T8 step, when the voltage on the D output falls from U4 to U3,
and the B output is switched off. The length of the T8 step allows the A, B and D output
voltages to remain high together for 500ms after the start of the second A pulse.
Users are free to modify the Voltage and Time parameters, but it is recommended that U0
(during T0) and U7 (during T9) should continue to be equal to U3. The lead-in time with the D
output held at U3, but the other inputs off, can be modified by changing T0 and T9, down to
the minimum lead-in of 500ms built into T1. The lead-out time with outputs A, B and D all
held at U4 can be adjusted by changing the length of T8, after which output D continues at U3
but the other outputs are zero.
The time-offsets specified for the test, starting with the initial A pulse and ending with the
start of the final A pulse, cannot at present be modified, irrespective of the length of T1 and
T8. If A is still high at the beginning of T2 it is switched off immediately, and similarly B and
C will be switched on immediately if this has not already happened. A, B and C will all be
switched off at the beginning of T9. T8 must be at least long enough to start (and detect!) the
final pulse on output A, which begins 325ms into the T8 time-step.

User manual LVTest VISUALCONNX Application Version 6.5.0 - bernard
Copyright add2 bernard Page 153 of 157 J001518 V6.5.0 LVTest VISUALCONNX Application.doc
30 Scripting using the COM interface
VISUALCONNX supports external control through a scripting interface over COM. This
makes it possible to run pre-programmed sequences of tests automatically (Test Automation).
The LVTest Application exposes a great deal of its control interface through specially-written
interface functions which can be called in this way. This interface is working towards
completeness in terms of control settings and in supporting polling for data sent from the
LVTGO-VBS unit. There is no mechanism for streaming data over the COM interface.
The application installation includes an LVTCom directory. There is a substantially
complete example in Visual Basic in the form of the VB Test Harness. There is a
WindowsTM
Help file installed in Forms\Help\LVTCom.chm, This gives an overview of a
typical scripting sequence, and detailed interface specifications for the COM interface
functions.
There is also a Python interface class, with a very simple example script. Calls which use
their arguments to return values from the COM interface are called differently from Python
and Visual Basic. The extra arguments are still supplied to the low-level interface, but the
interface class supplies them, so the user need not. However, all the values returned are
returned as a single list to the caller. The example script gives details for the few calls
affected.
The public COM interface for the LVTest Application is described in the Windows™ help
file LVTCOM.chm. A link to it is installed in the Start Menu alongside the link to the
LVTest Application itself (usually in the group Programs|add2).
30.1 [Scripting]: COM scripting and input triggers
The functions and procedures of the COM interface are documented in the Windows Help
file LVTCOM.chm.
Input Triggers other than the Configuration Trigger can be configured over COM just as
when using the controls on the Trigger Configuration form. For backward-compatibility
reasons, the numerical arguments to the COM configuration functions are not obvious from
the corresponding controls on the GUI.
Whenever the COM interface is used to load a profile (this includes the automatic loading of
the last-used profile for a given waveform type when that waveform type is selected), the
input trigger settings in the profile are then modified by the current trigger configuration set
up by the COM interface. This can be used, of course, to over-ride the input trigger settings
in the profile. However, it is possible to configure the COM settings so that the input trigger
type, the input trigger mode, or both, are left unchanged from the settings in the profile.
Now that a Configuration Trigger can be configured independently of the other input triggers,
there is normally no reason to over-ride the settings in the profile. To leave the profile
settings unmodified, call
SetInputTriggerType(1, 0, nRetCode)
early (before loading the profile you want to use). It only has to be called once.

User manual LVTest VISUALCONNX Application Version 6.5.0 - bernard
Copyright add2 bernard Page 154 of 157 J001518 V6.5.0 LVTest VISUALCONNX Application.doc
30.1.1 [Scripting]: Using an Analogue Input Trigger from COM
The trigger modes for analogue input triggers are numbered from 0 to 3 corresponding to the
items in the Input Analogue Trigger Mode option-group in order. There is no change here.
In existing COM scripts, all that is necessary is to replace
SetInputTriggerSource(3)
SetInputTriggerMode(n2)
With
SetInputTriggerType(3, n2, nRetCode)
There has been no change in the modes available for an analogue input trigger.
30.1.2 [Scripting]: Using a User-Configured CAN Trigger from COM
The configuration of input CAN triggers is now entirely different from the old mechanism,
which emulated an analogue trigger, rather wastefully and confusingly. The main reason for
replacing the old calls SetInputTriggerSource() and SetInputTriggerMode() with the single
call SetInputTriggerType() was to ensure that old CAN triggers were not re-used accidentally
with very different effects.
The correspondence between the mode numbers and the positions of the corresponding
entries in the Input CAN Trigger Mode option-group is not obvious.
SetInputTriggerType(4, 1, nRetCode)
specified a Bit High trigger.
SetInputTriggerType(4, 2, nRetCode)
specifies a Bit Low trigger.
Other values for the second argument are errors: no configuration will be attempted, and
nRetCode will be set to a non-zero value on exit.
There is no exact equivalent to the old User-Configured CAN edge-trigger modes. They all
required two CAN messages to be sent with a gap of at least a millisecond between them.
Now, a trigger is a single message, with the configured bit set high or low as required, and
revoking a previously sent trigger (if it is ever required at all) is a similar message with the bit
state inverted. There is no equivalent at all to the old level-sensitive triggers, which could be
used in effect to switch between free running and stopping the waveform entirely at the end
of the current cycle. However, an almost exact equivalent is to switch between free running
and the use of an input trigger which is not actually available.
Ramp Up and Down waveforms use the Configuration Trigger internally, and this cannot be
disabled using the COM interface. Attempting to re-configure a Ramp Up and Down
waveform from the COM interface while it is running is not supported. In any case, it is
easier to re-configure a ramp waveform cycle-by-cycle using the Alternative Ramp
waveform.

User manual LVTest VISUALCONNX Application Version 6.5.0 - bernard
Copyright add2 bernard Page 155 of 157 J001518 V6.5.0 LVTest VISUALCONNX Application.doc
30.1.3 [Scripting]: Using a Configuration Trigger from COM
EnableConfigTrigger(True) will cause the LVTGO-VBS to wait at the start of a cycle for a
Configuration Trigger, if it has not already received one. A Configuration Trigger can be
sent (if enabled) with SendConfigTrigger(True), and an as-yet unconsumed trigger already
sent can be revoked with SendConfigTrigger(False).
30.1.4 [Scripting]: Changes to the COM input trigger interface
A new interface for configuring input triggers was introduced with V4.0.0 of the LVTest
Application. The most pervasive change is that the old configuration calls
SetInputTriggerSource()
and
SetInputTriggerMode()
have been replaced with a single call
SetInputTriggerType()
The old effect of calling
SetInputTriggerSource(0)
or never calling
SetInputTriggerSource()
at all, has been deprecated for some time, and 0 is not now allowed as the first argument to SetInputTriggerType ()
the call will not change the configuration, and will return with an error code.
Similarly,
SetInputTriggerSource(3)
to use the old Default CAN trigger is now an error. To use the new Configuration CAN
trigger, the
EnableConfigTrigger()
call must be used instead.
The Mode options for User-Configured CAN Input Triggers have changed entirely.
The previously recommended way to use the input trigger settings as specified in the profile
was to call
SetInputTriggerSource(1)
SetInputTriggerMode(0),
This is now done with the combined call
SetInputTriggerType(1, 0, nRetCode)
If a profile loaded over COM did configure the use of an input trigger (other than Default
CAN), and the COM interface was used to over-ride it with the use of a Default CAN trigger,

User manual LVTest VISUALCONNX Application Version 6.5.0 - bernard
Copyright add2 bernard Page 156 of 157 J001518 V6.5.0 LVTest VISUALCONNX Application.doc
then the closest approach possible to the old behaviour using the COM interface is to enable
the Configuration Trigger with
EnableConfigTrigger(True)
and to over-ride the existing profile trigger by calling
SetInputTriggerType(2, 0, nRetCode)
to force free running. In fact, if the profile specified a trigger, it is probably most useful not
to over-ride it, and to enable the use of the Configuration Trigger separately if wanted.
30.1.5 [Scripting]: Converting old COM scripts using Default CAN triggers
It is possible that some customers have been using COM scripting to force the use of the old
Default CAN trigger in place of whatever input trigger was specified in the profile. The
closest approximation to this that is now possible is to call
EnableConfigTrigger(True)
to use the Configuration Trigger,
SetInputTriggerType(2, 1, nRetCode)
to force free-running. This may happen at any time before playing a waveform, since it
completely replaces the existing trigger configuration, and will continue to do so whenever a
profile is loaded subsequently.
Actually sending a Default CAN trigger was probably only ever done using the old call
SendTrigger().
This can be replaced with the new call
SendConfigTrigger(True)
30.1.6 [Scripting]: Voltages over 20V in configuring 20V LVTGO-VBS units
If a profile sets any voltage parameter U0 – U7 to be greater than 20V, and the attached
LVTGO-VBS unit is limited to 20V output, then attempting to set the parameter using the
COM interface will fail. This is because automated running does not normally allow the user
the visible feedback on the Voltage Settings form. Note that this includes even “unused”
parameters, such as the maximum voltage parameter when setting a constant voltage. Again,
this is useful for the COM interface, where all the parameter values must be set explicitly, but
less so for the GUI where unused parameters are not visible to the user.
In the unlikely event that the user really wishes to play the specified waveform on a 20V unit
(with the output voltage saturating at 20V), add2 can support removing this restriction.

User manual LVTest VISUALCONNX Application Version 6.5.0 - bernard
Copyright add2 bernard Page 157 of 157 J001518 V6.5.0 LVTest VISUALCONNX Application.doc
31 Recommended settings for running the application
The following VISUALCONNX settings are recommended to get the best from the
application..
Application | Use form Navigation Tabs
Application | Hide designer tools during 'Run' mode
Run Time | Freeze of timer when Form not Active : Never
Run Time | Freeze of timer when Form not Visible: True
Window | Fit VISUALCONNX Forms to Project Window (normally ticked)
The effect of the last setting is to keep the forms occupying the same region of the screen.
Strictly, the Project Manager window, which is normally minimised, is used as the model for
the position and size of the other forms. If it is important to see more than one form at once,
or you have a use for re-sizing them, un-tick Fit VISUALCONNX Forms to Project
Window.
The controls on the application's forms may become partly invisible if the form is re-sized.
There is normally no need (and no point) in changing the size of the Project Manager
Window itself. However, you can do this with
Window | Project Manager
to bring up the Project Manager window. The title-bar of the window contains a tick-box
Allow Resizing of Project, which can be ticked.
Other settings should left to their default value.
To access these settings select VISUALCONNX's File | Preferences or click on the Settings
toolbar button.


![Writing a Resource Manager [6.5.0 SP1]](https://static.fdocuments.us/doc/165x107/55329f224a7959ae4b8b46a8/writing-a-resource-manager-650-sp1.jpg)


