LVMH 2016 Financial document - r.lvmh-static.com review and comments on the consolidated financial...
68
TRANSLATION OF THE FRENCH FINANCIAL DOCUMENTS FISCAL YEAR ENDED DECEMBER 31, 2016
Transcript of LVMH 2016 Financial document - r.lvmh-static.com review and comments on the consolidated financial...
TRANSLATION OF THE FRENCHFINANCIAL DOCUMENTS
FISCAL YEAR ENDED DECEMBER 31, 2016
BUSINESS REVIEW AND COMMENTS ON THE CONSOLIDATED FINANCIAL STATEMENTS OF LVMH GROUP 5
COMMENTS ON THE CONSOLIDATED INCOME STATEMENT 6WINES AND SPIRITS 10FASHION AND LEATHER GOODS 11PERFUMES AND COSMETICS 12WATCHES AND JEWELRY 14SELECTIVE RETAILING 15COMMENTS ON THE CONSOLIDATED BALANCE SHEET 16COMMENTS ON THE CONSOLIDATED CASH FLOW STATEMENT 18
CONDENSED CONSOLIDATED FINANCIAL STATEMENTS 19
CONSOLIDATED INCOME STATEMENT 20CONSOLIDATED STATEMENT OF COMPREHENSIVE GAINS AND LOSSES 21CONSOLIDATED BALANCE SHEET 22CONSOLIDATED STATEMENT OF CHANGES IN EQUITY 23CONSOLIDATED CASH FLOW STATEMENT 24SELECTED NOTES TO THE CONSOLIDATED FINANCIAL STATEMENTS 25
CONTENTS
EXECUTIVE AND SUPERVISORY BODIES; STATUTORY AUDITORS AS OF DECEMBER 31, 2016 1FINANCIAL HIGHLIGHTS 2HIGHLIGHTS AND OUTLOOK 4SHARE CAPITAL AND VOTING RIGHTS 4
This document is a free translation into English of the original French “Documents financiers – 31 décembre 2016”, hereafterreferred to as the “Financial Documents”. It is not a binding document. In the event of a conflict in interpretation, referenceshould be made to the French version, which is the authentic text.
(a) Independent Director.
1Financial Documents - December 31, 2016
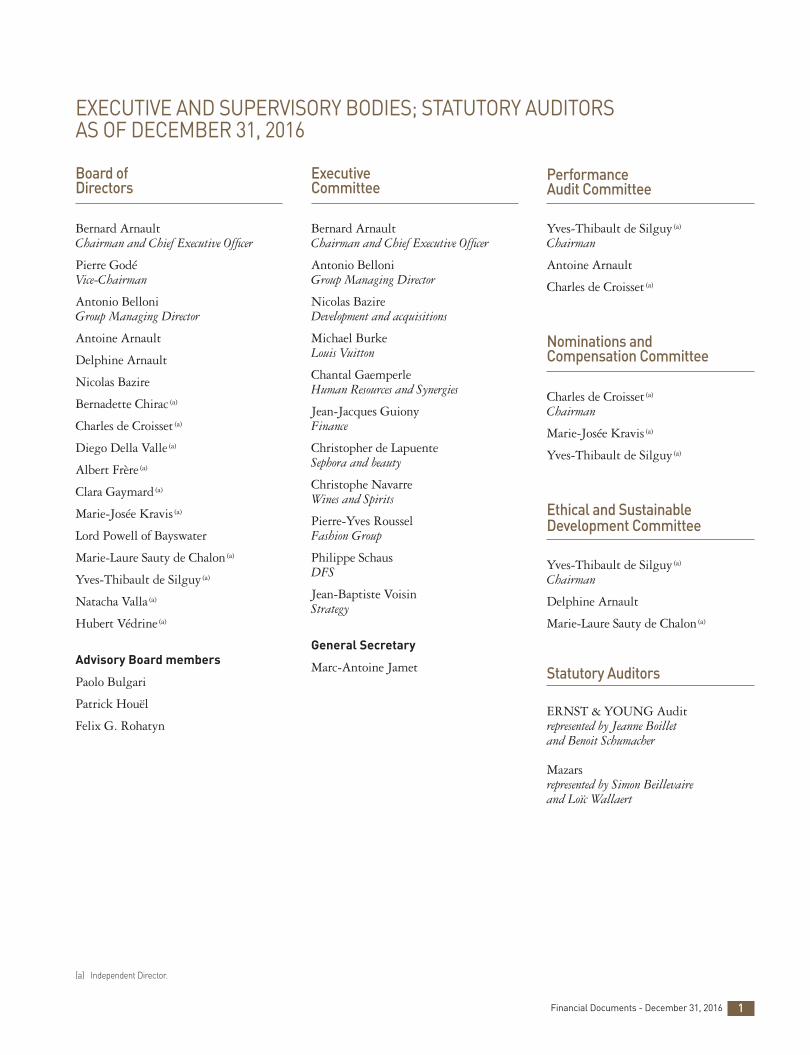
Board of Directors
Bernard ArnaultChairman and Chief Executive Officer
Pierre Godé Vice-Chairman
Antonio Belloni Group Managing Director
Antoine Arnault
Delphine Arnault
Nicolas Bazire
Bernadette Chirac (a)
Charles de Croisset (a)
Diego Della Valle (a)
Albert Frère (a)
Clara Gaymard (a)
Marie-Josée Kravis (a)
Lord Powell of Bayswater
Marie-Laure Sauty de Chalon (a)
Yves-Thibault de Silguy (a)
Natacha Valla (a)
Hubert Védrine (a)
Advisory Board members
Paolo Bulgari
Patrick Houël
Felix G. Rohatyn
Executive Committee
Bernard ArnaultChairman and Chief Executive Officer
Antonio BelloniGroup Managing Director
Nicolas BazireDevelopment and acquisitions
Michael BurkeLouis Vuitton
Chantal GaemperleHuman Resources and Synergies
Jean-Jacques GuionyFinance
Christopher de LapuenteSephora and beauty
Christophe NavarreWines and Spirits
Pierre-Yves RousselFashion Group
Philippe SchausDFS
Jean-Baptiste VoisinStrategy
General Secretary
Marc-Antoine Jamet
Performance Audit Committee
Yves-Thibault de Silguy (a)
Chairman
Antoine Arnault
Charles de Croisset (a)
Nominations and Compensation Committee
Charles de Croisset (a)
Chairman
Marie-Josée Kravis (a)
Yves-Thibault de Silguy (a)
Ethical and Sustainable Development Committee
Yves-Thibault de Silguy (a)
Chairman
Delphine Arnault
Marie-Laure Sauty de Chalon (a)
Statutory Auditors
ERNST & YOUNG Auditrepresented by Jeanne Boillet and Benoit Schumacher
Mazarsrepresented by Simon Beillevaire and Loïc Wallaert
EXECUTIVE AND SUPERVISORY BODIES; STATUTORY AUDITORS AS OF DECEMBER 31, 2016
FINANCIAL HIGHLIGHTS
2 Financial Documents - December 31, 2016
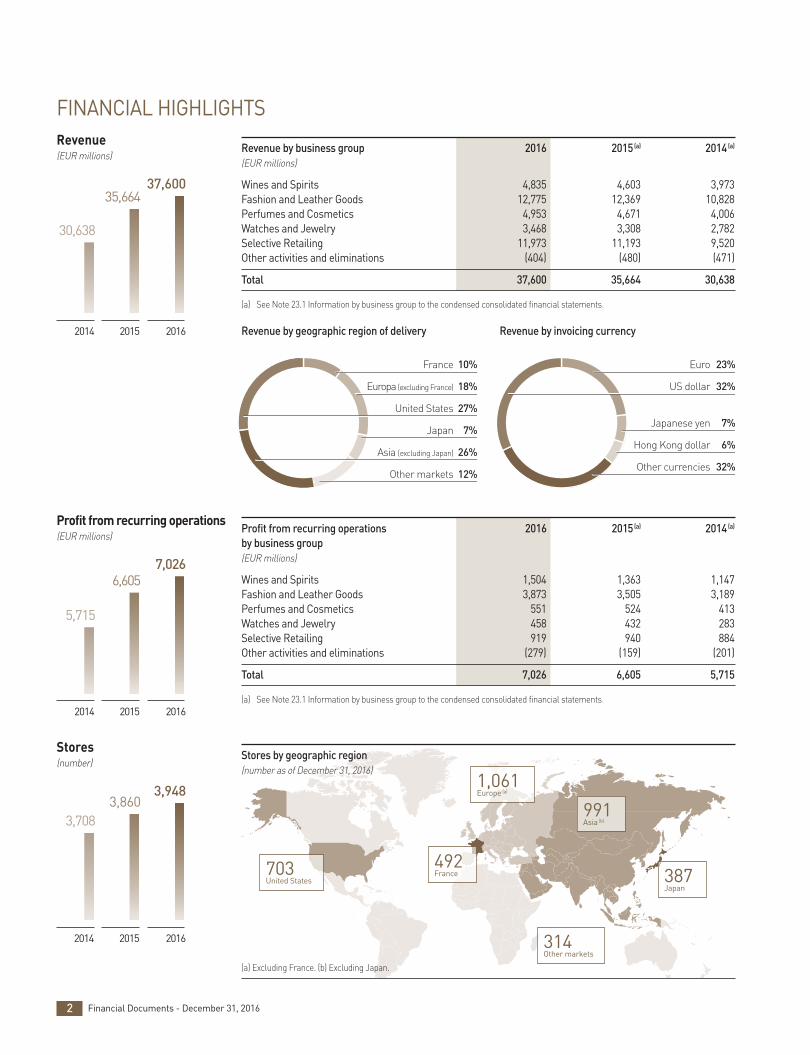
Revenue(EUR millions)
Revenue by business group 2016 2015(a) 2014(a)
(EUR millions)
Wines and Spirits 4,835 4,603 3,973Fashion and Leather Goods 12,775 12,369 10,828Perfumes and Cosmetics 4,953 4,671 4,006Watches and Jewelry 3,468 3,308 2,782Selective Retailing 11,973 11,193 9,520Other activities and eliminations (404) (480) (471)
Total 37,600 35,664 30,638
(a) See Note 23.1 Information by business group to the condensed consolidated financial statements.
Revenue by geographic region of delivery
12%Other markets
18%Europa (excluding France)
27%United States
Asia (excluding Japan) 26%
Japan 7%
France 10%
Revenue by invoicing currency
30,638
35,66437,600
2014 2015 2016
Profit from recurring operations(EUR millions)
Stores(number)
Stores by geographic region(number as of December 31, 2016)
2014
3,708
2015
3,860
2016
3,948
703United States
492France
1,061Europe (a)
314Other markets
(a) Excluding France. (b) Excluding Japan.
991Asia (b)
387Japan
23%Euro
32%US dollar
Japanese yen 7%
Other currencies 32%
Hong Kong dollar 6%
Profit from recurring operations 2016 2015(a) 2014(a)
by business group (EUR millions)
Wines and Spirits 1,504 1,363 1,147Fashion and Leather Goods 3,873 3,505 3,189Perfumes and Cosmetics 551 524 413Watches and Jewelry 458 432 283Selective Retailing 919 940 884Other activities and eliminations (279) (159) (201)
Total 7,026 6,605 5,715
(a) See Note 23.1 Information by business group to the condensed consolidated financial statements.
5,715
6,6057,026
2014 2015 2016
3Financial Documents - December 31, 2016
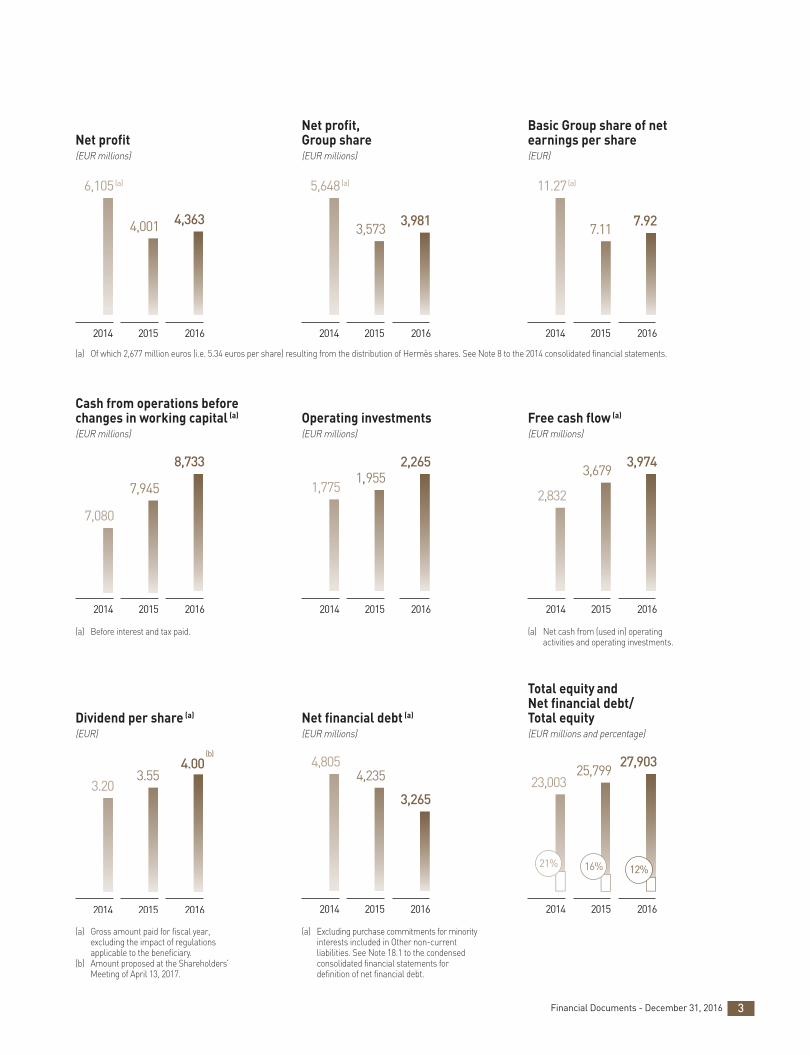
Net profit(EUR millions)
4,363
2014 2015 2016
6,105 (a)
4,001
Net profit,Group share(EUR millions)
2014 2015 2016
5,648 (a)
3,9813,573
2014 2015 2016
11.27 (a)
7.117.92
2014 2015 2016
3.203.55
4.00 (b)
3,265
4,8054,235
2014 2015 2016
27,90323,003
25,799
16% 12%21%
2014 2015 2016
7,080
7,945
8,733
2014 2015 2016
Operating investments(EUR millions)
2,265
1,7751,955
2014 2015 2016
2,832
3,6793,974
2014 2015 2016
(a) Gross amount paid for fiscal year, excluding the impact of regulationsapplicable to the beneficiary.
(b) Amount proposed at the Shareholders’Meeting of April 13, 2017.
(a) Before interest and tax paid.
(a) Of which 2,677 million euros (i.e. 5.34 euros per share) resulting from the distribution of Hermès shares. See Note 8 to the 2014 consolidated financial statements.
(a) Excluding purchase commitments for minorityinterests included in Other non-currentliabilities. See Note 18.1 to the condensedconsolidated financial statements fordefinition of net financial debt.
Dividend per share (a)
(EUR)
Cash from operations beforechanges in working capital (a)
(EUR millions)
Net financial debt (a)
(EUR millions)
Total equity and Net financial debt/Total equity(EUR millions and percentage)
Free cash flow (a)
(EUR millions)
Basic Group share of netearnings per share(EUR)
(a) Net cash from (used in) operating activities and operating investments.
SHARE CAPITAL AND VOTING RIGHTS
Number Number of % of share % of voting of shares voting rights(a) capital rights
Arnault family group 237 036 289 461,347,582 46.74% 63.07%Other 270,089,799 270,113,490 53.26% 36.93%
Total 507,126,088 731,461,072 100.00% 100.00%
(a) Total number of voting rights that may be exercised at Shareholders’ Meetings.
Key highlights from 2016 include:
• record revenue and profit from recurring operations;
• growth in the United States, Europe and Asia;
• good performance of Wines and Spirits in all regions;
• the success of both iconic and new products at Louis Vuitton,where profitability remains at an exceptional level;
• progress at Fendi;
• the disposal of Donna Karan and the acquisition of Rimowa,leader in luggage of excellence;
• good momentum at Parfums Christian Dior driven by successfulproduct innovations;
• market share gains at Bvlgari and TAG Heuer;
• growth at Sephora which strengthened its position in all itsmarkets and in digital;
• free cash flow of 3,974 million euros, an increase of 8%;
• gearing of 12% at end of December 2016.
Despite a climate of geopolitical and currency uncertainties,LVMH is well-equipped to continue its growth momentumacross all business groups in 2017. The Group will maintain astrategy focused on developing its brands by continuing to buildon strong innovation and a constant quest for quality in theirproducts and their distribution.
Driven by the agility of its teams, their entrepreneurial spirit, thebalance of its different businesses and geographic diversity, LVMHenters 2017 with caution but has, once again, set an objectiveof increasing its global leadership position in luxury goods.
4 Financial Documents - December 31, 2016
HIGHLIGHTS AND OUTLOOK
5Financial Documents - December 31, 2016
BUSINESS REVIEW AND COMMENTS ON THE CONSOLIDATED FINANCIAL STATEMENTS OF LVMH GROUP
1. COMMENTS ON THE CONSOLIDATED INCOME STATEMENT 62. WINES AND SPIRITS 103. FASHION AND LEATHER GOODS 114. PERFUMES AND COSMETICS 125. WATCHES AND JEWELRY 146. SELECTIVE RETAILING 157. COMMENTS ON THE CONSOLIDATED BALANCE SHEET 168. COMMENTS ON THE CONSOLIDATED CASH FLOW STATEMENT 18
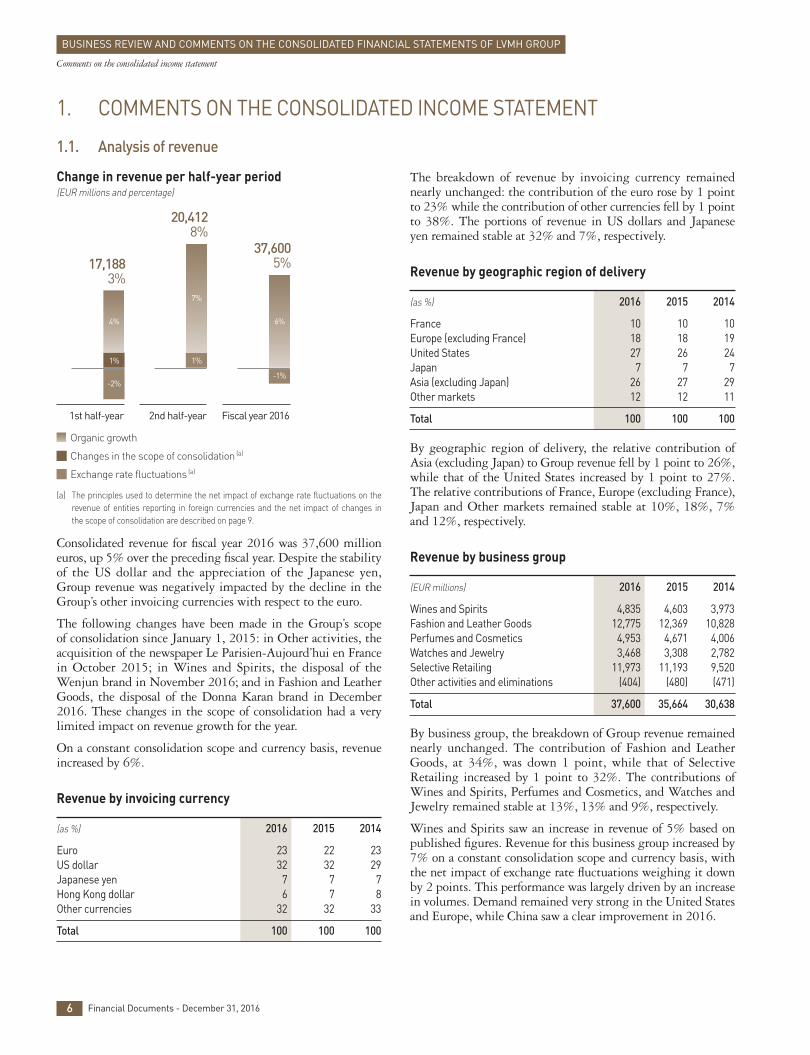
Change in revenue per half-year period(EUR millions and percentage)
(a) The principles used to determine the net impact of exchange rate fluctuations on therevenue of entities reporting in foreign currencies and the net impact of changes in the scope of consolidation are described on page 9.
Consolidated revenue for fiscal year 2016 was 37,600 millioneuros, up 5% over the preceding fiscal year. Despite the stabilityof the US dollar and the appreciation of the Japanese yen,Group revenue was negatively impacted by the decline in theGroup’s other invoicing currencies with respect to the euro.
The following changes have been made in the Group’s scope of consolidation since January 1, 2015: in Other activities, theacquisition of the newspaper Le Parisien-Aujourd’hui en Francein October 2015; in Wines and Spirits, the disposal of theWenjun brand in November 2016; and in Fashion and LeatherGoods, the disposal of the Donna Karan brand in December2016. These changes in the scope of consolidation had a verylimited impact on revenue growth for the year.
On a constant consolidation scope and currency basis, revenueincreased by 6%.
Revenue by invoicing currency
(as %) 2016 2015 2014
Euro 23 22 23US dollar 32 32 29Japanese yen 7 7 7Hong Kong dollar 6 7 8Other currencies 32 32 33
Total 100 100 100
The breakdown of revenue by invoicing currency remainednearly unchanged: the contribution of the euro rose by 1 pointto 23% while the contribution of other currencies fell by 1 pointto 38%. The portions of revenue in US dollars and Japaneseyen remained stable at 32% and 7%, respectively.
Revenue by geographic region of delivery
(as %) 2016 2015 2014
France 10 10 10Europe (excluding France) 18 18 19United States 27 26 24Japan 7 7 7Asia (excluding Japan) 26 27 29Other markets 12 12 11
Total 100 100 100
By geographic region of delivery, the relative contribution ofAsia (excluding Japan) to Group revenue fell by 1 point to 26%,while that of the United States increased by 1 point to 27%.The relative contributions of France, Europe (excluding France),Japan and Other markets remained stable at 10%, 18%, 7%and 12%, respectively.
Revenue by business group
(EUR millions) 2016 2015 2014
Wines and Spirits 4,835 4,603 3,973Fashion and Leather Goods 12,775 12,369 10,828Perfumes and Cosmetics 4,953 4,671 4,006Watches and Jewelry 3,468 3,308 2,782Selective Retailing 11,973 11,193 9,520Other activities and eliminations (404) (480) (471)
Total 37,600 35,664 30,638
By business group, the breakdown of Group revenue remainednearly unchanged. The contribution of Fashion and LeatherGoods, at 34%, was down 1 point, while that of SelectiveRetailing increased by 1 point to 32%. The contributions ofWines and Spirits, Perfumes and Cosmetics, and Watches andJewelry remained stable at 13%, 13% and 9%, respectively.
Wines and Spirits saw an increase in revenue of 5% based onpublished figures. Revenue for this business group increased by7% on a constant consolidation scope and currency basis, withthe net impact of exchange rate fluctuations weighing it downby 2 points. This performance was largely driven by an increasein volumes. Demand remained very strong in the United Statesand Europe, while China saw a clear improvement in 2016.
1. COMMENTS ON THE CONSOLIDATED INCOME STATEMENT
1.1. Analysis of revenue
6 Financial Documents - December 31, 2016
Comments on the consolidated income statement
BUSINESS REVIEW AND COMMENTS ON THE CONSOLIDATED FINANCIAL STATEMENTS OF LVMH GROUP
4%
7%
6%
1%
-2%
1%
-1%
17,1883%
20,4128%
37,6005%
Fiscal year 20162nd half-year1st half-year
Organic growth
Changes in the scope of consolidation (a)
Exchange rate fluctuations (a)
(EUR millions) 2016 2015 2014
Revenue 37,600 35,664 30,638Cost of sales (13,039) (12,553) (10,801)
Gross margin 24,561 23,111 19,837
Marketing and selling expenses (14,607) (13,830) (11,744)General and administrative expenses (2,931) (2,663) (2,373)Income (loss) from investments in joint ventures and associates 3 (13) (5)
Profit from recurring operations 7,026 6,605 5,715Operating margin (%) 18.7 18.5 18.7
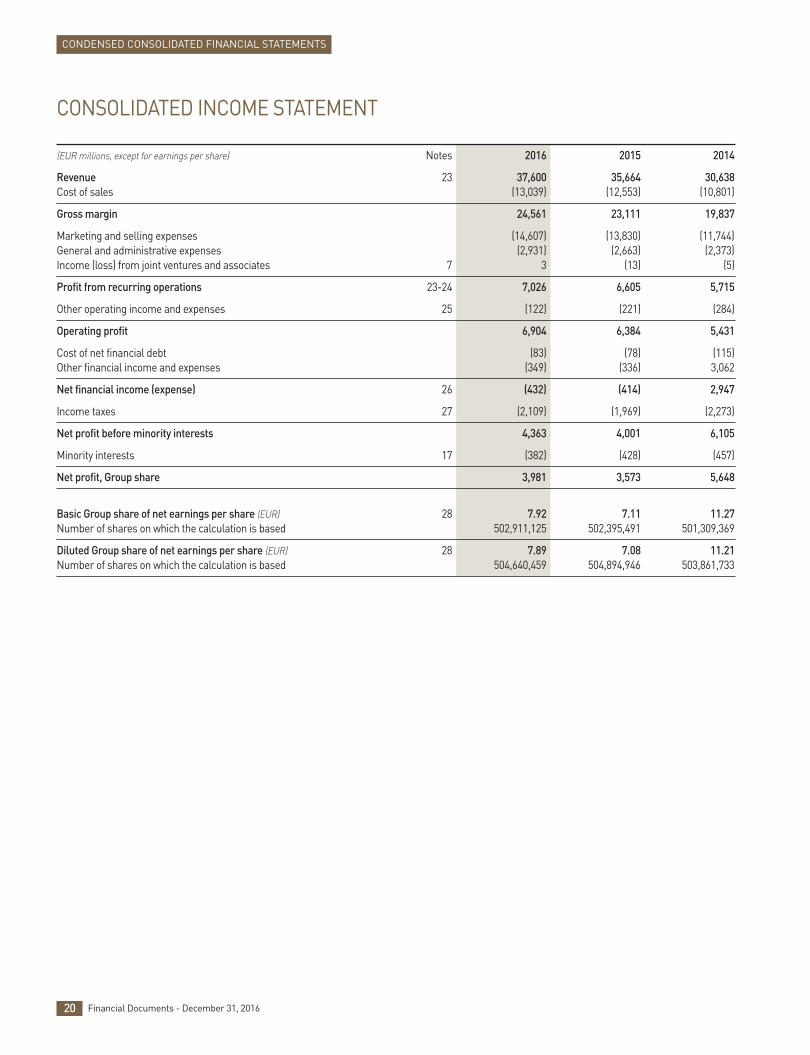
The Group achieved a gross margin of 24,561 million euros, up6% compared to the prior fiscal year. As a percentage of revenue,the gross margin was 65%, stable with regard to 2015.
Marketing and selling expenses totaled 14,607 million euros, up6% based on published figures and on a constant consolidationscope and currency basis. This increase was mainly due to thedevelopment of retail networks but also to higher communicationsinvestments, especially in Perfumes and Cosmetics. The levelof these expenses as a percentage of revenue remained stable at39%. Among these marketing and selling expenses, advertisingand promotion costs amounted to 11% of revenue, increasingby 6% on a constant consolidation scope and currency basis.
The geographic breakdown of stores is as follows:
(number) 2016 2015 (a) 2014
France 492 482 467Europe (excluding France) 1,061 1,012 995United States 703 732 708Japan 387 407 412Asia (excluding Japan) 991 951 870Other markets 314 276 256
Total 3,948 3,860 3,708
(a) Including 68 stores for Donna Karan.
General and administrative expenses totaled 2,931 millioneuros, up 10% based on published figures and up 9% on a constantconsolidation scope and currency basis. They amounted to 8%of revenue, up 1 point compared to 2015.
Profit from recurring operations by business group
(EUR millions) 2016 2015 2014
Wines and Spirits 1,504 1,363 1,147Fashion and Leather Goods 3,873 3,505 3,189Perfumes and Cosmetics 551 524 413Watches and Jewelry 458 432 283Selective Retailing 919 940 884Other activities and eliminations (279) (159) (201)
Total 7,026 6,605 5,715
The Group’s profit from recurring operations was 7,026 millioneuros, up 6%. The Group’s operating margin as a percentage ofrevenue was 18.7%, broadly stable with respect to December 31,2015.
1.2. Profit from recurring operations
Fashion and Leather Goods posted organic growth of 4%, and3% based on published figures. This business group’s performancewas driven by the very solid momentum achieved by LouisVuitton, as well as by Kenzo, Fendi, Loewe, Céline and Berluti,which confirmed their potential for strong growth.
Revenue for Perfumes and Cosmetics increased by 8% on aconstant consolidation scope and currency basis, and by 6% basedon published figures. This growth confirmed the effectivenessof the value-enhancing strategy resolutely pursued by the Group’sbrands in the face of competitive pressures. The Perfumes andCosmetics business group saw very appreciable revenue growthin the United States, Europe and Asia.
Revenue for Watches and Jewelry increased by 5% on a constantconsolidation scope and currency basis, as well as according topublished figures. This business group saw a very strong set ofperformances by TAG Heuer, Chaumet and Fred as well asgrowth by Bvlgari. Asia and Europe (excluding France) werethe most buoyant regions.
Revenue for Selective Retailing increased by 8% on a constantconsolidation scope and currency basis and by 7% based onpublished figures. This performance was driven by Sephora,which generated very appreciable growth in revenue across allworld regions.
7Financial Documents - December 31, 2016
Comments on the consolidated income statement
BUSINESS REVIEW AND COMMENTS ON THE CONSOLIDATED FINANCIAL STATEMENTS OF LVMH GROUP
admin
Tampon
admin
Tampon
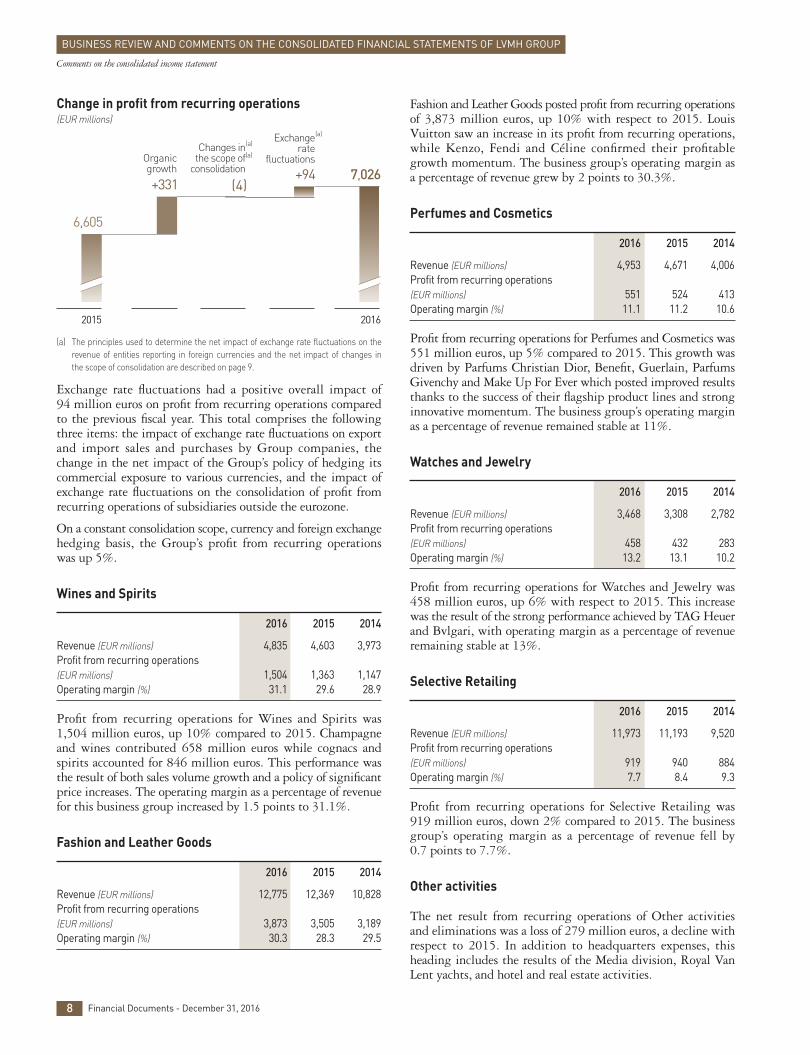
Change in profit from recurring operations (EUR millions)
(a) The principles used to determine the net impact of exchange rate fluctuations on therevenue of entities reporting in foreign currencies and the net impact of changes in the scope of consolidation are described on page 9.
Exchange rate fluctuations had a positive overall impact of94 million euros on profit from recurring operations comparedto the previous fiscal year. This total comprises the followingthree items: the impact of exchange rate fluctuations on exportand import sales and purchases by Group companies, thechange in the net impact of the Group’s policy of hedging itscommercial exposure to various currencies, and the impact ofexchange rate fluctuations on the consolidation of profit fromrecurring operations of subsidiaries outside the eurozone.
On a constant consolidation scope, currency and foreign exchangehedging basis, the Group’s profit from recurring operationswas up 5%.
Wines and Spirits
2016 2015 2014
Revenue (EUR millions) 4,835 4,603 3,973Profit from recurring operations (EUR millions) 1,504 1,363 1,147Operating margin (%) 31.1 29.6 28.9
Profit from recurring operations for Wines and Spirits was1,504 million euros, up 10% compared to 2015. Champagneand wines contributed 658 million euros while cognacs andspirits accounted for 846 million euros. This performance wasthe result of both sales volume growth and a policy of significantprice increases. The operating margin as a percentage of revenuefor this business group increased by 1.5 points to 31.1%.
Fashion and Leather Goods
2016 2015 2014
Revenue (EUR millions) 12,775 12,369 10,828Profit from recurring operations (EUR millions) 3,873 3,505 3,189Operating margin (%) 30.3 28.3 29.5
Fashion and Leather Goods posted profit from recurring operationsof 3,873 million euros, up 10% with respect to 2015. LouisVuitton saw an increase in its profit from recurring operations,while Kenzo, Fendi and Céline confirmed their profitablegrowth momentum. The business group’s operating margin asa percentage of revenue grew by 2 points to 30.3%.
Perfumes and Cosmetics
2016 2015 2014
Revenue (EUR millions) 4,953 4,671 4,006Profit from recurring operations (EUR millions) 551 524 413Operating margin (%) 11.1 11.2 10.6
Profit from recurring operations for Perfumes and Cosmetics was551 million euros, up 5% compared to 2015. This growth wasdriven by Parfums Christian Dior, Benefit, Guerlain, ParfumsGivenchy and Make Up For Ever which posted improved resultsthanks to the success of their flagship product lines and stronginnovative momentum. The business group’s operating marginas a percentage of revenue remained stable at 11%.
Watches and Jewelry
2016 2015 2014
Revenue (EUR millions) 3,468 3,308 2,782Profit from recurring operations (EUR millions) 458 432 283Operating margin (%) 13.2 13.1 10.2
Profit from recurring operations for Watches and Jewelry was458 million euros, up 6% with respect to 2015. This increasewas the result of the strong performance achieved by TAG Heuerand Bvlgari, with operating margin as a percentage of revenueremaining stable at 13%.
Selective Retailing
2016 2015 2014
Revenue (EUR millions) 11,973 11,193 9,520Profit from recurring operations (EUR millions) 919 940 884Operating margin (%) 7.7 8.4 9.3
Profit from recurring operations for Selective Retailing was919 million euros, down 2% compared to 2015. The businessgroup’s operating margin as a percentage of revenue fell by 0.7 points to 7.7%.
Other activities
The net result from recurring operations of Other activities and eliminations was a loss of 279 million euros, a decline withrespect to 2015. In addition to headquarters expenses, thisheading includes the results of the Media division, Royal VanLent yachts, and hotel and real estate activities.
8 Financial Documents - December 31, 2016
Comments on the consolidated income statement
BUSINESS REVIEW AND COMMENTS ON THE CONSOLIDATED FINANCIAL STATEMENTS OF LVMH GROUP
+94
6,605
2015
+331 (4)7,026
2016
(a)Organicgrowth
Exchangerate
fluctuations
(a)
Changes inthe scope of
consolidation
(a)
(EUR millions) 2016 2015 2014
Profit from recurring operations 7,026 6,605 5,715Other operating income and expenses (122) (221) (284)
Operating profit 6,904 6,384 5,431
Net financial income (expense) (432) (414) 2,947Income taxes (2,109) (1,969) (2,273)
Net profit before minority interests 4,363 4,001 6,105
Minority interests (382) (428) (457)Net profit, Group share 3,981 3,573 5,648
Other operating income and expenses amounted to a net expenseof 122 million euros, compared to a net expense of 221 millioneuros in 2015. In 2016, Other operating income and expensesincluded 155 million euros in amortization and impairmentcharges for brands and goodwill. The remainder mainlyconsisted of gains and losses on disposals.
The Group’s operating profit was 6,904 million euros, up 8%compared to 2015.
The net financial expense for the fiscal year was 432 million euros,compared with a net financial expense of 414 million euros in 2015. This item comprises:
- the aggregate cost of net financial debt, which amounted to83 million euros, up 5 million euros compared to 2015, withthe favorable impact of lower interest rates and the decrease
in the average amount of debt outstanding for the fiscal yearmore than offset by the unfavorable impact of the change inthe market value of debt hedging instruments;
- other financial income and expenses, which amounted to a netexpense of 349 million euros, compared to a net expense of336 million euros in 2015. The expense related to the ineffectiveportion of foreign exchange derivatives was 330 million euros,versus an expense of 437 million euros a year earlier; the sharpappreciation of the US dollar with respect to the euro had led the Group to adapt its derivatives portfolio over the firsthalf of 2015. Lastly, other income from financial instruments,which mainly arose from capital gains on sales and impairmentof short-term investments, amounted to a net expense of19 million euros, compared to net income of 100 million eurosin 2015.
The Group’s effective tax rate was 33%, stable with regard to 2015.
Profit attributable to minority interests was 382 million euros,compared to 428 million euros in 2015; this total mainlyincludes profit attributable to minority interests in MoëtHennessy and DFS.
The Group’s share of net profit was 3,981 million euros,compared with 3,573 million euros in 2015. This represented11% of revenue in 2016, up 1 point with respect to 2015. TheGroup share of net profit in 2016 was up 11% compared to the Group share of net profit in 2015.
Comments on the determination of the impact of exchange rate fluctuations and changes in the scope of consolidation
The impact of exchange rate fluctuations is determined by translating the accounts for the fiscal year of entities having a functional currency other than the euro at the prior fiscal year’sexchange rates, without any other restatements.
The impact of changes in the scope of consolidation is determined:- for the fiscal year’s acquisitions, by deducting from revenue for the fiscal year the amount of revenue generated during that fiscal year by the acquired entities, as of their initial consolidation;- for the prior fiscal year’s acquisitions, by deducting from revenue for the fiscal year the amount of revenue generated over the months during which the acquired entities were not
consolidated in the prior fiscal year;- for the fiscal year’s disposals, by adding to revenue for the fiscal year the amount of revenue generated by the divested entities in the prior fiscal year over the months during which those
entities were no longer consolidated in the current fiscal year;- for the prior fiscal year’s disposals, by adding to revenue for the fiscal year the amount of revenue generated in the prior fiscal year by the divested entities.
Profit from recurring operations is restated in accordance with the same principles.
1.3. Other income statement items
9Financial Documents - December 31, 2016
Comments on the consolidated income statement
BUSINESS REVIEW AND COMMENTS ON THE CONSOLIDATED FINANCIAL STATEMENTS OF LVMH GROUP
2016 2015 2014
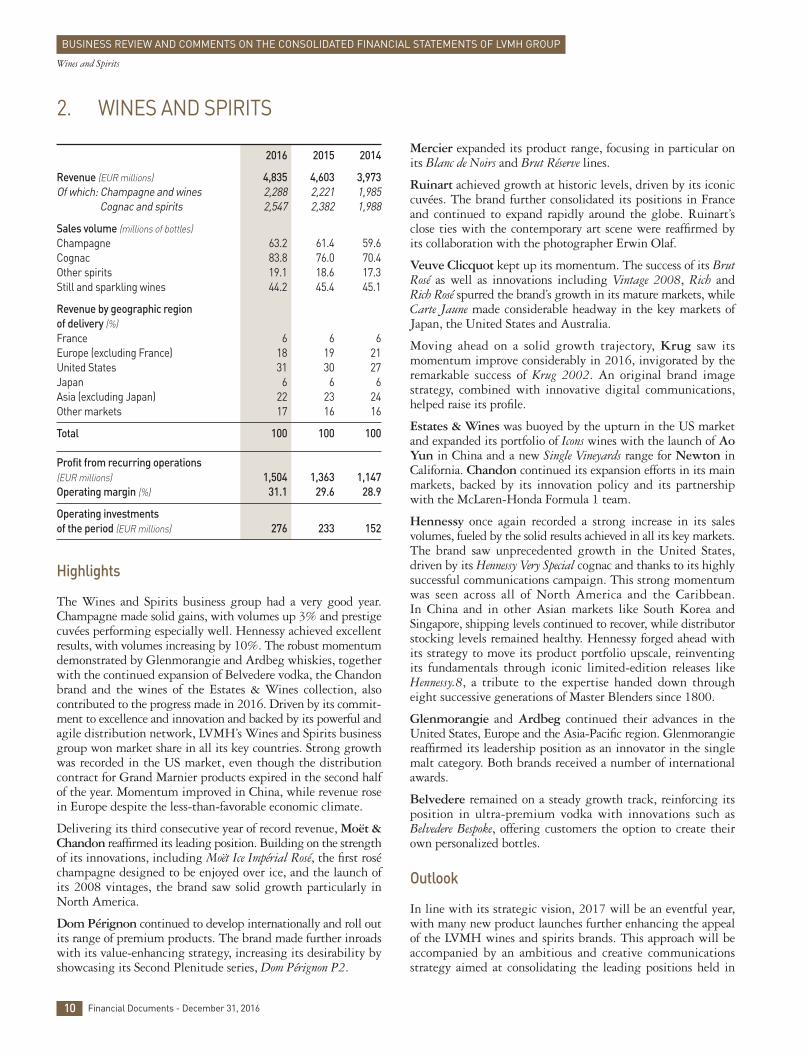
Revenue (EUR millions) 4,835 4,603 3,973Of which: Champagne and wines 2,288 2,221 1,985
Cognac and spirits 2,547 2,382 1,988
Sales volume (millions of bottles) Champagne 63.2 61.4 59.6Cognac 83.8 76.0 70.4Other spirits 19.1 18.6 17.3Still and sparkling wines 44.2 45.4 45.1
Revenue by geographic region of delivery (%) France 6 6 6Europe (excluding France) 18 19 21United States 31 30 27Japan 6 6 6Asia (excluding Japan) 22 23 24Other markets 17 16 16
Total 100 100 100
Profit from recurring operations (EUR millions) 1,504 1,363 1,147Operating margin (%) 31.1 29.6 28.9
Operating investments of the period (EUR millions) 276 233 152
Highlights
The Wines and Spirits business group had a very good year.Champagne made solid gains, with volumes up 3% and prestigecuvées performing especially well. Hennessy achieved excellentresults, with volumes increasing by 10%. The robust momentumdemonstrated by Glenmorangie and Ardbeg whiskies, togetherwith the continued expansion of Belvedere vodka, the Chandonbrand and the wines of the Estates & Wines collection, alsocontri buted to the progress made in 2016. Driven by its commit -ment to excellence and innovation and backed by its powerful andagile distribution network, LVMH’s Wines and Spirits businessgroup won market share in all its key countries. Strong growthwas recorded in the US market, even though the distributioncontract for Grand Marnier products expired in the second halfof the year. Momentum improved in China, while revenue rosein Europe despite the less-than-favorable economic climate.
Delivering its third consecutive year of record revenue, Moët &Chandon reaffirmed its leading position. Building on the strengthof its innovations, including Moët Ice Impérial Rosé, the first roséchampagne designed to be enjoyed over ice, and the launch ofits 2008 vintages, the brand saw solid growth particularly inNorth America.
Dom Pérignon continued to develop internationally and roll outits range of premium products. The brand made further inroadswith its value-enhancing strategy, increasing its desirability byshowcasing its Second Plenitude series, Dom Pérignon P2.
Mercier expanded its product range, focusing in particular onits Blanc de Noirs and Brut Réserve lines.
Ruinart achieved growth at historic levels, driven by its iconiccuvées. The brand further consolidated its positions in Franceand continued to expand rapidly around the globe. Ruinart’sclose ties with the contemporary art scene were reaffirmed byits collaboration with the photographer Erwin Olaf.
Veuve Clicquot kept up its momentum. The success of its BrutRosé as well as innovations including Vintage 2008, Rich andRich Rosé spurred the brand’s growth in its mature markets, whileCarte Jaune made considerable headway in the key markets ofJapan, the United States and Australia.
Moving ahead on a solid growth trajectory, Krug saw itsmomentum improve considerably in 2016, invigorated by theremarkable success of Krug 2002. An original brand imagestrategy, combined with innovative digital communications,helped raise its profile.
Estates & Wines was buoyed by the upturn in the US marketand expanded its portfolio of Icons wines with the launch of AoYun in China and a new Single Vineyards range for Newton inCalifornia. Chandon continued its expansion efforts in its mainmarkets, backed by its innovation policy and its partnershipwith the McLaren-Honda Formula 1 team.
Hennessy once again recorded a strong increase in its salesvolumes, fueled by the solid results achieved in all its key markets.The brand saw unprecedented growth in the United States,driven by its Hennessy Very Special cognac and thanks to its highlysuccessful communications campaign. This strong momentumwas seen across all of North America and the Caribbean. In China and in other Asian markets like South Korea andSingapore, shipping levels continued to recover, while distributorstocking levels remained healthy. Hennessy forged ahead withits strategy to move its product portfolio upscale, reinventingits fundamentals through iconic limited-edition releases likeHennessy.8, a tribute to the expertise handed down througheight successive generations of Master Blenders since 1800.
Glenmorangie and Ardbeg continued their advances in theUnited States, Europe and the Asia-Pacific region. Glenmorangiereaffirmed its leadership position as an innovator in the singlemalt category. Both brands received a number of internationalawards.
Belvedere remained on a steady growth track, reinforcing itsposition in ultra-premium vodka with innovations such asBelvedere Bespoke, offering customers the option to create theirown personalized bottles.
Outlook
In line with its strategic vision, 2017 will be an eventful year,with many new product launches further enhancing the appealof the LVMH wines and spirits brands. This approach will beaccompanied by an ambitious and creative communicationsstrategy aimed at consolidating the leading positions held in
10 Financial Documents - December 31, 2016
Wines and Spirits
2. WINES AND SPIRITS
BUSINESS REVIEW AND COMMENTS ON THE CONSOLIDATED FINANCIAL STATEMENTS OF LVMH GROUP
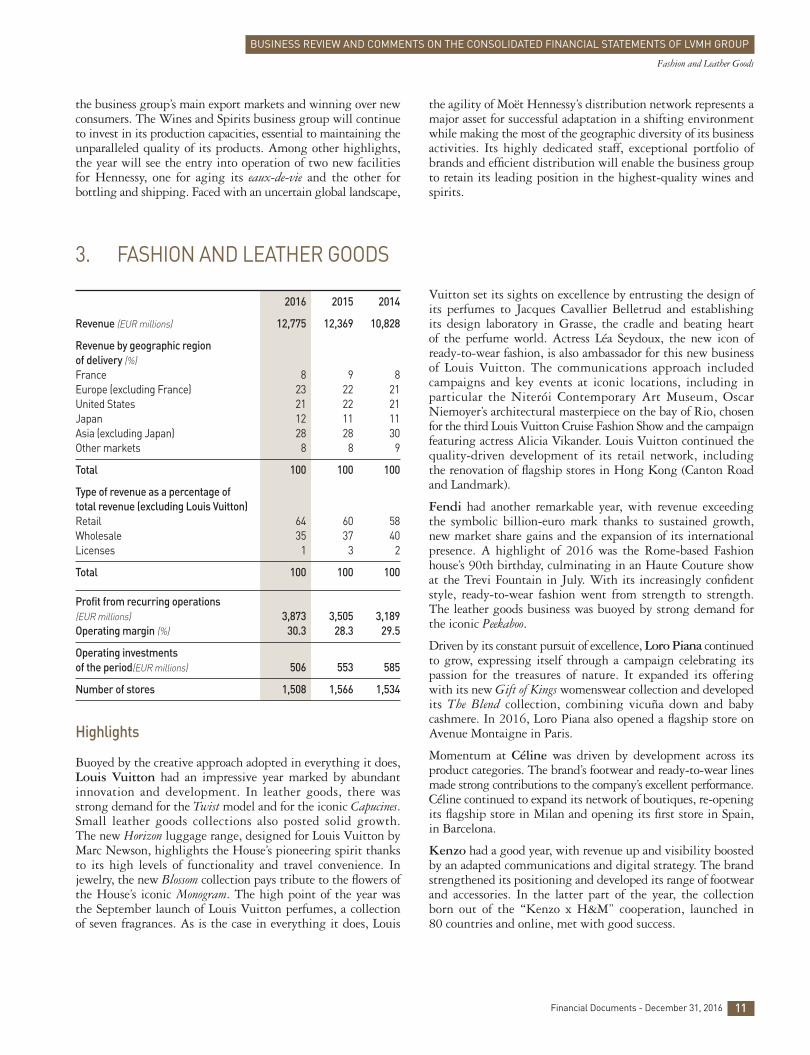
2016 2015 2014
Revenue (EUR millions) 12,775 12,369 10,828
Revenue by geographic region of delivery (%) France 8 9 8Europe (excluding France) 23 22 21United States 21 22 21Japan 12 11 11Asia (excluding Japan) 28 28 30Other markets 8 8 9
Total 100 100 100
Type of revenue as a percentage of total revenue (excluding Louis Vuitton) Retail 64 60 58Wholesale 35 37 40Licenses 1 3 2
Total 100 100 100
Profit from recurring operations (EUR millions) 3,873 3,505 3,189Operating margin (%) 30.3 28.3 29.5
Operating investments of the period(EUR millions) 506 553 585
Number of stores 1,508 1,566 1,534
Highlights
Buoyed by the creative approach adopted in everything it does,Louis Vuitton had an impressive year marked by abundantinnovation and development. In leather goods, there wasstrong demand for the Twist model and for the iconic Capucines.Small leather goods collections also posted solid growth. The new Horizon luggage range, designed for Louis Vuitton byMarc Newson, highlights the House’s pioneering spirit thanksto its high levels of functionality and travel convenience. Injewelry, the new Blossom collection pays tribute to the flowers ofthe House’s iconic Monogram. The high point of the year wasthe September launch of Louis Vuitton perfumes, a collectionof seven fragrances. As is the case in everything it does, Louis
Vuitton set its sights on excellence by entrusting the design ofits perfumes to Jacques Cavallier Belletrud and establishing its design laboratory in Grasse, the cradle and beating heart of the perfume world. Actress Léa Seydoux, the new icon ofready-to-wear fashion, is also ambassador for this new businessof Louis Vuitton. The communications approach includedcampaigns and key events at iconic locations, including inparticular the Niterói Contemporary Art Museum, OscarNiemoyer’s architectural masterpiece on the bay of Rio, chosenfor the third Louis Vuitton Cruise Fashion Show and the campaignfeaturing actress Alicia Vikander. Louis Vuitton continued thequality-driven development of its retail network, including the renovation of flagship stores in Hong Kong (Canton Roadand Landmark).
Fendi had another remarkable year, with revenue exceedingthe symbolic billion-euro mark thanks to sustained growth,new market share gains and the expansion of its internationalpresence. A highlight of 2016 was the Rome-based Fashionhouse’s 90th birthday, culminating in an Haute Couture showat the Trevi Fountain in July. With its increasingly confidentstyle, ready-to-wear fashion went from strength to strength.The leather goods business was buoyed by strong demand forthe iconic Peekaboo.
Driven by its constant pursuit of excellence, Loro Piana continuedto grow, expressing itself through a campaign celebrating itspassion for the treasures of nature. It expanded its offering with its new Gift of Kings womenswear collection and developedits The Blend collection, combining vicuña down and babycashmere. In 2016, Loro Piana also opened a flagship store onAvenue Montaigne in Paris.
Momentum at Céline was driven by development across itsproduct categories. The brand’s footwear and ready-to-wear linesmade strong contributions to the company’s excellent performance.Céline continued to expand its network of boutiques, re-openingits flagship store in Milan and opening its first store in Spain,in Barcelona.
Kenzo had a good year, with revenue up and visibility boostedby an adapted communications and digital strategy. The brandstrengthened its positioning and developed its range of footwearand accessories. In the latter part of the year, the collectionborn out of the “Kenzo x H&M” cooperation, launched in 80 countries and online, met with good success.
3. FASHION AND LEATHER GOODS
the business group’s main export markets and winning over newconsumers. The Wines and Spirits business group will continueto invest in its production capacities, essential to maintaining theunparalleled quality of its products. Among other highlights,the year will see the entry into operation of two new facilitiesfor Hennessy, one for aging its eaux-de-vie and the other forbottling and shipping. Faced with an uncertain global landscape,
the agility of Moët Hennessy’s distribution network represents amajor asset for successful adaptation in a shifting environmentwhile making the most of the geographic diversity of its businessactivities. Its highly dedicated staff, exceptional portfolio ofbrands and efficient distribution will enable the business groupto retain its leading position in the highest-quality wines andspirits.
11Financial Documents - December 31, 2016
Fashion and Leather Goods
BUSINESS REVIEW AND COMMENTS ON THE CONSOLIDATED FINANCIAL STATEMENTS OF LVMH GROUP
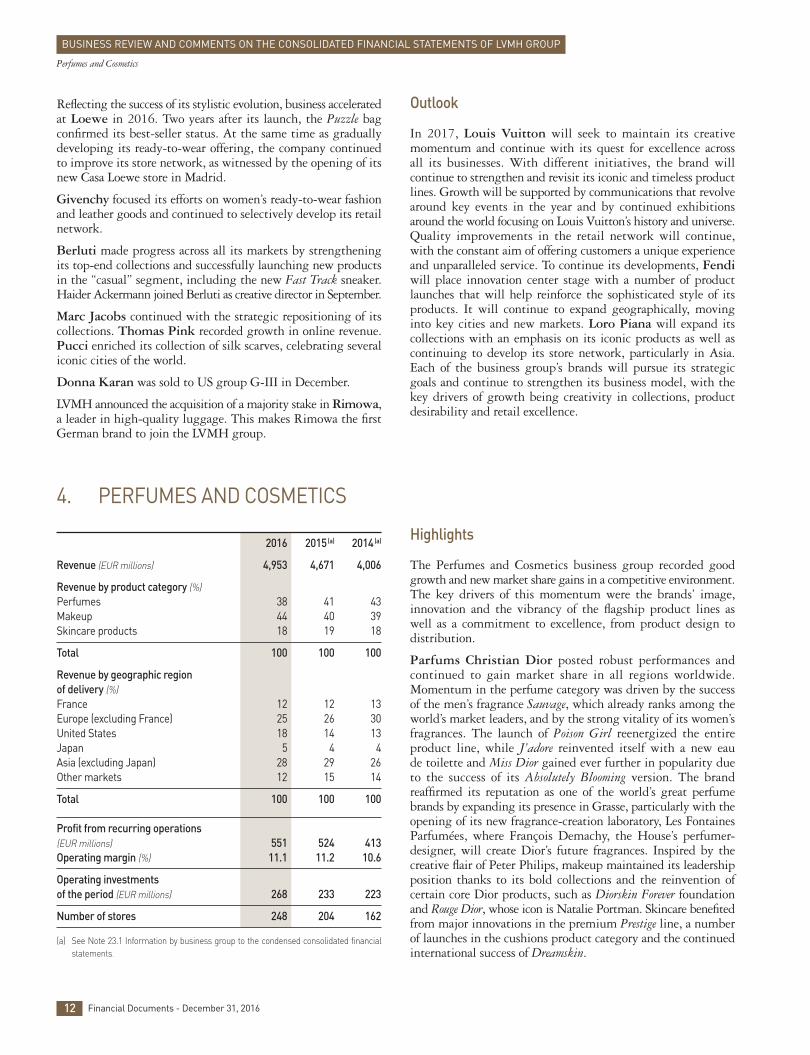
2016 2015(a) 2014(a)
Revenue (EUR millions) 4,953 4,671 4,006
Revenue by product category (%) Perfumes 38 41 43Makeup 44 40 39Skincare products 18 19 18
Total 100 100 100
Revenue by geographic region of delivery (%) France 12 12 13Europe (excluding France) 25 26 30United States 18 14 13Japan 5 4 4Asia (excluding Japan) 28 29 26Other markets 12 15 14
Total 100 100 100
Profit from recurring operations (EUR millions) 551 524 413Operating margin (%) 11.1 11.2 10.6
Operating investments of the period (EUR millions) 268 233 223
Number of stores 248 204 162
(a) See Note 23.1 Information by business group to the condensed consolidated financialstatements.
Highlights
The Perfumes and Cosmetics business group recorded goodgrowth and new market share gains in a competitive environment.The key drivers of this momentum were the brands’ image,innovation and the vibrancy of the flagship product lines aswell as a commitment to excellence, from product design todistribution.
Parfums Christian Dior posted robust performances andcontinued to gain market share in all regions worldwide.Momentum in the perfume category was driven by the successof the men’s fragrance Sauvage, which already ranks among theworld’s market leaders, and by the strong vitality of its women’sfragrances. The launch of Poison Girl reenergized the entireproduct line, while J’adore reinvented itself with a new eau de toilette and Miss Dior gained ever further in popularity dueto the success of its Absolutely Blooming version. The brandreaffirmed its reputation as one of the world’s great perfumebrands by expanding its presence in Grasse, particularly with theopening of its new fragrance-creation laboratory, Les FontainesParfumées, where François Demachy, the House’s perfumer-designer, will create Dior’s future fragrances. Inspired by thecreative flair of Peter Philips, makeup maintained its leadershipposition thanks to its bold collections and the reinvention ofcertain core Dior products, such as Diorskin Forever foundationand Rouge Dior, whose icon is Natalie Portman. Skincare benefitedfrom major innovations in the premium Prestige line, a numberof launches in the cushions product category and the continuedinternational success of Dreamskin.
4. PERFUMES AND COSMETICS
Reflecting the success of its stylistic evolution, business acceleratedat Loewe in 2016. Two years after its launch, the Puzzle bagconfirmed its best-seller status. At the same time as graduallydeveloping its ready-to-wear offering, the company continuedto improve its store network, as witnessed by the opening of itsnew Casa Loewe store in Madrid.
Givenchy focused its efforts on women’s ready-to-wear fashionand leather goods and continued to selectively develop its retailnetwork.
Berluti made progress across all its markets by strengtheningits top-end collections and successfully launching new productsin the “casual” segment, including the new Fast Track sneaker.Haider Ackermann joined Berluti as creative director in September.
Marc Jacobs continued with the strategic repositioning of itscollections. Thomas Pink recorded growth in online revenue.Pucci enriched its collection of silk scarves, celebrating severaliconic cities of the world.
Donna Karan was sold to US group G-III in December.
LVMH announced the acquisition of a majority stake in Rimowa,a leader in high-quality luggage. This makes Rimowa the firstGerman brand to join the LVMH group.
Outlook
In 2017, Louis Vuitton will seek to maintain its creativemomentum and continue with its quest for excellence across all its businesses. With different initiatives, the brand willcontinue to strengthen and revisit its iconic and timeless productlines. Growth will be supported by communications that revolvearound key events in the year and by continued exhibitionsaround the world focusing on Louis Vuitton’s history and universe.Quality improvements in the retail network will continue,with the constant aim of offering customers a unique experienceand unparalleled service. To continue its developments, Fendiwill place innovation center stage with a number of productlaunches that will help reinforce the sophisticated style of itsproducts. It will continue to expand geographically, movinginto key cities and new markets. Loro Piana will expand itscollections with an emphasis on its iconic products as well ascontinuing to develop its store network, particularly in Asia.Each of the business group’s brands will pursue its strategicgoals and continue to strengthen its business model, with thekey drivers of growth being creativity in collections, productdesirability and retail excellence.
12 Financial Documents - December 31, 2016
Perfumes and Cosmetics
BUSINESS REVIEW AND COMMENTS ON THE CONSOLIDATED FINANCIAL STATEMENTS OF LVMH GROUP
Guerlain’s development was driven by the success of the newmakeup collection inspired by its fragrance La Petite Robe Noire,with the global rollout of a line of lipsticks and nail polish. A new version of the fragrance – Intense – was also launched.The Orchidée Impériale and Abeille Royale lines ensure Guerlain’sgrowth in the skincare industry and illustrate its efforts to protectbiodiversity. A new boutique concept exclusively dedicated toperfumes was created in Paris, giving Guerlain an opportunityto showcase its reputation as one of France’s iconic perfumehouses and demonstrate an ever-changing customer experience.
Parfums Givenchy’s growth is striking in Asia. Its makeupposted strong growth, driven by the success of the Le Rougelipstick line and Prisme Libre face powder. Kenzo Parfumsbenefited from the launch of its new women’s fragrance, KenzoWorld, designed in collaboration with Kenzo’s creative directorsCarol Lim and Humberto Leon, and promoted by a commercialthat received extensive attention.
Benefit maintained its momentum. The success of its BrowCollection, the largest launch of the brand, earned Benefit theleading position in this high-growth makeup segment. The yearwas marked by the launch of a new website in 24 countries,with a version in each local language perfectly adapted for mobiledevices. Revenue of Make Up For Ever recorded growth inevery region in the world, a momentum largely driven by theUltra HD and Artist Rouge lines. It accelerated its digital strategyand opened its first interactive space in the Sephora store on the Champs-Élysées, the first space allowing customers to learnmakeup techniques interactively. Fresh recorded solid gains,opened two points of sale in Paris and introduced a highlyinnovative skincare line named Vitamin Nectar. Acqua di Parmacelebrated its 100th anniversary by feting its hometown ofParma, Italy and launching three Note de Colonia fragrances.The Kat Von D and Marc Jacobs Beauty makeup lines made
very strong progress. Parfums Loewe did well in Asian marketswith the launch of Loewe 001, in close collaboration with thecouture house.
Outlook
Going into 2017, LVMH’s Perfumes and Cosmetics brands aresetting new targets for market share gains and will again makeinnovation a core pillar of their accomplishments. ParfumsChristian Dior will place special emphasis on strengtheningits products, J’adore, Miss Dior and Sauvage, and will focus onmaking Poison Girl and Dior Homme Sport more attractive to younggenerations. Makeup will benefit from major innovations andthe increased use of digital communications. Prestige and CaptureTotale will be given a boost to drive growth in the skincaresector. The brand will continue to cultivate its aura in synergywith Couture Dior as well as its reputation as one of the world’sgreat perfume houses, while continuing to invest in boutiquesand sales counters devoted to excellence and contemporarytrends. In addition to supporting La Petite Robe Noire, its iconicskincare lines and lip and foundation segments in the makeupsector, Guerlain will launch a women’s fragrance in March.Parfums Givenchy will take advantage of major innovationsto accelerate the development of its makeup business, whilelaunching a new communications campaign for its perfumes.Kenzo Parfums will continue the global roll-out of Kenzo Worldand will launch a new version of Flower by Kenzo. Benefit willcontinue its international expansion while striving to strengthenits global leadership position in the eyebrow segment. MakeUp For Ever will maintain its strong innovation policy in thecomplexion, lip and eye segment. Kat Von D will begin itsinternational expansion with the French market. Lastly, a newfull makeup line will be launched in collaboration with thesinger Rihanna.
13Financial Documents - December 31, 2016
Perfumes and Cosmetics
BUSINESS REVIEW AND COMMENTS ON THE CONSOLIDATED FINANCIAL STATEMENTS OF LVMH GROUP
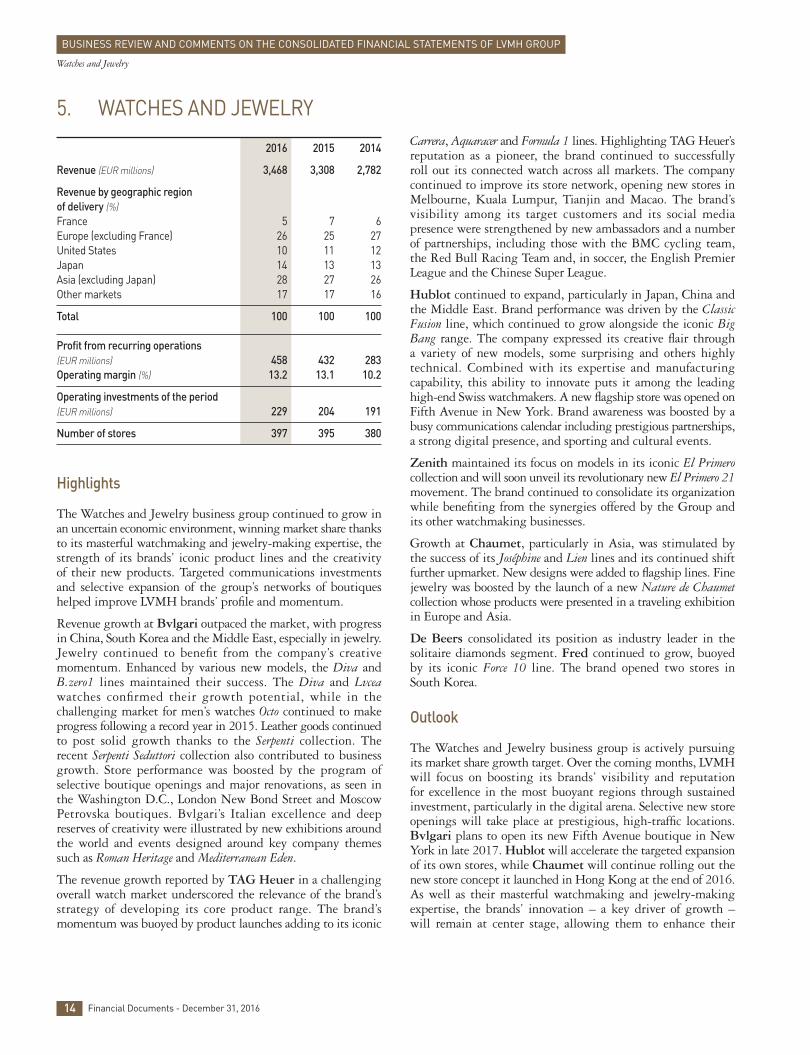
2016 2015 2014
Revenue (EUR millions) 3,468 3,308 2,782
Revenue by geographic region of delivery (%) France 5 7 6Europe (excluding France) 26 25 27United States 10 11 12Japan 14 13 13Asia (excluding Japan) 28 27 26Other markets 17 17 16
Total 100 100 100
Profit from recurring operations(EUR millions) 458 432 283Operating margin (%) 13.2 13.1 10.2
Operating investments of the period (EUR millions) 229 204 191
Number of stores 397 395 380
Highlights
The Watches and Jewelry business group continued to grow inan uncertain economic environment, winning market share thanksto its masterful watchmaking and jewelry-making expertise, thestrength of its brands’ iconic product lines and the creativity of their new products. Targeted communications investmentsand selective expansion of the group’s networks of boutiqueshelped improve LVMH brands’ profile and momentum.
Revenue growth at Bvlgari outpaced the market, with progressin China, South Korea and the Middle East, especially in jewelry.Jewelry continued to benefit from the company’s creativemomentum. Enhanced by various new models, the Diva andB.zero1 lines maintained their success. The Diva and Lvceawatches confirmed their growth potential, while in thechallenging market for men’s watches Octo continued to makeprogress following a record year in 2015. Leather goods continuedto post solid growth thanks to the Serpenti collection. Therecent Serpenti Seduttori collection also contributed to businessgrowth. Store performance was boosted by the program ofselective boutique openings and major renovations, as seen inthe Washington D.C., London New Bond Street and MoscowPetrovska boutiques. Bvlgari’s Italian excellence and deepreserves of creativity were illustrated by new exhibitions aroundthe world and events designed around key company themessuch as Roman Heritage and Mediterranean Eden.
The revenue growth reported by TAG Heuer in a challengingoverall watch market underscored the relevance of the brand’sstrategy of developing its core product range. The brand’smomentum was buoyed by product launches adding to its iconic
Carrera, Aquaracer and Formula 1 lines. Highlighting TAG Heuer’sreputation as a pioneer, the brand continued to successfully roll out its connected watch across all markets. The companycontinued to improve its store network, opening new stores inMelbourne, Kuala Lumpur, Tianjin and Macao. The brand’svisibility among its target customers and its social mediapresence were strengthened by new ambassadors and a numberof partnerships, including those with the BMC cycling team,the Red Bull Racing Team and, in soccer, the English PremierLeague and the Chinese Super League.
Hublot continued to expand, particularly in Japan, China andthe Middle East. Brand performance was driven by the ClassicFusion line, which continued to grow alongside the iconic BigBang range. The company expressed its creative flair through a variety of new models, some surprising and others highlytechnical. Combined with its expertise and manufacturingcapability, this ability to innovate puts it among the leadinghigh-end Swiss watchmakers. A new flagship store was opened onFifth Avenue in New York. Brand awareness was boosted by abusy communications calendar including prestigious partnerships,a strong digital presence, and sporting and cultural events.
Zenith maintained its focus on models in its iconic El Primerocollection and will soon unveil its revolutionary new El Primero 21movement. The brand continued to consolidate its organizationwhile benefiting from the synergies offered by the Group andits other watchmaking businesses.
Growth at Chaumet, particularly in Asia, was stimulated bythe success of its Joséphine and Lien lines and its continued shiftfurther upmarket. New designs were added to flagship lines. Finejewelry was boosted by the launch of a new Nature de Chaumetcollection whose products were presented in a traveling exhibitionin Europe and Asia.
De Beers consolidated its position as industry leader in thesolitaire diamonds segment. Fred continued to grow, buoyedby its iconic Force 10 line. The brand opened two stores inSouth Korea.
Outlook
The Watches and Jewelry business group is actively pursuingits market share growth target. Over the coming months, LVMHwill focus on boosting its brands’ visibility and reputation for excellence in the most buoyant regions through sustainedinvestment, particularly in the digital arena. Selective new storeopenings will take place at prestigious, high-traffic locations.Bvlgari plans to open its new Fifth Avenue boutique in NewYork in late 2017. Hublot will accelerate the targeted expansionof its own stores, while Chaumet will continue rolling out thenew store concept it launched in Hong Kong at the end of 2016.As well as their masterful watchmaking and jewelry-makingexpertise, the brands’ innovation – a key driver of growth –will remain at center stage, allowing them to enhance their
5. WATCHES AND JEWELRY
14 Financial Documents - December 31, 2016
Watches and Jewelry
BUSINESS REVIEW AND COMMENTS ON THE CONSOLIDATED FINANCIAL STATEMENTS OF LVMH GROUP
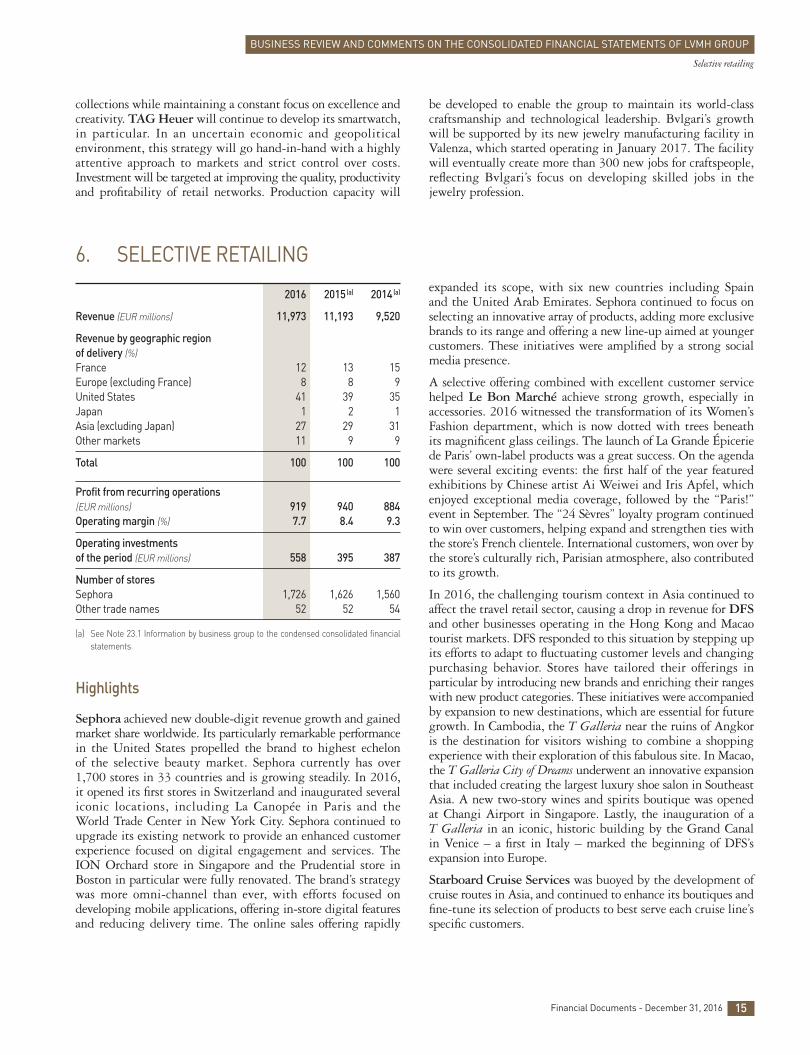
2016 2015(a) 2014(a)
Revenue (EUR millions) 11,973 11,193 9,520
Revenue by geographic region of delivery (%) France 12 13 15Europe (excluding France) 8 8 9United States 41 39 35Japan 1 2 1Asia (excluding Japan) 27 29 31Other markets 11 9 9
Total 100 100 100
Profit from recurring operations (EUR millions) 919 940 884Operating margin (%) 7.7 8.4 9.3
Operating investments of the period (EUR millions) 558 395 387
Number of stores Sephora 1,726 1,626 1,560Other trade names 52 52 54
(a) See Note 23.1 Information by business group to the condensed consolidated financialstatements.
Highlights
Sephora achieved new double-digit revenue growth and gainedmarket share worldwide. Its particularly remarkable performancein the United States propelled the brand to highest echelon of the selective beauty market. Sephora currently has over1,700 stores in 33 countries and is growing steadily. In 2016,it opened its first stores in Switzerland and inaugurated severaliconic locations, including La Canopée in Paris and the World Trade Center in New York City. Sephora continued toupgrade its existing network to provide an enhanced customerexperience focused on digital engagement and services. TheION Orchard store in Singapore and the Prudential store inBoston in particular were fully renovated. The brand’s strategywas more omni-channel than ever, with efforts focused ondeveloping mobile applications, offering in-store digital featuresand reducing delivery time. The online sales offering rapidly
expanded its scope, with six new countries including Spain and the United Arab Emirates. Sephora continued to focus onselecting an innovative array of products, adding more exclusivebrands to its range and offering a new line-up aimed at youngercustomers. These initiatives were amplified by a strong socialmedia presence.
A selective offering combined with excellent customer servicehelped Le Bon Marché achieve strong growth, especially inaccessories. 2016 witnessed the transformation of its Women’sFashion department, which is now dotted with trees beneathits magnificent glass ceilings. The launch of La Grande Épiceriede Paris’ own-label products was a great success. On the agendawere several exciting events: the first half of the year featuredexhibitions by Chinese artist Ai Weiwei and Iris Apfel, whichenjoyed exceptional media coverage, followed by the “Paris!”event in September. The “24 Sèvres” loyalty program continuedto win over customers, helping expand and strengthen ties withthe store’s French clientele. International customers, won over bythe store’s culturally rich, Parisian atmosphere, also contributedto its growth.
In 2016, the challenging tourism context in Asia continued toaffect the travel retail sector, causing a drop in revenue for DFSand other businesses operating in the Hong Kong and Macaotourist markets. DFS responded to this situation by stepping upits efforts to adapt to fluctuating customer levels and changingpurchasing behavior. Stores have tailored their offerings inparticular by introducing new brands and enriching their rangeswith new product categories. These initiatives were accompaniedby expansion to new destinations, which are essential for futuregrowth. In Cambodia, the T Galleria near the ruins of Angkoris the destination for visitors wishing to combine a shoppingexperience with their exploration of this fabulous site. In Macao,the T Galleria City of Dreams underwent an innovative expansionthat included creating the largest luxury shoe salon in SoutheastAsia. A new two-story wines and spirits boutique was openedat Changi Airport in Singapore. Lastly, the inauguration of a T Galleria in an iconic, historic building by the Grand Canalin Venice – a first in Italy – marked the beginning of DFS’sexpansion into Europe.
Starboard Cruise Services was buoyed by the development ofcruise routes in Asia, and continued to enhance its boutiques andfine-tune its selection of products to best serve each cruise line’sspecific customers.
6. SELECTIVE RETAILING
collections while maintaining a constant focus on excellence andcreativity. TAG Heuer will continue to develop its smartwatch,in particular. In an uncertain economic and geopoliticalenvironment, this strategy will go hand-in-hand with a highlyattentive approach to markets and strict control over costs.Investment will be targeted at improving the quality, productivityand profitability of retail networks. Production capacity will
be developed to enable the group to maintain its world-classcraftsmanship and technological leadership. Bvlgari’s growthwill be supported by its new jewelry manufacturing facility inValenza, which started operating in January 2017. The facilitywill eventually create more than 300 new jobs for craftspeople,reflecting Bvlgari’s focus on developing skilled jobs in thejewelry profession.
15Financial Documents - December 31, 2016
Selective retailing
BUSINESS REVIEW AND COMMENTS ON THE CONSOLIDATED FINANCIAL STATEMENTS OF LVMH GROUP
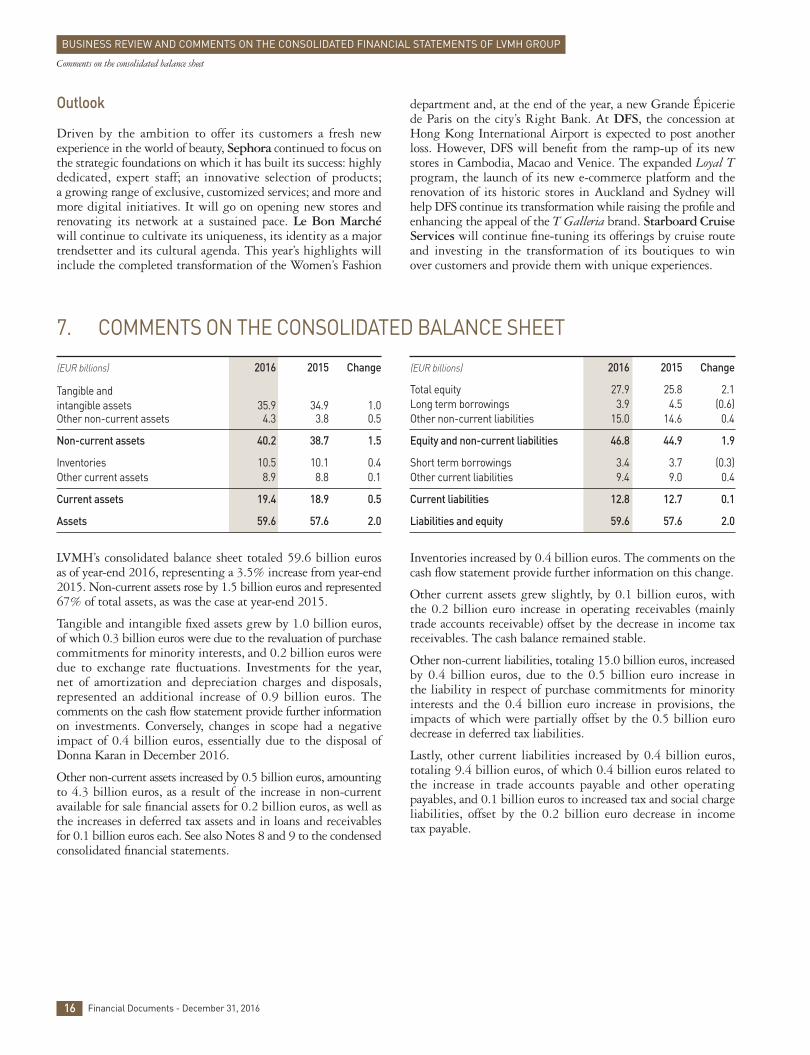
LVMH’s consolidated balance sheet totaled 59.6 billion eurosas of year-end 2016, representing a 3.5% increase from year-end2015. Non-current assets rose by 1.5 billion euros and represented67% of total assets, as was the case at year-end 2015.
Tangible and intangible fixed assets grew by 1.0 billion euros,of which 0.3 billion euros were due to the revaluation of purchasecommitments for minority interests, and 0.2 billion euros weredue to exchange rate fluctuations. Investments for the year, net of amortization and depreciation charges and disposals,represented an additional increase of 0.9 billion euros. Thecomments on the cash flow statement provide further informationon investments. Conversely, changes in scope had a negativeimpact of 0.4 billion euros, essentially due to the disposal ofDonna Karan in December 2016.
Other non-current assets increased by 0.5 billion euros, amountingto 4.3 billion euros, as a result of the increase in non-currentavailable for sale financial assets for 0.2 billion euros, as well asthe increases in deferred tax assets and in loans and receivablesfor 0.1 billion euros each. See also Notes 8 and 9 to the condensedconsolidated financial statements.
Inventories increased by 0.4 billion euros. The comments on thecash flow statement provide further information on this change.
Other current assets grew slightly, by 0.1 billion euros, withthe 0.2 billion euro increase in operating receivables (mainlytrade accounts receivable) offset by the decrease in income taxreceivables. The cash balance remained stable.
Other non-current liabilities, totaling 15.0 billion euros, increasedby 0.4 billion euros, due to the 0.5 billion euro increase in the liability in respect of purchase commitments for minorityinterests and the 0.4 billion euro increase in provisions, theimpacts of which were partially offset by the 0.5 billion eurodecrease in deferred tax liabilities.
Lastly, other current liabilities increased by 0.4 billion euros,totaling 9.4 billion euros, of which 0.4 billion euros related tothe increase in trade accounts payable and other operatingpayables, and 0.1 billion euros to increased tax and social chargeliabilities, offset by the 0.2 billion euro decrease in income tax payable.
(EUR billions) 2016 2015 Change
Tangible and intangible assets 35.9 34.9 1.0Other non-current assets 4.3 3.8 0.5
Non-current assets 40.2 38.7 1.5
Inventories 10.5 10.1 0.4Other current assets 8.9 8.8 0.1
Current assets 19.4 18.9 0.5
Assets 59.6 57.6 2.0
(EUR billions) 2016 2015 Change
Total equity 27.9 25.8 2.1Long term borrowings 3.9 4.5 (0.6)Other non-current liabilities 15.0 14.6 0.4
Equity and non-current liabilities 46.8 44.9 1.9
Short term borrowings 3.4 3.7 (0.3)Other current liabilities 9.4 9.0 0.4
Current liabilities 12.8 12.7 0.1
Liabilities and equity 59.6 57.6 2.0
7. COMMENTS ON THE CONSOLIDATED BALANCE SHEET
Outlook
Driven by the ambition to offer its customers a fresh newexperience in the world of beauty, Sephora continued to focus onthe strategic foundations on which it has built its success: highlydedicated, expert staff; an innovative selection of products; a growing range of exclusive, customized services; and more andmore digital initiatives. It will go on opening new stores andrenovating its network at a sustained pace. Le Bon Marchéwill continue to cultivate its uniqueness, its identity as a majortrendsetter and its cultural agenda. This year’s highlights willinclude the completed transformation of the Women’s Fashion
department and, at the end of the year, a new Grande Épiceriede Paris on the city’s Right Bank. At DFS, the concession atHong Kong International Airport is expected to post anotherloss. However, DFS will benefit from the ramp-up of its newstores in Cambodia, Macao and Venice. The expanded Loyal Tprogram, the launch of its new e-commerce platform and therenovation of its historic stores in Auckland and Sydney willhelp DFS continue its transformation while raising the profile andenhancing the appeal of the T Galleria brand. Starboard CruiseServices will continue fine-tuning its offerings by cruise routeand investing in the transformation of its boutiques to winover customers and provide them with unique experiences.
16 Financial Documents - December 31, 2016
Comments on the consolidated balance sheet
BUSINESS REVIEW AND COMMENTS ON THE CONSOLIDATED FINANCIAL STATEMENTS OF LVMH GROUP
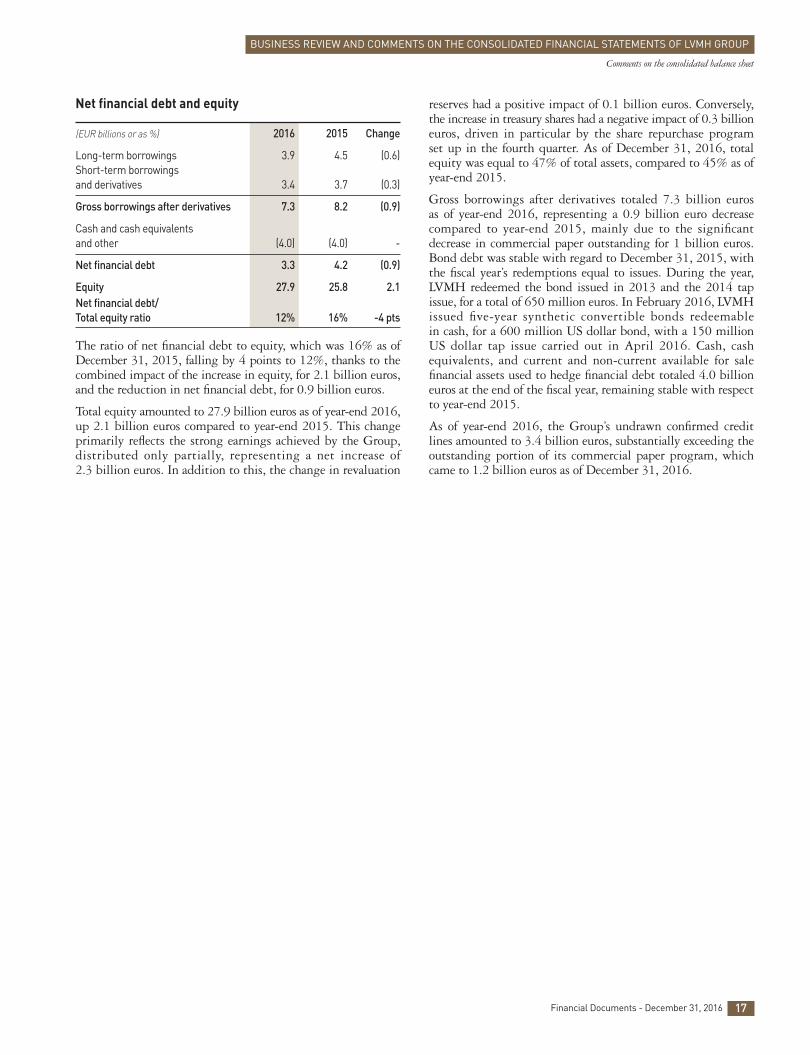
Net financial debt and equity
(EUR billions or as %) 2016 2015 Change
Long-term borrowings 3.9 4.5 (0.6)Short-term borrowings and derivatives 3.4 3.7 (0.3)
Gross borrowings after derivatives 7.3 8.2 (0.9)
Cash and cash equivalents and other (4.0) (4.0) -
Net financial debt 3.3 4.2 (0.9)
Equity 27.9 25.8 2.1Net financial debt / Total equity ratio 12% 16% -4 pts
The ratio of net financial debt to equity, which was 16% as ofDecember 31, 2015, falling by 4 points to 12%, thanks to thecombined impact of the increase in equity, for 2.1 billion euros,and the reduction in net financial debt, for 0.9 billion euros.
Total equity amounted to 27.9 billion euros as of year-end 2016,up 2.1 billion euros compared to year-end 2015. This changeprimarily reflects the strong earnings achieved by the Group,distributed only partially, representing a net increase of 2.3 billion euros. In addition to this, the change in revaluation
reserves had a positive impact of 0.1 billion euros. Conversely,the increase in treasury shares had a negative impact of 0.3 billioneuros, driven in particular by the share repurchase program set up in the fourth quarter. As of December 31, 2016, totalequity was equal to 47% of total assets, compared to 45% as ofyear-end 2015.
Gross borrowings after derivatives totaled 7.3 billion euros as of year-end 2016, representing a 0.9 billion euro decreasecompared to year-end 2015, mainly due to the significantdecrease in commercial paper outstanding for 1 billion euros.Bond debt was stable with regard to December 31, 2015, withthe fiscal year’s redemptions equal to issues. During the year,LVMH redeemed the bond issued in 2013 and the 2014 tapissue, for a total of 650 million euros. In February 2016, LVMHissued five-year synthetic convertible bonds redeemable in cash, for a 600 million US dollar bond, with a 150 millionUS dollar tap issue carried out in April 2016. Cash, cashequivalents, and current and non-current available for salefinancial assets used to hedge financial debt totaled 4.0 billioneuros at the end of the fiscal year, remaining stable with respectto year-end 2015.
As of year-end 2016, the Group’s undrawn confirmed creditlines amounted to 3.4 billion euros, substantially exceeding theoutstanding portion of its commercial paper program, whichcame to 1.2 billion euros as of December 31, 2016.
17Financial Documents - December 31, 2016
Comments on the consolidated balance sheet
BUSINESS REVIEW AND COMMENTS ON THE CONSOLIDATED FINANCIAL STATEMENTS OF LVMH GROUP
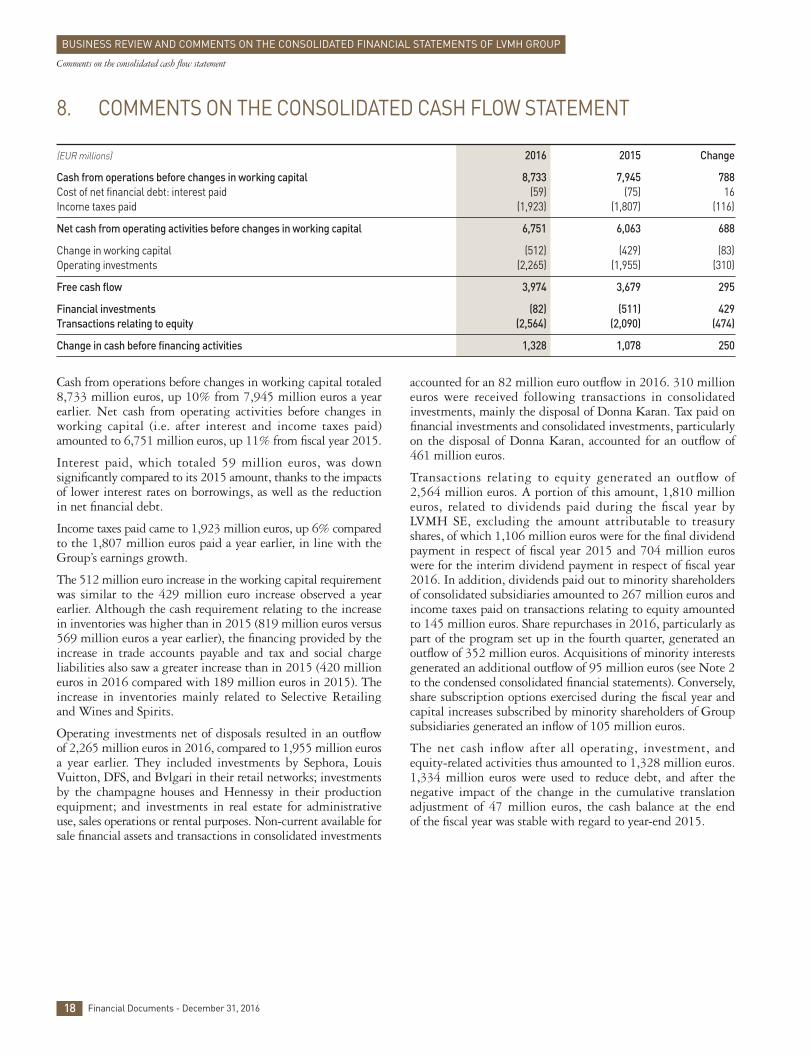
Cash from operations before changes in working capital totaled8,733 million euros, up 10% from 7,945 million euros a yearearlier. Net cash from operating activities before changes inworking capital (i.e. after interest and income taxes paid)amounted to 6,751 million euros, up 11% from fiscal year 2015.
Interest paid, which totaled 59 million euros, was downsignificantly compared to its 2015 amount, thanks to the impactsof lower interest rates on borrowings, as well as the reductionin net financial debt.
Income taxes paid came to 1,923 million euros, up 6% comparedto the 1,807 million euros paid a year earlier, in line with theGroup’s earnings growth.
The 512 million euro increase in the working capital requirementwas similar to the 429 million euro increase observed a yearearlier. Although the cash requirement relating to the increasein inventories was higher than in 2015 (819 million euros versus569 million euros a year earlier), the financing provided by theincrease in trade accounts payable and tax and social chargeliabilities also saw a greater increase than in 2015 (420 millioneuros in 2016 compared with 189 million euros in 2015). Theincrease in inventories mainly related to Selective Retailingand Wines and Spirits.
Operating investments net of disposals resulted in an outflowof 2,265 million euros in 2016, compared to 1,955 million eurosa year earlier. They included investments by Sephora, LouisVuitton, DFS, and Bvlgari in their retail networks; investmentsby the champagne houses and Hennessy in their productionequipment; and investments in real estate for administrativeuse, sales operations or rental purposes. Non-current available forsale financial assets and transactions in consolidated investments
accounted for an 82 million euro outflow in 2016. 310 millioneuros were received following transactions in consolidatedinvestments, mainly the disposal of Donna Karan. Tax paid onfinancial investments and consolidated investments, particularlyon the disposal of Donna Karan, accounted for an outflow of461 million euros.
Transactions relating to equity generated an outflow of2,564 million euros. A portion of this amount, 1,810 millioneuros, related to dividends paid during the fiscal year byLVMH SE, excluding the amount attributable to treasuryshares, of which 1,106 million euros were for the final dividendpayment in respect of fiscal year 2015 and 704 million euroswere for the interim dividend payment in respect of fiscal year2016. In addition, dividends paid out to minority shareholdersof consolidated subsidiaries amounted to 267 million euros andincome taxes paid on transactions relating to equity amountedto 145 million euros. Share repurchases in 2016, particularly aspart of the program set up in the fourth quarter, generated anoutflow of 352 million euros. Acquisitions of minority interestsgenerated an additional outflow of 95 million euros (see Note 2to the condensed consolidated financial statements). Conversely,share subscription options exercised during the fiscal year andcapital increases subscribed by minority shareholders of Groupsubsidiaries generated an inflow of 105 million euros.
The net cash inflow after all operating, investment, and equity-related activities thus amounted to 1,328 million euros.1,334 million euros were used to reduce debt, and after thenegative impact of the change in the cumulative translationadjustment of 47 million euros, the cash balance at the end of the fiscal year was stable with regard to year-end 2015.
8. COMMENTS ON THE CONSOLIDATED CASH FLOW STATEMENT
(EUR millions) 2016 2015 Change
Cash from operations before changes in working capital 8,733 7,945 788Cost of net financial debt: interest paid (59) (75) 16Income taxes paid (1,923) (1,807) (116)
Net cash from operating activities before changes in working capital 6,751 6,063 688
Change in working capital (512) (429) (83)Operating investments (2,265) (1,955) (310)
Free cash flow 3,974 3,679 295
Financial investments (82) (511) 429Transactions relating to equity (2,564) (2,090) (474)
Change in cash before financing activities 1,328 1,078 250
18 Financial Documents - December 31, 2016
Comments on the consolidated cash flow statement
BUSINESS REVIEW AND COMMENTS ON THE CONSOLIDATED FINANCIAL STATEMENTS OF LVMH GROUP
19Financial Documents - December 31, 2016
CONDENSED CONSOLIDATED FINANCIAL STATEMENTS
CONSOLIDATED INCOME STATEMENT 20CONSOLIDATED STATEMENT OF COMPREHENSIVE GAINS AND LOSSES 21CONSOLIDATED BALANCE SHEET 22CONSOLIDATED STATEMENT OF CHANGES IN EQUITY 23CONSOLIDATED CASH FLOW STATEMENT 24SELECTED NOTES TO THE CONSOLIDATED FINANCIAL STATEMENTS 25
20 Financial Documents - December 31, 2016
CONDENSED CONSOLIDATED FINANCIAL STATEMENTS
CONSOLIDATED INCOME STATEMENT
(EUR millions, except for earnings per share) Notes 2016 2015 2014
Revenue 23 37,600 35,664 30,638Cost of sales (13,039) (12,553) (10,801)
Gross margin 24,561 23,111 19,837
Marketing and selling expenses (14,607) (13,830) (11,744)General and administrative expenses (2,931) (2,663) (2,373)Income (loss) from joint ventures and associates 7 3 (13) (5)
Profit from recurring operations 23-24 7,026 6,605 5,715
Other operating income and expenses 25 (122) (221) (284)
Operating profit 6,904 6,384 5,431
Cost of net financial debt (83) (78) (115)Other financial income and expenses (349) (336) 3,062
Net financial income (expense) 26 (432) (414) 2,947
Income taxes 27 (2,109) (1,969) (2,273)
Net profit before minority interests 4,363 4,001 6,105
Minority interests 17 (382) (428) (457)
Net profit, Group share 3,981 3,573 5,648
Basic Group share of net earnings per share (EUR) 28 7.92 7.11 11.27Number of shares on which the calculation is based 502,911,125 502,395,491 501,309,369
Diluted Group share of net earnings per share (EUR) 28 7.89 7.08 11.21Number of shares on which the calculation is based 504,640,459 504,894,946 503,861,733
21Financial Documents - December 31, 2016
CONDENSED CONSOLIDATED FINANCIAL STATEMENTS
CONSOLIDATED STATEMENT OF COMPREHENSIVE GAINS AND LOSSES
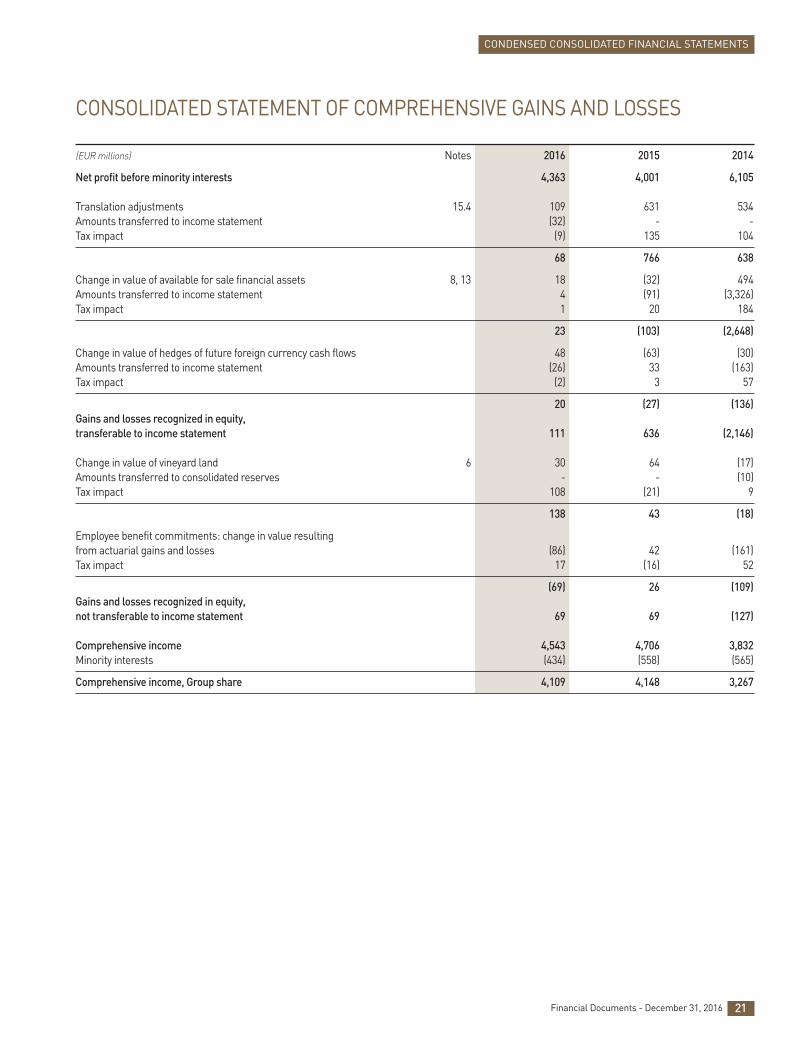
(EUR millions) Notes 2016 2015 2014
Net profit before minority interests 4,363 4,001 6,105
Translation adjustments 15.4 109 631 534Amounts transferred to income statement (32) - -Tax impact (9) 135 104
68 766 638
Change in value of available for sale financial assets 8, 13 18 (32) 494Amounts transferred to income statement 4 (91) (3,326)Tax impact 1 20 184
23 (103) (2,648)
Change in value of hedges of future foreign currency cash flows 48 (63) (30)Amounts transferred to income statement (26) 33 (163)Tax impact (2) 3 57
20 (27) (136)Gains and losses recognized in equity, transferable to income statement 111 636 (2,146)
Change in value of vineyard land 6 30 64 (17)Amounts transferred to consolidated reserves - - (10)Tax impact 108 (21) 9
138 43 (18)
Employee benefit commitments: change in value resulting from actuarial gains and losses (86) 42 (161)Tax impact 17 (16) 52
(69) 26 (109)Gains and losses recognized in equity, not transferable to income statement 69 69 (127)
Comprehensive income 4,543 4,706 3,832Minority interests (434) (558) (565)
Comprehensive income, Group share 4,109 4,148 3,267
22 Financial Documents - December 31, 2016
CONDENSED CONSOLIDATED FINANCIAL STATEMENTS
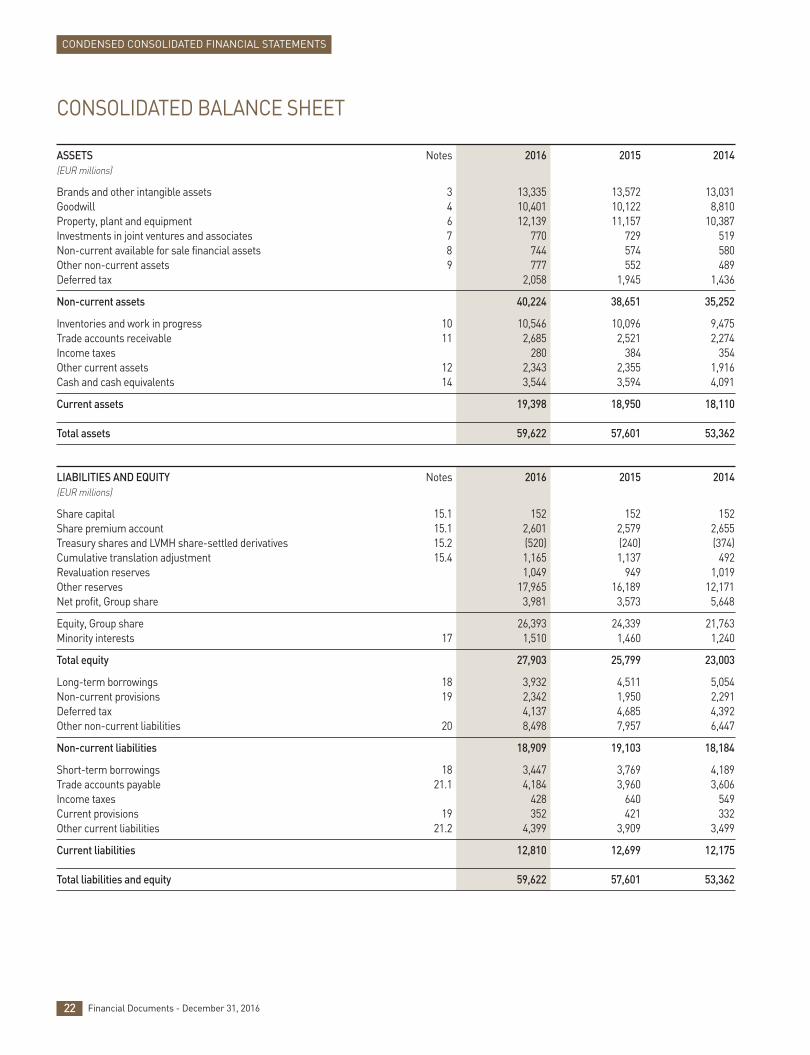
CONSOLIDATED BALANCE SHEET
ASSETS Notes 2016 2015 2014(EUR millions)
Brands and other intangible assets 3 13,335 13,572 13,031Goodwill 4 10,401 10,122 8,810Property, plant and equipment 6 12,139 11,157 10,387Investments in joint ventures and associates 7 770 729 519Non-current available for sale financial assets 8 744 574 580Other non-current assets 9 777 552 489Deferred tax 2,058 1,945 1,436
Non-current assets 40,224 38,651 35,252
Inventories and work in progress 10 10,546 10,096 9,475Trade accounts receivable 11 2,685 2,521 2,274Income taxes 280 384 354Other current assets 12 2,343 2,355 1,916Cash and cash equivalents 14 3,544 3,594 4,091
Current assets 19,398 18,950 18,110
Total assets 59,622 57,601 53,362
LIABILITIES AND EQUITY Notes 2016 2015 20 14(EUR millions)
Share capital 15.1 152 152 152Share premium account 15.1 2,601 2,579 2,655Treasury shares and LVMH share-settled derivatives 15.2 (520) (240) (374)Cumulative translation adjustment 15.4 1,165 1,137 492Revaluation reserves 1,049 949 1,019Other reserves 17,965 16,189 12,171Net profit, Group share 3,981 3,573 5,648
Equity, Group share 26,393 24,339 21,763Minority interests 17 1,510 1,460 1,240
Total equity 27,903 25,799 23,003
Long-term borrowings 18 3,932 4,511 5,054Non-current provisions 19 2,342 1,950 2,291Deferred tax 4,137 4,685 4,392Other non-current liabilities 20 8,498 7,957 6,447
Non-current liabilities 18,909 19,103 18,184
Short-term borrowings 18 3,447 3,769 4,189Trade accounts payable 21.1 4,184 3,960 3,606Income taxes 428 640 549Current provisions 19 352 421 332Other current liabilities 21.2 4,399 3,909 3,499
Current liabilities 12,810 12,699 12,175
Total liabilities and equity 59,622 57,601 53,362
23Financial Documents - December 31, 2016
CONDENSED CONSOLIDATED FINANCIAL STATEMENTS
23
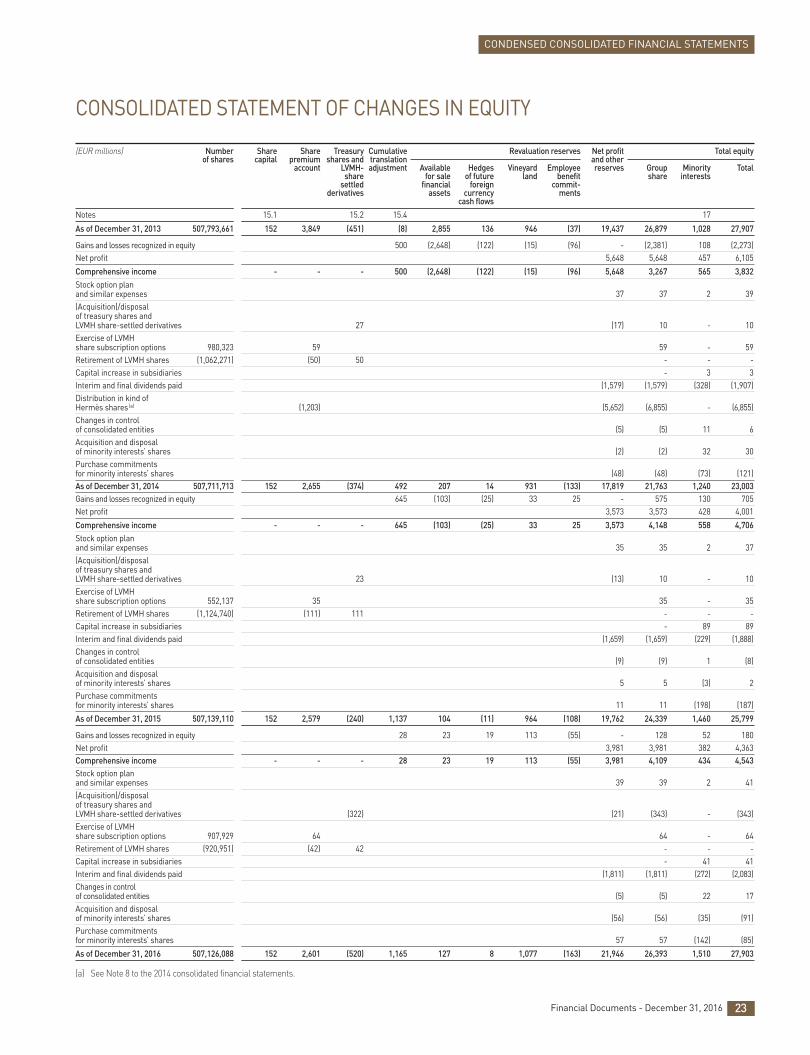
CONSOLIDATED STATEMENT OF CHANGES IN EQUITY
(EUR millions) Number Share Share Treasury Cumulative Revaluation reserves Net profit Total equity of shares capital premium shares and translation and other account LVMH- adjustment Available Hedges Vineyard Employee reserves Group Minority Total share for sale of future land benefit share interests settled financial foreign commit-
derivatives assets currency ments cash flows
Notes 15.1 15.2 15.4 17
As of December 31, 2013 507,793,661 152 3,849 (451) (8) 2,855 136 946 (37) 19,437 26,879 1,028 27,907
Gains and losses recognized in equity 500 (2,648) (122) (15) (96) - (2,381) 108 (2,273)Net profit 5,648 5,648 457 6,105
Comprehensive income - - - 500 (2,648) (122) (15) (96) 5,648 3,267 565 3,832Stock option plan and similar expenses 37 37 2 39(Acquisition) / disposal of treasury shares and LVMH share-settled derivatives 27 (17) 10 - 10Exercise of LVMH share subscription options 980,323 59 59 - 59Retirement of LVMH shares (1,062,271) (50) 50 - - -Capital increase in subsidiaries - 3 3Interim and final dividends paid (1,579) (1,579) (328) (1,907)Distribution in kind of Hermès shares(a) (1,203) (5,652) (6,855) - (6,855)Changes in control of consolidated entities (5) (5) 11 6Acquisition and disposal of minority interests’ shares (2) (2) 32 30Purchase commitments for minority interests’ shares (48) (48) (73) (121)As of December 31, 2014 507,711,713 152 2,655 (374) 492 207 14 931 (133) 17,819 21,763 1,240 23,003Gains and losses recognized in equity 645 (103) (25) 33 25 - 575 130 705Net profit 3,573 3,573 428 4,001
Comprehensive income - - - 645 (103) (25) 33 25 3,573 4,148 558 4,706Stock option plan and similar expenses 35 35 2 37(Acquisition) / disposal of treasury shares and LVMH share-settled derivatives 23 (13) 10 - 10Exercise of LVMH share subscription options 552,137 35 35 - 35Retirement of LVMH shares (1,124,740) (111) 111 - - -Capital increase in subsidiaries - 89 89Interim and final dividends paid (1,659) (1,659) (229) (1,888)Changes in control of consolidated entities (9) (9) 1 (8)Acquisition and disposal of minority interests’ shares 5 5 (3) 2Purchase commitments for minority interests’ shares 11 11 (198) (187)
As of December 31, 2015 507,139,110 152 2,579 (240) 1,137 104 (11) 964 (108) 19,762 24,339 1,460 25,799
Gains and losses recognized in equity 28 23 19 113 (55) - 128 52 180Net profit 3,981 3,981 382 4,363Comprehensive income - - - 28 23 19 113 (55) 3,981 4,109 434 4,543Stock option plan and similar expenses 39 39 2 41(Acquisition) / disposal of treasury shares and LVMH share-settled derivatives (322) (21) (343) - (343)Exercise of LVMH share subscription options 907,929 64 64 - 64Retirement of LVMH shares (920,951) (42) 42 - - -Capital increase in subsidiaries - 41 41Interim and final dividends paid (1,811) (1,811) (272) (2,083)Changes in control of consolidated entities (5) (5) 22 17Acquisition and disposal of minority interests’ shares (56) (56) (35) (91)Purchase commitments for minority interests’ shares 57 57 (142) (85)
As of December 31, 2016 507,126,088 152 2,601 (520) 1,165 127 8 1,077 (163) 21,946 26,393 1,510 27,903
(a) See Note 8 to the 2014 consolidated financial statements.
24 Financial Documents - December 31, 2016
CONDENSED CONSOLIDATED FINANCIAL STATEMENTS
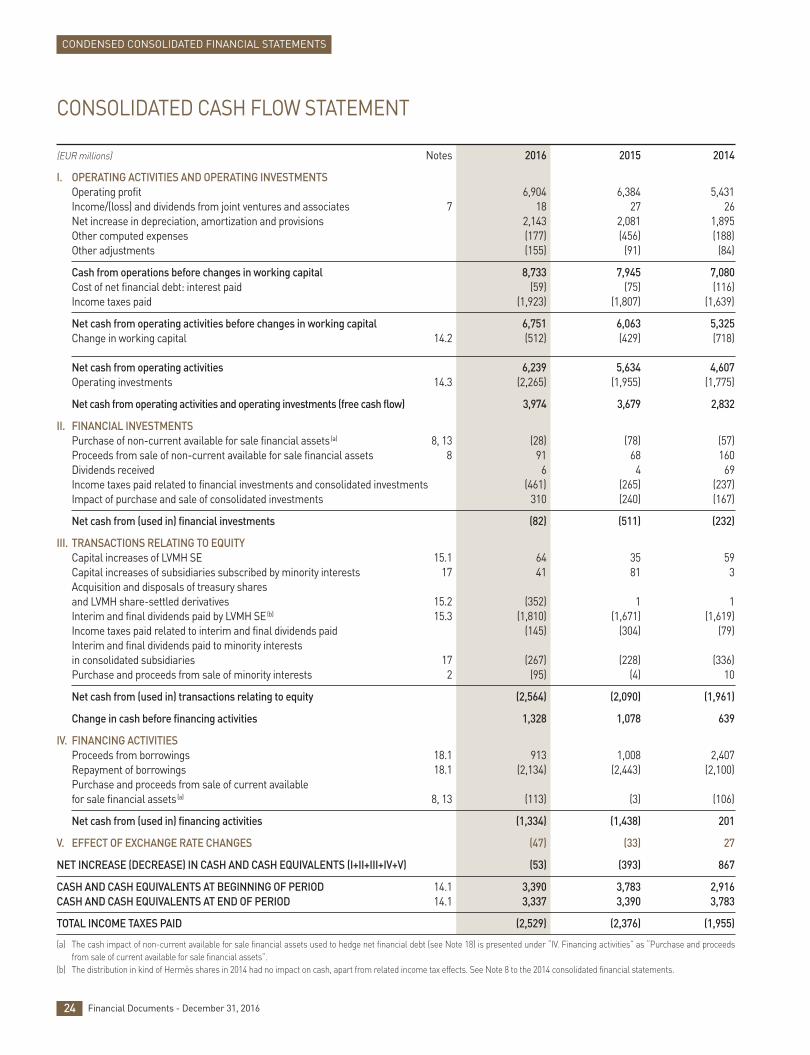
CONSOLIDATED CASH FLOW STATEMENT
(EUR millions) Notes 2016 2015 2014
I. OPERATING ACTIVITIES AND OPERATING INVESTMENTSOperating profit 6,904 6,384 5,431Income / (loss) and dividends from joint ventures and associates 7 18 27 26Net increase in depreciation, amortization and provisions 2,143 2,081 1,895Other computed expenses (177) (456) (188)Other adjustments (155) (91) (84)
Cash from operations before changes in working capital 8,733 7,945 7,080Cost of net financial debt: interest paid (59) (75) (116)Income taxes paid (1,923) (1,807) (1,639)
Net cash from operating activities before changes in working capital 6,751 6,063 5,325Change in working capital 14.2 (512) (429) (718)
Net cash from operating activities 6,239 5,634 4,607Operating investments 14.3 (2,265) (1,955) (1,775)
Net cash from operating activities and operating investments (free cash flow) 3,974 3,679 2,832
II. FINANCIAL INVESTMENTS Purchase of non-current available for sale financial assets(a) 8, 13 (28) (78) (57)Proceeds from sale of non-current available for sale financial assets 8 91 68 160Dividends received 6 4 69Income taxes paid related to financial investments and consolidated investments (461) (265) (237)Impact of purchase and sale of consolidated investments 310 (240) (167)
Net cash from (used in) financial investments (82) (511) (232)
III. TRANSACTIONS RELATING TO EQUITY Capital increases of LVMH SE 15.1 64 35 59Capital increases of subsidiaries subscribed by minority interests 17 41 81 3Acquisition and disposals of treasury shares and LVMH share-settled derivatives 15.2 (352) 1 1Interim and final dividends paid by LVMH SE(b) 15.3 (1,810) (1,671) (1,619)Income taxes paid related to interim and final dividends paid (145) (304) (79)Interim and final dividends paid to minority interestsin consolidated subsidiaries 17 (267) (228) (336)Purchase and proceeds from sale of minority interests 2 (95) (4) 10
Net cash from (used in) transactions relating to equity (2,564) (2,090) (1,961)
Change in cash before financing activities 1,328 1,078 639
IV. FINANCING ACTIVITIES Proceeds from borrowings 18.1 913 1,008 2,407Repayment of borrowings 18.1 (2,134) (2,443) (2,100)Purchase and proceeds from sale of current available for sale financial assets(a) 8, 13 (113) (3) (106)
Net cash from (used in) financing activities (1,334) (1,438) 201
V. EFFECT OF EXCHANGE RATE CHANGES (47) (33) 27
NET INCREASE (DECREASE) IN CASH AND CASH EQUIVALENTS (I+II+III+IV+V) (53) (393) 867
CASH AND CASH EQUIVALENTS AT BEGINNING OF PERIOD 14.1 3,390 3,783 2,916CASH AND CASH EQUIVALENTS AT END OF PERIOD 14.1 3,337 3,390 3,783
TOTAL INCOME TAXES PAID (2,529) (2,376) (1,955)
(a) The cash impact of non-current available for sale financial assets used to hedge net financial debt (see Note 18) is presented under “IV. Financing activities” as “Purchase and proceedsfrom sale of current available for sale financial assets”.
(b) The distribution in kind of Hermès shares in 2014 had no impact on cash, apart from related income tax effects. See Note 8 to the 2014 consolidated financial statements.
SELECTED NOTES TO THE CONSOLIDATED FINANCIAL STATEMENTS
1. ACCOUNTING POLICIES 262. CHANGES IN OWNERSHIP INTERESTS IN CONSOLIDATED ENTITIES 343. BRANDS AND OTHER INTANGIBLE ASSETS 344. GOODWILL 355. IMPAIRMENT TESTING OF INTANGIBLE ASSETS WITH INDEFINITE USEFUL LIVES 366. PROPERTY, PLANT AND EQUIPMENT 367. INVESTMENTS IN JOINT VENTURES AND ASSOCIATES 388. NON-CURRENT AVAILABLE FOR SALE FINANCIAL ASSETS 389. OTHER NON-CURRENT ASSETS 3910. INVENTORIES AND WORK IN PROGRESS 3911. TRADE ACCOUNTS RECEIVABLE 4012. OTHER CURRENT ASSETS 4113. CURRENT AVAILABLE FOR SALE FINANCIAL ASSETS 4114. CASH FLOW STATEMENT 4215. EQUITY 4316. STOCK OPTION AND SIMILAR PLANS 4517. MINORITY INTERESTS 4618. BORROWINGS 4719. PROVISIONS 4920. OTHER NON-CURRENT LIABILITIES 4921. TRADE ACCOUNTS PAYABLE AND OTHER CURRENT LIABILITIES 5022. FINANCIAL INSTRUMENTS AND MARKET RISK MANAGEMENT 5123. SEGMENT INFORMATION 5424. EXPENSES BY NATURE 5725. OTHER OPERATING INCOME AND EXPENSES 5726. NET FINANCIAL INCOME / (EXPENSE) 5827. INCOME TAXES 5828. EARNINGS PER SHARE 5929. PROVISIONS FOR PENSIONS, CONTRIBUTION TO MEDICAL COSTS
AND OTHER EMPLOYEE BENEFIT COMMITMENTS 6030. OFF-BALANCE SHEET COMMITMENTS 6031. EXCEPTIONAL EVENTS AND LITIGATION 6232. SUBSEQUENT EVENTS 62
25Financial Documents - December 31, 2016
Definitions of Profit from recurring operations and Other operating income and expenses
The Group’s main business is the management and developmentof its brands and trade names. Profit from recurring operationsis derived from these activities, whether they are recurring ornon-recurring, core or incidental transactions.
“Other operating income and expenses” comprises incomestatement items, which – due to their nature, amount orfrequency – may not be considered inherent to the Group’srecurring operations or its profit from recurring operations.This caption reflects in particular the impact of changes in the scope of consolidation, the impairment of goodwill and
1.4. Presentation of the financial statements
The first accounts prepared by the Group in accordance withIFRS were the financial statements for the year endedDecember 31, 2005, with a transition date of January 1, 2004.IFRS 1 allowed for exceptions to the retrospective applicationof IFRS at the transition date. The procedures implemented by the Group with respect to these exceptions are as follows:
- business combinations: the exemption from retrospectiveapplication was not applied. The recognition of the merger ofMoët Hennessy and Louis Vuitton in 1987 and all subsequent
acquisitions were restated in accordance with IFRS 3; IAS 36Impairment of Assets and IAS 38 Intangible Assets wereapplied retrospectively as of that date;
- foreign currency translation of the financial statements ofsubsidiaries outside the eurozone: translation reserves relatingto the consolidation of subsidiaries that prepare their accountsin foreign currency were reset to zero as of January 1, 2004and offset against “Other reserves”.
1.3. First-time adoption of IFRS
Standards, amendments and interpretationsfor which application became mandatory in 2016
The amendments to IAS 16 and IAS 41 for biological assets arethe only new standards applicable to LVMH with effect fromJanuary 1, 2016. The application of these amendments has nothad any impact on the Group’s financial statements; LVMH doesnot revalue these assets, given that their market value differslittle from their historical cost (see Note 1.13).
Other changes in the accounting framework and standards for which application will become mandatory laterthan January 1, 2017
The Group is following the ongoing discussions held at IFRICand IASB related to the recognition of purchase commitmentsfor minority interests’ shares and changes in their amount. SeeNote 1.12 for a description of the recognition method appliedby LVMH to these commitments.
The impact of the application of IFRS 15 on revenue recognitionwith effect from January 1, 2018 is being assessed. It should beof little significance in light of the nature of the Group’s businessactivities. The impact of the application of IFRS 9 on financialinstruments with effect from January 1, 2018 is also beingassessed.
The Group has begun the process of applying IFRS 16 Leases,applicable with effect from January 1, 2019 (subject to itsadoption by the European Union). The approximate impact on the balance sheet of the first-time adoption of IFRS 16 maybe assessed based on the amount of lease commitments asof December 31, 2016, i.e. 10 billion euros. See Note 30.
1.2. Changes in the accounting framework applicable to LVMH
The consolidated financial statements for the fiscal year endedDecember 31, 2016 were established in accordance with the international accounting standards and interpretations(IAS / IFRS) adopted by the European Union and applicable onDecember 31, 2016. These standards and interpretations havebeen applied consistently to the fiscal years presented. The 2016consolidated financial statements were approved for publicationby the Board of Directors on January 26, 2017.
The consolidated financial statements presented are "condensed”,which means that they only include notes that are significantor facilitate understanding of changes in the Group’s businessactivity and financial position during the year. They are extractedfrom the consolidated financial statements approved by theBoard of Directors, which include all of the notes to the financialstatements required under IFRS, as adopted in the EuropeanUnion.
1. ACCOUNTING POLICIES
1.1. General framework and environment
26 Financial Documents - December 31, 2016
CONDENSED CONSOLIDATED FINANCIAL STATEMENTS
Selected notes to the consolidated financial statements
Transactions of consolidated companies denominated in acurrency other than their functional currencies are translated to their functional currencies at the exchange rates prevailingat the transaction dates.
Accounts receivable, accounts payable and debts denominatedin currencies other than the entities’ functional currencies aretranslated at the applicable exchange rates at the fiscal year-end.Gains and losses resulting from this translation are recognized:
- within cost of sales in the case of commercial transactions;
- within net financial income / expense in the case of financialtransactions.
Foreign exchange gains and losses arising from the translationor elimination of intercompany transactions or receivables andpayables denominated in currencies other than the entity’sfunctional currency are recorded in the income statement unlessthey relate to long-term intercompany financing transactions,which can be considered as transactions relating to equity. In the latter case, translation adjustments are recorded in equityunder “Cumulative translation adjustment.”
1.8. Foreign currency transactions and hedging of exchange rate risks
The consolidated financial statements are presented in euros;the financial statements of entities presented in a differentfunctional currency are translated into euros:
- at the period-end exchange rates for balance sheet items;
- at the average rates for the period for income statement items.
Translation adjustments arising from the application of theserates are recorded in equity under “Cumulative translationadjustment”.
1.7. Foreign currency translation of the financial statements of entities outside the eurozone
The subsidiaries in which the Group holds a direct or indirectde facto or de jure controlling interest are fully consolidated.
Jointly controlled companies and companies where the Grouphas significant influence but no controlling interest are accountedfor using the equity method. Although jointly controlled,those entities are fully integrated within the Group’s operatingactivities. LVMH discloses their net profit, as well as that of
entities using the equity method (see Note 7), on a separate line,which forms part of profit from recurring operations.
The assets, liabilities, income, and expenses of the Wines andSpirits distribution subsidiaries held jointly with the Diageogroup are consolidated only in proportion to the LVMH group’sshare of operations (see Note 1.25).
1.6. Methods of consolidation
For the purpose of preparing the consolidated financial statements,the measurement of certain balance sheet and income statementitems requires the use of hypotheses, estimates or other forms ofjudgment. This is particularly true of the valuation of intangibleassets (see Note 5), the measurement of purchase commitmentsfor minority interests’ shares (see Note 20), and the determinationof the amount of provisions for contingencies and losses
(see Note 19) or for impairment of inventories (see Note 10)and, if applicable, deferred tax assets (see Note 27). Suchhypotheses, estimates or other forms of judgment which areundertaken on the basis of the information available, or situationsprevalent at the date of preparation of the financial statements,may prove different from the subsequent actual events.
1.5. Use of estimates
the impairment and amortization of brands and trade names, as well as any significant amount of gains or losses arising onthe disposal of fixed assets, restructuring costs, costs in respectof disputes, or any other non-recurring income or expense whichmay otherwise distort the comparability of profit from recurringoperations from one period to the next.
Cash flow statement
Net cash from operating activities is determined on the basis ofoperating profit, adjusted for non-cash transactions. In addition:
- dividends received are presented according to the nature of theunderlying investments; thus, dividends from joint ventures
and associates are presented in Net cash from operatingactivities, while dividends from other unconsolidated entitiesare presented in Net cash from financial investments;
- tax paid is presented according to the nature of the transactionfrom which it arises: in Net cash from operating activities forthe portion attributable to operating transactions; in Netcash from financial investments for the portion attributableto transactions in available for sale financial assets, notably taxpaid on gains from their sale; in Net cash from transactionsrelating to equity for the portion attributable to transactionsin equity, notably distribution taxes arising on the paymentof dividends.
27Financial Documents - December 31, 2016
CONDENSED CONSOLIDATED FINANCIAL STATEMENTS
Selected notes to the consolidated financial statements
Only acquired brands and trade names that are well known andindividually identifiable are recorded as assets based on theirmarket values at their dates of acquisition.
Brands and trade names are chiefly valued using the forecastdiscounted cash flow method or based on comparable transactions(i.e. using the revenue and net profit coefficients employed forrecent transactions involving similar brands) or stock marketmultiples observed for related businesses. Other complementarymethods may also be employed: the relief from royalty method,involving equating a brand’s value with the present value of the
royalties required to be paid for its use; the margin differentialmethod, applicable when a measurable difference can beidentified in the amount of revenue generated by a brandedproduct in comparison with a similar unbranded product; andfinally the equivalent brand reconstitution method involving, inparticular, estimation of the amount of advertising and promotionexpenses required to generate a similar brand.
Costs incurred in creating a new brand or developing an existingbrand are expensed.
Approaches to determining fair value Amounts recorded at balance sheet date
Vineyard land Based on recent transactions in similar assets. See Note 1.13. Note 6
Grape harvests Based on purchase prices for equivalent grapes. See Note 1.16. Note 10
Derivatives Based on market data and according to commonly used valuation models. Note 22 See Note 1.21.
Borrowings hedged against changes Based on market data and according to commonly used valuation models. Note 18in value due to interest rate fluctuations See Note 1.20.
Liabilities in respect of purchase Generally based on the market multiples of comparable companies. Note 20commitments for minority interests’ See Note 1.12. shares priced according to fair value
Available for sale financial assets Quoted investments: price quotations at the close of trading Note 8, Note 13 on the balance sheet date. Non-quoted investments: estimated net realizable value, either according to formulas based on market data or based on private quotations. See Note 1.15.
Cash and cash equivalents Based on the liquidation value at the balance sheet date. See Note 1.18. Note 14(SICAV and FCP money market funds)
No other asset or liability has been remeasured at market value at the balance sheet date.
1.10. Brands and other intangible assets
Fair value (or market value) is the price that would be obtainedfrom the sale of an asset or paid to transfer a liability in an orderlytransaction between market participants.
The assets and liabilities measured at fair value at each balancesheet date are as follows:
1.9. Fair value measurement
28 Financial Documents - December 31, 2016
CONDENSED CONSOLIDATED FINANCIAL STATEMENTS
Selected notes to the consolidated financial statements
Derivatives that are designated as hedges of commercial transactionsdenominated in a currency other than the functional currencyof the entity are recognized in the balance sheet at their marketvalue (see Note 1.9) at the fiscal year-end, and any change inthe market value of such derivatives is recognized:
- within cost of sales for the effective portion of hedges ofreceivables and payables recognized in the balance sheet atthe end of the period;
- within equity (as “Revaluation reserves”) for the effectiveportion of hedges of future cash flows (this part is transferredto cost of sales at the time of recognition of the hedged assetsand liabilities);
- within net financial income / expense for the ineffective portionof hedges; changes in the value of discount and premium
associated with forward contracts, as well as in the time valuecomponent of options, are systematically considered as ineffectiveportions.
When derivatives are designated as hedges of subsidiaries’ equitydenominated in a functional currency other than the euro (net investment hedge), any change in fair value of the derivativesis recognized within equity under “Cumulative translationadjustment” for the effective portion and within net financialincome / expense for the ineffective portion.
Market value changes of derivatives not designated as hedgesare recorded within net financial income / expense.
See also Note 1.21 regarding the definition of the concepts ofeffective and ineffective portions.
With the exception of vineyard land, the gross value of property,plant and equipment is stated at acquisition cost. Any borrowingcosts incurred prior to the placed-in-service date or during theconstruction period of assets are capitalized.
Vineyard land is recognized at the market value at the balancesheet date. This valuation is based on official published data forrecent transactions in the same region. Any difference comparedto historical cost is recognized within equity in “Revaluationreserves”. If market value falls below acquisition cost theresulting impairment is charged to the income statement.
1.13. Property, plant and equipment
The Group has granted put options to minority shareholders of certain fully consolidated subsidiaries.
Pending specific guidance from IFRSs regarding this issue, the Group recognizes these commitments as follows:
- the value of the commitment at the balance sheet date appearsin “Other non-current liabilities”;
- the corresponding minority interests are cancelled;
- for commitments granted prior to January 1, 2010, the differencebetween the amount of the commitments and cancelledminority interests is maintained as an asset on the balancesheet under goodwill, as well as subsequent changes in thisdifference. For commitments granted as from January 1, 2010,the difference between the amount of the commitments andminority interests is recorded in equity, under “Other reserves”.
This recognition method has no effect on the presentation ofminority interests within the income statement.
1.12. Purchase commitments for minority interests’ shares
When the Group takes de jure or de facto control of a business,its assets, liabilities and contingent liabilities are estimated at their market value as of the date when control is obtainedand the difference between the cost of taking control and theGroup’s share of the market value of those assets, liabilities andcontingent liabilities is recognized as goodwill.
The cost of taking control is the price paid by the Group in thecontext of an acquisition, or an estimate of this price if thetransaction is carried out without any payment of cash, excludingacquisition costs, which are disclosed under “Other operatingincome and expenses”.
The difference between the carrying amount of minority interestspurchased after control is obtained and the price paid for theiracquisition is deducted from equity.
Goodwill is accounted for in the functional currency of theacquired entity.
Goodwill is not amortized but is subject to annual impairmenttesting using the methodology described in Note 1.14. Anyimpairment expense recognized is included within “Otheroperating income and expenses”.
1.11. Changes in ownership interests in consolidated entities
Brands, trade names and other intangible assets with finiteuseful lives are amortized over their estimated useful lives. Theclassification of a brand or trade name as an asset of definite orindefinite useful life is generally based on the following criteria:
- the brand or trade name’s overall positioning in its marketexpressed in terms of volume of activity, international presenceand reputation;
- its expected long-term profitability;
- its degree of exposure to changes in the economic environment;
- any major event within its business segment liable to compromiseits future development;
- its age.
Amortizable lives of brands and trade names with definite usefullives range from 15 to 40 years, depending on their estimatedperiod of utilization.
Any impairment expense of brands and trade names and, insome cases, amortization expense, are recognized within “Otheroperating income and expenses”.
Impairment tests are carried out for brands, trade names andother intangible assets using the methodology described inNote 1.14.
Research expenditure is not capitalized. New product developmentexpenditure is not capitalized unless the final decision has beenmade to launch the product.
Intangible assets other than brands and trade names are amortizedover the following periods:
- leasehold rights, key money: based on market conditions,generally over the lease period;
- rights attached to sponsorship agreements and mediapartnerships: over the life of the agreements, depending onhow the rights are used;
- development expenditure: three years at most;
- software, websites: one to five years.
29Financial Documents - December 31, 2016
CONDENSED CONSOLIDATED FINANCIAL STATEMENTS
Selected notes to the consolidated financial statements
Financial assets are classified as current or non-current based on their nature.
Non-current available for sale financial assets comprise strategicand non-strategic investments whose estimated period andform of ownership justify such classification.
Current available for sale financial assets (presented in “Othercurrent assets”; see Note 12) include temporary investments in shares, shares of SICAVs, FCPs and other mutual funds,excluding investments made as part of the daily cash management,which are accounted for as “Cash and cash equivalents” (see Note 1.18).
Available for sale financial assets are measured at their listedvalue at the fiscal year-end date in the case of quoted investments,and in the case of unquoted investments at their estimated net realizable value, assessed either according to formulas basedon market data or based on private quotations at the fiscal year-end date.
Positive or negative changes in value are taken to equity within“Revaluation reserves”. In the event of a lasting, significantimpairment loss, an impairment is recognized and charged tonet financial income / expense; the impairment is only reversedthrough the income statement at the time of sale of the underlyingavailable for sale financial assets.
1.15. Available for sale financial assets
Intangible and tangible fixed assets are subject to impairmenttesting whenever there is any indication that an asset may beimpaired (particularly following major changes in the asset’soperating conditions), and in any event at least annually in thecase of intangible assets with indefinite useful lives (mainlybrands, trade names and goodwill). When the carrying amountof assets with indefinite useful lives is greater than the higherof their value in use or market value, the resulting impairmentloss is recognized within “Other operating income and expenses”,allocated on a priority basis to any existing goodwill.
Value in use is based on the present value of the cash flowsexpected to be generated by these assets. Market value isestimated by comparison with recent similar transactions or onthe basis of valuations performed by independent experts forthe purposes of a disposal transaction.
Cash flows are forecast for each business segment, defined asone or several brands or trade names under the responsibility ofa dedicated management team. Smaller-scale cash-generating
units, such as a group of stores, may be distinguished within aparticular business segment.
The forecast data required for the cash flow method is based on annual budgets and multi-year business plans prepared bymanagement of the related business segments. Detailed forecastscover a five-year period, which may be extended in the case of certain brands undergoing strategic repositioning, or whichhave a production cycle exceeding five years. An estimatedterminal value is added to the value resulting from discountedforecast cash flows, which corresponds to the capitalization in perpetuity of cash flows most often arising from the last yearof the plan. Discount rates are set for each business group withreference to companies engaged in comparable businesses.Forecast cash flows are discounted on the basis of the rate ofreturn to be expected by an investor in the applicable businessand an assessment of the risk premium associated with thatbusiness. When several forecast scenarios are developed, theprobability of occurrence of each scenario is assessed.
1.14. Impairment testing of fixed assets
Vine stocks and vineyards for champagnes, cognacs and otherwines produced by the Group are considered biological assetsas defined in IAS 41 Agriculture. As their valuation at marketvalue differs little from that recognized at historical cost, norevaluation is undertaken for these assets.
Buildings mostly occupied by third parties are reported asinvestment property, at acquisition cost. Investment propertyis thus not remeasured at market value.
Assets acquired under finance leases are capitalized on the basisof the lower of their market value and the present value offuture lease payments.
The depreciable amount of property, plant and equipmentcomprises the acquisition cost of their components less residualvalue, which corresponds to the estimated disposal price of theasset at the end of its useful life.
Property, plant and equipment is depreciated on a straight-linebasis over its estimated useful life; the estimated useful livesare as follows:
- buildings including investment property 20 to 50 years;- machinery and equipment 3 to 25 years;- leasehold improvements 3 to 10 years;- producing vineyards 18 to 25 years.
Expenses for maintenance and repairs are charged to the incomestatement as incurred.
30 Financial Documents - December 31, 2016
CONDENSED CONSOLIDATED FINANCIAL STATEMENTS
Selected notes to the consolidated financial statements
Borrowings are measured at amortized cost, i.e. nominal valuenet of premium and issue expenses, which are chargedprogressively to net financial income / expense using the effectiveinterest method.
In the case of hedging against fluctuations in the value ofborrowings resulting from changes in interest rates, both thehedged amount of borrowings and the related hedging instrumentsare measured at their market value at the balance sheet date,with any changes in those values recognized within net financialincome / expense. Market value of hedged borrowings is determinedusing similar methods to those described in Note 1.21 below.
In the case of hedging against fluctuations in future interestpayments, the related borrowings remain measured at theiramortized cost while any changes in value of the effective hedgeportions are taken to equity as part of revaluation reserves.
Changes in value of non-hedging derivatives, and of theineffective portions of hedges, are recognized within netfinancial income / expense.
Net financial debt comprises short- and long-term borrowings,the market value at the balance sheet date of interest ratederivatives, less the amount at the balance sheet date of non-current available for sale financial assets used to hedge financialdebt, current available for sale financial assets, cash and cashequivalents, in addition to the market value at that date offoreign exchange derivatives related to any of the aforementioneditems.
See also Note 1.21 regarding the definition of the concepts ofeffective and ineffective portions.
1.20. Borrowings
A provision is recognized whenever an obligation exists towardsa third party resulting in a probable disbursement for the Group,the amount of which may be reliably estimated. See also Notes 1.23 and 19.
When execution of its obligation is expected to occur in morethan one year, the provision amount is discounted, the effectsof which are recognized in net financial income / expense usingthe effective interest rate method.
1.19. Provisions
Cash and cash equivalents comprise cash and highly liquidmoney-market investments subject to an insignificant risk ofchanges in value over time.
Money-market investments are measured at their market value, based on price quotations at the close of trading and on the exchange rate prevailing at the fiscal year-end date, with any changes in value recognized as part of net financialincome / expense.
1.18. Cash and cash equivalents
Trade accounts receivable, loans and other receivables are recordedat their face value. A provision for impairment is recorded if their net realizable value, based on the probability of theircollection, is less than their carrying amount.
The amount of long-term loans and receivables (i.e. those fallingdue in more than one year) is subject to discounting, the effectsof which are recognized under net financial income / expense,using the effective interest rate method.
1.17. Trade accounts receivable, loans and other receivables
Inventories other than wine produced by the Group are recordedat the lower of cost (excluding interest expense) and netrealizable value; cost comprises manufacturing cost (finishedgoods) or purchase price, plus incidental costs (raw materials,merchandise).
Wine produced by the Group, including champagne, is measuredon the basis of the applicable harvest market value, which is determined by reference to the average purchase price ofequivalent grapes, as if the grapes harvested had been purchasedfrom third parties. Until the date of the harvest, the value ofgrapes is calculated pro rata temporis on the basis of the estimatedyield and market value.
Inventories are valued using the weighted average cost or FIFOmethod, depending on the type of business.
Due to the length of the aging process required for champagneand spirits (cognac, whisky), the holding period for theseinventories generally exceeds one year. However, in accordancewith industry practices, these inventories are classified as currentassets.
Provisions for impairment of inventories are chiefly recognizedfor businesses other than Wines and Spirits. They are generallyrequired because of product obsolescence (end of season orcollection, expiration date approaching, etc.) or lack of salesprospects.
1.16. Inventories and work in progress
31Financial Documents - December 31, 2016
CONDENSED CONSOLIDATED FINANCIAL STATEMENTS
Selected notes to the consolidated financial statements
The tax expense comprises current tax payable by consolidatedcompanies and deferred tax resulting from temporary differences.
Deferred tax is recognized in respect of temporary differencesarising between the value of assets and liabilities for purposesof consolidation and the value resulting from application of tax regulations.
Deferred tax is measured on the basis of the income tax ratesenacted at the balance sheet date; the effect of changes in ratesis recognized during the periods in which changes are enacted.
Future tax savings from tax losses carried forward are recordedas deferred tax assets on the balance sheet which are impaired if they are deemed not recoverable; only amounts for whichfuture use is deemed probable are recognized.
Deferred tax assets and liabilities are not discounted.
Taxes payable in respect of the distribution of retained earningsof subsidiaries give rise to provisions if distribution is deemedprobable.
1.24. Current and deferred tax
When retirement indemnity plans, pension plans, contributionto medical costs and other commitments entail the payment bythe Group of contributions to third-party organizations whichassume the exclusive responsibility for subsequently paying theretirement indemnities, pensions or contribution to medicalcosts, these contributions are expensed in the period in whichthey fall due with no liability recorded on the balance sheet.
When retirement indemnity plans, pension plans, contributionto medical costs and other commitments are to be borne by the Group, a provision is recorded in the balance sheet in the amount of the corresponding actuarial commitment for theGroup. Changes in this provision are recognized as follows:
- the portion related to the cost of services rendered by employeesand net interest for the fiscal year is recognized in profit fromrecurring operations for the fiscal year;
- the portion related to changes in actuarial assumptions and todifferences between projected and actual data (experienceadjustments) is recognized in gains and losses taken to equity.
If this commitment is partially or wholly funded by paymentsmade by the Group to external financial organizations, thesededicated funds are deducted from the actuarial commitmentrecorded in the balance sheet.
The actuarial commitment is calculated based on assessmentsthat are specifically designed for the country and the Groupcompany concerned. In particular, these assessments includeassumptions regarding discount rates, salary increases, inflation,life expectancy and staff turnover.
1.23. Pensions, contribution to medical costs and other employee benefit commitments
LVMH shares and options to purchase LVMH shares that areheld by the Group are measured at their acquisition cost andrecognized as a deduction from consolidated equity, irrespectiveof the purpose for which they are held.
In the event of disposal, the cost of the shares disposed of isdetermined by allocation category (see Note 15.2) using theFIFO method with the exception of shares held under stockoption plans for which the calculation is performed for eachplan using the weighted average cost method. Gains and losseson disposal, net of income taxes, are taken directly to equity.
1.22. Treasury shares and LVMH share-settled derivatives
The Group enters into derivative transactions as part of itsstrategy for hedging foreign exchange, interest rate and goldprice risks.
IAS 39 subordinates the use of hedge accounting to demonstrationand documentation of the effectiveness of hedging relationshipswhen hedges are implemented and subsequently throughouttheir existence. A hedge is considered effective if the ratio ofchanges in the value of the derivative to changes in the value ofthe hedged underlying remains within a range of 80% to 125%.
Derivatives are recognized in the balance sheet at their marketvalue at the balance sheet date. Changes in their value areaccounted for as described in Note 1.8 in the case of foreignexchange hedges, and as described in Note 1.20 in the case ofinterest rate hedges.
Market value is based on market data and commonly usedvaluation models.
Derivatives with maturities in excess of twelve months aredisclosed as non-current assets and liabilities.
32 Financial Documents - December 31, 2016
CONDENSED CONSOLIDATED FINANCIAL STATEMENTS
Selected notes to the consolidated financial statements
1.21. Derivatives
Share purchase and subscription option plans give rise to therecognition of an expense based on the amortization of the expected gain for the recipients calculated according to theBlack & Scholes method on the basis of the closing share price onthe day before the board meeting at which the plan is instituted.
For bonus share plans, the expected gain is calculated on the basisof the closing share price on the day before the board meetingat which the plan is instituted, less the amount of dividendsexpected to accrue during the vesting period. A discount maybe applied to the value of the bonus shares thus calculated toaccount for a period of non-transferability, where applicable.
For all plans, the amortization expense is apportioned on astraight-line basis in the income statement over the vesting period,with a corresponding impact on reserves in the balance sheet.
For cash-settled compensation plans index-linked to the changein LVMH share price, the gain over the vesting period isestimated at each balance sheet date based on the LVMH shareprice at that date, and is charged to the income statement on apro rata basis over the vesting period, with a correspondingbalance sheet impact on provisions. Between that date and the settlement date, the change in the expected gain resultingfrom the change in the LVMH share price is recorded in theincome statement.
1.27. Stock option and similar plans
Advertising and promotion expenses include the costs of producingadvertising media, purchasing media space, manufacturingsamples and publishing catalogs, and in general, the cost of allactivities designed to promote the Group’s brands and products.
Advertising and promotion expenses are recorded withinmarketing and selling expenses upon receipt or production ofgoods or upon completion of services rendered.
1.26. Advertising and promotion expenses
Definition of revenue
Revenue mainly comprises retail sale within the Group’s storenetwork (including e-commerce websites) and sales throughagents and distributors. Sales made in stores owned by thirdparties are treated as retail transactions if the risks and rewardsof ownership of the inventories are retained by the Group.
Direct sales to customers are made through retail stores in Fashionand Leather Goods and Selective Retailing, as well as certainWatches and Jewelry and Perfumes and Cosmetics brands. Thesesales are recognized at the time of purchase by retail customers.
Wholesale sales essentially concern Wines and Spirits, as wellas certain Perfumes and Cosmetics and Watches and Jewelrybrands. The Group recognizes revenue when title transfers tothird-party customers, generally upon shipment.
Revenue includes shipment and transportation costs re-billedto customers only when these costs are included in products’selling prices as a lump sum.
Revenue is presented net of all forms of discount. In particular,payments made in order to have products referenced or, in accor -dance with agreements, to participate in advertising campaignswith the distributors, are deducted from related revenue.
Provisions for product returns
Perfumes and Cosmetics and, to a lesser extent, Fashion andLeather Goods and Watches and Jewelry companies may acceptthe return of unsold or outdated products from their customersand distributors.
Where this practice is applied, revenue and the correspondingtrade receivables are reduced by the estimated amount of suchreturns, and a corresponding entry is made to inventories. Theestimated rate of returns is based on statistics of historical returns.
Businesses undertaken in partnership with Diageo
A significant proportion of revenue for the Group’s Wines and Spirits businesses is generated within the framework ofdistribution agreements with Diageo generally taking the formof shared entities which sell and deliver both groups’ productsto customers; the income statement and balance sheet of theseentities is apportioned between the Group and Diageo basedon distribution agreements. According to those agreements,the assets, liabilities, income, and expenses of such entities are consolidated only in proportion to the Group’s share ofoperations. The application of IFRS 11 as from January 1, 2014has not had any impact on this method.
33Financial Documents - December 31, 2016
CONDENSED CONSOLIDATED FINANCIAL STATEMENTS
Selected notes to the consolidated financial statements
1.25. Revenue recognition
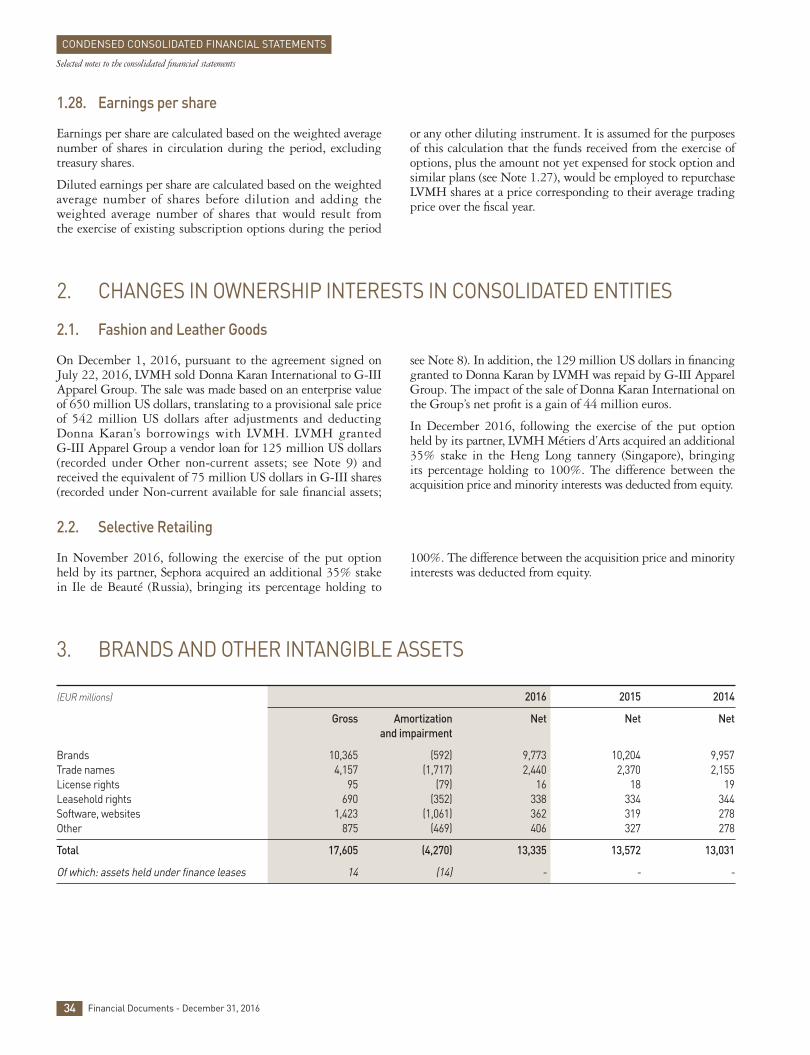
3. BRANDS AND OTHER INTANGIBLE ASSETS
(EUR millions) 2016 2015 2014
Gross Amortization Net Net Net and impairment
Brands 10,365 (592) 9,773 10,204 9,957Trade names 4,157 (1,717) 2,440 2,370 2,155License rights 95 (79) 16 18 19Leasehold rights 690 (352) 338 334 344Software, websites 1,423 (1,061) 362 319 278Other 875 (469) 406 327 278
Total 17,605 (4,270) 13,335 13,572 13,031
Of which: assets held under finance leases 14 (14) - - -
In November 2016, following the exercise of the put optionheld by its partner, Sephora acquired an additional 35% stakein Ile de Beauté (Russia), bringing its percentage holding to
100%. The difference between the acquisition price and minorityinterests was deducted from equity.
2.2. Selective Retailing
On December 1, 2016, pursuant to the agreement signed onJuly 22, 2016, LVMH sold Donna Karan International to G-IIIApparel Group. The sale was made based on an enterprise valueof 650 million US dollars, translating to a provisional sale priceof 542 million US dollars after adjustments and deductingDonna Karan’s borrowings with LVMH. LVMH granted G-III Apparel Group a vendor loan for 125 million US dollars(recorded under Other non-current assets; see Note 9) andreceived the equivalent of 75 million US dollars in G-III shares(recorded under Non-current available for sale financial assets;
see Note 8). In addition, the 129 million US dollars in financinggranted to Donna Karan by LVMH was repaid by G-III ApparelGroup. The impact of the sale of Donna Karan International onthe Group’s net profit is a gain of 44 million euros.
In December 2016, following the exercise of the put optionheld by its partner, LVMH Métiers d’Arts acquired an additional35% stake in the Heng Long tannery (Singapore), bringing its percentage holding to 100%. The difference between theacquisition price and minority interests was deducted from equity.
2. CHANGES IN OWNERSHIP INTERESTS IN CONSOLIDATED ENTITIES
2.1. Fashion and Leather Goods
Earnings per share are calculated based on the weighted averagenumber of shares in circulation during the period, excludingtreasury shares.
Diluted earnings per share are calculated based on the weightedaverage number of shares before dilution and adding theweighted average number of shares that would result from the exercise of existing subscription options during the period
or any other diluting instrument. It is assumed for the purposesof this calculation that the funds received from the exercise ofoptions, plus the amount not yet expensed for stock option andsimilar plans (see Note 1.27), would be employed to repurchaseLVMH shares at a price corresponding to their average tradingprice over the fiscal year.
1.28. Earnings per share
34 Financial Documents - December 31, 2016
CONDENSED CONSOLIDATED FINANCIAL STATEMENTS
Selected notes to the consolidated financial statements
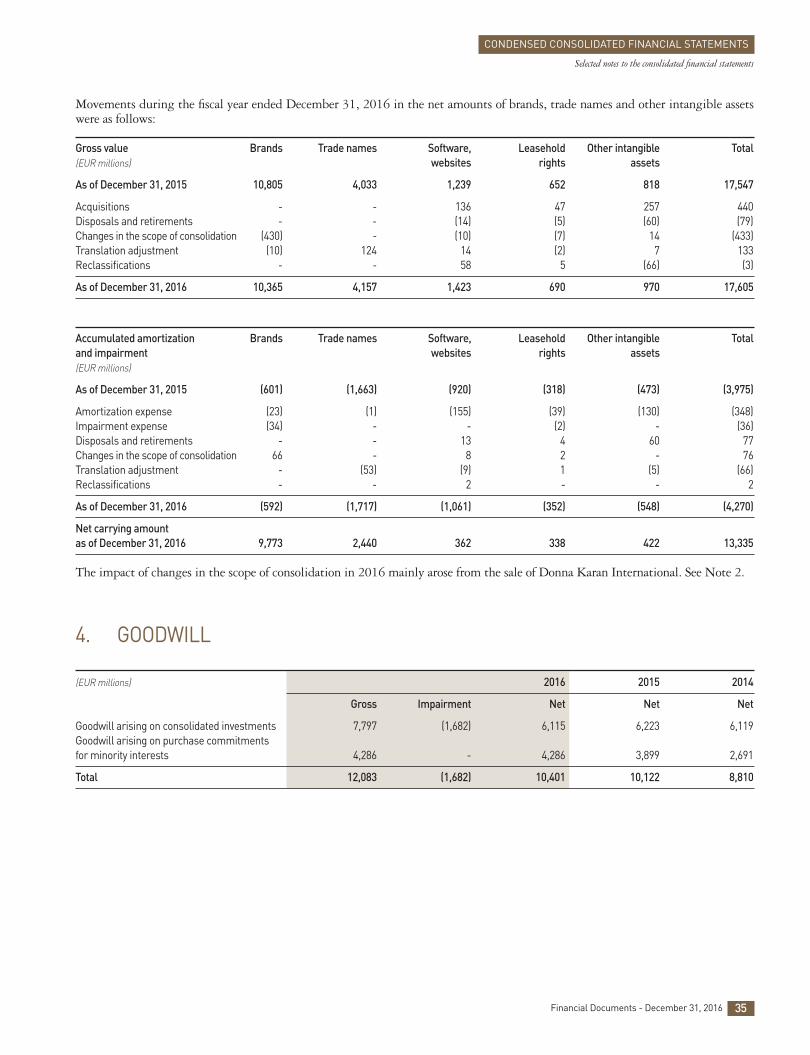
35Financial Documents - December 31, 2016
CONDENSED CONSOLIDATED FINANCIAL STATEMENTS
Selected notes to the consolidated financial statements
Movements during the fiscal year ended December 31, 2016 in the net amounts of brands, trade names and other intangible assetswere as follows:
Gross value Brands Trade names Software, Leasehold Other intangible Total(EUR millions) websites rights assets
As of December 31, 2015 10,805 4,033 1,239 652 818 17,547
Acquisitions - - 136 47 257 440Disposals and retirements - - (14) (5) (60) (79)Changes in the scope of consolidation (430) - (10) (7) 14 (433)Translation adjustment (10) 124 14 (2) 7 133Reclassifications - - 58 5 (66) (3)
As of December 31, 2016 10,365 4,157 1,423 690 970 17,605
Accumulated amortization Brands Trade names Software, Leasehold Other intangible Totaland impairment websites rights assets (EUR millions)
As of December 31, 2015 (601) (1,663) (920) (318) (473) (3,975)
Amortization expense (23) (1) (155) (39) (130) (348)Impairment expense (34) - - (2) - (36)Disposals and retirements - - 13 4 60 77Changes in the scope of consolidation 66 - 8 2 - 76Translation adjustment - (53) (9) 1 (5) (66)Reclassifications - - 2 - - 2
As of December 31, 2016 (592) (1,717) (1,061) (352) (548) (4,270)
Net carrying amount as of December 31, 2016 9,773 2,440 362 338 422 13,335
The impact of changes in the scope of consolidation in 2016 mainly arose from the sale of Donna Karan International. See Note 2.
4. GOODWILL
(EUR millions) 2016 2015 2014
Gross Impairment Net Net Net
Goodwill arising on consolidated investments 7,797 (1,682) 6,115 6,223 6,119Goodwill arising on purchase commitments for minority interests 4,286 - 4,286 3,899 2,691
Total 12,083 (1,682) 10,401 10,122 8,810
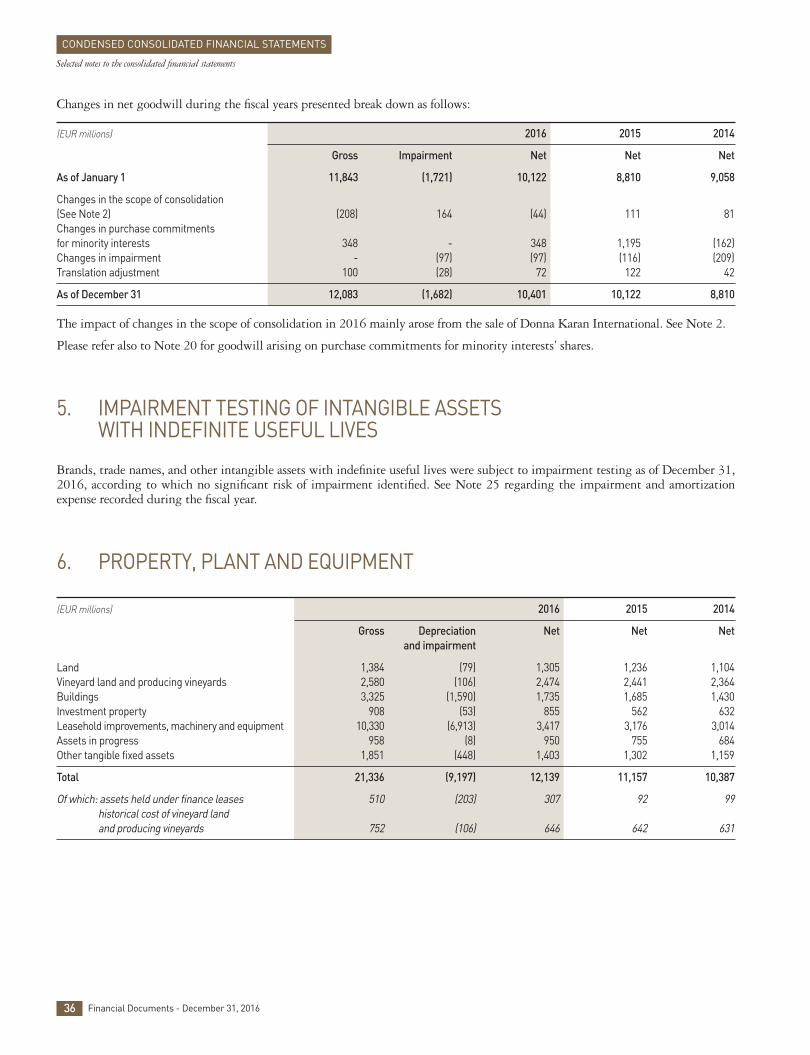
36 Financial Documents - December 31, 2016
CONDENSED CONSOLIDATED FINANCIAL STATEMENTS
Selected notes to the consolidated financial statements
Changes in net goodwill during the fiscal years presented break down as follows:
(EUR millions) 2016 2015 2014
Gross Impairment Net Net Net
As of January 1 11,843 (1,721) 10,122 8,810 9,058
Changes in the scope of consolidation (See Note 2) (208) 164 (44) 111 81Changes in purchase commitments for minority interests 348 - 348 1,195 (162)Changes in impairment - (97) (97) (116) (209)Translation adjustment 100 (28) 72 122 42
As of December 31 12,083 (1,682) 10,401 10,122 8,810
The impact of changes in the scope of consolidation in 2016 mainly arose from the sale of Donna Karan International. See Note 2.
Please refer also to Note 20 for goodwill arising on purchase commitments for minority interests’ shares.
5. IMPAIRMENT TESTING OF INTANGIBLE ASSETS WITH INDEFINITE USEFUL LIVES
Brands, trade names, and other intangible assets with indefinite useful lives were subject to impairment testing as of December 31,2016, according to which no significant risk of impairment identified. See Note 25 regarding the impairment and amortizationexpense recorded during the fiscal year.
6. PROPERTY, PLANT AND EQUIPMENT
(EUR millions) 2016 2015 2014
Gross Depreciation Net Net Net and impairment
Land 1,384 (79) 1,305 1,236 1,104Vineyard land and producing vineyards 2,580 (106) 2,474 2,441 2,364Buildings 3,325 (1,590) 1,735 1,685 1,430Investment property 908 (53) 855 562 632Leasehold improvements, machinery and equipment 10,330 (6,913) 3,417 3,176 3,014Assets in progress 958 (8) 950 755 684Other tangible fixed assets 1,851 (448) 1,403 1,302 1,159
Total 21,336 (9,197) 12,139 11,157 10,387
Of which: assets held under finance leases 510 (203) 307 92 99historical cost of vineyard land and producing vineyards 752 (106) 646 642 631
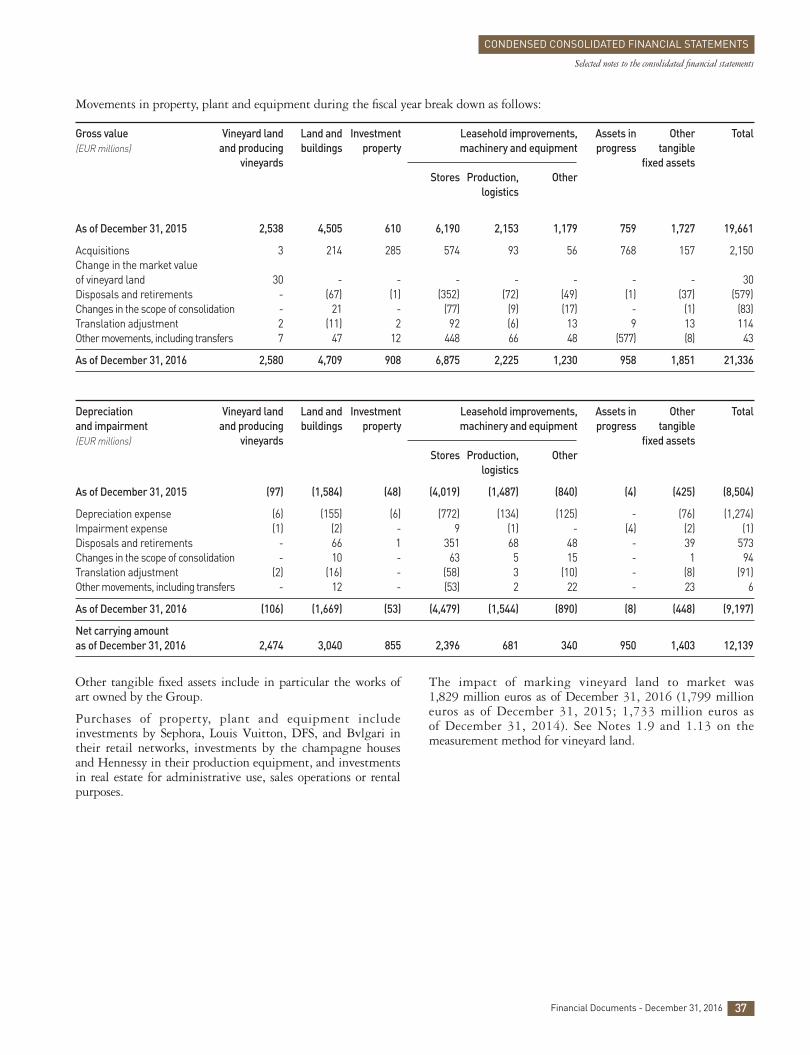
Other tangible fixed assets include in particular the works ofart owned by the Group.
Purchases of property, plant and equipment includeinvestments by Sephora, Louis Vuitton, DFS, and Bvlgari intheir retail networks, investments by the champagne housesand Hennessy in their production equipment, and investmentsin real estate for administrative use, sales operations or rentalpurposes.
The impact of marking vineyard land to market was1,829 million euros as of December 31, 2016 (1,799 millioneuros as of December 31, 2015; 1,733 million euros asof December 31, 2014). See Notes 1.9 and 1.13 on themeasurement method for vineyard land.
Movements in property, plant and equipment during the fiscal year break down as follows:
Gross value Vineyard land Land and Investment Leasehold improvements, Assets in Other Total(EUR millions) and producing buildings property machinery and equipment progress tangible vineyards fixed assets Stores Production, Other logistics
As of December 31, 2015 2,538 4,505 610 6,190 2,153 1,179 759 1,727 19,661
Acquisitions 3 214 285 574 93 56 768 157 2,150Change in the market value of vineyard land 30 - - - - - - - 30Disposals and retirements - (67) (1) (352) (72) (49) (1) (37) (579)Changes in the scope of consolidation - 21 - (77) (9) (17) - (1) (83)Translation adjustment 2 (11) 2 92 (6) 13 9 13 114Other movements, including transfers 7 47 12 448 66 48 (577) (8) 43
As of December 31, 2016 2,580 4,709 908 6,875 2,225 1,230 958 1,851 21,336
Depreciation Vineyard land Land and Investment Leasehold improvements, Assets in Other Totaland impairment and producing buildings property machinery and equipment progress tangible (EUR millions) vineyards fixed assets Stores Production, Other logistics
As of December 31, 2015 (97) (1,584) (48) (4,019) (1,487) (840) (4) (425) (8,504)
Depreciation expense (6) (155) (6) (772) (134) (125) - (76) (1,274)Impairment expense (1) (2) - 9 (1) - (4) (2) (1)Disposals and retirements - 66 1 351 68 48 - 39 573Changes in the scope of consolidation - 10 - 63 5 15 - 1 94Translation adjustment (2) (16) - (58) 3 (10) - (8) (91)Other movements, including transfers - 12 - (53) 2 22 - 23 6
As of December 31, 2016 (106) (1,669) (53) (4,479) (1,544) (890) (8) (448) (9,197)
Net carrying amount as of December 31, 2016 2,474 3,040 855 2,396 681 340 950 1,403 12,139
37Financial Documents - December 31, 2016
CONDENSED CONSOLIDATED FINANCIAL STATEMENTS
Selected notes to the consolidated financial statements
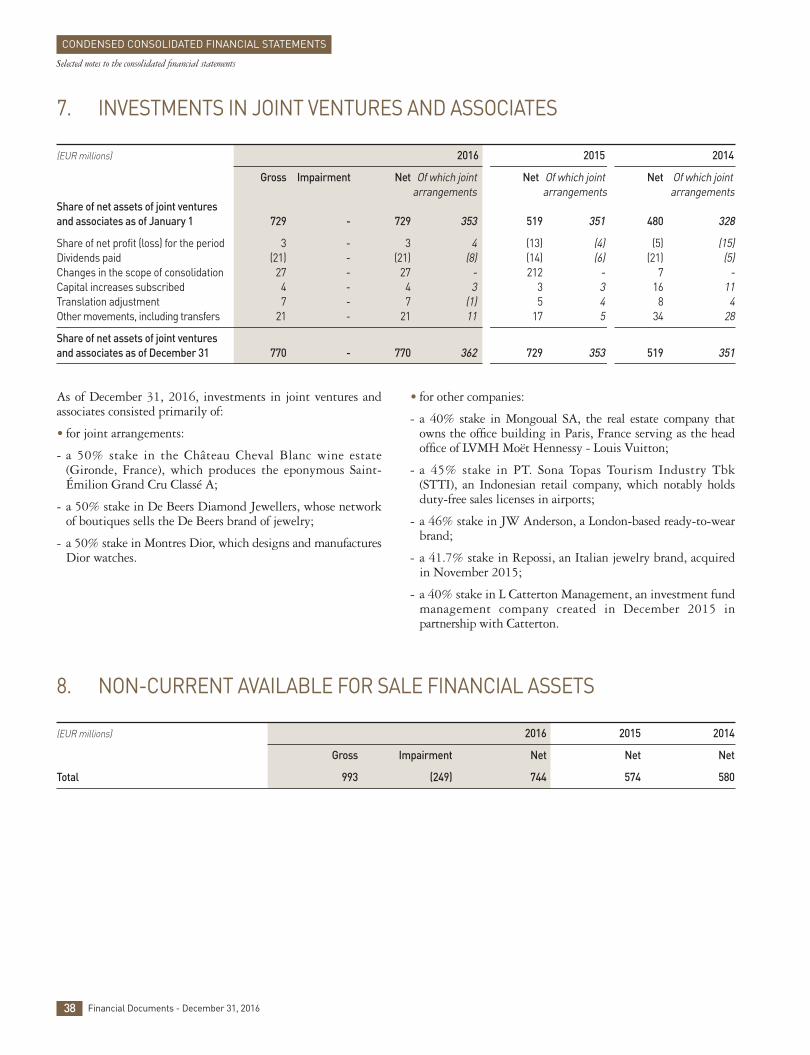
8. NON-CURRENT AVAILABLE FOR SALE FINANCIAL ASSETS
(EUR millions) 2016 2015 2014
Gross Impairment Net Net Net
Total 993 (249) 744 574 580
As of December 31, 2016, investments in joint ventures andassociates consisted primarily of:
• for joint arrangements:
- a 50% stake in the Château Cheval Blanc wine estate(Gironde, France), which produces the eponymous Saint-Émilion Grand Cru Classé A;
- a 50% stake in De Beers Diamond Jewellers, whose networkof boutiques sells the De Beers brand of jewelry;
- a 50% stake in Montres Dior, which designs and manufacturesDior watches.
• for other companies:
- a 40% stake in Mongoual SA, the real estate company thatowns the office building in Paris, France serving as the headoffice of LVMH Moët Hennessy - Louis Vuitton;
- a 45% stake in PT. Sona Topas Tourism Industry Tbk(STTI), an Indonesian retail company, which notably holdsduty-free sales licenses in airports;
- a 46% stake in JW Anderson, a London-based ready-to-wearbrand;
- a 41.7% stake in Repossi, an Italian jewelry brand, acquiredin November 2015;
- a 40% stake in L Catterton Management, an investment fundmanagement company created in December 2015 inpartnership with Catterton.
38 Financial Documents - December 31, 2016
CONDENSED CONSOLIDATED FINANCIAL STATEMENTS
Selected notes to the consolidated financial statements
7. INVESTMENTS IN JOINT VENTURES AND ASSOCIATES
(EUR millions) 2016 2015 2014
Gross Impairment Net Of which joint Net Of which joint Net Of which joint arrangements arrangements arrangementsShare of net assets of joint ventures and associates as of January 1 729 - 729 353 519 351 480 328
Share of net profit (loss) for the period 3 - 3 4 (13) (4) (5) (15)Dividends paid (21) - (21) (8) (14) (6) (21) (5)Changes in the scope of consolidation 27 - 27 - 212 - 7 -Capital increases subscribed 4 - 4 3 3 3 16 11Translation adjustment 7 - 7 (1) 5 4 8 4Other movements, including transfers 21 - 21 11 17 5 34 28
Share of net assets of joint ventures and associates as of December 31 770 - 770 362 729 353 519 351
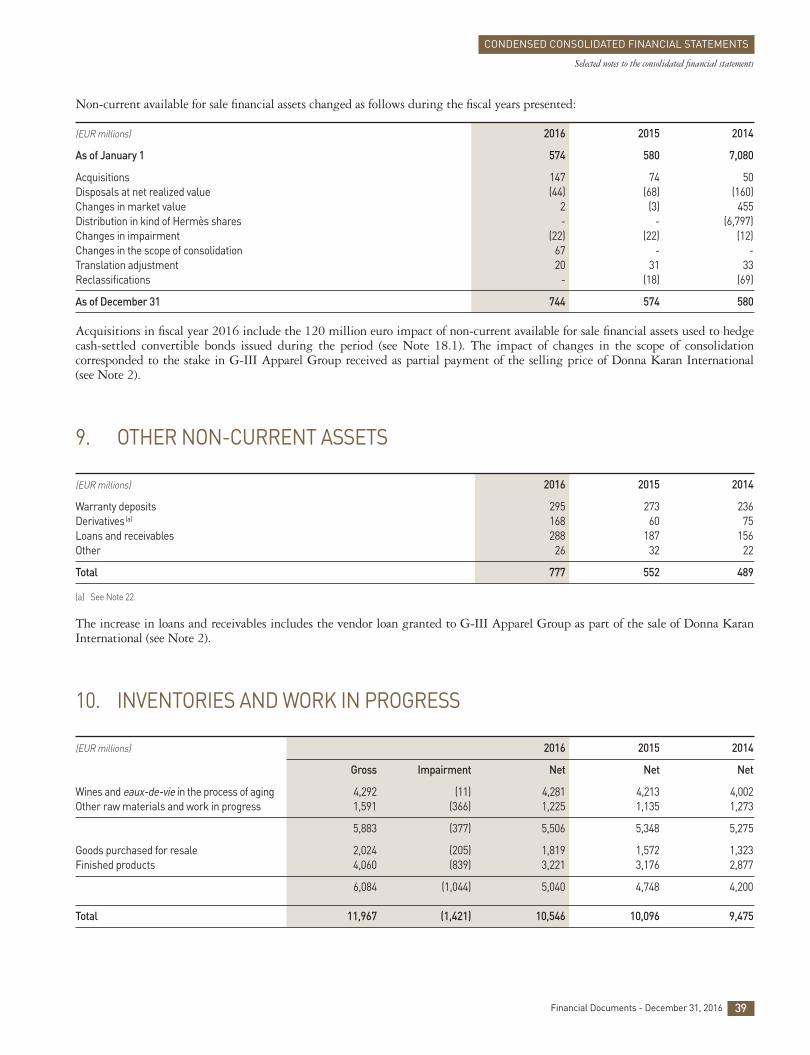
39Financial Documents - December 31, 2016
CONDENSED CONSOLIDATED FINANCIAL STATEMENTS
Selected notes to the consolidated financial statements
Non-current available for sale financial assets changed as follows during the fiscal years presented:
(EUR millions) 2016 2015 2014
As of January 1 574 580 7,080
Acquisitions 147 74 50Disposals at net realized value (44) (68) (160)Changes in market value 2 (3) 455Distribution in kind of Hermès shares - - (6,797)Changes in impairment (22) (22) (12)Changes in the scope of consolidation 67 - -Translation adjustment 20 31 33Reclassifications - (18) (69)
As of December 31 744 574 580
Acquisitions in fiscal year 2016 include the 120 million euro impact of non-current available for sale financial assets used to hedgecash-settled convertible bonds issued during the period (see Note 18.1). The impact of changes in the scope of consolidationcorresponded to the stake in G-III Apparel Group received as partial payment of the selling price of Donna Karan International (see Note 2).
9. OTHER NON-CURRENT ASSETS
(EUR millions) 2016 2015 2014
Warranty deposits 295 273 236Derivatives (a) 168 60 75Loans and receivables 288 187 156Other 26 32 22
Total 777 552 489
(a) See Note 22.
The increase in loans and receivables includes the vendor loan granted to G-III Apparel Group as part of the sale of Donna KaranInternational (see Note 2).
10. INVENTORIES AND WORK IN PROGRESS
(EUR millions) 2016 2015 2014
Gross Impairment Net Net Net
Wines and eaux-de-vie in the process of aging 4,292 (11) 4,281 4,213 4,002Other raw materials and work in progress 1,591 (366) 1,225 1,135 1,273
5,883 (377) 5,506 5,348 5,275
Goods purchased for resale 2,024 (205) 1,819 1,572 1,323Finished products 4,060 (839) 3,221 3,176 2,877
6,084 (1,044) 5,040 4,748 4,200
Total 11,967 (1,421) 10,546 10,096 9,475
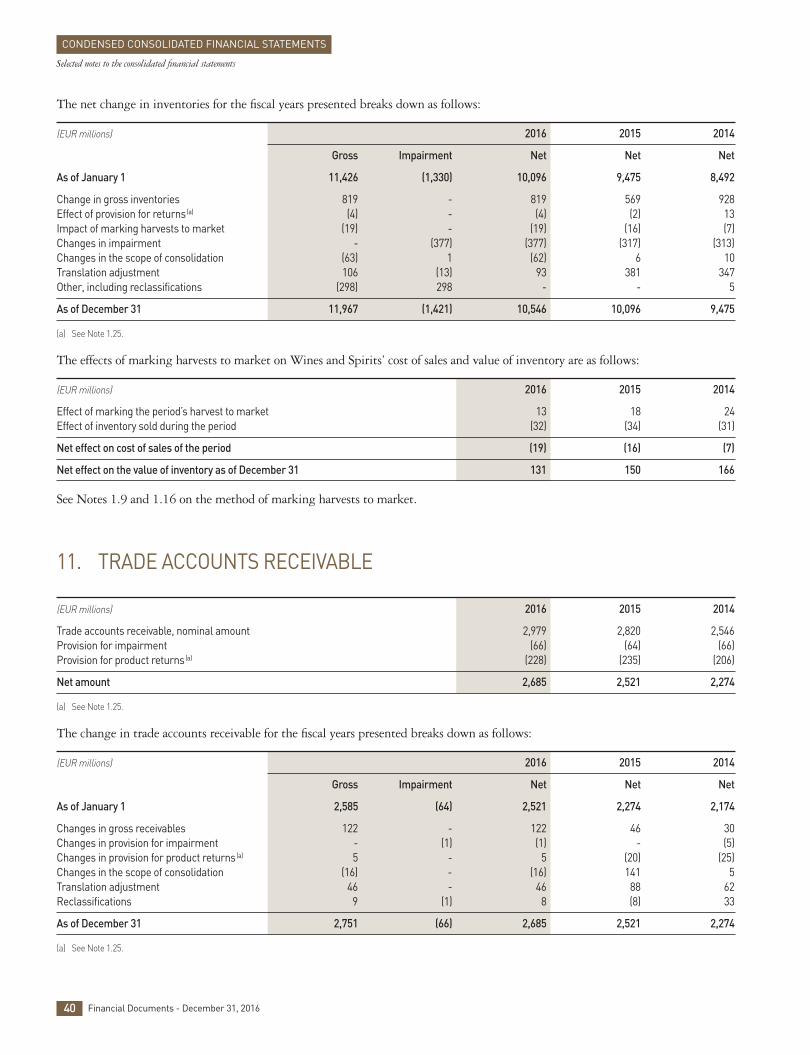
40 Financial Documents - December 31, 2016
CONDENSED CONSOLIDATED FINANCIAL STATEMENTS
Selected notes to the consolidated financial statements
The net change in inventories for the fiscal years presented breaks down as follows:
(EUR millions) 2016 2015 2014
Gross Impairment Net Net Net
As of January 1 11,426 (1,330) 10,096 9,475 8,492
Change in gross inventories 819 - 819 569 928Effect of provision for returns (a) (4) - (4) (2) 13Impact of marking harvests to market (19) - (19) (16) (7)Changes in impairment - (377) (377) (317) (313)Changes in the scope of consolidation (63) 1 (62) 6 10Translation adjustment 106 (13) 93 381 347Other, including reclassifications (298) 298 - - 5
As of December 31 11,967 (1,421) 10,546 10,096 9,475
(a) See Note 1.25.
The effects of marking harvests to market on Wines and Spirits’ cost of sales and value of inventory are as follows:
(EUR millions) 2016 2015 2014
Effect of marking the period’s harvest to market 13 18 24Effect of inventory sold during the period (32) (34) (31)
Net effect on cost of sales of the period (19) (16) (7)
Net effect on the value of inventory as of December 31 131 150 166
See Notes 1.9 and 1.16 on the method of marking harvests to market.
11. TRADE ACCOUNTS RECEIVABLE
(EUR millions) 2016 2015 2014
Trade accounts receivable, nominal amount 2,979 2,820 2,546Provision for impairment (66) (64) (66)Provision for product returns (a) (228) (235) (206)
Net amount 2,685 2,521 2,274
(a) See Note 1.25.
The change in trade accounts receivable for the fiscal years presented breaks down as follows:
(EUR millions) 2016 2015 2014
Gross Impairment Net Net Net
As of January 1 2,585 (64) 2,521 2,274 2,174
Changes in gross receivables 122 - 122 46 30Changes in provision for impairment - (1) (1) - (5)Changes in provision for product returns (a) 5 - 5 (20) (25)Changes in the scope of consolidation (16) - (16) 141 5Translation adjustment 46 - 46 88 62Reclassifications 9 (1) 8 (8) 33
As of December 31 2,751 (66) 2,685 2,521 2,274
(a) See Note 1.25.
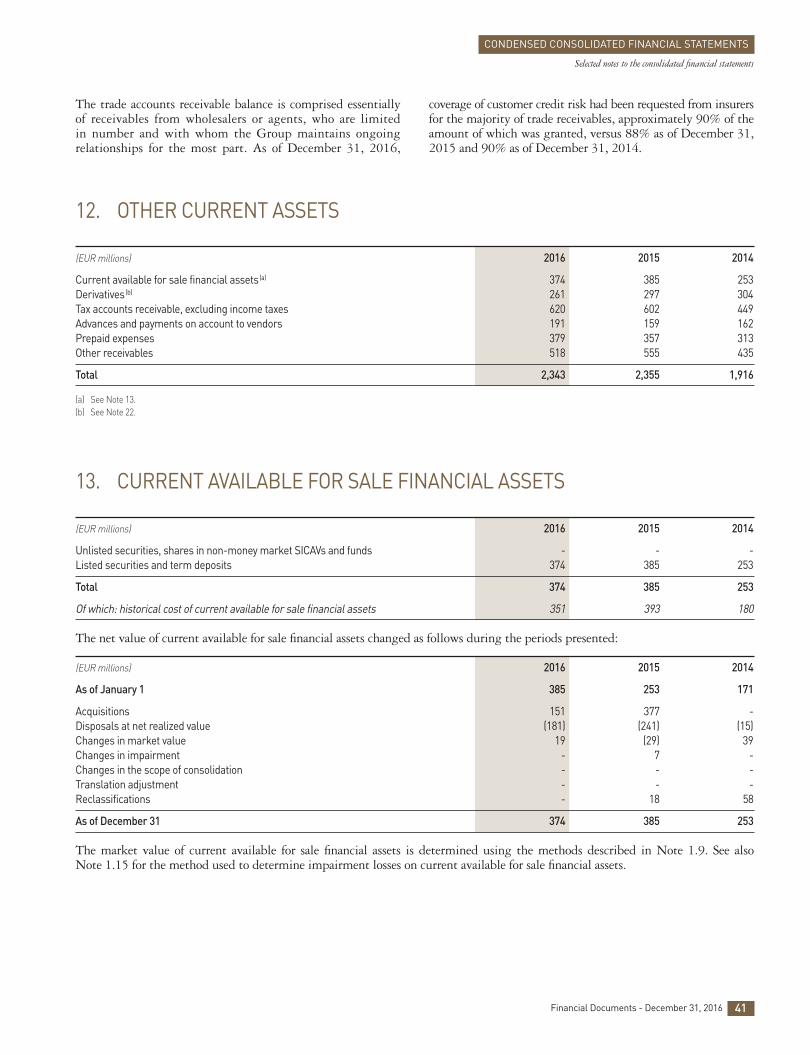
12. OTHER CURRENT ASSETS
(EUR millions) 2016 2015 2014
Current available for sale financial assets (a) 374 385 253Derivatives (b) 261 297 304Tax accounts receivable, excluding income taxes 620 602 449Advances and payments on account to vendors 191 159 162Prepaid expenses 379 357 313Other receivables 518 555 435
Total 2,343 2,355 1,916
(a) See Note 13.(b) See Note 22.
13. CURRENT AVAILABLE FOR SALE FINANCIAL ASSETS
(EUR millions) 2016 2015 2014
Unlisted securities, shares in non-money market SICAVs and funds - - -Listed securities and term deposits 374 385 253
Total 374 385 253
Of which: historical cost of current available for sale financial assets 351 393 180
The net value of current available for sale financial assets changed as follows during the periods presented:
(EUR millions) 2016 2015 2014
As of January 1 385 253 171
Acquisitions 151 377 -Disposals at net realized value (181) (241) (15)Changes in market value 19 (29) 39Changes in impairment - 7 -Changes in the scope of consolidation - - -Translation adjustment - - -Reclassifications - 18 58
As of December 31 374 385 253
The market value of current available for sale financial assets is determined using the methods described in Note 1.9. See also Note 1.15 for the method used to determine impairment losses on current available for sale financial assets.
41Financial Documents - December 31, 2016
CONDENSED CONSOLIDATED FINANCIAL STATEMENTS
Selected notes to the consolidated financial statements
The trade accounts receivable balance is comprised essentiallyof receivables from wholesalers or agents, who are limited in number and with whom the Group maintains ongoingrelationships for the most part. As of December 31, 2016,
coverage of customer credit risk had been requested from insurersfor the majority of trade receivables, approximately 90% of theamount of which was granted, versus 88% as of December 31,2015 and 90% as of December 31, 2014.
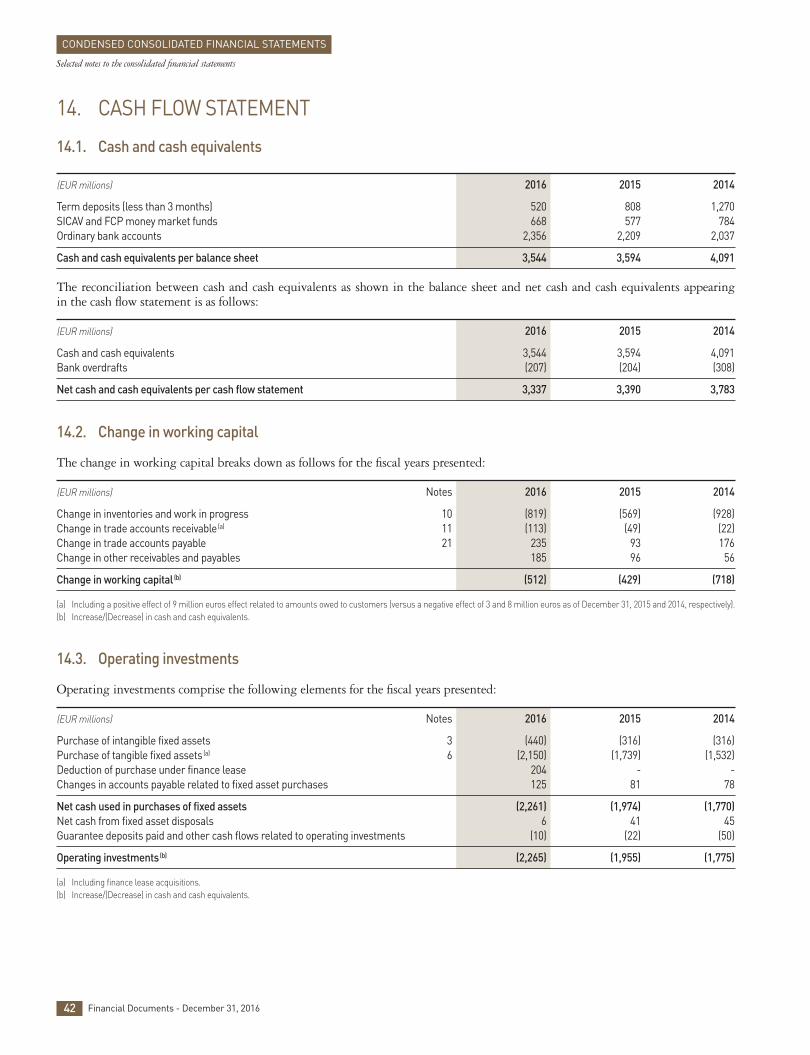
42 Financial Documents - December 31, 2016
CONDENSED CONSOLIDATED FINANCIAL STATEMENTS
Selected notes to the consolidated financial statements
14. CASH FLOW STATEMENT
14.1. Cash and cash equivalents
(EUR millions) 2016 2015 2014
Term deposits (less than 3 months) 520 808 1,270SICAV and FCP money market funds 668 577 784Ordinary bank accounts 2,356 2,209 2,037
Cash and cash equivalents per balance sheet 3,544 3,594 4,091
The reconciliation between cash and cash equivalents as shown in the balance sheet and net cash and cash equivalents appearing in the cash flow statement is as follows:
(EUR millions) 2016 2015 2014
Cash and cash equivalents 3,544 3,594 4,091Bank overdrafts (207) (204) (308)
Net cash and cash equivalents per cash flow statement 3,337 3,390 3,783
14.2. Change in working capital
The change in working capital breaks down as follows for the fiscal years presented:
(EUR millions) Notes 2016 2015 2014
Change in inventories and work in progress 10 (819) (569) (928)Change in trade accounts receivable (a) 11 (113) (49) (22)Change in trade accounts payable 21 235 93 176Change in other receivables and payables 185 96 56
Change in working capital (b) (512) (429) (718)
(a) Including a positive effect of 9 million euros effect related to amounts owed to customers (versus a negative effect of 3 and 8 million euros as of December 31, 2015 and 2014, respectively).(b) Increase / (Decrease) in cash and cash equivalents.
14.3. Operating investments
Operating investments comprise the following elements for the fiscal years presented:
(EUR millions) Notes 2016 2015 2014
Purchase of intangible fixed assets 3 (440) (316) (316)Purchase of tangible fixed assets (a) 6 (2,150) (1,739) (1,532)Deduction of purchase under finance lease 204 - -Changes in accounts payable related to fixed asset purchases 125 81 78
Net cash used in purchases of fixed assets (2,261) (1,974) (1,770)Net cash from fixed asset disposals 6 41 45Guarantee deposits paid and other cash flows related to operating investments (10) (22) (50)
Operating investments (b) (2,265) (1,955) (1,775)
(a) Including finance lease acquisitions.(b) Increase / (Decrease) in cash and cash equivalents.
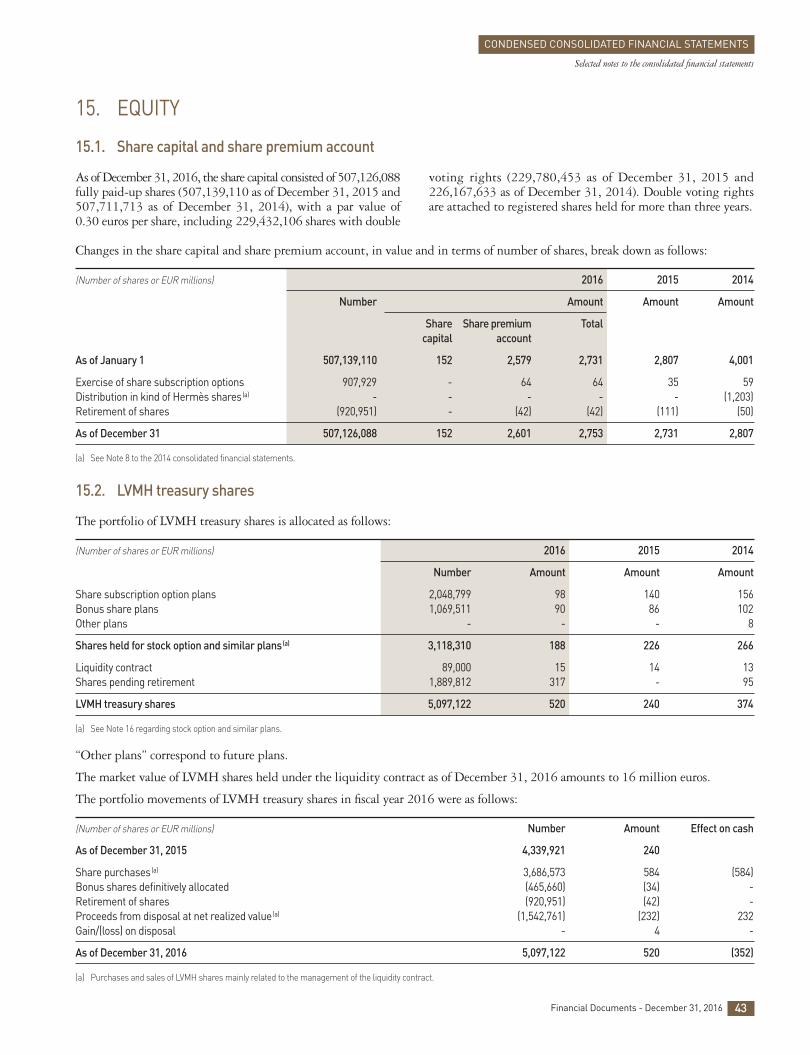
Changes in the share capital and share premium account, in value and in terms of number of shares, break down as follows:
(Number of shares or EUR millions) 2016 2015 2014
Number Amount Amount Amount
Share Share premium Total capital account
As of January 1 507,139,110 152 2,579 2,731 2,807 4,001
Exercise of share subscription options 907,929 - 64 64 35 59Distribution in kind of Hermès shares(a) - - - - - (1,203)Retirement of shares (920,951) - (42) (42) (111) (50)
As of December 31 507,126,088 152 2,601 2,753 2,731 2,807
(a) See Note 8 to the 2014 consolidated financial statements.
15.2. LVMH treasury shares
The portfolio of LVMH treasury shares is allocated as follows:
(Number of shares or EUR millions) 2016 2015 2014
Number Amount Amount Amount
Share subscription option plans 2,048,799 98 140 156Bonus share plans 1,069,511 90 86 102Other plans - - - 8
Shares held for stock option and similar plans(a) 3,118,310 188 226 266
Liquidity contract 89,000 15 14 13Shares pending retirement 1,889,812 317 - 95
LVMH treasury shares 5,097,122 520 240 374
(a) See Note 16 regarding stock option and similar plans.
“Other plans” correspond to future plans.
The market value of LVMH shares held under the liquidity contract as of December 31, 2016 amounts to 16 million euros.
The portfolio movements of LVMH treasury shares in fiscal year 2016 were as follows:
(Number of shares or EUR millions) Number Amount Effect on cash
As of December 31, 2015 4,339,921 240
Share purchases (a) 3,686,573 584 (584)Bonus shares definitively allocated (465,660) (34) -Retirement of shares (920,951) (42) -Proceeds from disposal at net realized value (a) (1,542,761) (232) 232Gain / (loss) on disposal - 4 -
As of December 31, 2016 5,097,122 520 (352)
(a) Purchases and sales of LVMH shares mainly related to the management of the liquidity contract.
As of December 31, 2016, the share capital consisted of 507,126,088fully paid-up shares (507,139,110 as of December 31, 2015 and507,711,713 as of December 31, 2014), with a par value of0.30 euros per share, including 229,432,106 shares with double
voting rights (229,780,453 as of December 31, 2015 and226,167,633 as of December 31, 2014). Double voting rightsare attached to registered shares held for more than three years.
15. EQUITY
15.1. Share capital and share premium account
43Financial Documents - December 31, 2016
CONDENSED CONSOLIDATED FINANCIAL STATEMENTS
Selected notes to the consolidated financial statements
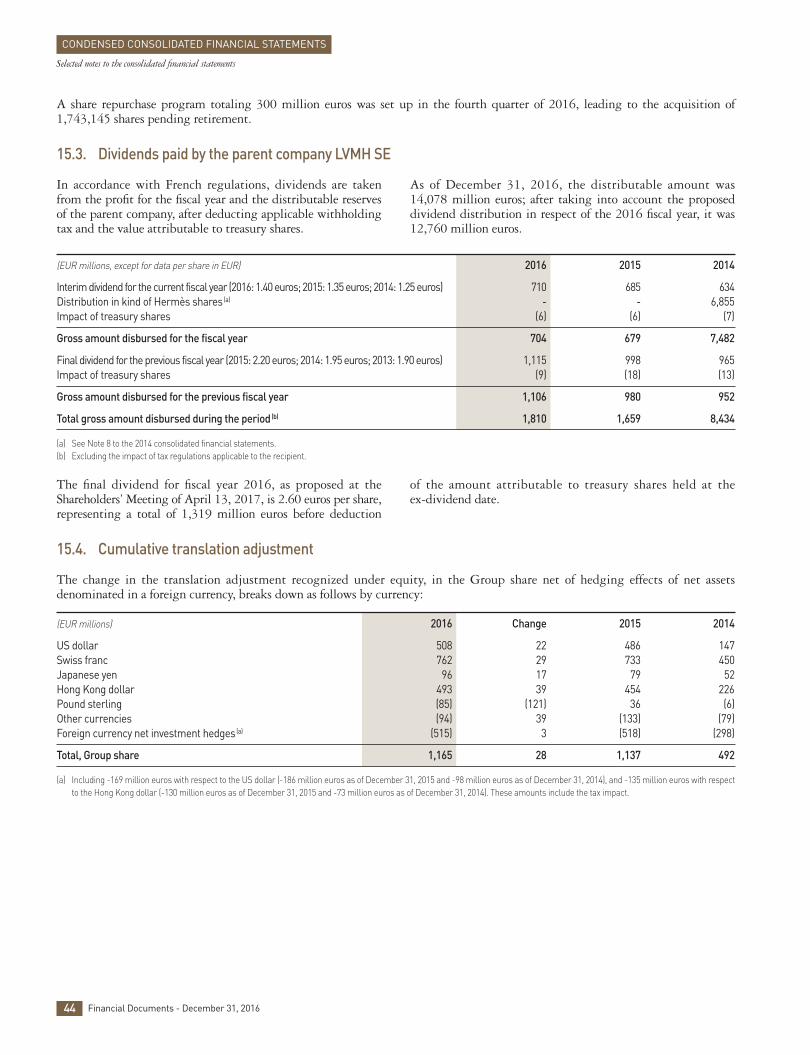
15.4. Cumulative translation adjustment
The change in the translation adjustment recognized under equity, in the Group share net of hedging effects of net assetsdenominated in a foreign currency, breaks down as follows by currency:
(EUR millions) 2016 Change 2015 2014
US dollar 508 22 486 147Swiss franc 762 29 733 450Japanese yen 96 17 79 52Hong Kong dollar 493 39 454 226Pound sterling (85) (121) 36 (6)Other currencies (94) 39 (133) (79)Foreign currency net investment hedges (a) (515) 3 (518) (298)
Total, Group share 1,165 28 1,137 492
(a) Including -169 million euros with respect to the US dollar (-186 million euros as of December 31, 2015 and -98 million euros as of December 31, 2014), and -135 million euros with respectto the Hong Kong dollar (-130 million euros as of December 31, 2015 and -73 million euros as of December 31, 2014). These amounts include the tax impact.
The final dividend for fiscal year 2016, as proposed at theShareholders’ Meeting of April 13, 2017, is 2.60 euros per share,representing a total of 1,319 million euros before deduction
of the amount attributable to treasury shares held at the ex-dividend date.
(EUR millions, except for data per share in EUR) 2016 2015 2014
Interim dividend for the current fiscal year (2016: 1.40 euros; 2015: 1.35 euros; 2014: 1.25 euros) 710 685 634Distribution in kind of Hermès shares(a) - - 6,855Impact of treasury shares (6) (6) (7)
Gross amount disbursed for the fiscal year 704 679 7,482
Final dividend for the previous fiscal year (2015: 2.20 euros; 2014: 1.95 euros; 2013: 1.90 euros) 1,115 998 965Impact of treasury shares (9) (18) (13)
Gross amount disbursed for the previous fiscal year 1,106 980 952
Total gross amount disbursed during the period(b) 1,810 1,659 8,434
(a) See Note 8 to the 2014 consolidated financial statements.(b) Excluding the impact of tax regulations applicable to the recipient.
In accordance with French regulations, dividends are takenfrom the profit for the fiscal year and the distributable reservesof the parent company, after deducting applicable withholdingtax and the value attributable to treasury shares.
As of December 31, 2016, the distributable amount was14,078 million euros; after taking into account the proposeddividend distribution in respect of the 2016 fiscal year, it was12,760 million euros.
44 Financial Documents - December 31, 2016
CONDENSED CONSOLIDATED FINANCIAL STATEMENTS
Selected notes to the consolidated financial statements
A share repurchase program totaling 300 million euros was set up in the fourth quarter of 2016, leading to the acquisition of1,743,145 shares pending retirement.
15.3. Dividends paid by the parent company LVMH SE
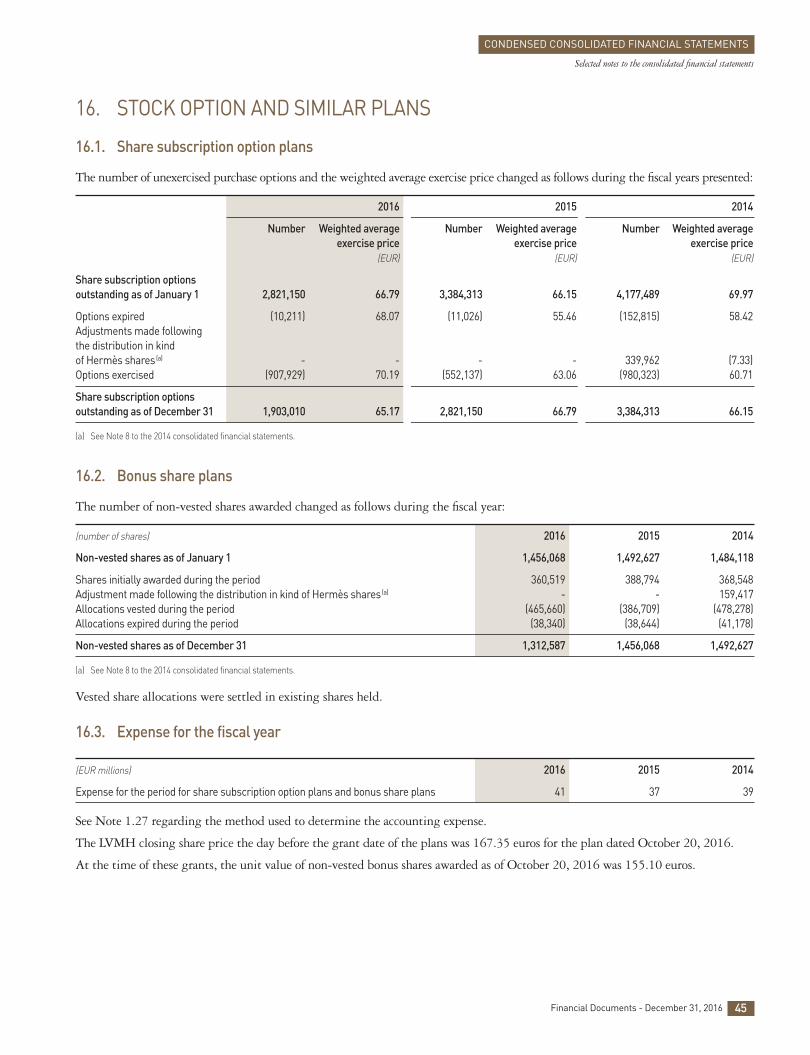
16. STOCK OPTION AND SIMILAR PLANS
16.1. Share subscription option plans
The number of unexercised purchase options and the weighted average exercise price changed as follows during the fiscal years presented:
2016 2015 2014
Number Weighted average Number Weighted average Number Weighted average exercise price exercise price exercise price (EUR) (EUR) (EUR)
Share subscription options outstanding as of January 1 2,821,150 66.79 3,384,313 66.15 4,177,489 69.97
Options expired (10,211) 68.07 (11,026) 55.46 (152,815) 58.42Adjustments made following the distribution in kind of Hermès shares(a) - - - - 339,962 (7.33)Options exercised (907,929) 70.19 (552,137) 63.06 (980,323) 60.71
Share subscription options outstanding as of December 31 1,903,010 65.17 2,821,150 66.79 3,384,313 66.15
(a) See Note 8 to the 2014 consolidated financial statements.
16.2. Bonus share plans
The number of non-vested shares awarded changed as follows during the fiscal year:
(number of shares) 2016 2015 2014
Non-vested shares as of January 1 1,456,068 1,492,627 1,484,118
Shares initially awarded during the period 360,519 388,794 368,548Adjustment made following the distribution in kind of Hermès shares (a) - - 159,417Allocations vested during the period (465,660) (386,709) (478,278)Allocations expired during the period (38,340) (38,644) (41,178)
Non-vested shares as of December 31 1,312,587 1,456,068 1,492,627
(a) See Note 8 to the 2014 consolidated financial statements.
Vested share allocations were settled in existing shares held.
16.3. Expense for the fiscal year
(EUR millions) 2016 2015 2014
Expense for the period for share subscription option plans and bonus share plans 41 37 39
See Note 1.27 regarding the method used to determine the accounting expense.
The LVMH closing share price the day before the grant date of the plans was 167.35 euros for the plan dated October 20, 2016.
At the time of these grants, the unit value of non-vested bonus shares awarded as of October 20, 2016 was 155.10 euros.
45Financial Documents - December 31, 2016
CONDENSED CONSOLIDATED FINANCIAL STATEMENTS
Selected notes to the consolidated financial statements
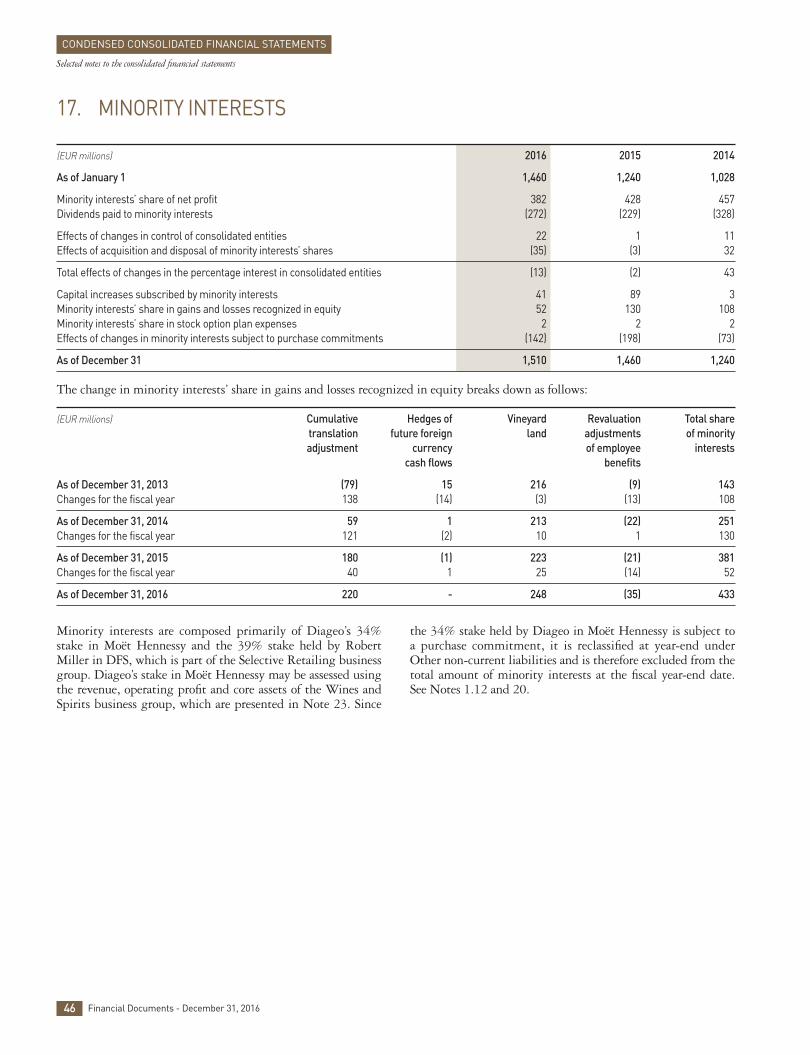
Minority interests are composed primarily of Diageo’s 34%stake in Moët Hennessy and the 39% stake held by RobertMiller in DFS, which is part of the Selective Retailing businessgroup. Diageo’s stake in Moët Hennessy may be assessed usingthe revenue, operating profit and core assets of the Wines andSpirits business group, which are presented in Note 23. Since
the 34% stake held by Diageo in Moët Hennessy is subject to a purchase commitment, it is reclassified at year-end underOther non-current liabilities and is therefore excluded from thetotal amount of minority interests at the fiscal year-end date.See Notes 1.12 and 20.
46 Financial Documents - December 31, 2016
17. MINORITY INTERESTS
(EUR millions) 2016 2015 2014
As of January 1 1,460 1,240 1,028
Minority interests’ share of net profit 382 428 457Dividends paid to minority interests (272) (229) (328)
Effects of changes in control of consolidated entities 22 1 11Effects of acquisition and disposal of minority interests’ shares (35) (3) 32
Total effects of changes in the percentage interest in consolidated entities (13) (2) 43
Capital increases subscribed by minority interests 41 89 3Minority interests’ share in gains and losses recognized in equity 52 130 108Minority interests’ share in stock option plan expenses 2 2 2Effects of changes in minority interests subject to purchase commitments (142) (198) (73)
As of December 31 1,510 1,460 1,240
The change in minority interests’ share in gains and losses recognized in equity breaks down as follows:
(EUR millions) Cumulative Hedges of Vineyard Revaluation Total share translation future foreign land adjustments of minority adjustment currency of employee interests cash flows benefits
As of December 31, 2013 (79) 15 216 (9) 143Changes for the fiscal year 138 (14) (3) (13) 108
As of December 31, 2014 59 1 213 (22) 251Changes for the fiscal year 121 (2) 10 1 130
As of December 31, 2015 180 (1) 223 (21) 381Changes for the fiscal year 40 1 25 (14) 52
As of December 31, 2016 220 - 248 (35) 433
CONDENSED CONSOLIDATED FINANCIAL STATEMENTS
Selected notes to the consolidated financial statements
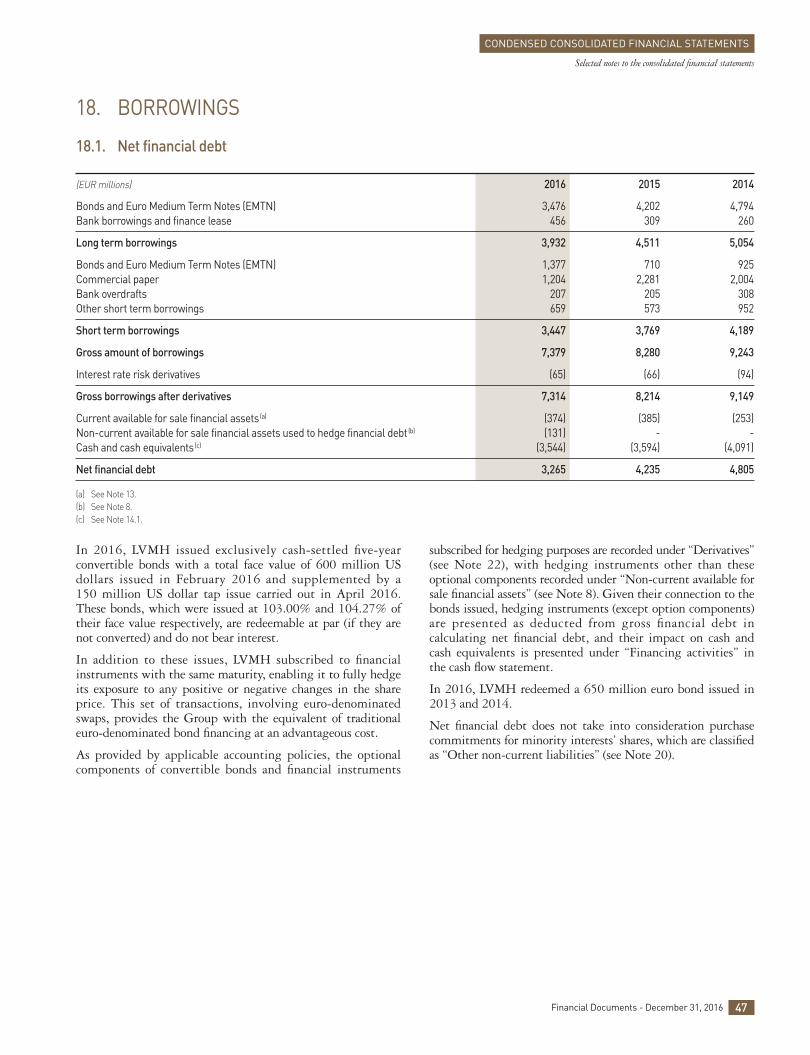
In 2016, LVMH issued exclusively cash-settled five-yearconvertible bonds with a total face value of 600 million USdollars issued in February 2016 and supplemented by a150 million US dollar tap issue carried out in April 2016.These bonds, which were issued at 103.00% and 104.27% oftheir face value respectively, are redeemable at par (if they arenot converted) and do not bear interest.
In addition to these issues, LVMH subscribed to financialinstruments with the same maturity, enabling it to fully hedgeits exposure to any positive or negative changes in the shareprice. This set of transactions, involving euro-denominatedswaps, provides the Group with the equivalent of traditionaleuro-denominated bond financing at an advantageous cost.
As provided by applicable accounting policies, the optionalcomponents of convertible bonds and financial instruments
subscribed for hedging purposes are recorded under “Derivatives”(see Note 22), with hedging instruments other than theseoptional components recorded under “Non-current available forsale financial assets” (see Note 8). Given their connection to thebonds issued, hedging instruments (except option components)are presented as deducted from gross financial debt incalculating net financial debt, and their impact on cash andcash equivalents is presented under “Financing activities” inthe cash flow statement.
In 2016, LVMH redeemed a 650 million euro bond issued in2013 and 2014.
Net financial debt does not take into consideration purchasecommitments for minority interests’ shares, which are classifiedas “Other non-current liabilities” (see Note 20).
18. BORROWINGS
18.1. Net financial debt
(EUR millions) 2016 2015 2014
Bonds and Euro Medium Term Notes (EMTN) 3,476 4,202 4,794Bank borrowings and finance lease 456 309 260
Long term borrowings 3,932 4,511 5,054
Bonds and Euro Medium Term Notes (EMTN) 1,377 710 925Commercial paper 1,204 2,281 2,004Bank overdrafts 207 205 308Other short term borrowings 659 573 952
Short term borrowings 3,447 3,769 4,189
Gross amount of borrowings 7,379 8,280 9,243
Interest rate risk derivatives (65) (66) (94)
Gross borrowings after derivatives 7,314 8,214 9,149
Current available for sale financial assets(a) (374) (385) (253)Non-current available for sale financial assets used to hedge financial debt(b) (131) - -Cash and cash equivalents(c) (3,544) (3,594) (4,091)
Net financial debt 3,265 4,235 4,805
(a) See Note 13.(b) See Note 8.(c) See Note 14.1.
47Financial Documents - December 31, 2016
CONDENSED CONSOLIDATED FINANCIAL STATEMENTS
Selected notes to the consolidated financial statements
2_VA_V3 24/01/2017 20:18 Page47

48 Financial Documents - December 31, 2016
CONDENSED CONSOLIDATED FINANCIAL STATEMENTS
Selected notes to the consolidated financial statements
18.2. Analysis of gross borrowings by payment date and by type of interest rate
(EUR millions) Gross Effects Gross borrowings borrowings of derivatives after derivatives
Fixed Floating Total Fixed Floating Total Fixed Floating Total rate rate rate rate rate rate
Maturity: as of December 31, 2017 3,180 267 3,447 (1,365) 1,350 (15) 1,815 1,617 3,432as of December 31, 2018 591 13 604 - (4) (4) 591 9 600as of December 31, 2019 737 300 1,037 (353) 342 (11) 384 642 1,026as of December 31, 2020 617 - 617 (401) 390 (11) 216 390 606as of December 31, 2021 1,361 - 1,361 (650) 626 (24) 711 626 1,337as of December 31, 2022 11 - 11 - - - 11 - 11
Thereafter 294 8 302 - - - 294 8 302
Total 6,791 588 7,379 (2,769) 2,704 (65) 4,022 3,292 7,314
See Note 22.3 for the market value of interest rate risk derivatives.
The breakdown by quarter of gross borrowings falling due in 2017 is as follows:
(EUR millions) Falling due in 2017
First quarter 1,820Second quarter 1,071Third quarter 543Fourth quarter 13
Total 3,447
18.3. Analysis of gross borrowings by currency after derivatives
(EUR millions) 2016 2015 2014
Euro 5,491 6,302 7,033US dollar 634 366 226Swiss franc 639 909 995Japanese yen 281 228 229Other currencies 269 409 666
Total 7,314 8,214 9,149
In general, the purpose of foreign currency borrowings is to hedge the net foreign currency-denominated assets of consolidatedcompanies located outside the eurozone.
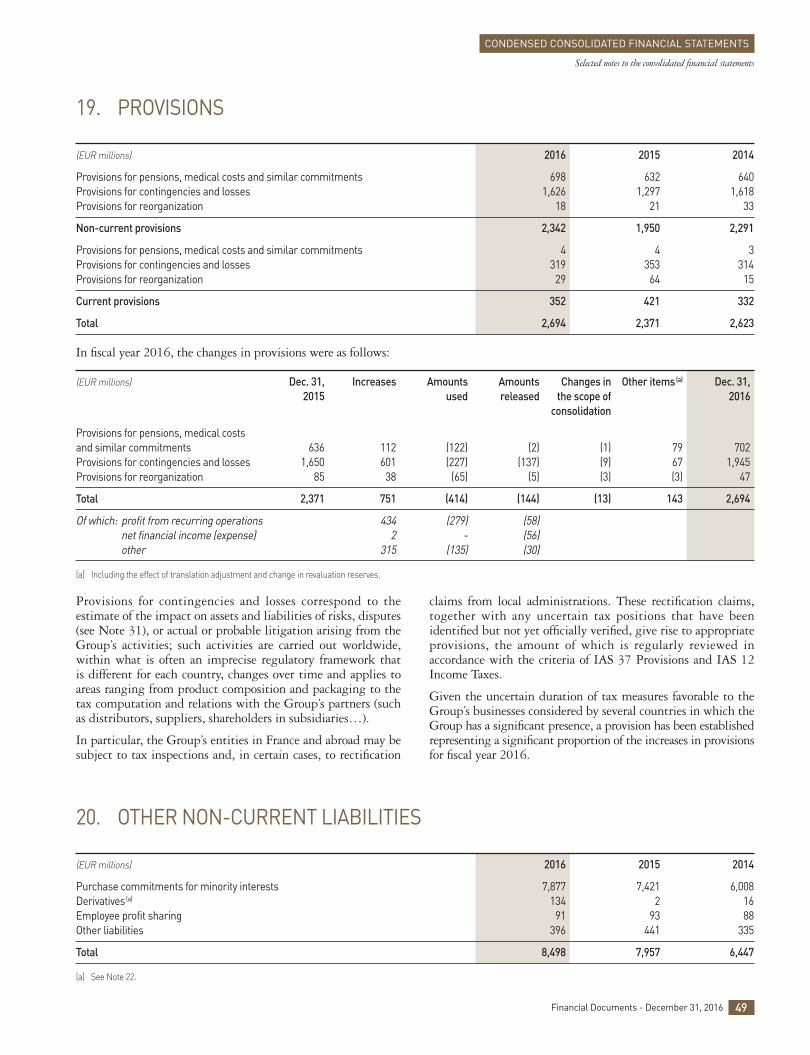
20. OTHER NON-CURRENT LIABILITIES
(EUR millions) 2016 2015 2014
Purchase commitments for minority interests 7,877 7,421 6,008Derivatives (a) 134 2 16Employee profit sharing 91 93 88Other liabilities 396 441 335
Total 8,498 7,957 6,447
(a) See Note 22.
Provisions for contingencies and losses correspond to theestimate of the impact on assets and liabilities of risks, disputes(see Note 31), or actual or probable litigation arising from theGroup’s activities; such activities are carried out worldwide,within what is often an imprecise regulatory framework that is different for each country, changes over time and applies toareas ranging from product composition and packaging to thetax computation and relations with the Group’s partners (suchas distributors, suppliers, shareholders in subsidiaries…).
In particular, the Group’s entities in France and abroad may besubject to tax inspections and, in certain cases, to rectification
claims from local administrations. These rectification claims,together with any uncertain tax positions that have beenidentified but not yet officially verified, give rise to appropriateprovisions, the amount of which is regularly reviewed inaccordance with the criteria of IAS 37 Provisions and IAS 12Income Taxes.
Given the uncertain duration of tax measures favorable to theGroup’s businesses considered by several countries in which theGroup has a significant presence, a provision has been establishedrepresenting a significant proportion of the increases in provisionsfor fiscal year 2016.
19. PROVISIONS
(EUR millions) 2016 2015 2014
Provisions for pensions, medical costs and similar commitments 698 632 640Provisions for contingencies and losses 1,626 1,297 1,618Provisions for reorganization 18 21 33
Non-current provisions 2,342 1,950 2,291
Provisions for pensions, medical costs and similar commitments 4 4 3Provisions for contingencies and losses 319 353 314Provisions for reorganization 29 64 15
Current provisions 352 421 332
Total 2,694 2,371 2,623
In fiscal year 2016, the changes in provisions were as follows:
(EUR millions) Dec. 31, Increases Amounts Amounts Changes in Other items(a) Dec. 31, 20 15 used released the scope of 2016 consolidation
Provisions for pensions, medical costs and similar commitments 636 112 (122) (2) (1) 79 702Provisions for contingencies and losses 1,650 601 (227) (137) (9) 67 1,945Provisions for reorganization 85 38 (65) (5) (3) (3) 47
Total 2,371 751 (414) (144) (13) 143 2,694
Of which: profit from recurring operations 434 (279) (58) net financial income (expense) 2 - (56) other 315 (135) (30)
(a) Including the effect of translation adjustment and change in revaluation reserves.
49Financial Documents - December 31, 2016
CONDENSED CONSOLIDATED FINANCIAL STATEMENTS
Selected notes to the consolidated financial statements
2_VA_V3 24/01/2017 19:53 Page49
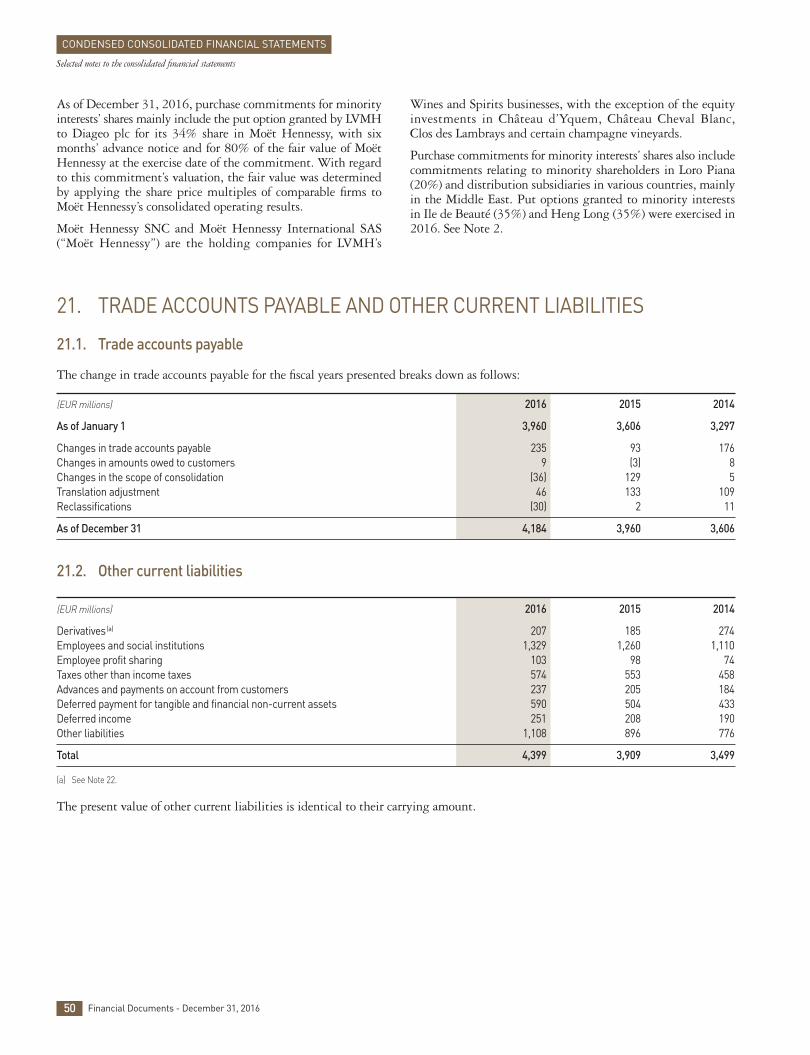
21. TRADE ACCOUNTS PAYABLE AND OTHER CURRENT LIABILITIES
21.1. Trade accounts payable
The change in trade accounts payable for the fiscal years presented breaks down as follows:
(EUR millions) 2016 2015 2014
As of January 1 3,960 3,606 3,297
Changes in trade accounts payable 235 93 176Changes in amounts owed to customers 9 (3) 8Changes in the scope of consolidation (36) 129 5Translation adjustment 46 133 109Reclassifications (30) 2 11
As of December 31 4,184 3,960 3,606
21.2. Other current liabilities
(EUR millions) 2016 2015 2014
Derivatives (a) 207 185 274Employees and social institutions 1,329 1,260 1,110Employee profit sharing 103 98 74Taxes other than income taxes 574 553 458Advances and payments on account from customers 237 205 184Deferred payment for tangible and financial non-current assets 590 504 433Deferred income 251 208 190Other liabilities 1,108 896 776
Total 4,399 3,909 3,499
(a) See Note 22.
The present value of other current liabilities is identical to their carrying amount.
50 Financial Documents - December 31, 2016
CONDENSED CONSOLIDATED FINANCIAL STATEMENTS
Selected notes to the consolidated financial statements
As of December 31, 2016, purchase commitments for minorityinterests’ shares mainly include the put option granted by LVMHto Diageo plc for its 34% share in Moët Hennessy, with sixmonths’ advance notice and for 80% of the fair value of MoëtHennessy at the exercise date of the commitment. With regardto this commitment’s valuation, the fair value was determinedby applying the share price multiples of comparable firms toMoët Hennessy’s consolidated operating results.
Moët Hennessy SNC and Moët Hennessy International SAS(“Moët Hennessy”) are the holding companies for LVMH’s
Wines and Spirits businesses, with the exception of the equityinvestments in Château d’Yquem, Château Cheval Blanc, Clos des Lambrays and certain champagne vineyards.
Purchase commitments for minority interests’ shares also includecommitments relating to minority shareholders in Loro Piana(20%) and distribution subsidiaries in various countries, mainlyin the Middle East. Put options granted to minority interestsin Ile de Beauté (35%) and Heng Long (35%) were exercised in2016. See Note 2.
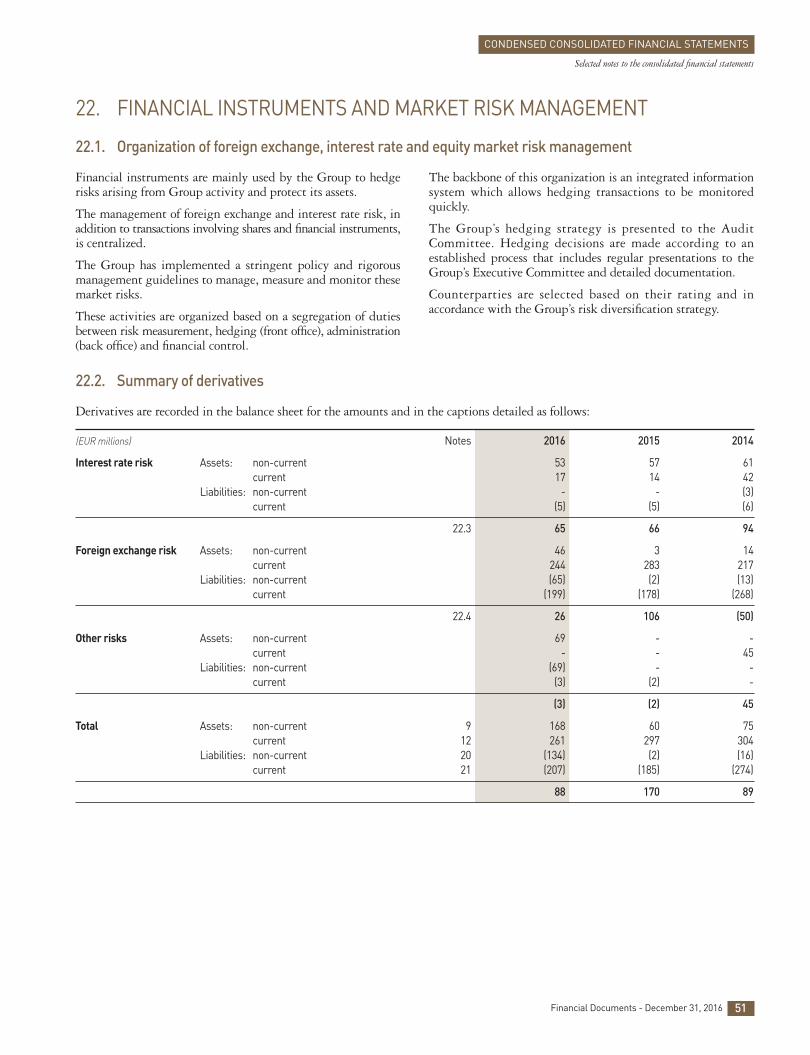
22.2. Summary of derivatives
Derivatives are recorded in the balance sheet for the amounts and in the captions detailed as follows:
(EUR millions) Notes 2016 2015 2014
Interest rate risk Assets: non-current 53 57 61current 17 14 42
Liabilities: non-current - - (3)current (5) (5) (6)
22.3 65 66 94
Foreign exchange risk Assets: non-current 46 3 14current 244 283 217
Liabilities: non-current (65) (2) (13)current (199) (178) (268)
22.4 26 106 (50)
Other risks Assets: non-current 69 - -current - - 45
Liabilities: non-current (69) - -current (3) (2) -
(3) (2) 45
Total Assets: non-current 9 168 60 75current 12 261 297 304
Liabilities: non-current 20 (134) (2) (16)current 21 (207) (185) (274)
88 170 89
Financial instruments are mainly used by the Group to hedgerisks arising from Group activity and protect its assets.
The management of foreign exchange and interest rate risk, inaddition to transactions involving shares and financial instruments,is centralized.
The Group has implemented a stringent policy and rigorousmanagement guidelines to manage, measure and monitor thesemarket risks.
These activities are organized based on a segregation of dutiesbetween risk measurement, hedging (front office), administration(back office) and financial control.
The backbone of this organization is an integrated informationsystem which allows hedging transactions to be monitoredquickly.
The Group’s hedging strategy is presented to the AuditCommittee. Hedging decisions are made according to anestablished process that includes regular presentations to theGroup’s Executive Committee and detailed documentation.
Counterparties are selected based on their rating and inaccordance with the Group’s risk diversification strategy.
22. FINANCIAL INSTRUMENTS AND MARKET RISK MANAGEMENT
22.1. Organization of foreign exchange, interest rate and equity market risk management
51Financial Documents - December 31, 2016
CONDENSED CONSOLIDATED FINANCIAL STATEMENTS
Selected notes to the consolidated financial statements
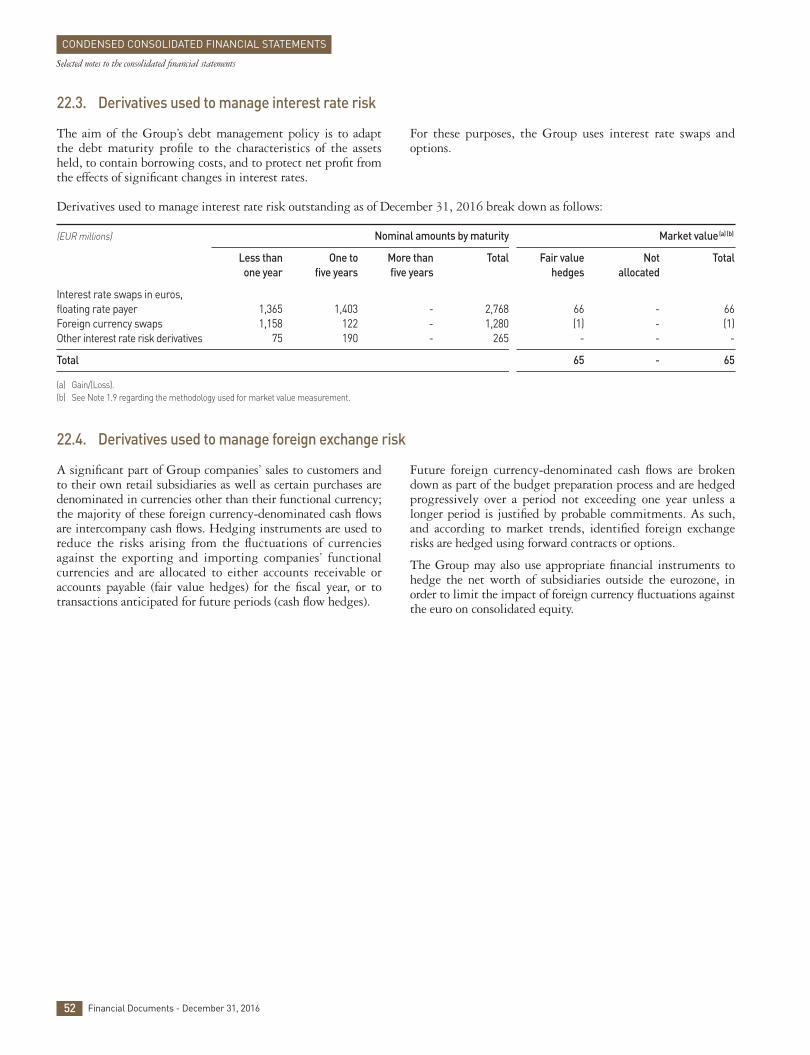
A significant part of Group companies’ sales to customers andto their own retail subsidiaries as well as certain purchases aredenominated in currencies other than their functional currency;the majority of these foreign currency-denominated cash flowsare intercompany cash flows. Hedging instruments are used toreduce the risks arising from the fluctuations of currenciesagainst the exporting and importing companies’ functionalcurrencies and are allocated to either accounts receivable oraccounts payable (fair value hedges) for the fiscal year, or totransactions anticipated for future periods (cash flow hedges).
Future foreign currency-denominated cash flows are brokendown as part of the budget preparation process and are hedgedprogressively over a period not exceeding one year unless alonger period is justified by probable commitments. As such,and according to market trends, identified foreign exchangerisks are hedged using forward contracts or options.
The Group may also use appropriate financial instruments tohedge the net worth of subsidiaries outside the eurozone, inorder to limit the impact of foreign currency fluctuations againstthe euro on consolidated equity.
Derivatives used to manage interest rate risk outstanding as of December 31, 2016 break down as follows:
(EUR millions) Nominal amounts by maturity Market value(a) (b)
Less than One to More than Total Fair value Not Total one year five years five years hedges allocated
Interest rate swaps in euros,floating rate payer 1,365 1,403 - 2,768 66 - 66Foreign currency swaps 1,158 122 - 1,280 (1) - (1)Other interest rate risk derivatives 75 190 - 265 - - -
Total 65 - 65
(a) Gain / (Loss).(b) See Note 1.9 regarding the methodology used for market value measurement.
22.4. Derivatives used to manage foreign exchange risk
The aim of the Group’s debt management policy is to adaptthe debt maturity profile to the characteristics of the assetsheld, to contain borrowing costs, and to protect net profit fromthe effects of significant changes in interest rates.
For these purposes, the Group uses interest rate swaps andoptions.
22.3. Derivatives used to manage interest rate risk
52 Financial Documents - December 31, 2016
CONDENSED CONSOLIDATED FINANCIAL STATEMENTS
Selected notes to the consolidated financial statements
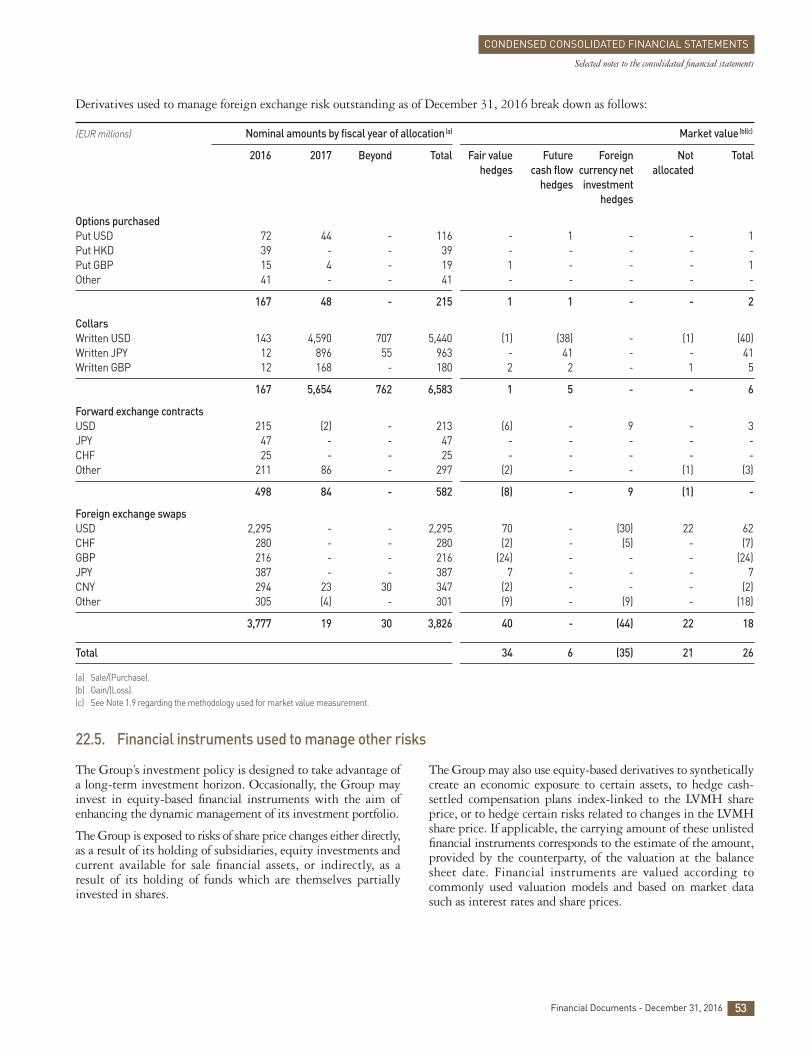
The Group’s investment policy is designed to take advantage ofa long-term investment horizon. Occasionally, the Group mayinvest in equity-based financial instruments with the aim ofenhancing the dynamic management of its investment portfolio.
The Group is exposed to risks of share price changes either directly,as a result of its holding of subsidiaries, equity investments andcurrent available for sale financial assets, or indirectly, as aresult of its holding of funds which are themselves partiallyinvested in shares.
The Group may also use equity-based derivatives to syntheticallycreate an economic exposure to certain assets, to hedge cash-settled compensation plans index-linked to the LVMH shareprice, or to hedge certain risks related to changes in the LVMHshare price. If applicable, the carrying amount of these unlistedfinancial instruments corresponds to the estimate of the amount,provided by the counterparty, of the valuation at the balancesheet date. Financial instruments are valued according tocommonly used valuation models and based on market datasuch as interest rates and share prices.
Derivatives used to manage foreign exchange risk outstanding as of December 31, 2016 break down as follows:
(EUR millions) Nominal amounts by fiscal year of allocation(a) Market value(b)(c)
20 16 2017 Beyond Total Fair value Future Foreign Not Total hedges cash flow currency net allocated hedges investment hedges
Options purchased Put USD 72 44 - 116 - 1 - - 1Put HKD 39 - - 39 - - - - -Put GBP 15 4 - 19 1 - - - 1Other 41 - - 41 - - - - -
167 48 - 215 1 1 - - 2
Collars Written USD 143 4,590 707 5,440 (1) (38) - (1) (40)Written JPY 12 896 55 963 - 41 - - 41Written GBP 12 168 - 180 2 2 - 1 5
167 5,654 762 6,583 1 5 - - 6
Forward exchange contracts USD 215 (2) - 213 (6) - 9 - 3JPY 47 - - 47 - - - - -CHF 25 - - 25 - - - - -Other 211 86 - 297 (2) - - (1) (3)
498 84 - 582 (8) - 9 (1) -
Foreign exchange swaps USD 2,295 - - 2,295 70 - (30) 22 62CHF 280 - - 280 (2) - (5) - (7)GBP 216 - - 216 (24) - - - (24)JPY 387 - - 387 7 - - - 7CNY 294 23 30 347 (2) - - - (2)Other 305 (4) - 301 (9) - (9) - (18)
3,777 19 30 3,826 40 - (44) 22 18
Total 34 6 (35) 21 26
(a) Sale / (Purchase).(b) Gain / (Loss).(c) See Note 1.9 regarding the methodology used for market value measurement.
22.5. Financial instruments used to manage other risks
53Financial Documents - December 31, 2016
CONDENSED CONSOLIDATED FINANCIAL STATEMENTS
Selected notes to the consolidated financial statements
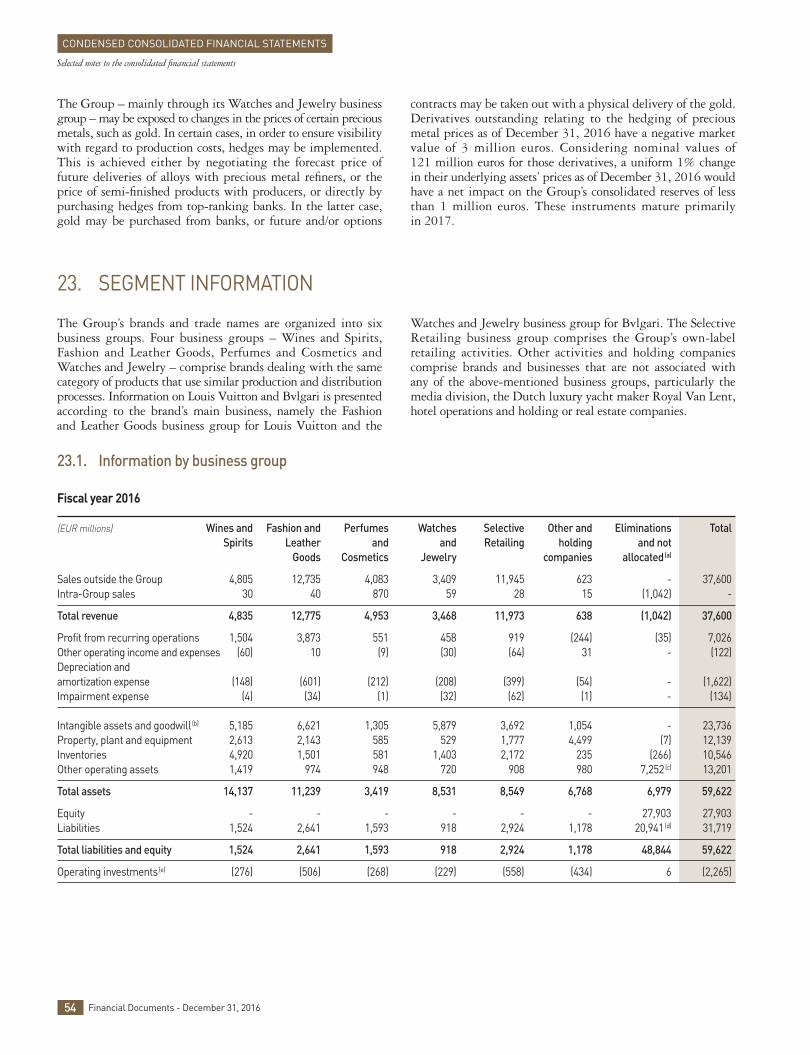
23.1. Information by business group
Fiscal year 2016
(EUR millions) Wines and Fashion and Perfumes Watches Selective Other and Eliminations Total Spirits Leather and and Retailing holding and not Goods Cosmetics Jewelry companies allocated(a)
Sales outside the Group 4,805 12,735 4,083 3,409 11,945 623 - 37,600Intra-Group sales 30 40 870 59 28 15 (1,042) -
Total revenue 4,835 12,775 4,953 3,468 11,973 638 (1,042) 37,600
Profit from recurring operations 1,504 3,873 551 458 919 (244) (35) 7,026Other operating income and expenses (60) 10 (9) (30) (64) 31 - (122)Depreciation and amortization expense (148) (601) (212) (208) (399) (54) - (1,622)Impairment expense (4) (34) (1) (32) (62) (1) - (134)
Intangible assets and goodwill(b) 5,185 6,621 1,305 5,879 3,692 1,054 - 23,736Property, plant and equipment 2,613 2,143 585 529 1,777 4,499 (7) 12,139Inventories 4,920 1,501 581 1,403 2,172 235 (266) 10,546Other operating assets 1,419 974 948 720 908 980 7,252(c) 13,201
Total assets 14,137 11,239 3,419 8,531 8,549 6,768 6,979 59,622
Equity - - - - - - 27,903 27,903Liabilities 1,524 2,641 1,593 918 2,924 1,178 20,941(d) 31,719
Total liabilities and equity 1,524 2,641 1,593 918 2,924 1,178 48,844 59,622
Operating investments(e) (276) (506) (268) (229) (558) (434) 6 (2,265)
The Group’s brands and trade names are organized into sixbusiness groups. Four business groups – Wines and Spirits,Fashion and Leather Goods, Perfumes and Cosmetics andWatches and Jewelry – comprise brands dealing with the samecategory of products that use similar production and distributionprocesses. Information on Louis Vuitton and Bvlgari is presentedaccording to the brand’s main business, namely the Fashionand Leather Goods business group for Louis Vuitton and the
Watches and Jewelry business group for Bvlgari. The SelectiveRetailing business group comprises the Group’s own-labelretailing activities. Other activities and holding companiescomprise brands and businesses that are not associated withany of the above-mentioned business groups, particularly themedia division, the Dutch luxury yacht maker Royal Van Lent,hotel operations and holding or real estate companies.
23. SEGMENT INFORMATION
The Group – mainly through its Watches and Jewelry businessgroup – may be exposed to changes in the prices of certain preciousmetals, such as gold. In certain cases, in order to ensure visibilitywith regard to production costs, hedges may be implemented.This is achieved either by negotiating the forecast price offuture deliveries of alloys with precious metal refiners, or theprice of semi-finished products with producers, or directly bypurchasing hedges from top-ranking banks. In the latter case,gold may be purchased from banks, or future and / or options
contracts may be taken out with a physical delivery of the gold.Derivatives outstanding relating to the hedging of preciousmetal prices as of December 31, 2016 have a negative marketvalue of 3 million euros. Considering nominal values of121 million euros for those derivatives, a uniform 1% changein their underlying assets’ prices as of December 31, 2016 wouldhave a net impact on the Group’s consolidated reserves of lessthan 1 million euros. These instruments mature primarilyin 2017.
54 Financial Documents - December 31, 2016
CONDENSED CONSOLIDATED FINANCIAL STATEMENTS
Selected notes to the consolidated financial statements
2_VA_V3 24/01/2017 20:08 Page54
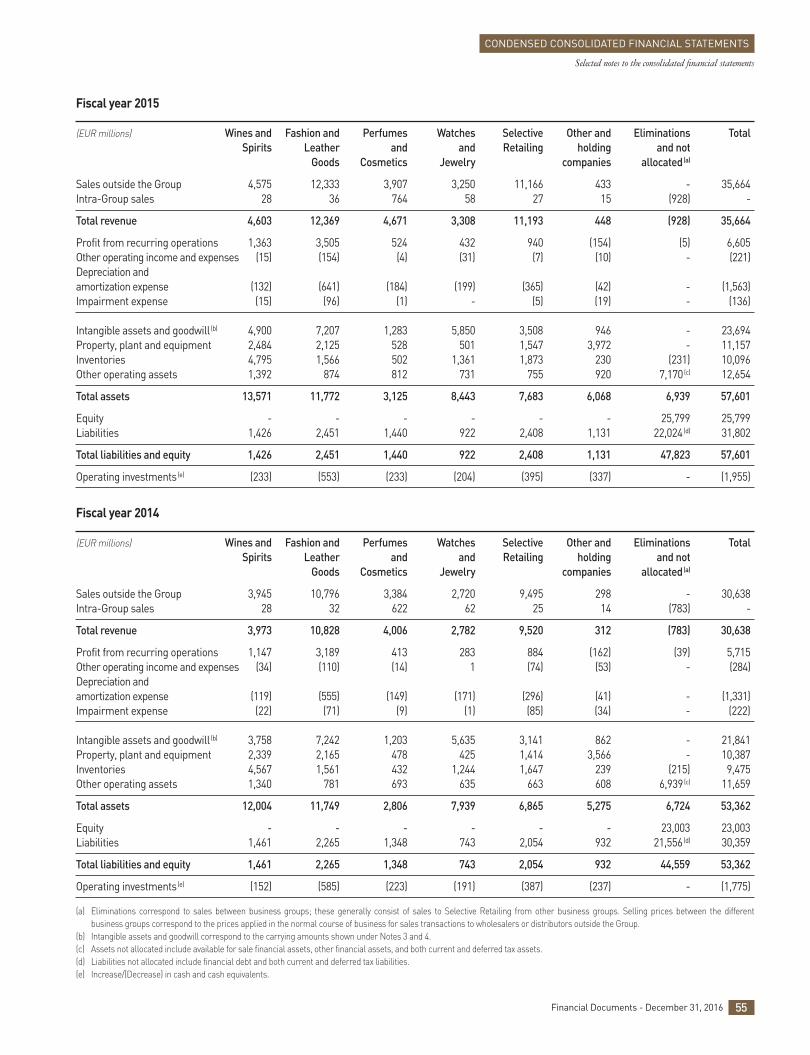
Fiscal year 2015
(EUR millions) Wines and Fashion and Perfumes Watches Selective Other and Eliminations Total Spirits Leather and and Retailing holding and not Goods Cosmetics Jewelry companies allocated(a)
Sales outside the Group 4,575 12,333 3,907 3,250 11,166 433 - 35,664Intra-Group sales 28 36 764 58 27 15 (928) -
Total revenue 4,603 12,369 4,671 3,308 11,193 448 (928) 35,664
Profit from recurring operations 1,363 3,505 524 432 940 (154) (5) 6,605Other operating income and expenses (15) (154) (4) (31) (7) (10) - (221)Depreciation and amortization expense (132) (641) (184) (199) (365) (42) - (1,563)Impairment expense (15) (96) (1) - (5) (19) - (136)
Intangible assets and goodwill(b) 4,900 7,207 1,283 5,850 3,508 946 - 23,694Property, plant and equipment 2,484 2,125 528 501 1,547 3,972 - 11,157Inventories 4,795 1,566 502 1,361 1,873 230 (231) 10,096Other operating assets 1,392 874 812 731 755 920 7,170(c) 12,654
Total assets 13,571 11,772 3,125 8,443 7,683 6,068 6,939 57,601
Equity - - - - - - 25,799 25,799Liabilities 1,426 2,451 1,440 922 2,408 1,131 22,024(d) 31,802
Total liabilities and equity 1,426 2,451 1,440 922 2,408 1,131 47,823 57,601
Operating investments(e) (233) (553) (233) (204) (395) (337) - (1,955)
Fiscal year 2014
(EUR millions) Wines and Fashion and Perfumes Watches Selective Other and Eliminations Total Spirits Leather and and Retailing holding and not Goods Cosmetics Jewelry companies allocated(a)
Sales outside the Group 3,945 10,796 3,384 2,720 9,495 298 - 30,638Intra-Group sales 28 32 622 62 25 14 (783) -
Total revenue 3,973 10,828 4,006 2,782 9,520 312 (783) 30,638
Profit from recurring operations 1,147 3,189 413 283 884 (162) (39) 5,715Other operating income and expenses (34) (110) (14) 1 (74) (53) - (284)Depreciation and amortization expense (119) (555) (149) (171) (296) (41) - (1,331)Impairment expense (22) (71) (9) (1) (85) (34) - (222)
Intangible assets and goodwill(b) 3,758 7,242 1,203 5,635 3,141 862 - 21,841Property, plant and equipment 2,339 2,165 478 425 1,414 3,566 - 10,387Inventories 4,567 1,561 432 1,244 1,647 239 (215) 9,475Other operating assets 1,340 781 693 635 663 608 6,939(c) 11,659
Total assets 12,004 11,749 2,806 7,939 6,865 5,275 6,724 53,362
Equity - - - - - - 23,003 23,003Liabilities 1,461 2,265 1,348 743 2,054 932 21,556(d) 30,359
Total liabilities and equity 1,461 2,265 1,348 743 2,054 932 44,559 53,362
Operating investments(e) (152) (585) (223) (191) (387) (237) - (1,775)
(a) Eliminations correspond to sales between business groups; these generally consist of sales to Selective Retailing from other business groups. Selling prices between the differentbusiness groups correspond to the prices applied in the normal course of business for sales transactions to wholesalers or distributors outside the Group.
(b) Intangible assets and goodwill correspond to the carrying amounts shown under Notes 3 and 4.(c) Assets not allocated include available for sale financial assets, other financial assets, and both current and deferred tax assets.(d) Liabilities not allocated include financial debt and both current and deferred tax liabilities.(e) Increase / (Decrease) in cash and cash equivalents.
55Financial Documents - December 31, 2016
CONDENSED CONSOLIDATED FINANCIAL STATEMENTS
Selected notes to the consolidated financial statements
2_VA_V3 26/01/2017 13:40 Page55
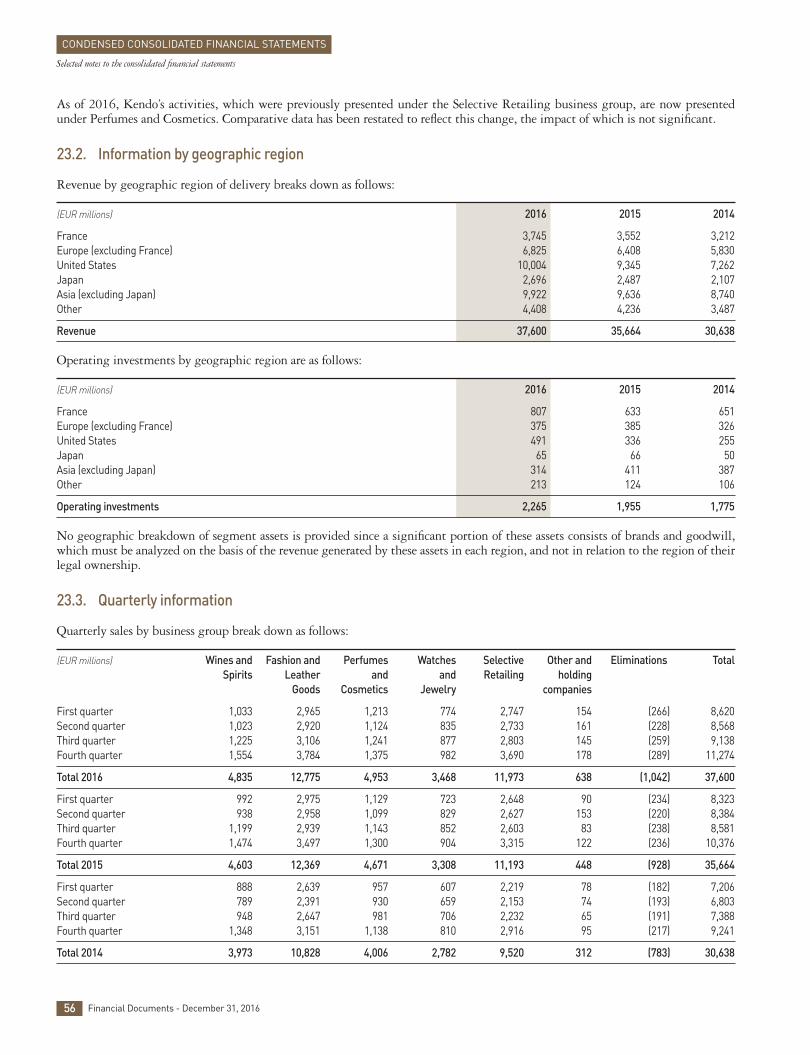
As of 2016, Kendo’s activities, which were previously presented under the Selective Retailing business group, are now presentedunder Perfumes and Cosmetics. Comparative data has been restated to reflect this change, the impact of which is not significant.
23.2. Information by geographic region
Revenue by geographic region of delivery breaks down as follows:
(EUR millions) 2016 2015 2014
France 3,745 3,552 3,212Europe (excluding France) 6,825 6,408 5,830United States 10,004 9,345 7,262Japan 2,696 2,487 2,107Asia (excluding Japan) 9,922 9,636 8,740Other 4,408 4,236 3,487
Revenue 37,600 35,664 30,638
Operating investments by geographic region are as follows:
(EUR millions) 2016 2015 2014
France 807 633 651Europe (excluding France) 375 385 326United States 491 336 255Japan 65 66 50Asia (excluding Japan) 314 411 387Other 213 124 106
Operating investments 2,265 1,955 1,775
No geographic breakdown of segment assets is provided since a significant portion of these assets consists of brands and goodwill,which must be analyzed on the basis of the revenue generated by these assets in each region, and not in relation to the region of theirlegal ownership.
23.3. Quarterly information
Quarterly sales by business group break down as follows:
(EUR millions) Wines and Fashion and Perfumes Watches Selective Other and Eliminations Total Spirits Leather and and Retailing holding Goods Cosmetics Jewelry companies
First quarter 1,033 2,965 1,213 774 2,747 154 (266) 8,620Second quarter 1,023 2,920 1,124 835 2,733 161 (228) 8,568Third quarter 1,225 3,106 1,241 877 2,803 145 (259) 9,138Fourth quarter 1,554 3,784 1,375 982 3,690 178 (289) 11,274
Total 2016 4,835 12,775 4,953 3,468 11,973 638 (1,042) 37,600
First quarter 992 2,975 1,129 723 2,648 90 (234) 8,323Second quarter 938 2,958 1,099 829 2,627 153 (220) 8,384Third quarter 1,199 2,939 1,143 852 2,603 83 (238) 8,581Fourth quarter 1,474 3,497 1,300 904 3,315 122 (236) 10,376
Total 2015 4,603 12,369 4,671 3,308 11,193 448 (928) 35,664
First quarter 888 2,639 957 607 2,219 78 (182) 7,206Second quarter 789 2,391 930 659 2,153 74 (193) 6,803Third quarter 948 2,647 981 706 2,232 65 (191) 7,388Fourth quarter 1,348 3,151 1,138 810 2,916 95 (217) 9,241
Total 2014 3,973 10,828 4,006 2,782 9,520 312 (783) 30,638
56 Financial Documents - December 31, 2016
CONDENSED CONSOLIDATED FINANCIAL STATEMENTS
Selected notes to the consolidated financial statements
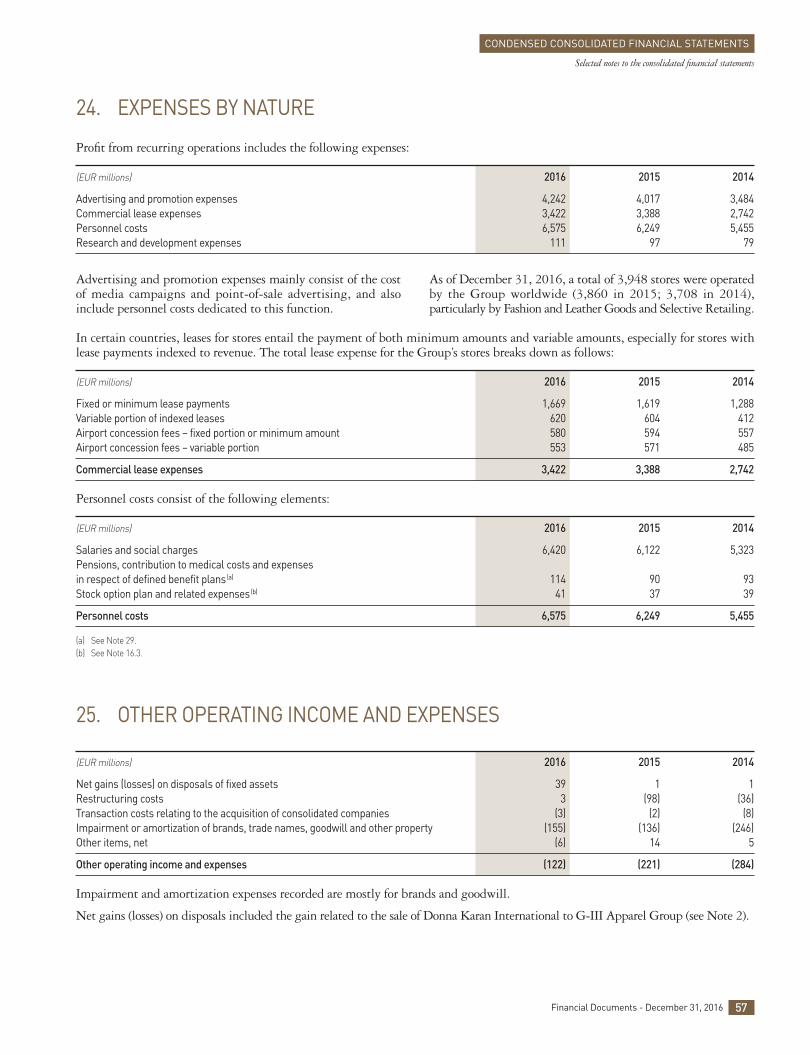
In certain countries, leases for stores entail the payment of both minimum amounts and variable amounts, especially for stores withlease payments indexed to revenue. The total lease expense for the Group’s stores breaks down as follows:
(EUR millions) 2016 2015 2014
Fixed or minimum lease payments 1,669 1,619 1,288Variable portion of indexed leases 620 604 412Airport concession fees – fixed portion or minimum amount 580 594 557Airport concession fees – variable portion 553 571 485
Commercial lease expenses 3,422 3,388 2,742
Personnel costs consist of the following elements:
(EUR millions) 2016 2015 2014
Salaries and social charges 6,420 6,122 5,323Pensions, contribution to medical costs and expensesin respect of defined benefit plans (a) 114 90 93Stock option plan and related expenses (b) 41 37 39
Personnel costs 6,575 6,249 5,455
(a) See Note 29.(b) See Note 16.3.
25. OTHER OPERATING INCOME AND EXPENSES
(EUR millions) 2016 2015 2014
Net gains (losses) on disposals of fixed assets 39 1 1Restructuring costs 3 (98) (36)Transaction costs relating to the acquisition of consolidated companies (3) (2) (8)Impairment or amortization of brands, trade names, goodwill and other property (155) (136) (246)Other items, net (6) 14 5
Other operating income and expenses (122) (221) (284)
Impairment and amortization expenses recorded are mostly for brands and goodwill.
Net gains (losses) on disposals included the gain related to the sale of Donna Karan International to G-III Apparel Group (see Note 2).
Advertising and promotion expenses mainly consist of the costof media campaigns and point-of-sale advertising, and alsoinclude personnel costs dedicated to this function.
As of December 31, 2016, a total of 3,948 stores were operatedby the Group worldwide (3,860 in 2015; 3,708 in 2014),particularly by Fashion and Leather Goods and Selective Retailing.
24. EXPENSES BY NATURE
Profit from recurring operations includes the following expenses:
(EUR millions) 2016 2015 2014
Advertising and promotion expenses 4,242 4,017 3,484Commercial lease expenses 3,422 3,388 2,742Personnel costs 6,575 6,249 5,455Research and development expenses 111 97 79
57Financial Documents - December 31, 2016
CONDENSED CONSOLIDATED FINANCIAL STATEMENTS
Selected notes to the consolidated financial statements
2_VA_V3 26/01/2017 14:57 Page57
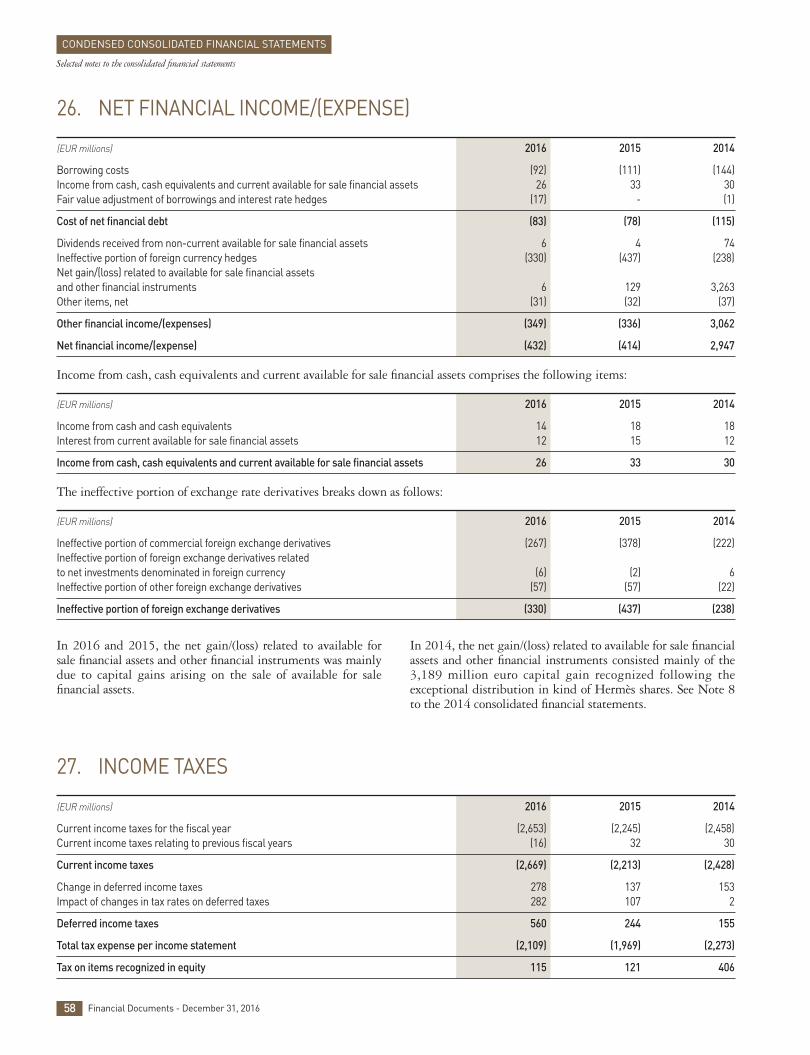
27. INCOME TAXES
(EUR millions) 2016 2015 2014
Current income taxes for the fiscal year (2,653) (2,245) (2,458)Current income taxes relating to previous fiscal years (16) 32 30
Current income taxes (2,669) (2,213) (2,428)
Change in deferred income taxes 278 137 153Impact of changes in tax rates on deferred taxes 282 107 2
Deferred income taxes 560 244 155
Total tax expense per income statement (2,109) (1,969) (2,273)
Tax on items recognized in equity 115 121 406
In 2016 and 2015, the net gain / (loss) related to available forsale financial assets and other financial instruments was mainlydue to capital gains arising on the sale of available for salefinancial assets.
In 2014, the net gain / (loss) related to available for sale financialassets and other financial instruments consisted mainly of the3,189 million euro capital gain recognized following theexceptional distribution in kind of Hermès shares. See Note 8to the 2014 consolidated financial statements.
26. NET FINANCIAL INCOME / (EXPENSE)
(EUR millions) 2016 2015 2014
Borrowing costs (92) (111) (144)Income from cash, cash equivalents and current available for sale financial assets 26 33 30Fair value adjustment of borrowings and interest rate hedges (17) - (1)
Cost of net financial debt (83) (78) (115)
Dividends received from non-current available for sale financial assets 6 4 74Ineffective portion of foreign currency hedges (330) (437) (238)Net gain / (loss) related to available for sale financial assets and other financial instruments 6 129 3,263Other items, net (31) (32) (37)
Other financial income / (expenses) (349) (336) 3,062
Net financial income / (expense) (432) (414) 2,947
Income from cash, cash equivalents and current available for sale financial assets comprises the following items:
(EUR millions) 2016 2015 2014
Income from cash and cash equivalents 14 18 18Interest from current available for sale financial assets 12 15 12
Income from cash, cash equivalents and current available for sale financial assets 26 33 30
The ineffective portion of exchange rate derivatives breaks down as follows:
(EUR millions) 2016 2015 2014
Ineffective portion of commercial foreign exchange derivatives (267) (378) (222)Ineffective portion of foreign exchange derivatives related to net investments denominated in foreign currency (6) (2) 6Ineffective portion of other foreign exchange derivatives (57) (57) (22)
Ineffective portion of foreign exchange derivatives (330) (437) (238)
58 Financial Documents - December 31, 2016
CONDENSED CONSOLIDATED FINANCIAL STATEMENTS
Selected notes to the consolidated financial statements
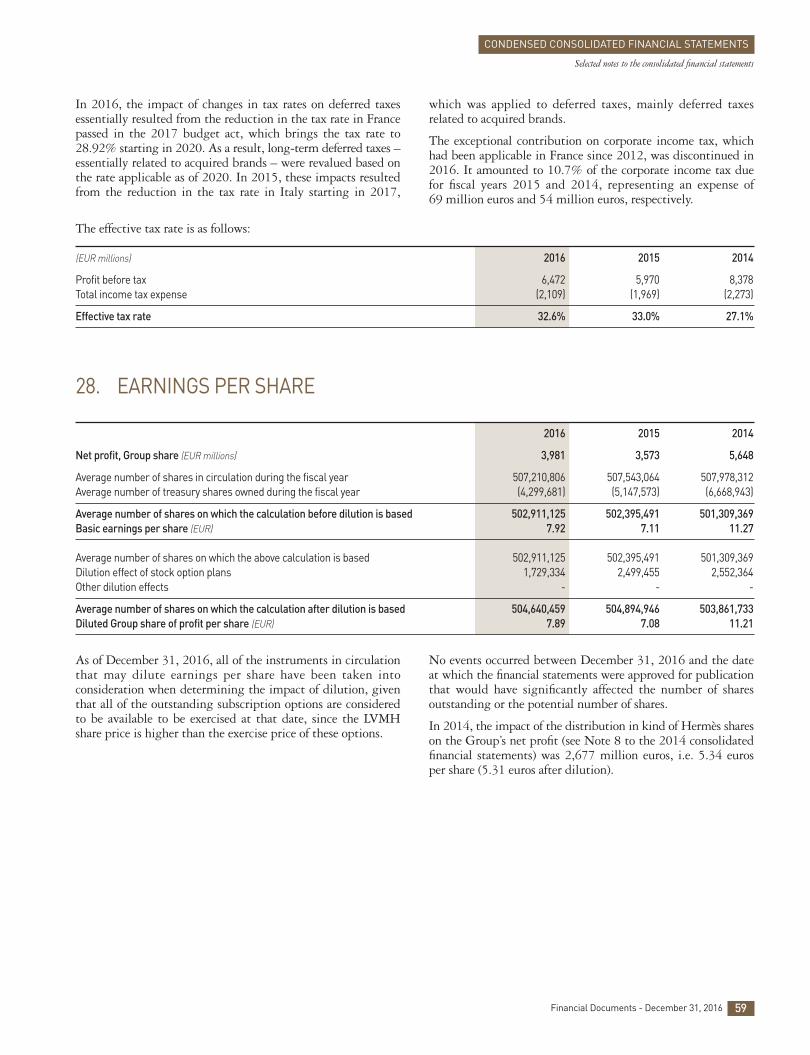
As of December 31, 2016, all of the instruments in circulationthat may dilute earnings per share have been taken intoconsideration when determining the impact of dilution, giventhat all of the outstanding subscription options are consideredto be available to be exercised at that date, since the LVMHshare price is higher than the exercise price of these options.
No events occurred between December 31, 2016 and the dateat which the financial statements were approved for publicationthat would have significantly affected the number of sharesoutstanding or the potential number of shares.
In 2014, the impact of the distribution in kind of Hermès shareson the Group’s net profit (see Note 8 to the 2014 consolidatedfinancial statements) was 2,677 million euros, i.e. 5.34 eurosper share (5.31 euros after dilution).
The effective tax rate is as follows:
(EUR millions) 2016 2015 2014
Profit before tax 6,472 5,970 8,378Total income tax expense (2,109) (1,969) (2,273)
Effective tax rate 32.6% 33.0% 27.1%
28. EARNINGS PER SHARE
2016 2015 2014
Net profit, Group share (EUR millions) 3,981 3,573 5,648
Average number of shares in circulation during the fiscal year 507,210,806 507,543,064 507,978,312Average number of treasury shares owned during the fiscal year (4,299,681) (5,147,573) (6,668,943)
Average number of shares on which the calculation before dilution is based 502,911,125 502,395,491 501,309,369Basic earnings per share (EUR) 7.92 7.11 11.27
Average number of shares on which the above calculation is based 502,911,125 502,395,491 501,309,369Dilution effect of stock option plans 1,729,334 2,499,455 2,552,364Other dilution effects - - -
Average number of shares on which the calculation after dilution is based 504,640,459 504,894,946 503,861,733Diluted Group share of profit per share (EUR) 7.89 7.08 11.21
59Financial Documents - December 31, 2016
CONDENSED CONSOLIDATED FINANCIAL STATEMENTS
Selected notes to the consolidated financial statements
In 2016, the impact of changes in tax rates on deferred taxesessentially resulted from the reduction in the tax rate in Francepassed in the 2017 budget act, which brings the tax rate to28.92% starting in 2020. As a result, long-term deferred taxes –essentially related to acquired brands – were revalued based onthe rate applicable as of 2020. In 2015, these impacts resultedfrom the reduction in the tax rate in Italy starting in 2017,
which was applied to deferred taxes, mainly deferred taxesrelated to acquired brands.
The exceptional contribution on corporate income tax, whichhad been applicable in France since 2012, was discontinued in2016. It amounted to 10.7% of the corporate income tax duefor fiscal years 2015 and 2014, representing an expense of69 million euros and 54 million euros, respectively.
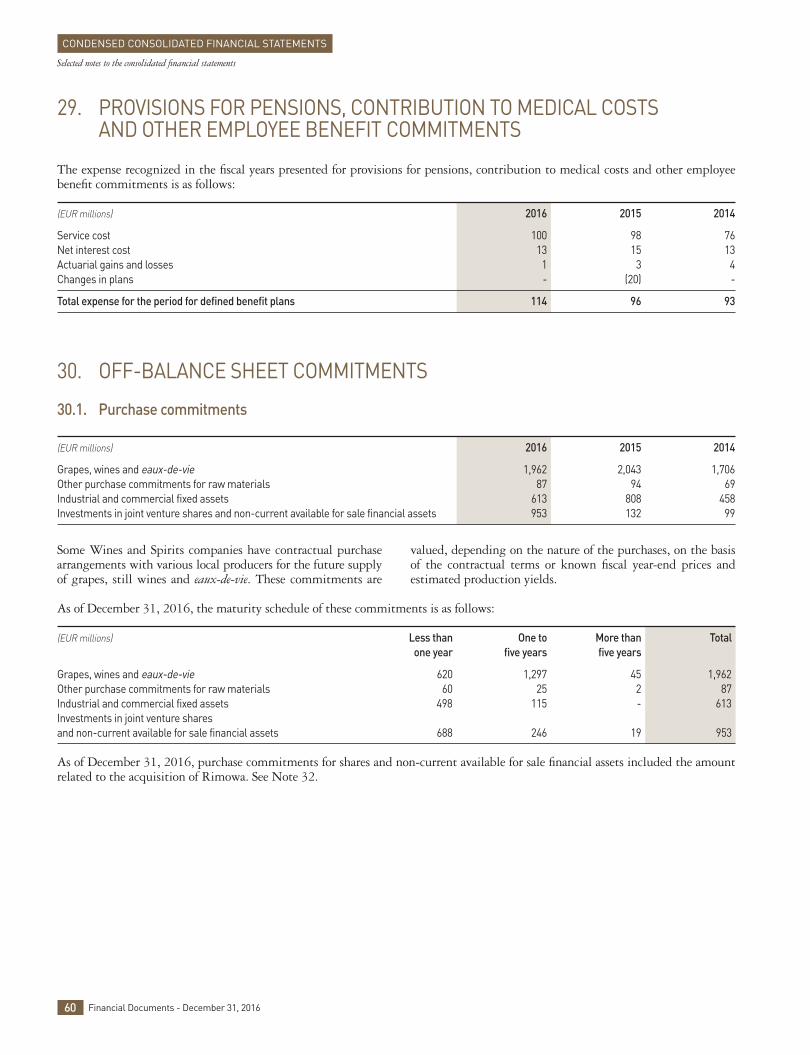
As of December 31, 2016, the maturity schedule of these commitments is as follows:
(EUR millions) Less than One to More than Total one year five years five years
Grapes, wines and eaux-de-vie 620 1,297 45 1,962Other purchase commitments for raw materials 60 25 2 87Industrial and commercial fixed assets 498 115 - 613Investments in joint venture shares and non-current available for sale financial assets 688 246 19 953
As of December 31, 2016, purchase commitments for shares and non-current available for sale financial assets included the amountrelated to the acquisition of Rimowa. See Note 32.
Some Wines and Spirits companies have contractual purchasearrangements with various local producers for the future supplyof grapes, still wines and eaux-de-vie. These commitments are
valued, depending on the nature of the purchases, on the basisof the contractual terms or known fiscal year-end prices andestimated production yields.
29. PROVISIONS FOR PENSIONS, CONTRIBUTION TO MEDICAL COSTS AND OTHER EMPLOYEE BENEFIT COMMITMENTS
The expense recognized in the fiscal years presented for provisions for pensions, contribution to medical costs and other employeebenefit commitments is as follows:
(EUR millions) 2016 2015 2014
Service cost 100 98 76Net interest cost 13 15 13Actuarial gains and losses 1 3 4Changes in plans - (20) -
Total expense for the period for defined benefit plans 114 96 93
30. OFF-BALANCE SHEET COMMITMENTS
30.1. Purchase commitments
(EUR millions) 2016 2015 2014
Grapes, wines and eaux-de-vie 1,962 2,043 1,706Other purchase commitments for raw materials 87 94 69Industrial and commercial fixed assets 613 808 458Investments in joint venture shares and non-current available for sale financial assets 953 132 99
60 Financial Documents - December 31, 2016
CONDENSED CONSOLIDATED FINANCIAL STATEMENTS
Selected notes to the consolidated financial statements
2_VA_V3 24/01/2017 20:20 Page60
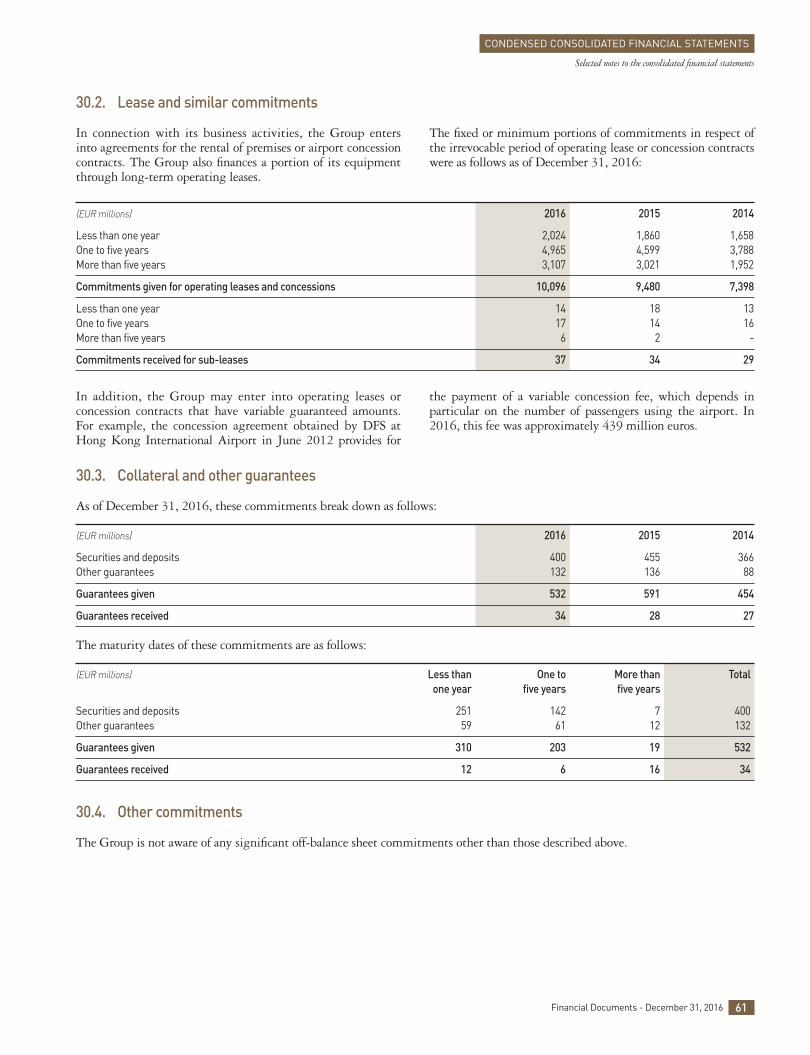
30.3. Collateral and other guarantees
As of December 31, 2016, these commitments break down as follows:
(EUR millions) 2016 2015 2014
Securities and deposits 400 455 366Other guarantees 132 136 88
Guarantees given 532 591 454
Guarantees received 34 28 27
The maturity dates of these commitments are as follows:
(EUR millions) Less than One to More than Total one year five years five years
Securities and deposits 251 142 7 400Other guarantees 59 61 12 132
Guarantees given 310 203 19 532
Guarantees received 12 6 16 34
30.4. Other commitments
The Group is not aware of any significant off-balance sheet commitments other than those described above.
In addition, the Group may enter into operating leases orconcession contracts that have variable guaranteed amounts.For example, the concession agreement obtained by DFS atHong Kong International Airport in June 2012 provides for
the payment of a variable concession fee, which depends inparticular on the number of passengers using the airport. In2016, this fee was approximately 439 million euros.
(EUR millions) 2016 2015 2014
Less than one year 2,024 1,860 1,658One to five years 4,965 4,599 3,788More than five years 3,107 3,021 1,952
Commitments given for operating leases and concessions 10,096 9,480 7,398
Less than one year 14 18 13One to five years 17 14 16More than five years 6 2 -
Commitments received for sub-leases 37 34 29
61Financial Documents - December 31, 2016
CONDENSED CONSOLIDATED FINANCIAL STATEMENTS
Selected notes to the consolidated financial statements
In connection with its business activities, the Group entersinto agreements for the rental of premises or airport concessioncontracts. The Group also finances a portion of its equipmentthrough long-term operating leases.
The fixed or minimum portions of commitments in respect ofthe irrevocable period of operating lease or concession contractswere as follows as of December 31, 2016:
30.2. Lease and similar commitments
2_VA_V3 24/01/2017 20:20 Page61
On January 23, 2017, pursuant to the transaction agreementannounced on October 4, 2016, LVMH acquired, for 640 millioneuros, an 80% stake in Rimowa, the luggage and leather goodsmaker founded in Cologne in 1898 and known for its innovative,high-quality luggage. The 20% of the share capital that has notbeen acquired is covered by a put option granted by LVMH,exercisable from 2020. Rimowa will be fully consolidated witheffect from January 2017. Rimowa’s revenue for 2016 is expectedto exceed 400 million euros.
On January 20, 2017, the put option for the remaining LoroPiana shares held by the Loro Piana family was partially exercised.The sale will take place in February 2017 and will increaseLVMH’s stake in Loro Piana by 4.8%, bringing its shareholdingto 84.8%.
No other significant subsequent events occurred betweenDecember 31, 2016 and January 26, 2017, the date at whichthe financial statements were approved for publication by theBoard of Directors.
Financial Documents - December 31, 201662
31. EXCEPTIONAL EVENTS AND LITIGATION
No significant change in exceptional events and litigation occurred during the fiscal year.
32. SUBSEQUENT EVENTS
CONDENSED CONSOLIDATED FINANCIAL STATEMENTS
Selected notes to the consolidated financial statements
2_VA_V3 24/01/2017 20:20 Page62

Financial Documents - December 31, 2016 63

Financial Documents - December 31, 201664

Design and production: Agence Marc Praquin
For any information:LVMH, 22 avenue Montaigne - 75008 Paris
Tel. +33 1 44 13 22 22 - Fax +33 1 44 13 21 19
www.lvmh.com