LVA$816.111$$ … ENGINEERING Skriptum...HYDRAULIC$ENGINEERINGANDWATER$ MANAGEMENT$...
109
LVA 816.111 HYDRAULIC ENGINEERING AND WATER MANAGEMENT (Course notes for UBRM students) Cedomil Josip JUGOVIC Tessa KLIMOWICZ H81 Department of Water, Atmosphere and Environment H816 Institute of Water Management, Hydrology and Hydraulic Engineering Wien, 2012
Transcript of LVA$816.111$$ … ENGINEERING Skriptum...HYDRAULIC$ENGINEERINGANDWATER$ MANAGEMENT$...

LVA 816.111
HYDRAULIC ENGINEERING AND WATER MANAGEMENT (Course notes for UBRM students)
Cedomil Josip JUGOVIC Tessa KLIMOWICZ
H81 Department of Water, Atmosphere and Environment H816 Institute of Water Management, Hydrology and Hydraulic Engineering
Wien, 2012

2
3
TABLE OF CONTENTS 1 Introduction ....................................................................................................................... 5 2 Water Management .......................................................................................................... 6 2.1 Historical Approach ............................................................................................................... 6 2.2 Water Resources Sustainability ........................................................................................ 7 2.3 European Water Framework Directive .......................................................................... 9
3 Hydrology ......................................................................................................................... 13 3.1 Hydrological Cycle .............................................................................................................. 13 3.2 Watershed .............................................................................................................................. 15 3.2.1 The orders of a river .................................................................................................................... 17
3.3 Hydrometry ........................................................................................................................... 18 3.3.1 Stream gauging methods ........................................................................................................... 18 Area-‐velocity method ................................................................................................................................. 20 Tracer dilution method .............................................................................................................................. 22
4 Hydraulics ........................................................................................................................ 25 4.1 Physical properties of fluids ............................................................................................ 25 4.1.1 Weight and mass ........................................................................................................................... 25 4.1.2 The Systéme International d’Unités´-‐SI .............................................................................. 25 4.1.3 Density ............................................................................................................................................... 27 4.1.4 Specific weight ............................................................................................................................... 27 4.1.5 Viscosity ............................................................................................................................................ 28 4.1.6 Pressure ............................................................................................................................................ 28 4.1.7 Pressure on submerged curved surfaces ........................................................................... 28
4.2 Theoretical bases of hydraulics ...................................................................................... 29 4.2.1 Types of energy ............................................................................................................................. 31 4.2.2 Fundamentals of fluid flow ....................................................................................................... 31
4.3 Types of flow ......................................................................................................................... 36 4.3.1 Fluid flow in pipes ........................................................................................................................ 36 Pipe roughness .............................................................................................................................................. 38 4.3.2 Open channel flow ........................................................................................................................ 39 Normal depth of flow .................................................................................................................................. 42
Critical Flow ..................................................................................................................................... 42 5 River Engineering .......................................................................................................... 45 5.1 River Morphology ................................................................................................................ 45 5.1.1 Riverbed forming processes .................................................................................................... 49 5.1.2 Valley shapes .................................................................................................................................. 52
5.2 Channel Design ..................................................................................................................... 53 5.2.1 Rigid-‐Boundary Channels ......................................................................................................... 54 5.2.2 Erodible Channels ......................................................................................................................... 54
5.3 Profile Stabilization ............................................................................................................ 54 5.3.1 Profile stabilization construction materials ...................................................................... 55 5.3.2 Vegetation profile of a watercourse ..................................................................................... 56 5.3.3 Artificial profile stabilization ................................................................................................... 60 5.3.4 Transverse structures ................................................................................................................. 64
6 Hydraulic Structures .................................................................................................... 66 6.1 Dam Engineering ................................................................................................................. 66
4
6.1.1 Embankment Dam Form and Characteristics .................................................................. 67 6.1.2 Concrete Dam Form and Characteristics ............................................................................ 68 6.1.3 Impacts of Dams ............................................................................................................................ 70
6.2 Site assessment and selection of type of dam ............................................................ 72 6.3 Dam Outlet Works ............................................................................................................... 73 6.3.1 Spillways ........................................................................................................................................... 73 6.3.2 Bottom outlets ................................................................................................................................ 75 6.3.3 Cut-‐offs .............................................................................................................................................. 75
6.4 Dam diversion works ......................................................................................................... 76 6.4.1 Fish passes ....................................................................................................................................... 76
6.5 Design flood and flood routing ....................................................................................... 78 6.6 Energy dissipation .............................................................................................................. 79 6.7 Dam Safety ............................................................................................................................. 80 6.7.1 Instrumentation ............................................................................................................................ 80
7 Hydropower .................................................................................................................... 82 7.1 Types of hydropower plants ............................................................................................ 83 7.2 Components of a hydropower plant ............................................................................. 84 7.2.1 Turbines ............................................................................................................................................ 86
7.3 Hydroelectric power .......................................................................................................... 90 7.3.1 Energy determination ................................................................................................................. 90 7.3.2 Power production plan ............................................................................................................... 91 7.3.3 Classification of power production ....................................................................................... 93
8 Scale Models .................................................................................................................... 97 8.1 Models with fixed bed ...................................................................................................... 104 8.2 Models with moveable bed ............................................................................................ 105
9 Bibliography .................................................................................................................. 107

5
1 Introduction These course notes are an additional support for the UBRM students of the BOKU along with the given lectures and the slides presented there which are available on the BOKU online site. Hydraulic engineering is a form of civil engineering that focuses on the flow and transport of fluids, mainly water. Hydraulic engineering is closely related to the design and construction of structures such as dams, channels and canals as well as to environmental aspects of engineering. The objectives of hydraulic engineering include increasing flood protection, improving the ecological function of aquatic resources, stabilizing water and irrigation courses, hydropower generation, canalization for navigation and ensuring a stable drinking water supply. (Novak P. , Moffat, Nalluri, & Narayanan, 2001) Water management has become a key issue on international, national and local levels within the past years. The modern definition describes the actions of planning, developing, maintaining, protecting and distributing water resources. In this course we will be examining the environmental, ecological and physical aspects of hydraulic engineering and water management and their impact on the environment and society in general.
6
2 Water Management
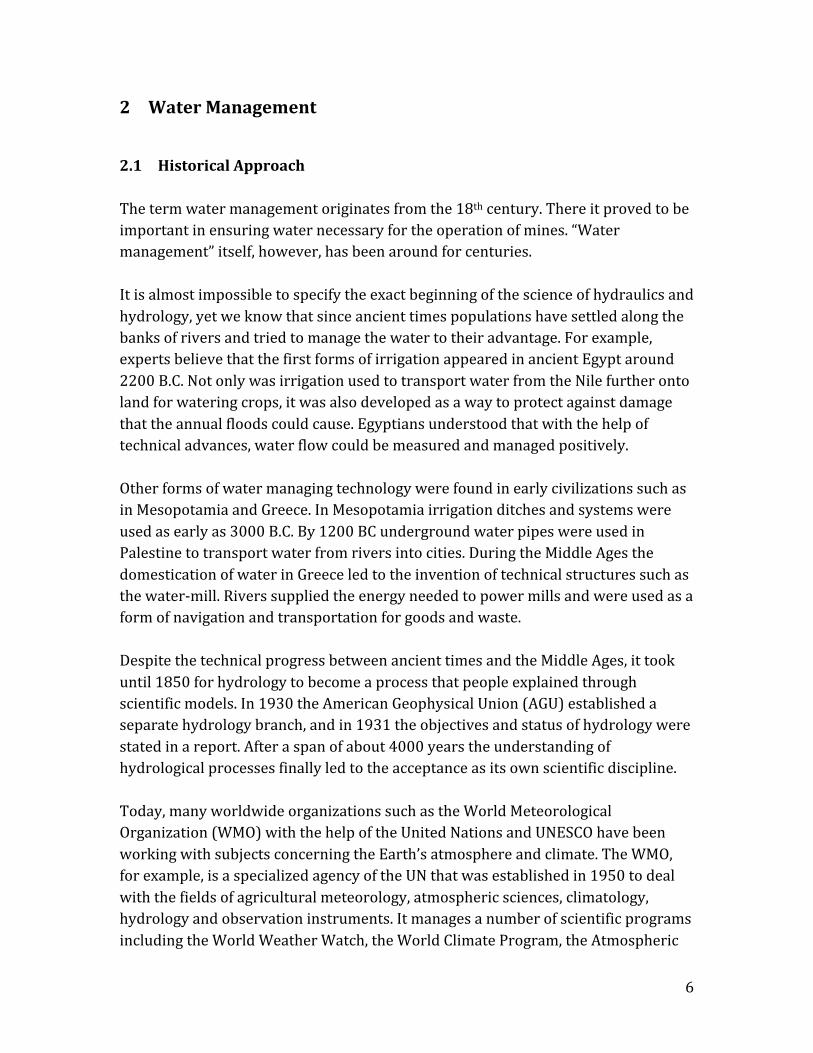
2.1 Historical Approach The term water management originates from the 18th century. There it proved to be important in ensuring water necessary for the operation of mines. “Water management” itself, however, has been around for centuries. It is almost impossible to specify the exact beginning of the science of hydraulics and hydrology, yet we know that since ancient times populations have settled along the banks of rivers and tried to manage the water to their advantage. For example, experts believe that the first forms of irrigation appeared in ancient Egypt around 2200 B.C. Not only was irrigation used to transport water from the Nile further onto land for watering crops, it was also developed as a way to protect against damage that the annual floods could cause. Egyptians understood that with the help of technical advances, water flow could be measured and managed positively. Other forms of water managing technology were found in early civilizations such as in Mesopotamia and Greece. In Mesopotamia irrigation ditches and systems were used as early as 3000 B.C. By 1200 BC underground water pipes were used in Palestine to transport water from rivers into cities. During the Middle Ages the domestication of water in Greece led to the invention of technical structures such as the water-‐mill. Rivers supplied the energy needed to power mills and were used as a form of navigation and transportation for goods and waste. Despite the technical progress between ancient times and the Middle Ages, it took until 1850 for hydrology to become a process that people explained through scientific models. In 1930 the American Geophysical Union (AGU) established a separate hydrology branch, and in 1931 the objectives and status of hydrology were stated in a report. After a span of about 4000 years the understanding of hydrological processes finally led to the acceptance as its own scientific discipline. Today, many worldwide organizations such as the World Meteorological Organization (WMO) with the help of the United Nations and UNESCO have been working with subjects concerning the Earth’s atmosphere and climate. The WMO, for example, is a specialized agency of the UN that was established in 1950 to deal with the fields of agricultural meteorology, atmospheric sciences, climatology, hydrology and observation instruments. It manages a number of scientific programs including the World Weather Watch, the World Climate Program, the Atmospheric
7
Research and Environment Program, and the Hydrology and Water Resources Program. Nongovernmental Organizations also play an important role in water management. They can succeed in cases that governmental organizations cannot-‐ when political or other issues raise problems. These organizations play an essential role because they are often very involved in specific situation and have access to local information related to water management. These programs and organizations all contribute to various aspects of water management. The modern definition describes the actions of planning, developing, maintaining, protecting and distributing water resources.
2.2 Water Resources Sustainability Despite the technical progress made between Ancient Times and now, a lot still needs to be done. The growing pressure on the environment caused by humans is producing impacts that are often difficult to predict and handle. Over the past few decades, problems caused by urbanization, agriculture and the exploration of underground water sources have altered the water cycle. Humans continue to exploit water reservoirs without thinking about the long term effects of their actions. If we continue to use water without thinking about the future, all living organisms will struggle to survive in the future. We need to learn to use water sustainably. Usually, sustainability describes the relationship between economics, the environment and society. Today we live in a world where over 1.1 billion people do not have access to safe drinking water and between 2 and 4 million people die every year from water-‐related diseases. According to Mays water resource sustainability is the ability to use water in sufficient quantity and quality from the local to the global scale to meet the needs of humans and ecosystems for both the present and future to sustain life as well as to protect humans from the damages brought about by natural and human-‐caused disasters that affect sustaining life. (CITE MAYS) The following points should be considered when dealing with water resource sustainability:
8
• The availability of freshwater supplies through periods of climate change, droughts, population growth while leaving enough supplies for future generations
• Infrastructure should provide water supply for human use and food security plus provide protection from natural hazards
• Infrastructure should exist for clean water and for treating water after human use before it enters any water body
• Institutions must exist which manage water correctly • It must be considered on a local, regional, national and international basis
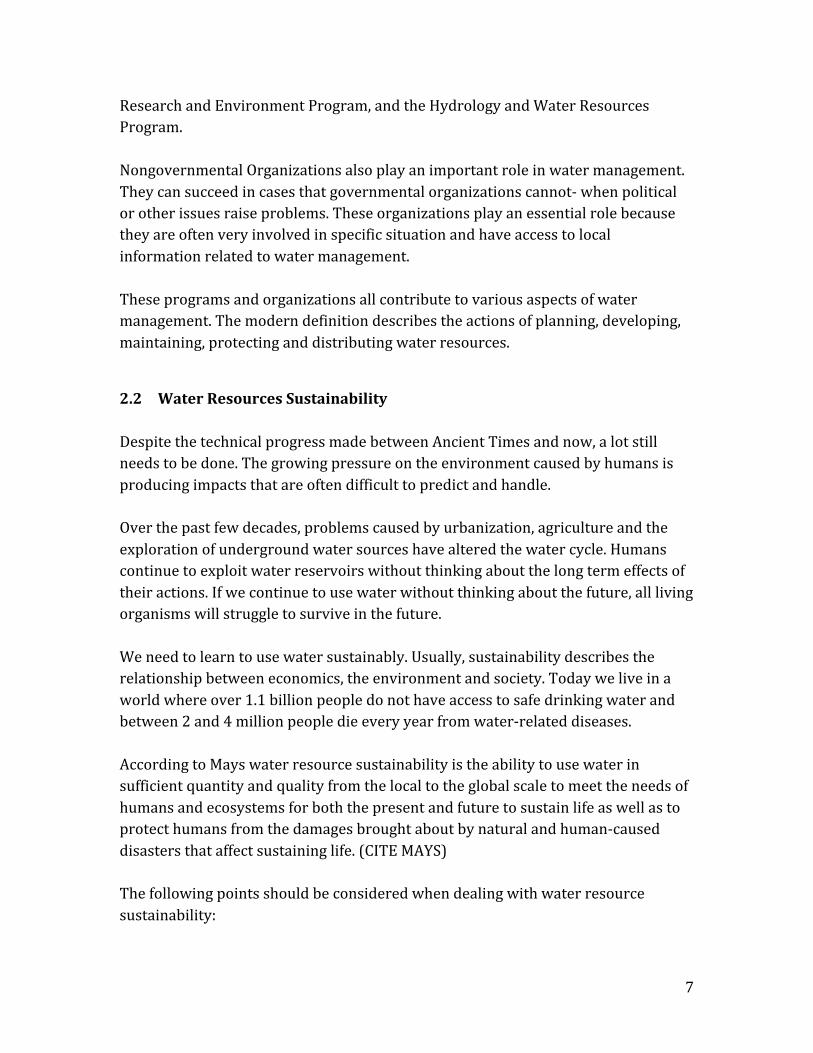
Modern progress often raises problems in water resource sustainability. Urbanization creates many challenges for the development and management of water sustainability and water supply systems. Urban populations demand a high quantity of energy, raw materials, water, removal of waste and so on. Such populations also demand a large amount of space, which often causes buildings to be constructed too closely to water bodies. Urbanization causes many changes to the hydrological cycle including the amount of precipitation, the amount of evaporation, the amount of infiltration as well as an increase in runoff.
The pictures above show that the more construction covers the earth, or the more impervious the ground cover is, the less water is exchanged in the water cycle. Urban storm water runoff includes all flows discharged from urban land uses into storm water conveyance systems and receiving water bodies. Urban runoff includes non-‐storm water sources such as landscape irrigation, hydrant flushing as well as wet-‐weather storm water runoff. The water quality of storm water runoff can be affected by the transport of sediment and other pollutants into water bodies. The impacts from urban runoff are significant and high in costs. These can lead to fish kills, health concerns for humans and animals, poor drinking water quality, damage
Figure 1: Relationship between impervious cover and surface runoff (FISRWG, 2011)

9
to commercial fishing industries and a decrease in water-‐based recreation and tourism opportunities. Clean-‐up projects and pollution reduction are very expensive procedures and should therefore be avoided. Further critical changes that can affect the water cycle include a rapid transformation of undeveloped land into an urban area, an increased energy release through greenhouse gases or waste heat and an increased demand on the water supply. These changes are all challenges in water resource sustainability. Groundwater quality is another big challenge to water resource sustainability in urbanization. Groundwater can be affected by residential and commercial development (see Figure 1). Residential development takes up a large amount of land and as a consequence, has an influence on the quality of water that recharges streams, lakes and other water bodies. Uncontrolled liquids discharged onto the ground can move down to pollute groundwater. Other factors that can lead to the pollution of groundwater include septic tanks, animal feedlots, crop fertilizers, pesticides and herbicides as well as waste and leaking sewers. Due to the increase in water resource pollution, depletion and degradation the importance of sustainable urban water systems has grown as well. The basic goals for sustainable urban water systems are:
• The supply of safe and good tasting drinking water to the population at all times
• The collection and treatment of wastewater in order to protect the population and environment from diseases and harmful impacts
• To control, collect, transport and enhance the water quality of storm water to protect both the environment and urban areas from flooding and pollution
• To reduce, reuse and recycle water and nutrients
2.3 European Water Framework Directive The European Water Framework Directive (WFD) establishes a framework for the protection of groundwater, inland surface waters, estuarine waters and coastal waters. The WFD constitutes a new view of water resources management in Europe because, for the first time, water management is:
(i) based mainly upon biological and ecological elements, with ecosystems being at the center of the management decisions;

10
(ii) applied to European water bodies, as a whole; and (iii) based upon the whole river basin, including also the adjacent [coastal]
area.
The European Water Framework Directive is a result of the initiative of the EU Parliament and Member States, which came into force on December 22, 2000. Member States were concerned about the numerous existing water policies and wanted to replace them with a modern, coherent European water law. Although the marine water bodies affected by the WFD relate to only 19.8% of the European continental shelf, it creates a challenge and an opportunity in near shore, coastal and continental shelf research. (Borja, 2005) The EU WFD has especially grown in importance due to the increasing demand by citizens and environmental organizations for cleaner rivers, lakes, groundwater and coastal areas. When asked to list the five main environmental concerns, results showed that approximately half of the respondents are worried about “water pollution”. (EU Commission, 2012) This public demand for cleaner water is one of the main reasons why water protection has top priority. The WFD Proposal was first presented to the Council and the EU Parliament in 1996 with the following key aims:
• Expanding the scope of water protection to all waters • Achieving “good status” for all waters (natural, artificial and modified
waters) by a set deadline • Water management based on river basins • “combined approach” of emission limit values and quality standards • determining the appropriate price • public participation • streamlining legislation
The following paragraphs will explain the important elements of these aims. Achieving “good status” for all waters The WFD classifies water quality using five status classes: high, good, moderate, poor and bad. ‘High status’ is defined as the biological, chemical and morphological conditions associated with no or very low human impact. Assessment of water quality is based on the extent of deviation from the five reference conditions.

11
River basin management The best way to protect and manage water is through international cooperation between the surrounding countries of a river basin. Water does not stop at administrative or political boundaries; therefore ensuring optimal protection requires that the river basin be assessed as an individual and complete hydrological unit. (ICPDR, 2011) Several Member States already have a river basin approach to protecting water bodies. Every river basin district needs to have a “river basin management plan” established which provides context for the coordination requirements and which is to be updated every six years. The “combined approach” Member states must control discharge according to best available technologies and relevant emission limit values and best environmental practices as defined in Community legislation. This introduces a control mechanism that ensures the continuous adaptation of standards. (Blöch, 2009) (Leb, 2006) The appropriate price The need to conserve adequate supplies of a resource for which demand is continuously increasing is also one of the reasons for one of the Directives’ most important innovations-‐ the introduction of pricing. Appropriate water pricing acts as an incentive for the sustainable use of water resources and thus helps to achieve the environmental objectives as stated in the Directive. Member states are required to ensure that the price charged to water consumers reflects the true costs. Public participation The desire for public participation can be traced back to two reasons: balancing the interests of various groups in society and creating transparency in the establishment. Most objectives in the river basin management plan involve a large variety of groups, thus it is essential that the process is open to those who will be affected. The WFD establishes a network for the exchange of information and experience between professionals and the community. Streamlining legislation
One extreme advantage of the European Water Framework Directive is that it is meant to rationalize the community’s water legislation by replacing the existing

12
seven directives and repealing them one after the other. It will “provide for a coherent managerial frame for all water-‐related EU legislation”. Further information on the European Water Framework Directive can be found on: http://eurlex.europa.eu/LexUriServ/LexUriServ.do?uri=OJ:L:2000:327:0001:0072:EN:PDF

13
3 Hydrology
3.1 Hydrological Cycle Earth’s water is distributed over several sources. Approximately 97% of the water is in the oceans and the remaining 3% are various freshwater sources. The majority of the freshwater, about 69 percent, is frozen in glaciers and icecaps. The second largest source of freshwater is groundwater and only about 0.3% is contained in surface sources such as lakes and rivers. (Shiklomanov, 1993)
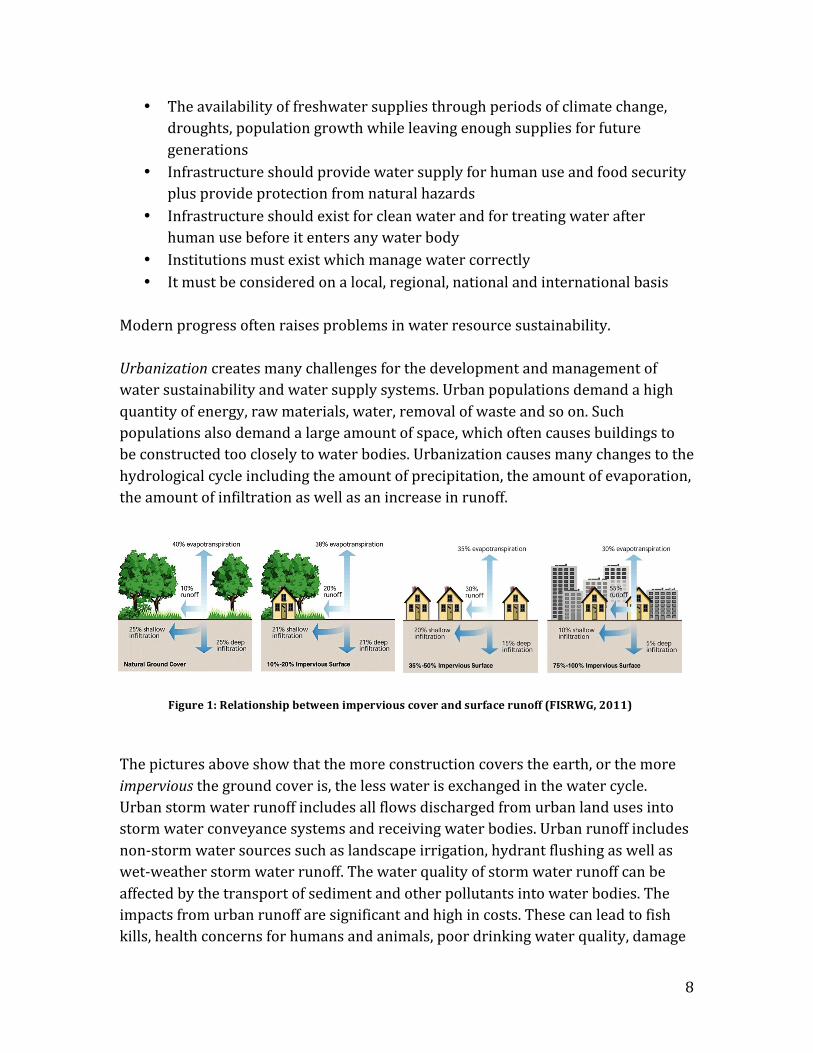
The hydrological cycle, also known as the water cycle, describes the continuous movement of all water on, above and below Earth’s surface. Water can be found in various states such as liquid, vapor and ice within the cycle and is transformed through a number of physical processes such as evaporation, condensation, precipitation, infiltration, runoff and subsurface flow. The driving force of all processes within the hydrological cycle is the sun, which radiates solar energy onto Earth’s surface animating the movement of water from one reservoir to another, such as from the ocean to the atmosphere.
14
The hydrological cycle involves the exchange of thermal energy, which leads to temperature changes. For example, through evaporation, water takes up energy from the surroundings and sublimates into water vapor. Rising air currents transport the water vapor into the atmosphere where cooler temperatures cause it to condense into clouds. As the air currents move around Earth, cloud particles accumulate, collide and fall down towards the ground as precipitation. Most water falls back into the oceans or onto land where it flows over the ground as runoff, while a small portion falls as snow and may accumulate on ice caps and glaciers, which can store frozen water for thousands of years. A part of runoff enters rivers that eventually lead back to the ocean, while some is stored in lakes as freshwater along with groundwater. However, a great part of runoff soaks directly into the ground, through the process of infiltration. Eventually, water returns to the ocean where the main water cycle begins time and time again (Han, Concise Hydrology, 2010). Evaporation: water is transformed from a liquid to gas state as it moves from bodies of water on the ground into the atmosphere.
Figure 2: Dynamic and Complex: The Global Water Cycle (University of Waikato, 2009)

15
Condensation: water vapor is cooled (for example through atmosphere) and is compressed to its saturation limit causing it to change into liquid. Precipitation: water condenses to water vapor that falls to the Earth’s surface as rain, snow, hail, fog, etc. Infiltration: water on the Earth’s surface seeps into the ground where it becomes soil moisture or groundwater. Runoff: the variety of ways which water moves across the land including surface and channel runoff. As it flows it may infiltrate the ground, evaporate or be stored in lakes or reservoirs. Subsurface flow: the flow of water underground. Subsurface water may rise to the surface (through pumps or natural springs) or eventually flow into the ocean.
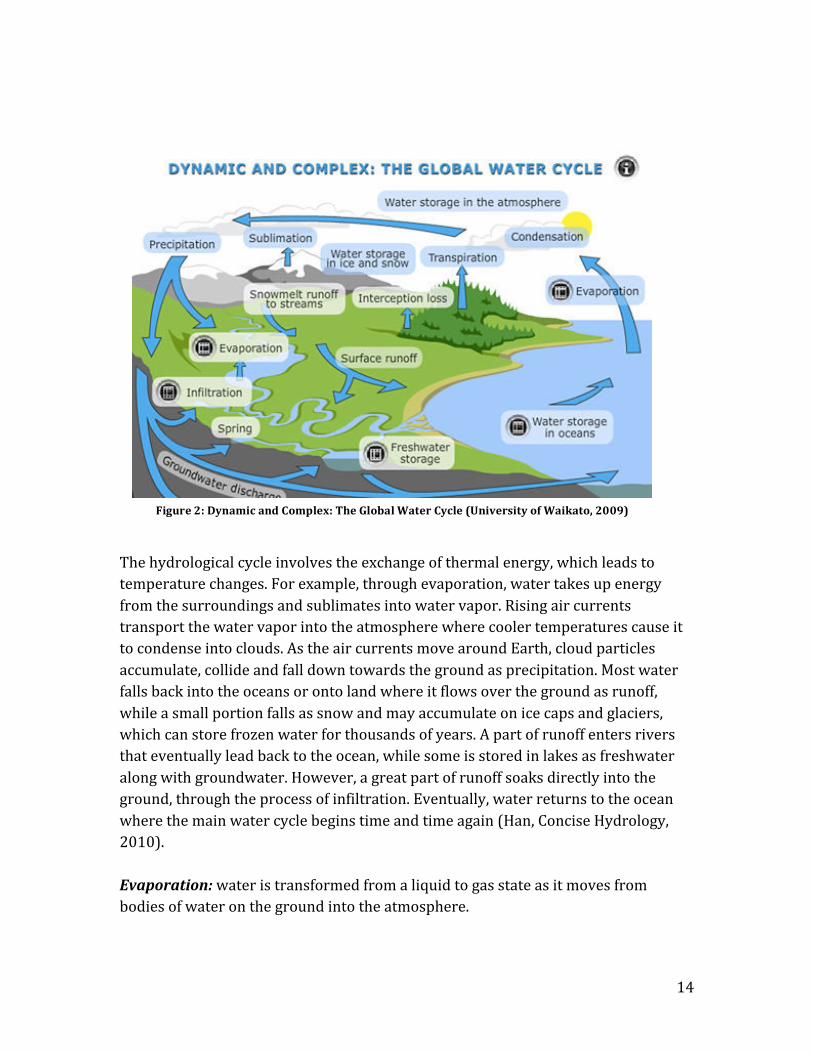
3.2 Watershed Watershed is a geographic unit that is defined by an area beginning with a cross-‐section of a river that includes the entire surface upstream from the cross-‐section in such a way that the entire water landing on this surface flows through the cross-‐section (in theory). The chosen cross-‐section is called the outlet of the watershed. Therefore the watershed is delineated by its outlet and by the surrounding drainage divides. The main limitations of this definition are derived from the fact that it is a topographic watershed; meaning that the drainage divides correspond with the crests or topographic high points surrounding the watershed. However, this definition is not always sufficient because often the main point of interest is the effective watershed. This includes the underground borders of the system. The actual line where water is divided to flow in one direction or another is not necessarily identical to the drainage divide on the surface.
The following figure shows an example of this sort of situation; in this particular case, an impermeable substrate lies beneath a permeable layer, so that actual water flow does not coincide with the topographic divide. The difference between the topographic and effective watershed is particularly noticeable in karst terrain.
16
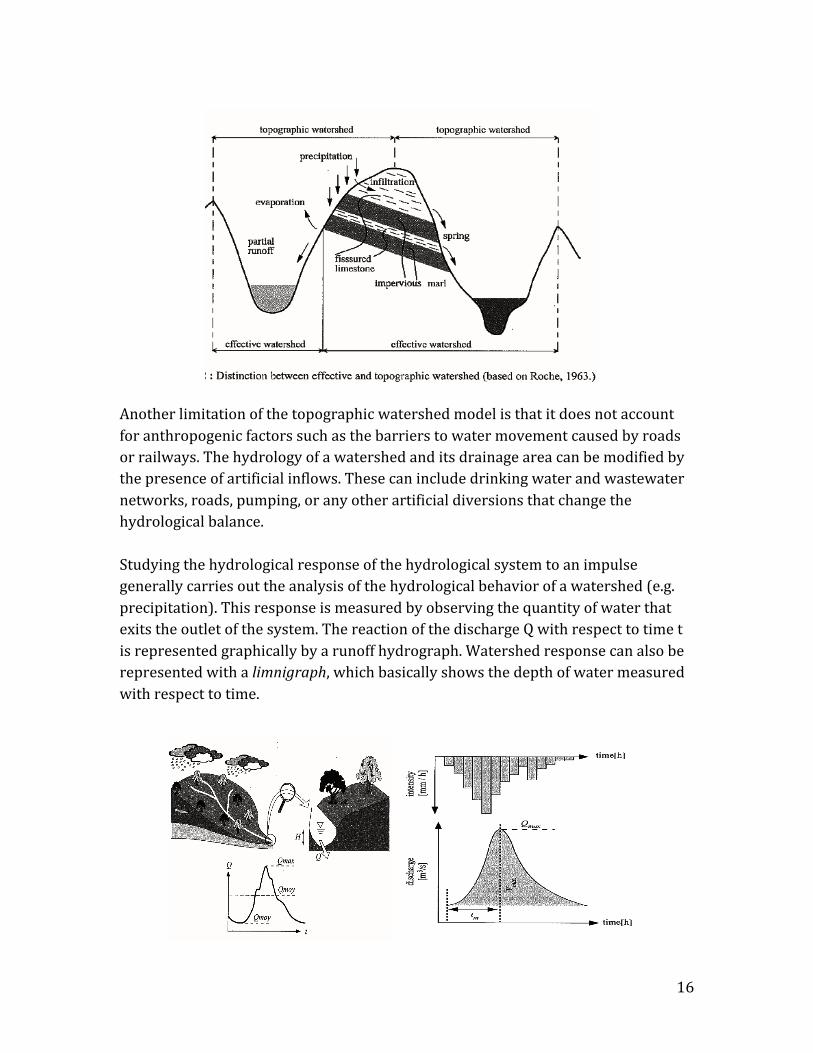
Another limitation of the topographic watershed model is that it does not account for anthropogenic factors such as the barriers to water movement caused by roads or railways. The hydrology of a watershed and its drainage area can be modified by the presence of artificial inflows. These can include drinking water and wastewater networks, roads, pumping, or any other artificial diversions that change the hydrological balance. Studying the hydrological response of the hydrological system to an impulse generally carries out the analysis of the hydrological behavior of a watershed (e.g. precipitation). This response is measured by observing the quantity of water that exits the outlet of the system. The reaction of the discharge Q with respect to time t is represented graphically by a runoff hydrograph. Watershed response can also be represented with a limnigraph, which basically shows the depth of water measured with respect to time.
17
This figure shows the hydrological response for a given precipitation event (the hyetograph is the curve representing the intensity of the rain as a function of time). The hydrological response of a watershed to a particular event is characterized by its velocity (time to peak 𝑡! which is the time between the beginning of the water flow and the peak of the hydrograph) and its intensity (peak flow 𝑄!"# maximum volume 𝑣!"#).
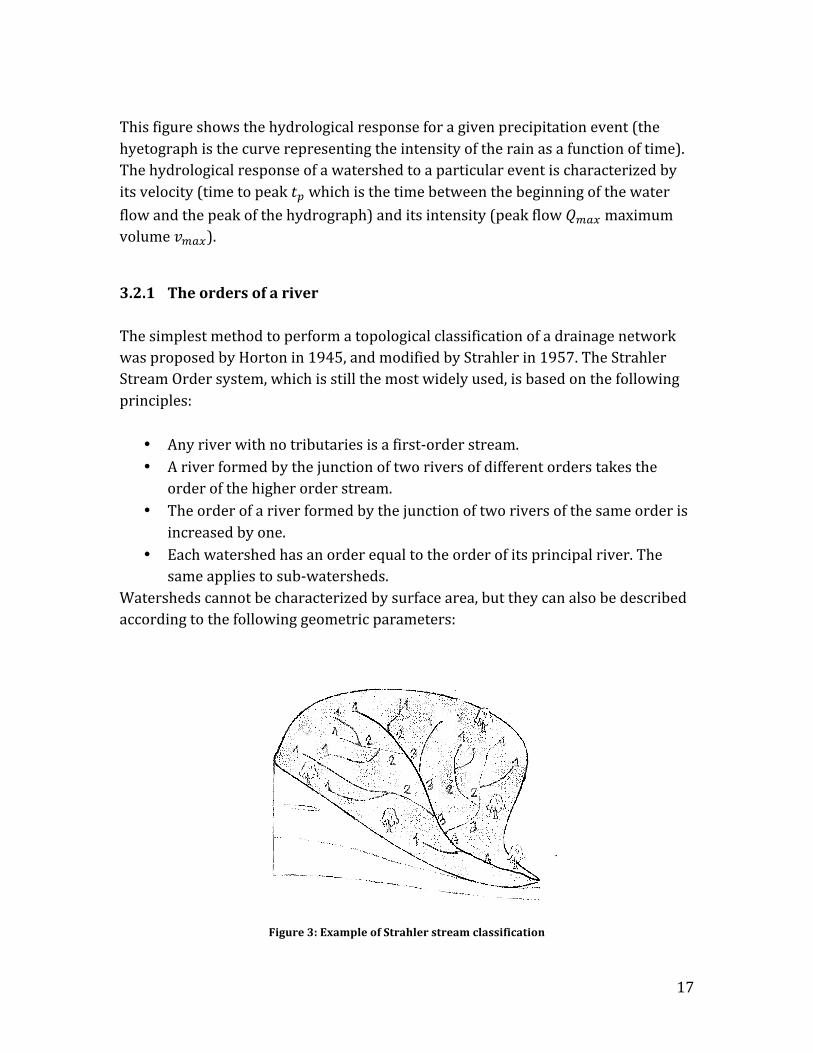
3.2.1 The orders of a river The simplest method to perform a topological classification of a drainage network was proposed by Horton in 1945, and modified by Strahler in 1957. The Strahler Stream Order system, which is still the most widely used, is based on the following principles:
• Any river with no tributaries is a first-‐order stream. • A river formed by the junction of two rivers of different orders takes the
order of the higher order stream. • The order of a river formed by the junction of two rivers of the same order is
increased by one. • Each watershed has an order equal to the order of its principal river. The
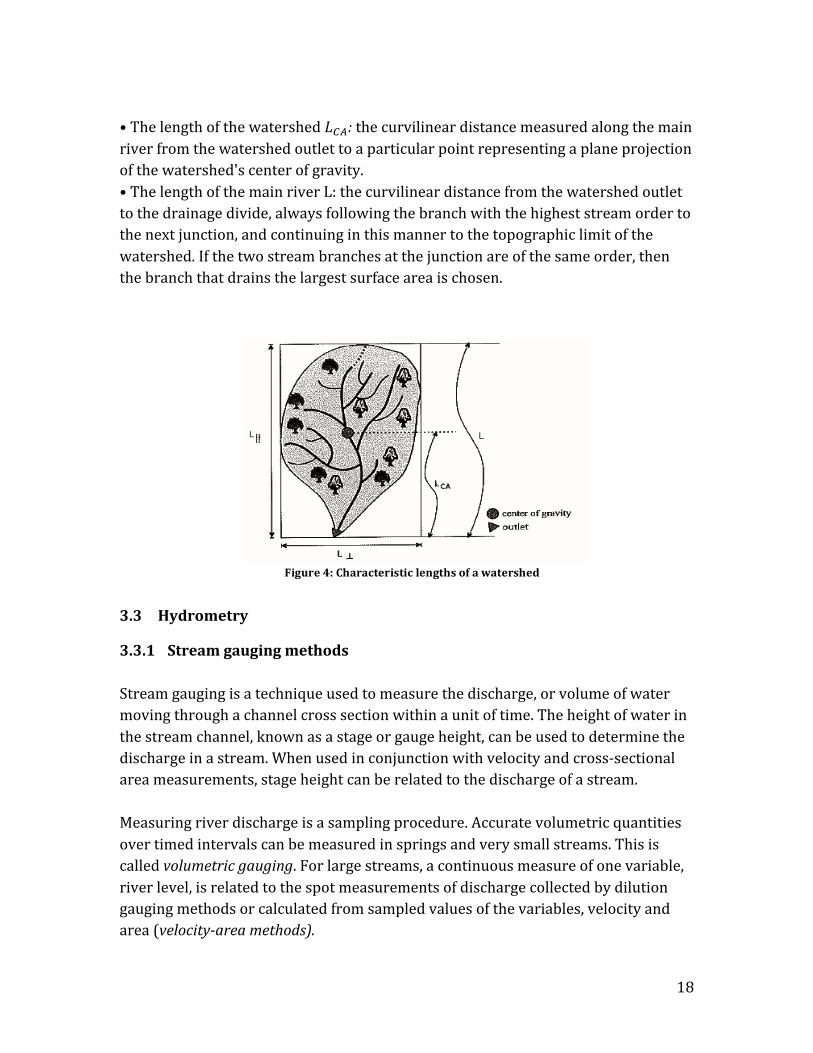
same applies to sub-‐watersheds. Watersheds cannot be characterized by surface area, but they can also be described according to the following geometric parameters:
Figure 3: Example of Strahler stream classification
18
• The length of the watershed 𝐿!": the curvilinear distance measured along the main river from the watershed outlet to a particular point representing a plane projection of the watershed's center of gravity. • The length of the main river L: the curvilinear distance from the watershed outlet to the drainage divide, always following the branch with the highest stream order to the next junction, and continuing in this manner to the topographic limit of the watershed. If the two stream branches at the junction are of the same order, then the branch that drains the largest surface area is chosen.
3.3 Hydrometry
3.3.1 Stream gauging methods Stream gauging is a technique used to measure the discharge, or volume of water moving through a channel cross section within a unit of time. The height of water in the stream channel, known as a stage or gauge height, can be used to determine the discharge in a stream. When used in conjunction with velocity and cross-‐sectional area measurements, stage height can be related to the discharge of a stream. Measuring river discharge is a sampling procedure. Accurate volumetric quantities over timed intervals can be measured in springs and very small streams. This is called volumetric gauging. For large streams, a continuous measure of one variable, river level, is related to the spot measurements of discharge collected by dilution gauging methods or calculated from sampled values of the variables, velocity and area (velocity-‐area methods).
Figure 4: Characteristic lengths of a watershed

19
The fixed cross-‐sectional area is easily determined; however it is much more difficult to ensure consistent measurements of the flow velocities to obtain values of v (m/s). River discharge can be estimated easily when there is access to the entire width of the river and the velocity and depths can be measured. The measurement of accurate volumetric quantities in small streams is called volumetric gauging. This method is usually not practical for large rivers, so often velocity-‐area methods are used. Here the discharge of a river Q (m³/s) is normally obtained from the summation of the product of mean velocities in the vertical (v) and the area of related segments (a) of the total cross-‐sectional area. Ultrasonic (Doppler) flow meters are sometimes used to measure a continuous record of velocity in small streams.
𝑄 = (𝑣 , 𝑏,𝑦) = (𝑣 ,𝑎)
A fixed and constant relationship is required between the river level (called stage) and the discharge at the gauging site. This occurs along channel stretches of a regular cross section where flow is uniform and the stage-‐discharge relationship is “under channel control”.
Direct Measurement Indirect Measurement
• Volumetric method • Current meter method (area-‐velocity method)
• Pitot tube
• Floating gauge
• Hot wire
• Measuring weir
• Dilution method rating curve Q=f(h)

20
Area-‐velocity method The most direct method of obtaining a discharge value corresponding with a stage measurement is through the area-‐velocity method. River velocity is measured at selected verticals of known depth across a measured section of a river. At river gauging stations, the cross-‐section of the channel is surveyed and considered constant unless major modifications during floods are suspected (demand for resurveying). The more difficult component of the discharge computation is the series of velocity measurements across the section. To ensure satisfactory sampling of velocity across the river, the measuring section should ideally have a straight and uniform approach-‐channel upstream, in length at least twice the maximum river width (Novak, Moffat, Nalluri, & Narayanan, 2001, pp. 111-‐115). Measurements should then be taken at intervals no greater than 1/15th of the width across the flow. Discharge or the volume of water flowing through the cross section of a stream over a certain period of time can be calculated with the equation:
Q=Av
where Q is the discharge [m³/s], A is the cross-‐sectional area of the stream [m²] and v is the average velocity [m/s]. Typically, river flow velocity is measured using a current meter. This is a relatively accurate instrument that can give almost instantaneous and consistent responses to velocity changes. There are two types of current meters: the impeller current meter, which has a single impeller rotating on a horizontal axis, and the electromagnetic current meter.
Figure 5: Current meter (Shaw 1994)

21
If a current meter is not available, the “float method” may be used to measure velocity. This method uses supplies that are easily obtained; yet it is less accurate. This method measures the time it takes for a floating object to travel a given distance. The velocity can then be calculated by dividing the distance by the time it took the object to travel it. (Weight & Sonderegger, 2001)
The pitot tube is another simple device used to measure the velocity of stream flow named after Henri Pitot who invented it. One end of the tube is pointed directly into the stream in a certain point of flow at a depth of H under the free surface of the stream. The fluid streamlines divide as the approach the end of the tube and A is at complete stagnation, since the fluid at this point is not moving in any
direction. v = 2gh where v is the velocity of the stream flow [m/s], g is the acceleration due to gravity in meters per second squared and h is the velocity head [m]. Due to the fact that velocity varies within the cross-‐section, it is necessary to take measurements along different parts of a cross-‐section of a river. Usually, velocity is measured on “average” reaches of the stream (areas of average width and depth). Discharge is then measured by integrating the area and velocity of each point across the stream. By multiplying the cross-‐sectional area (section width x water depth) by the velocity, it is possible to calculate the discharge for that section of the river. The discharge from each section can be added to determine the total river water discharge.
Figure 6: The pitot tube
22
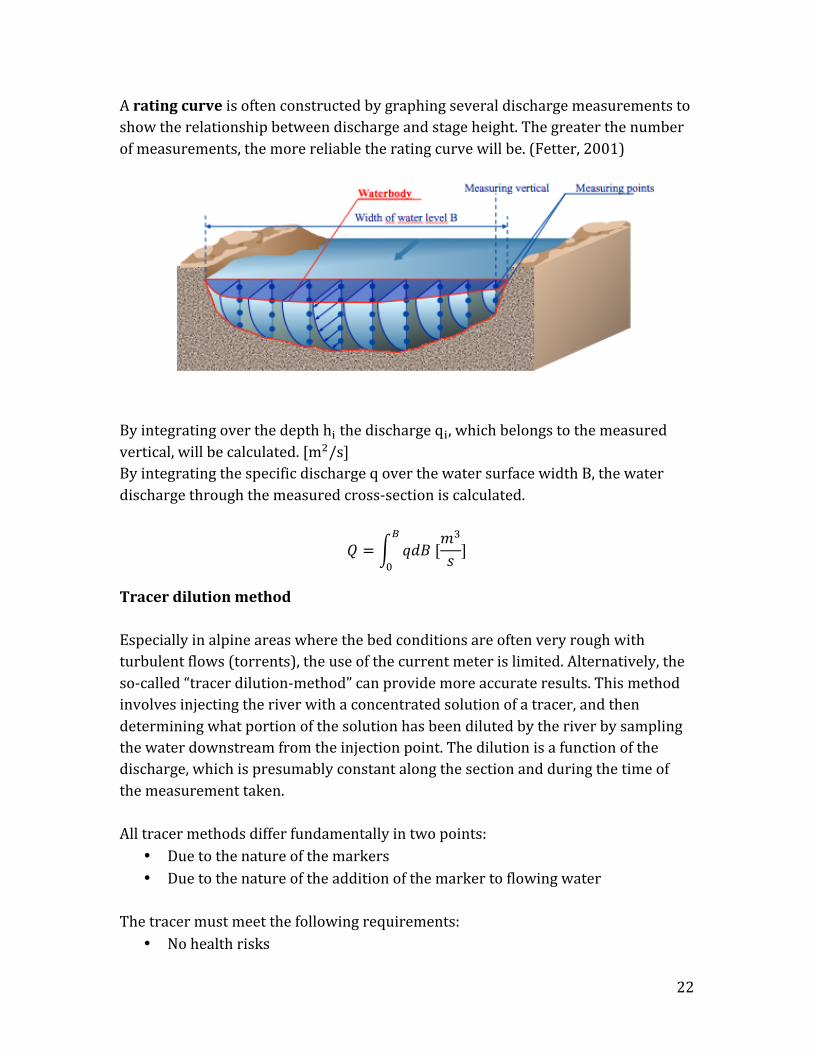
A rating curve is often constructed by graphing several discharge measurements to show the relationship between discharge and stage height. The greater the number of measurements, the more reliable the rating curve will be. (Fetter, 2001)
By integrating over the depth h! the discharge q!, which belongs to the measured vertical, will be calculated. [m!/s] By integrating the specific discharge q over the water surface width B, the water discharge through the measured cross-‐section is calculated.
𝑄 = 𝑞𝑑𝐵 [𝑚!
𝑠 ]!
!
Tracer dilution method Especially in alpine areas where the bed conditions are often very rough with turbulent flows (torrents), the use of the current meter is limited. Alternatively, the so-‐called “tracer dilution-‐method” can provide more accurate results. This method involves injecting the river with a concentrated solution of a tracer, and then determining what portion of the solution has been diluted by the river by sampling the water downstream from the injection point. The dilution is a function of the discharge, which is presumably constant along the section and during the time of the measurement taken. All tracer methods differ fundamentally in two points:
• Due to the nature of the markers • Due to the nature of the addition of the marker to flowing water
The tracer must meet the following requirements:
• No health risks

23
• High water solubility • It should not be present in natural waters (or only in low concentrations) • Chemical and physical stability • Detectable in the smallest concentration • Simple and quick measurement • Low price
In practice the most commonly used tracer is sodium chloride and fluorescence colors. There are two types of tracer injection:
1. The continuous addition of a tracer solution in a constant discharge and concentration
2. The sudden addition of the total amount of the tracer at a single point (integration method)
This picture shows the principle of gauging dilution. The following conditions are necessary to apply dilution methods: • The discharge must remain almost constant during measurement • The mixture must be made in such a way that at each point of the sampling section the same quantity should pass • All of the tracer must pass the sampling section
By a continuous addition, the constant tracer discharge q in a known concentration C! is added to the river for a period of time until, after complete mixing with the flowing water, a constant concentration of C! in the measurement cross-‐section occurs.
𝑄 = 𝑞𝐶!𝐶!
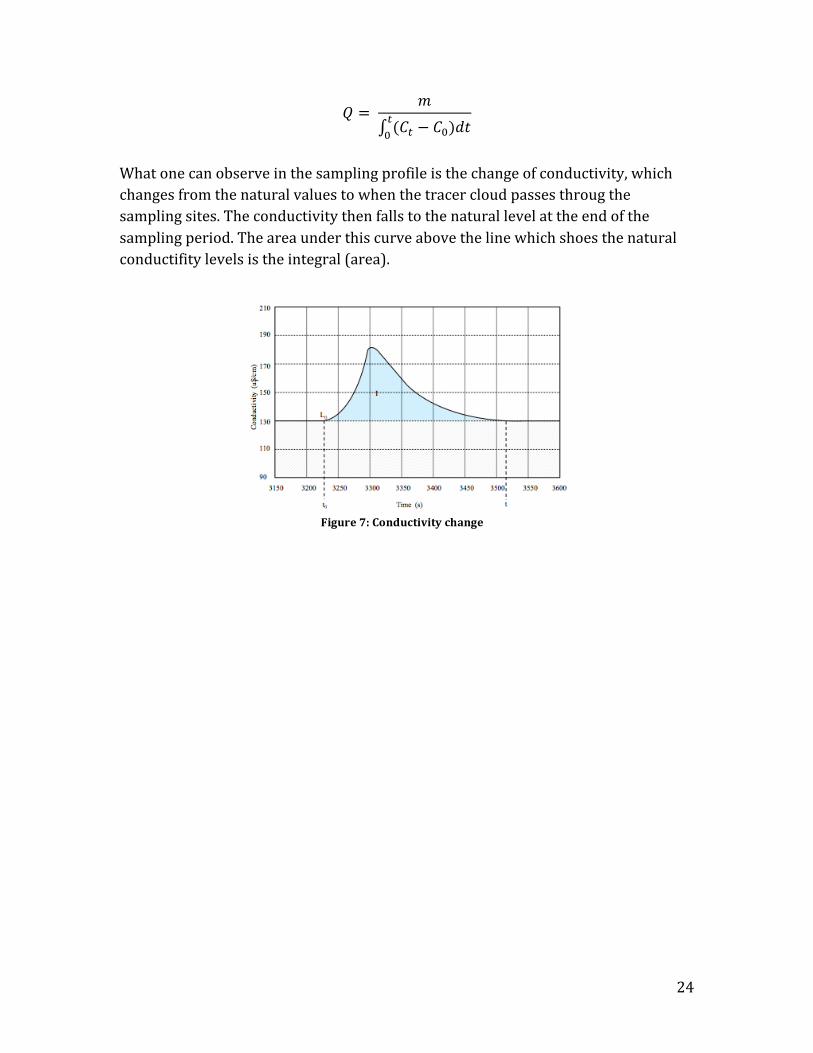
In the method of sudden addition, the total quantity of the tracer m is added at once to the flowing water with the initial concentration C!. After complete mixing with the flowing water, the river flow rate is obtained by the integral of the change in concentration C!-‐C! over the time t that the tracer cloud passes through the measuring cross-‐section.
24
𝑄 = 𝑚
(𝐶!!! − 𝐶!)𝑑𝑡
What one can observe in the sampling profile is the change of conductivity, which changes from the natural values to when the tracer cloud passes throug the sampling sites. The conductivity then falls to the natural level at the end of the sampling period. The area under this curve above the line which shoes the natural conductifity levels is the integral (area).
Figure 7: Conductivity change
25
4 Hydraulics To have a better understanding for how certain processes in hydraulic engineering work, it is first important to understand the fundamentals behind them.
4.1 Physical properties of fluids Fluids are bodies without their own shape that can flow, i.e. they can undergo great variations of shape under the action of forces; the weaker the force, the slower the variation. Both liquids and gases are fluids. Their equilibrium and their movements, known as flow, are studied in the mechanics of fluids.
4.1.1 Weight and mass In current language, the motions of weight and mass are sometimes confused; however, from the physical point of view, they represent two different things. The mass of a body is a characteristic of the quantity of matter, which that body contains; the weight of the body represents the action (force) that gravity exerts on it. Between G weight and m mass of a body there is the fundamental vectorial relationship.
𝐺 = 𝑚𝑔 which corresponds to the scalar equation:
𝐺 = 𝑀𝑔 in which g is the gravitational acceleration.
4.1.2 The Systéme International d’Unités´-‐SI This system of units is an internationally agreed version of the metric system. There are six basic units and not only their names but also their symbols have been internationally agreed (see Table).
Quantity Basic units Symbol Length Mass
Meter Kilogram
m kg

26
Time Electric current Temperature
Luminous intensity
Second Ampere Kelvin Candela
s A K cd
From these basic units, all others are derived. For example: area – square meters (m2); velocity – meters per second (m/s); density – kilogram per cubic meter (kg/m3)
Symbols, Terminology, Dimensions and Units used in Water Engineering

27
4.1.3 Density Density, ρ, is the mass contained in a unit volume. It has the dimensions ML-‐3. In the SI system, it is expressed in kg/m3. The density of water at 4°C is ρ=1000kg/m3; at 20°C it is ρ= 988.2kg/m3 = 1000 kg/m3.
4.1.4 Specific weight Specific weight, γ, is the weight, that is, the gravitational attractive force acting on the matter contained in a unit volume. Between specific weight and density there is the fundamental relationship: γ= ρg. In the SI system, specific weight is expressed in Newtons per cubic meter: N/m3.

28
4.1.5 Viscosity Viscosity μ of a fluid, also called the coefficient of viscosity, absolute viscosity or dynamic viscosity, is a measure of its resistance to flow. It is expressed as the ratio of the tangential shear stresses between flow layers to the rate of change of velocity with depth:
𝜇 =𝜏
𝑑𝑉/𝑑𝑦
𝜏 = shear stress (N/m2) V= velocity (m/s) Y=depth (m) Viscosity decreases as temperature increases but may be assumed independent of changes in pressure for the majority of engineering problems. Kinematic viscosity ν is defined as viscosity 𝜇 divided by density ρ. Water at 21.1°C has a kinematic viscosity of 0.000001 Nm2/s. In hydraulics, viscosity is most frequently encountered in the calculation of Reynolds number to determine whether laminar, transitional or completely turbulent flow exists.
4.1.6 Pressure Pressure has the dimensions of a force per unit area, dimensions ML-‐1T-‐2. In the SI system it is expressed in N/m2. Pressure p, measured in relation to atmospheric pressure, is called gauge pressure. Absolute pressure pa is the sum of gauge pressure, p and height of a liquid column.
4.1.7 Pressure on submerged curved surfaces The hydrostatic pressure on a submerged curved surface is given by:
𝑃 = 𝑃!! + 𝑃!!
P= total pressure force on the surface PH= force due to pressure horizontally PV= force due to pressure vertically

29
4.2 Theoretical bases of hydraulics Hydraulics is a branch of physical sciences which purpose is the study of liquids in motion. You have already learned about channel and pipe (or pressure) flow as well as about laminar and turbulent flow. These are terms of fluid mechanics. Fluid mechanics is the theoretical basis of hydraulics. Real flows, however, are very difficult to analyze theoretically. Therefore empiricism and experimentation play an important role in this science. In follow the theoretical bases of hydraulics will be briefly presented. Streamlines show the direction a fluid element will travel at any point in time. They are tangent to the fluid velocity vector. In turbulent flow, it is only of interest to study the streamlines corresponding to the man fields of velocity. In steady flow, the path lines and streamlines are the same.
Figure 8: Hydrostatic pressure on a submerged curved surface. (a) variation over the surface. (b) Free-‐body diagram
Figure 9: Streamlines

30
In the above figures, an obstacle ahs been placed in a current with a velocity V. The movement generated in the liquid is not steady since in each section the state of movement of the particles depends on the time of passage. The streamlines move around the inserted obstacle. Flow rate (discharge) can be defined as the volume of liquid passing a given cross-‐section area in unit time [m3/s]. In a field of velocities V, in an area A, n is the vector normal to each element dA.
𝑄 = 𝑉.𝑛 𝑑𝐴
!
V.n represents the internal product, in other words a scalar product of the modulus of one vector by projection of the other on it. This product equals zero if the vectors are perpendicular. In turbulent flow, only the value of the discharge corresponding to the man velocity is worth considering. In the following figure, the lines joining parts of equal mean velocity in time are known as isotachs. The mean value of velocity V at the different points of a cross-‐section is known as the mean velocity U in that section. The streamtube is a set of streamlines that make up a closed shape. The area A intersecting a streamtube perpendicular to the streamlines make up a straight cross-‐section of the flow. If the mean velocity does not vary from section to section, one can speak from uniform flow (see chapter 4.2).

31
4.2.1 Types of energy Energy or work (W) is defined in mechanics as the product of a force and a displacement. In hydraulic problems energy is usually related to unit weight and is known simply as head E, which consequently has the dimensions of a length and is expressed in meters. Potential energy per unit weight is z, just as the pressure energy per unit weight is p/y. Thus, a particle of liquid having velocity V, subjected to a pressure p and placed at an elevation z above a horizontal datum will have per unit weigh the following types of energy or head: The total energy per unit weight will then be z (potential energy) plus the pressure energy per unit weight plus the velocity head. The pressure head represents the height of a column of liquid that can rise to a pressure p through its weight. The velocity head represents the height h from which an element of fluid must fall freely, in vacuum, in order to reach the velocity V.
Type of head Hydraulic designation Representation Due to position
Due to pressure
Kinetic
Elevation above a datum or elevation head
Pressure expressed in height of liquid or pressure head
Velocity head
𝐸! = 𝑧
𝐸! = 𝑝/𝛾
𝐸! = 𝑉!/2𝑔
4.2.2 Fundamentals of fluid flow One of the most important equations that governs the study of fluids is Bernoulli’s principle. It was developed by a Swiss scientist named Daniel Bernoulli and published in his book Hydrodynamica in 1738. Bernoulli’s principle relates a fluid’s velocity to its internal pressure. It states that in fluid dynamics, for an ideal or perfect fluid (meaning it is assumed to have no viscosity), an increase in speed is linked with a decrease in pressure or a decrease in the fluid’s potential energy. Although a perfect liquid, or a liquid without viscosity does not exist in nature, there are cases in which the liquid behaves as if it were perfect. For example: a liquid at rest in which the viscosity is not felt. Furthermore, a flow starting from a state of rest will have an initial region in which the effects of viscosity are not significant. For example: the flow over a spillway or the flow from a reservoir to a pipe or channel. In these cases the flow may resemble a perfect liquid.

32
𝐸 = 𝑧 +𝑝𝛾 +
𝑉!
2𝑔 = 𝑐𝑜𝑛𝑠𝑡.
This is the expression that represents Bernoulli’s equation. This is like energy conservation, but within a fluid: if there is no friction, the particle moves without loss of energy. In the case of an incompressible liquid in steady flow, in which the friction forces and energy losses can be ignored, the total head of a particle is maintained along its trajectory. Consider a streamline in a steady flow. At each point of this streamline situated at an elevation z above a datum. The different particles, which successively occupy that point, are subject to a pressure p and have a velocity V. The energy conditions that we defined previously correspond to this. To sum up: in relation to each point of a streamline the following specific heads or energies are defined:
- Piezometric head Ee= z + p/γ - Velocity head: Ec = V2/2g - Total head or energy: E=z+p/ γ + V2/2g
If along a streamline, on a vertical from the horizontal datum, lengths are marked to represent the static head, we obtain the piezometric headline that corresponds to the streamline considered. Likewise, if the total head is marked, we obtain the total head line or simply: energy line. The energy line is a distant from the piezometric line by a length, measured on the vertical, equal to the velocity head. Total head can be defined not only at a point on a streamline, but also in a straight section of a flow, if the streamlines have a very small curvature, so that they can be considered practically straight and parallel. In this case the static head, z + p/γ has the same value for the whole straight section. The velocity V, however may vary from one point to another of the straight section. By substituting the mean velocity U for the various velocities V of the particles, a correction factor of kinetic energy α is introduced. This is known as the Coriolis coefficient. It is defined as the ratio between the real kinetic energy of the flow and the kinetic energy of a fictious flow in which all particles move at the mean velocity U.

33
The piezometric headline and energy line are defined as relative or absolute according to whether the pressure is considered to be relative or absolute.
For fluid energy, the law of conservation of energy is represented by the Bernoulli equation:
𝑧! +𝑝!𝛾 +
𝑉!!
2𝑔 = 𝑧! +𝑝!𝛾 +
𝑉!!
2𝑔
where Z1-‐ elevation (m) at any point 1 of flowing fluid above an arbitrary datum Z2= elevation (m) at downstream point in fluid above same datum p1 = pressure at 1, (kPa) p2= pressure at 2 (kPa) γ= specific weight of fluid (kg/m3) V1= velocity of fluid at 1 (m/s) V2= velocity of fluid at 2 (m/s) g= acceleration due to gravity (9.81 m/s2) The left side of the equation sums the total energy per unit weight of fluid at 1, and the right side, the total energy per unit weight at 2. The preceding equation applies only to an ideal fluid. Its practical use requires a term to account for the decrease in total head (m), through friction. This term hf, when added to the downstream side, yields the form of the Bernoulli equation most frequently used:
𝑧! +!!!+ !!!
!!= 𝑧! +
!!!+ !!!
!!+hf
34
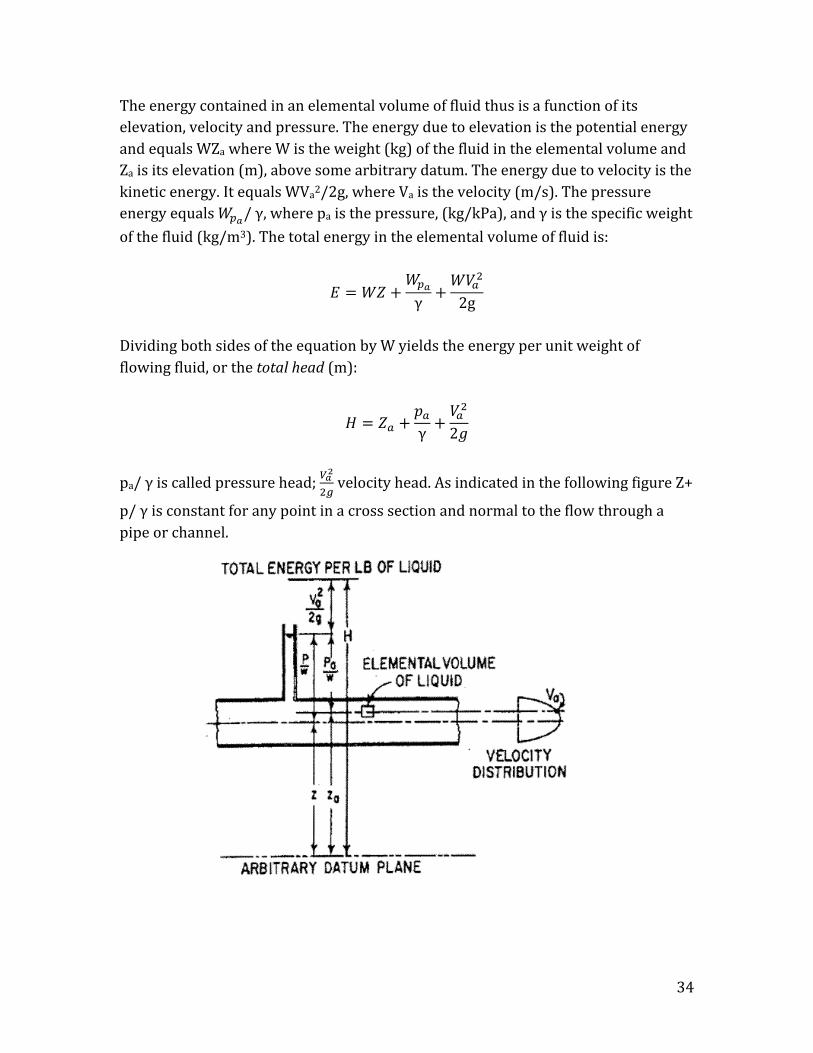
The energy contained in an elemental volume of fluid thus is a function of its elevation, velocity and pressure. The energy due to elevation is the potential energy and equals WZa where W is the weight (kg) of the fluid in the elemental volume and Za is its elevation (m), above some arbitrary datum. The energy due to velocity is the kinetic energy. It equals WVa2/2g, where Va is the velocity (m/s). The pressure energy equals 𝑊!!/ γ, where pa is the pressure, (kg/kPa), and γ is the specific weight of the fluid (kg/m3). The total energy in the elemental volume of fluid is:
𝐸 =𝑊𝑍 +𝑊!!γ +
𝑊𝑉!!
2g
Dividing both sides of the equation by W yields the energy per unit weight of flowing fluid, or the total head (m):
𝐻 = 𝑍! +𝑝!γ +
𝑉!!
2𝑔
pa/ γ is called pressure head; !!!
!! velocity head. As indicated in the following figure Z+
p/ γ is constant for any point in a cross section and normal to the flow through a pipe or channel.
35
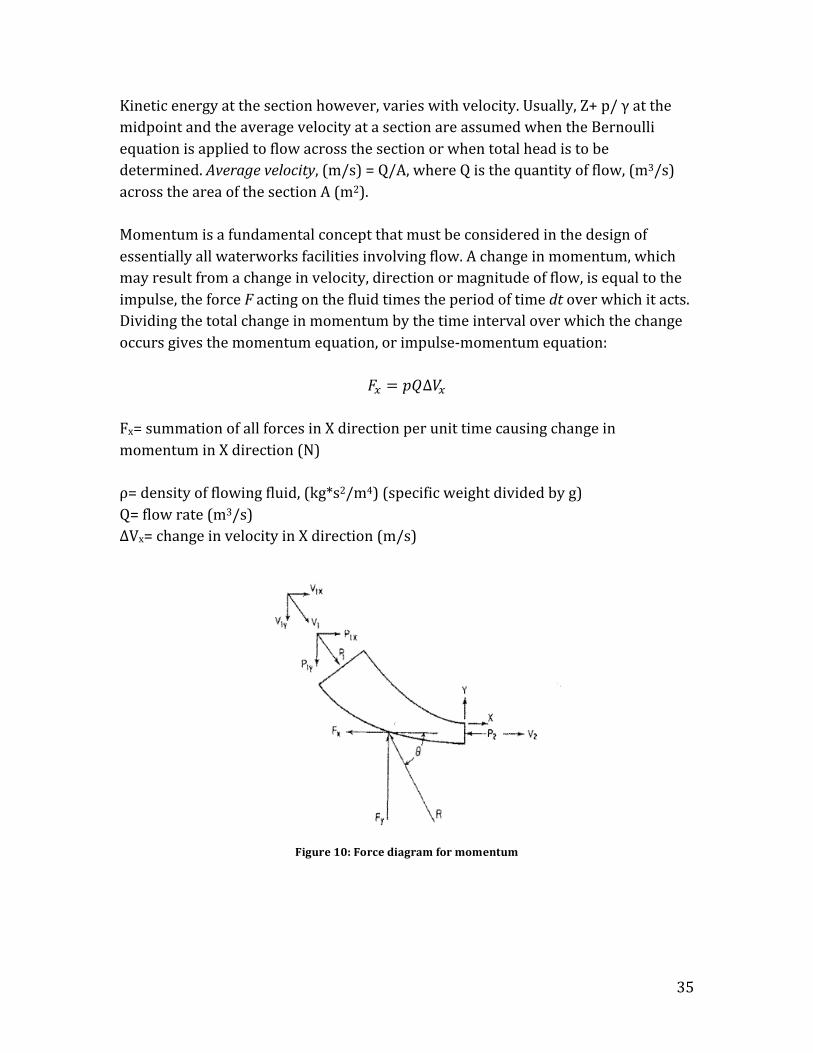
Kinetic energy at the section however, varies with velocity. Usually, Z+ p/ γ at the midpoint and the average velocity at a section are assumed when the Bernoulli equation is applied to flow across the section or when total head is to be determined. Average velocity, (m/s) = Q/A, where Q is the quantity of flow, (m3/s) across the area of the section A (m2). Momentum is a fundamental concept that must be considered in the design of essentially all waterworks facilities involving flow. A change in momentum, which may result from a change in velocity, direction or magnitude of flow, is equal to the impulse, the force F acting on the fluid times the period of time dt over which it acts. Dividing the total change in momentum by the time interval over which the change occurs gives the momentum equation, or impulse-‐momentum equation:
𝐹! = 𝑝𝑄∆𝑉!
Fx= summation of all forces in X direction per unit time causing change in momentum in X direction (N) ρ= density of flowing fluid, (kg*s2/m4) (specific weight divided by g) Q= flow rate (m3/s) ∆Vx= change in velocity in X direction (m/s)
Figure 10: Force diagram for momentum

36
4.3 Types of flow
4.3.1 Fluid flow in pipes Pipes are used in engineering to deliver fluid from one place to another. There are two flow types found within these structures, laminar (discrete layers without mixing) and turbulent (mixing action) flow. Laminar flow In laminar flow, fluid particles move in parallel layers in one direction.
Figure 12: Velocity distribution for lamellar flow in a circular pipe is parabolic. Maximum velocity is twice the average velocity.
A dimensionless parameter called the Reynolds number has been found to be a reliable criterion for the determination of laminar or turbulent flow. It is the ratio of inertial forces/ viscous forces and is given by:
Figure 11 Pipe Flow (Han, Concise Hydraulics, 2009)
37
𝑅 =𝑉𝐷𝜌𝜇 =
𝑉𝐷𝑣
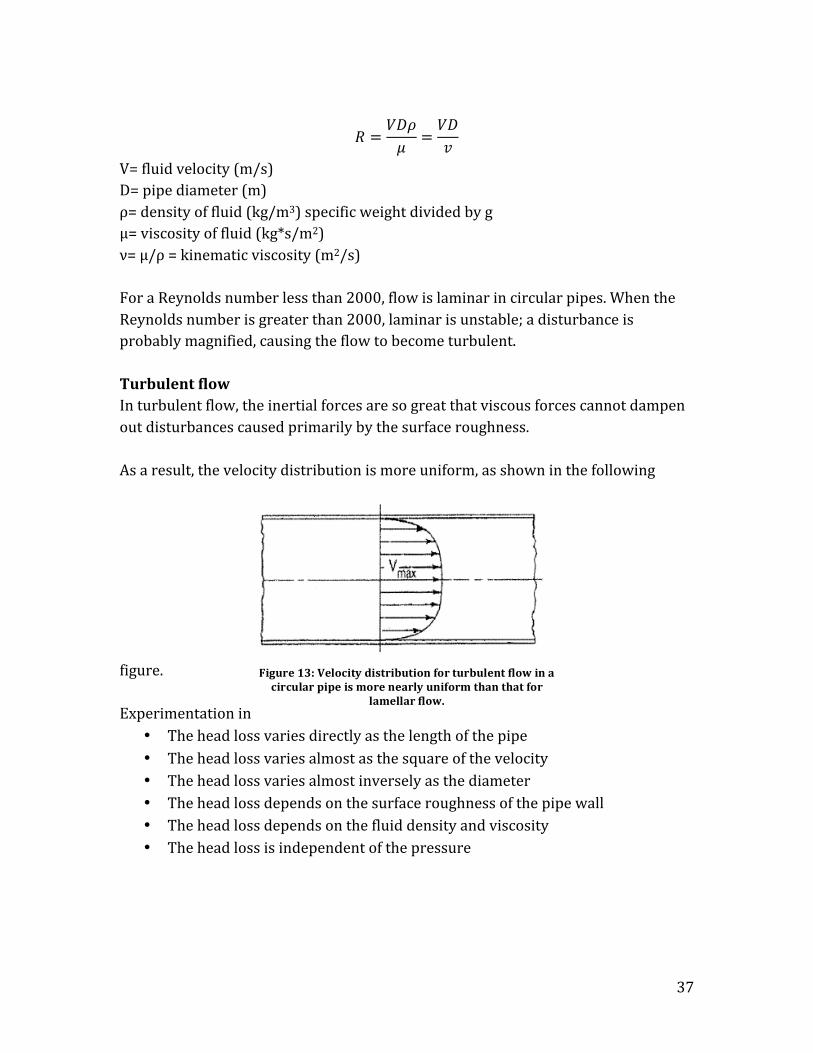
V= fluid velocity (m/s) D= pipe diameter (m) ρ= density of fluid (kg/m3) specific weight divided by g μ= viscosity of fluid (kg*s/m2) ν= μ/ρ = kinematic viscosity (m2/s) For a Reynolds number less than 2000, flow is laminar in circular pipes. When the Reynolds number is greater than 2000, laminar is unstable; a disturbance is probably magnified, causing the flow to become turbulent. Turbulent flow In turbulent flow, the inertial forces are so great that viscous forces cannot dampen out disturbances caused primarily by the surface roughness. As a result, the velocity distribution is more uniform, as shown in the following
figure. Experimentation in turbulent flow has show that:
• The head loss varies directly as the length of the pipe • The head loss varies almost as the square of the velocity • The head loss varies almost inversely as the diameter • The head loss depends on the surface roughness of the pipe wall • The head loss depends on the fluid density and viscosity • The head loss is independent of the pressure
Figure 13: Velocity distribution for turbulent flow in a circular pipe is more nearly uniform than that for
lamellar flow.

38
Pipe roughness Pipes are constructed out of a variety of materials and come in many different sizes. Some of the most common materials used for pipe construction or concrete, cast iron, commercial or welded steel, PVC, ceramic and glass. Depending on the conditions of where the pipe should be used, the appropriate material is chosen. Metal pipes, for example, are usually made from steel, iron, copper or titanium. Copper is frequently used for domestic plumbing systems where heat transfer is desirable. Titanium is used for pipe systems with high temperature or pressure. Plastic tubing is commonly used because of its light weight, chemical resistance, non-‐corrosive properties and easy connection options. Polyvinyl chloride (PVC) pipes are the leading pipe material used for drinking water distribution and wastewater disposal. Pipes also may be constructed out of concrete or ceramic for low-‐pressure applications such as sewage. Each material has a different pipe roughness value that is usually provided by the manufacturer. The roughness value e plays an important role on friction losses of a fluid moving through the pipe. Absolute roughness is usually given in either mm or inches. Common values range between 0.0015 mm for PVC pipes and 3.0 mm for rough concrete pipes. Relative roughness is the roughness of a pipe divided by its internal diameter or e/D. This value is used to calculate the pipe friction factor, which then used in the Darcy-‐Weisbach equation calculates the friction loss in a pipe.
Material
e (mm)
Concrete 0.3 – 3.0 Cast Iron 0.26 Commercial or Welded Steel 0.045 PVC, Glass, other Drawn Tubing 0.0015
Figure 14 Pipe Materials and Common Pipe Roughness Values (PipeFlow, 2012)
39
Darcy-‐Weisbach Formula One of the most widely used equations for pipe flow, the Darcy-‐Weisbach formula satisfies the condition described in the preceding section and is valid for laminar or turbulent flow in all fluids:
ℎ! = 𝑓𝐿𝐷𝑉!
2𝑔
hf = head loss due to friction (m) f= friction factor L=length of pipe (m) D= diameter of pipe (m) V= velocity of fluid (m/s) g= acceleration due to gravity (9.81 m/s2)
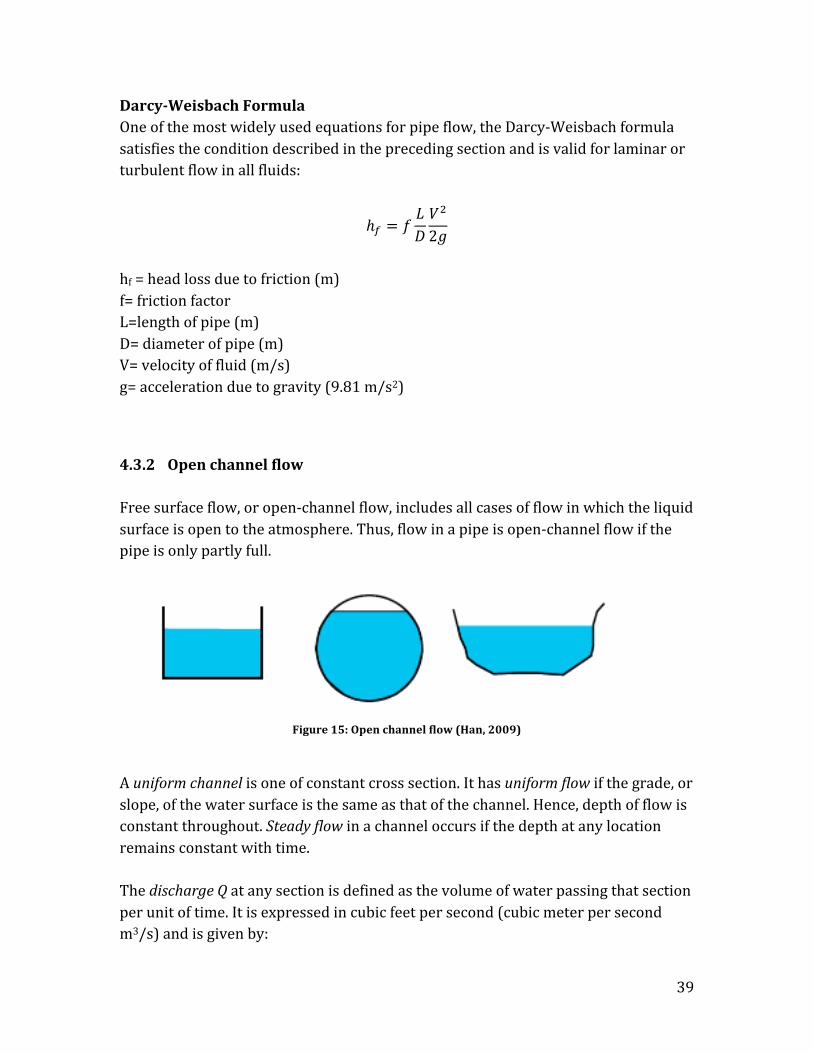
4.3.2 Open channel flow Free surface flow, or open-‐channel flow, includes all cases of flow in which the liquid surface is open to the atmosphere. Thus, flow in a pipe is open-‐channel flow if the pipe is only partly full.
Figure 15: Open channel flow (Han, 2009)
A uniform channel is one of constant cross section. It has uniform flow if the grade, or slope, of the water surface is the same as that of the channel. Hence, depth of flow is constant throughout. Steady flow in a channel occurs if the depth at any location remains constant with time. The discharge Q at any section is defined as the volume of water passing that section per unit of time. It is expressed in cubic feet per second (cubic meter per second m3/s) and is given by:

40
Q= VA
V= average velocity (m/s) A= cross-‐sectional area of flow (m2) When the discharge is constant, the flow is said to be continuous and therefore Q=V1A1 = V2A2 = … where the subscripts designate different channel sections. This preceding equation is known as the continuity equation for continuous steady flow. Depth of flow d is taken as the vertical distance, ft (m), from the bottom of a channel to the water surface. The wetted perimeter is the length (m) of a line bounding the cross-‐sectional area of flow minus the free surface width. The hydraulic radius R equals the area of flow divided by its wetted perimeter. The average velocity of flow V is defined as the discharge divided by the area of flow:
𝑉 =𝑄𝐴
The velocity head Hv (m) is generally given by
𝐻! = 𝑉!
2𝑔
where V = average velocity (m/s); and g = acceleration due to gravity. The total energy per kilogram of water relative to the bottom of the channel at a vertical section is called the specific energy head He. It is composed of the depth of flow at any point, plus the velocity head at the point. It is expressed in meter as
𝐻! = 𝑑 +𝑉!
2𝑔
A longitudinal profile of the elevation of the specific energy head is called the energy grade line, or the total-‐head line. A longitudinal profile of the water surface is called the hydraulic grade line.
41
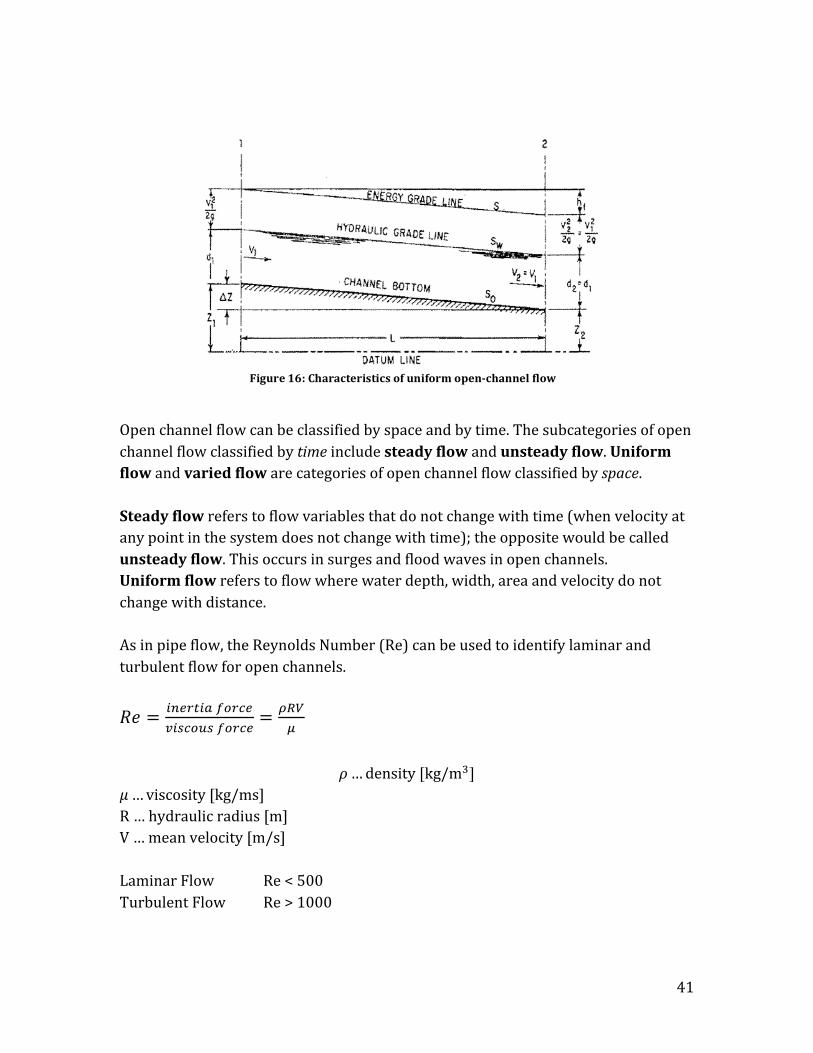
Open channel flow can be classified by space and by time. The subcategories of open channel flow classified by time include steady flow and unsteady flow. Uniform flow and varied flow are categories of open channel flow classified by space. Steady flow refers to flow variables that do not change with time (when velocity at any point in the system does not change with time); the opposite would be called unsteady flow. This occurs in surges and flood waves in open channels. Uniform flow refers to flow where water depth, width, area and velocity do not change with distance. As in pipe flow, the Reynolds Number (Re) can be used to identify laminar and turbulent flow for open channels.
𝑅𝑒 = !"#$%!& !"#$%!"#$%&# !"#$%
= !"#!
𝜌… density [kg/m!]
𝜇… viscosity [kg/ms] R … hydraulic radius [m] V … mean velocity [m/s] Laminar Flow Re < 500 Turbulent Flow Re > 1000
Figure 16: Characteristics of uniform open-‐channel flow

42
The flow in natural rivers is usually unsteady, whereas canalized rivers and canal flow is usually steady non-‐uniform or uniform. Other factors that may have an impact on flow are: -‐inaccuracies and errors -‐curvature loss (direction change) -‐suspended matter and sediment transport -‐absorption of air -‐undetected obstacles -‐waves Artificial channels or canalized rivers are channels made by man. These include irrigation and navigation canals and drainage ditches. They are usually constructed in a prismatic regular cross-‐section shape. They are commonly constructed of concrete or earth and have the surface roughness reasonably well defined. Natural channels are not regular or prismatic and their construction materials vary widely. Consequently it is difficult to accurately analyze or obtain satisfactory results for natural channels.
Normal depth of flow The depth of equilibrium flow that exists in the channel is called the normal depth. This depth is unique for specific discharge and channel conditions.
Critical Flow Water flow in open channels can also be classified into supercritical and subcritical flows. When a liquid at a given pressure and temperature passes through a restriction such as a valve in a pipe, into an area with lower pressure, the velocity of the fluid increases as required by the conservation of mass principle. Simultaneously the Venturi effect causes the static pressure / density to decrease downstream of the restriction. The flow at a critical pressure drop, or “critical flow” occurs at the point where the flow rate will not increase with a further decrease in pressure. (Green & Perry, 2007) Flow in an open channel is also classified according to an energy criterion. For a given discharge, the energy of flow is a function of its depth and velocity. This

43
energy is a minimum at one particular depth, the critical depth Yc. It shows that the dimensionless Froude number characterizes the flow: where v is velocity, g is the gravitational acceleration and y is the depth of flow. Fr < 1, flow is said to be subcritical (slow, gentle or tranquil) Fr = 1, flow is critical, when the depth is equal to , when the depth is equal to Yc the critical depth (minimum energy) Fr > 1, flow is supercritical (fast or shooting)
The occurrence of critical flow is very important in the measurement of river discharge because in the cross section with critical flow for a given discharge, there is a unique relationship between velocity and the discharge as = √(g y). Thus only the depth has to be measured to calculate velocity. Elsewhere, the flow might be either subcritical or supercritical and both velocity and depth would have to be measured to derive discharge.
44
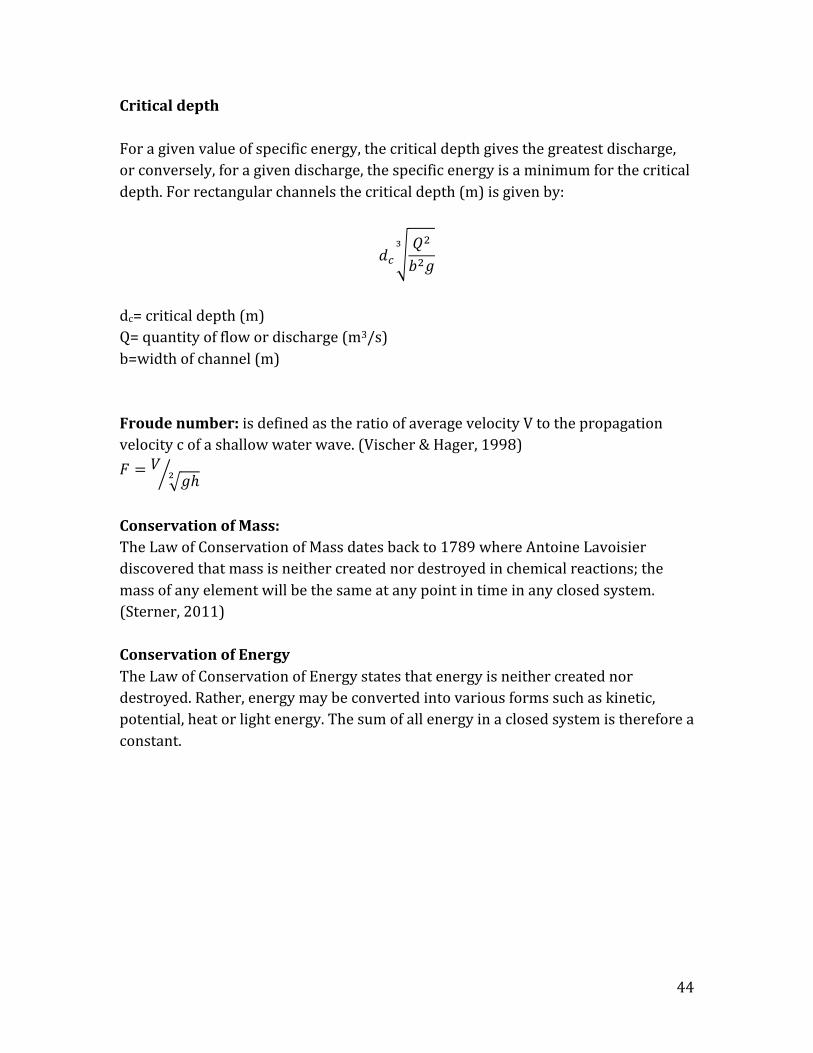
Critical depth For a given value of specific energy, the critical depth gives the greatest discharge, or conversely, for a given discharge, the specific energy is a minimum for the critical depth. For rectangular channels the critical depth (m) is given by:
𝑑!𝑄!
𝑏!𝑔!
dc= critical depth (m) Q= quantity of flow or discharge (m3/s) b=width of channel (m) Froude number: is defined as the ratio of average velocity V to the propagation velocity c of a shallow water wave. (Vischer & Hager, 1998) 𝐹 = 𝑉
𝑔ℎ!
Conservation of Mass: The Law of Conservation of Mass dates back to 1789 where Antoine Lavoisier discovered that mass is neither created nor destroyed in chemical reactions; the mass of any element will be the same at any point in time in any closed system. (Sterner, 2011) Conservation of Energy The Law of Conservation of Energy states that energy is neither created nor destroyed. Rather, energy may be converted into various forms such as kinetic, potential, heat or light energy. The sum of all energy in a closed system is therefore a constant.

45
5 River Engineering River engineering is the process of planned human intervention in the characteristics, flow or course of a river in order to achieve a particular benefit. Humans have been intervening in the natural course of rivers for thousands of years to manage the water sources, protect against flooding or to make navigation easier.
5.1 River Morphology River morphology (also known as fluvial geomorphology) is a branch of the science called geomorphology, or the study of forces that shape earth’s surface. Geomorphology helps understand the geological features created throughout time by various geological agents including volcanoes, wind and of course water. Fluvial geomorphology can be defined as “an understanding of the processes of water and sediment movement in river catchments and channels and their floodplains-‐ together with the forms produced by those processes”. (Environment Agency, 2010) When water is deposited on land by precipitation it possesses potential energy. As the water flows downhill, this potential energy is converted into kinetic energy. Kinetic energy caused by water flow can then be used or converted into other forms of energy that cause turbulence or friction within the water, erosion of riverbanks or the transportation of sediment and the conversion into thermal energy when entering a larger body of water such as a lake. The natural shape of a river evolves over time such that it is most efficient in the movement of water and sediments of the river. (Matsuda, 2004) However, through human intervention equilibriums of the river can be disturbed if geomorphological issues are not addressed properly prior to the planned disturbance. This may accelerate negative processes such as erosion and/or deposition. (Environment Agency, 2010) Two of the most important concepts behind river morphology are conservation (maintaining or restoring natural habitats and morphology) and sustainability (minimizing maintenance and cost). The forms or morphologies of rivers show infinite variety, however in practice certain “typical states” are usually used that can be described through cross section, planform and long profile.

46
The cross section of a channel is defined through properties of width and depth along with the overall size (area). The depth of flow in a channel is proportional to the riverbed’s ability to transport sediment and to the force that water exerts on it. The cross section can show the characteristics of the banks, natural levees, meanders, the width and depth of channels, deltas and so on. The longitudinal profile of a river is a graph of height against distance downstream. In other words, it is the cross section of a river beginning at the source continuing to the mouth. Both the valley and the channel also have a characteristic planform, which put simply, is the view from above. Depending on the slope of the longitudinal profile, cross-‐section and bed structure, rivers have different watercourses with distinctive features. There are three basic types of channels: Straight channels: are rare in nature (often man-‐made) and tend to only form in areas with strong bedrock controls. Meandering channels: are single channels with a series of deep pools, eroding beds and point bars-‐ causing turns over the length of the river. Geoscientists use the sinuosity ration to determine whether a channel is straight or meandering. The sinuosity ratio is the distance between two points on the stream. If the sinuosity ratio is 1.5 or greater the channel is considered to be meandering. Braided channels: are made of a number of channels split by gravel bars or islands and are created when one stream is divided into several smaller ones through
Figure 17: Cross section (Environment Agency, 2010)

47
deposit accumulation in the channel. This type of channel is common in glaciated areas. (Ritter, 2009)
However, describing a channel by one of the mentioned terms does not mean that the entire channel is formed in that way. It simply describes a portion of the channel. For example, one portion of a river may be straight, while another downstream is braided. As mentioned previously, the morphology of a river can be viewed by considering its long profile and cross section profile. The long profile is the section that can be obtained by looking at the channel from source to mouth. This section indicates the slopes in different areas of the channel, the waterfalls and rapids. It also shows lakes that may occur along the path of a river. Rivers change shape from their source to the mouth. The longitudinal profile can be divided into four sections:
• The upper reach of a river begins in the mountains. It is placed in a narrow valley and has small tributaries. The flow gradient is high (J>1%) and highly variable. This is why the riverbed is highly erodible and transports stones and boulders. When observed over a longer period of time, the watercourses in the upper reach are in a state of erosion (depression).
• In the middle reach of a watercourse, the valley widens while the slope becomes lower (I is larger than 1 tenth of a percent and smaller than 1 percent). The river is stretched, straighter than in the upper reach, and can
Figure 18: Channel planform (Environment Agency, 2010)

48
extend sideways. There are fewer tributaries than in the upper reach, but they have less discharge. In the middle reach the rivers transport gravel and sand. In balanced and undisturbed conditions only very little erosion and deposition occur.
• The lower reach of a river is characterized by wide river valleys. The river has a low gradient (I is smaller than 1 tenth of a percent) and the cross section of the river is wide. It meanders in wide bends and covers large parts of the valley area during floods. The river bed is covered with sand and silt.
• At the mouth of the river the flow gradient is so small, that even the finest components are not transported. Permanent deposition is usually associated with the formation of a river delta, which advances gradually as alluvial deposits in the sea. (Strobl, 2006)
1. Highlands 2. Uplands 3. Lowlands
Distinct valleys; few small valley floors
Often wide valley floors Little developed valleys
Many small tributaries Few large tributaries Very few tributaries
Steep, varying longitudinal slopes
Balanced longitudinal slope Flat longitudinal slope
Inconsistent cross-‐section Balanced cross-‐section Flat cross-‐section
Irregular course Stretched course, Large curves, meanders
Mostly deep erosion Side / bed erosion, accumulation
Mostly side/ bed erosion, accumulation
Coarse debris to fine particles Gravel to fine particles Sand to fine particles

49
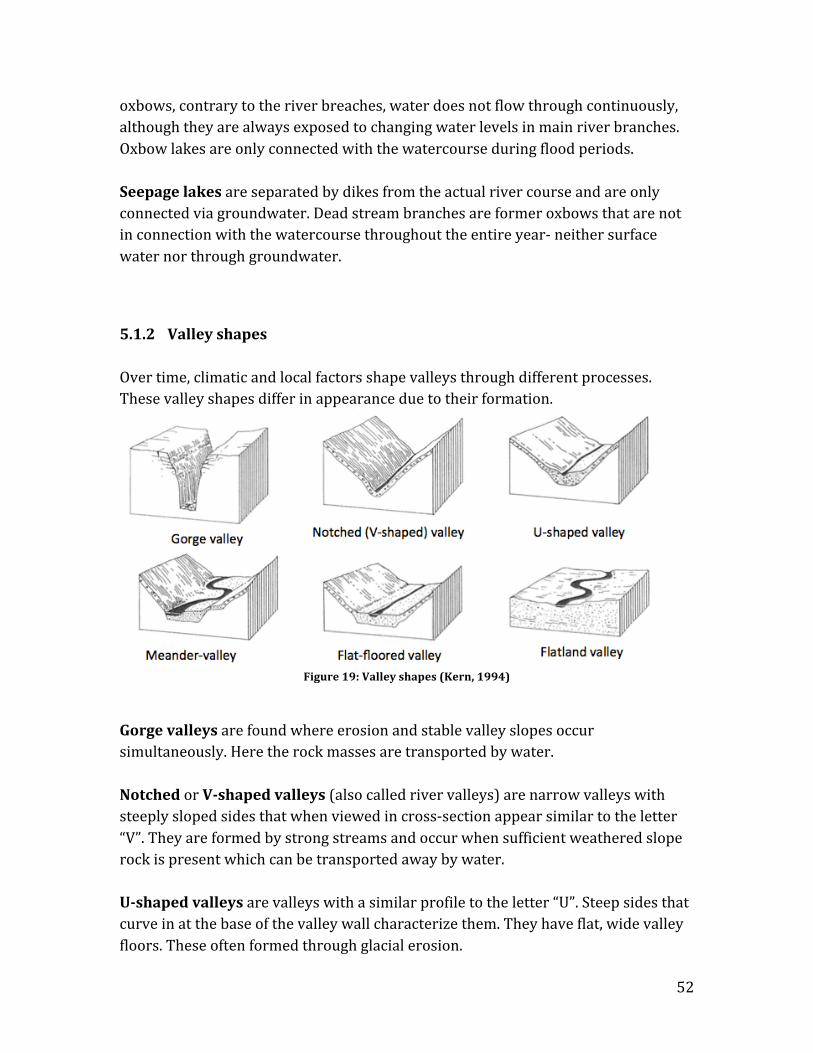
5.1.1 Riverbed forming processes The earth surface is formed through the impact of climate on the development of geological formations. Various valley shapes develop under influences of tectonic pre-‐conditions, the effects of glaciation, erosion of the embankment slopes and the transport of the rock material. Furthermore, climate factors such as precipitation, wind and temperature; as well as local factors such as geology, geomorphology, soil and vegetation all effect how the surface is formed. Geological and climatic factors influence the development of rivers. Long-‐term processes form the framework in which then also the short-‐term processes occur and develop. The climate is defined through temperature, precipitation, air humidity, wind direction, wind strength, cloudiness and sunshine duration. All of these factors influence the various climate systems such as the water cycle. The climatic factors have an impact on geological formations that shape the Earth’s surface. In a natural watercourse the relief mainly influences the layout and longitudinal profile. The relief is the difference between the highest and lowest elevations in an area. Erosion, sediment transport and sedimentation shape the riverbed. Long-‐term and short-‐term processes overlap continually and result in the morphology of watercourses and flood planes. Erosion is a process by which soil and rock are removed from the Earth’s surface through natural processes such as water flow, and then transported and deposited in other locations. In natural watercourses, deep erosion causes scouring, rapids, waterfalls and cascades. On the outer banks of rivers, erosion causes the formation of side slopes. If these are undercut by flowing water, they break off and the current carries the material away. This results in a broadening of the watercourse. Sediment transport is the movement of solid particles or sediment, typically due to a combination of the force of gravity acting on the sediment and/or movement of the fluid in which the sediment is. This is important in understanding natural systems where the particles are sand, gravel, boulders, mud or clay. There are different types of sediment transport (Aeolian, fluvial, coastal, hillslope, etc.), however in hydraulic engineering fluvial-‐ sediment transport related to flowing water-‐ is the most relevant. For a fluid to begin sediment transport that is at rest on a surface, the bed (or bottom) shear stress 𝜏! exerted by the fluid must exceed the critical shear stress 𝜏! . The bottom shear stress acting on the riverbed can be derived using a simplified flow element:
𝜏! = 𝜌 ∙ 𝑔 ∙ 𝑅! ∙ 𝐽!

50
ρ… water density [kg/m!] g… gravitational acceleration [m!] R!…Hydraulic radius [m] J!… slope of the energy line [‰] As a rule of thumb for estimating bottom shear stress the following formula can be used:
𝜏! = 10 ∙ ℎ ∙ 𝐽! where h [m] and J! [‰] are used. Bottom shear stress τ0 is a value averaged over the perimeter. 5 to 15 N/ m² are classified as critical in gravel rivers and in sandy rivers 2 to 5 N/ m². Example: In a river with a flow depth of 2.3m and a slope of 0.5‰, the flow of bottom shear stress exerts a force of about τ0 = 10 ∙ 2,3 ∙ 0,5 = 11,5 N/m². Sediment transport can be divided in three types of movement:
• Weak motion: some of the smallest particles are localized to be moved • Average motion: the average grain diameter is in motion • General movement: larger particles are in motion
Sedimentation is the tendency for particles that are in suspension to settle out of the fluid in which they are in and come to rest. This occurs because of their motion through the fluid in response to forces acting on them (e.g. gravity). Sedimentation is often used as the polar opposite of erosion in geology and signifies the end of sediment transport. A river is also shaped under the influence of its drag force and inertia forces in bends (centrifugal forces) as well as the form and appearance of the river valley. Drag forces refer to forces that act on solids in the direction of the relative fluid flow velocity. They decrease fluid velocity relative to the solid object in the fluid’s path. Because of the various forces and interactions in nature, straight rivers nearly never occur. On the contrary, a river often changes its direction and forms river bends and loops. If a river is forced through technical measures in a straight bed, a meandering motion develops. Through this process sand and gravel bars are created and deposited alternately along the riverbank. (Strobl, 2006)

51
In addition to the slope and transport capacity, the available sediments have a significant impact on the development of the watercourse. Low sediment load and low slope lead to a straight layout. As the sediment load increases, relocation processes in the riverbed intensify, too. Lower bed slopes lead to an increase in the tendency to meander. A meander in general is a bend in a watercourse (as mentioned previously). It is formed when moving water in a channel erodes the outer banks thus widening the valley. Meandering erodes sediments from the outside of a bend and deposits these on the inside, resulting in a snaking pattern. These water loops are in a state of constant change due to progressive erosion until the outer bank comes to a breach. The time to breach depends on the erosion resistance of the soil and the existing riparian vegetation. This process can take years. Winding and meandering of rivers with low gradients may form oxbows. Oxbow lakes are U-‐shaped bodies of water formed when a meander is cut off from the main stream. Due to the river’s erosion of the bank through hydraulic action, abrasion and corrosion, a meander can become very curved until its neck touches the opposite side. The river then cuts through the neck cutting off the meander.
The same geomorphological structures may be found in the oxbow and the main river along the outer and inner banks, as well as the structure of the riverbeds. In
52
oxbows, contrary to the river breaches, water does not flow through continuously, although they are always exposed to changing water levels in main river branches. Oxbow lakes are only connected with the watercourse during flood periods. Seepage lakes are separated by dikes from the actual river course and are only connected via groundwater. Dead stream branches are former oxbows that are not in connection with the watercourse throughout the entire year-‐ neither surface water nor through groundwater.
5.1.2 Valley shapes Over time, climatic and local factors shape valleys through different processes. These valley shapes differ in appearance due to their formation.
Figure 19: Valley shapes (Kern, 1994)
Gorge valleys are found where erosion and stable valley slopes occur simultaneously. Here the rock masses are transported by water. Notched or V-‐shaped valleys (also called river valleys) are narrow valleys with steeply sloped sides that when viewed in cross-‐section appear similar to the letter “V”. They are formed by strong streams and occur when sufficient weathered slope rock is present which can be transported away by water. U-‐shaped valleys are valleys with a similar profile to the letter “U”. Steep sides that curve in at the base of the valley wall characterize them. They have flat, wide valley floors. These often formed through glacial erosion.

53
Meander valleys arise where the existing sediments are not removed due to the lower transport capacity of the water flow. Flat-‐floored valleys have steep slopes, yet a broad valley floor. They result from an excess of sediment. This is the most common type of valley in the world. These valleys, similar to the V-‐shaped valleys, are formed by streams but are no longer in their youthful stage and are considered more mature. As the slope of a stream’s channel becomes smooth, the valley floor widens. Larger slopes and coarse bed sediment have a lower shift of the watercourse. However, when a riverbed consists mainly of sand and gravel and has a lower slope, there is a strong tendency of shifting of the watercourse. This leads to the typical floodplain structures.
5.2 Channel Design The term channelization is used to describe all of the procedures of river channel engineering which are used to control floods, prevent channel or bank erosion, improve drainage and maintain navigation. These procedures include the enlargement, alignment, embanking and protection of existing channels and of channel construction. (Gore & Petts, 1989) Channel design or form can be interpreted as the outcome of the continuous competition between the erosion and resistance forces of the riverbank materials. Over time, rivers develop a channel that is able to carry the flow and sediments within it. Deciding on the correct design of a channel involves the selection of many factors including channel shape, size, bottom slope and whether the channel should be lined to reduce or prevent erosion of the channel sides and bottom. Possible channel types include unlined, lined or grassed channels. Each channel design has unique features that require special consideration. The final channel design is usually decided by a trial and error procedure based on required or desired parameters. Many alternatives are considered and compared on an economic and ecological level. (Han, 2009) Channel design can be divided into two categories: rigid-‐boundary channels and erodible channels.

54
5.2.1 Rigid-‐Boundary Channels A lined channel is less resistant to flow, thus the size required for a specific flow rate at a given slope is smaller and therefore in some cases more economical than an unlined channel. In this design the channel cross section and size are selected such that the discharge is carried down the channel with an appropriate distance between the water surface and channel bank.
5.2.2 Erodible Channels There is an abundance of unlined or erodible channels, both in man-‐made and natural rivers. The boundaries of these channels constantly change in form due to the continuous process of erosion and deposition within the river. Channels in which the bottom or sides are erodible require a certain size and bottom slope. The design of such channels has been made possible using two methods: the permissible velocity and the tractive force method. The first of the two methods selects the channel size so that the mean flow velocity for the discharge (under uniform flow conditions) is less than the permissible flow velocity. The permissible velocity can be defined as the mean velocity at which the channel is not eroded. This velocity depends primarily on the type and texture of soil, although channel depth and shape (straight or curved) also affect erosion. The second method used to design erodible channels concentrates on the forces acting on a particle laying on the channel bottom or side. Put simply, if the forces tending to move the particle are greater than the forces resisting this movement, the channel will erode. The force which water exerts on the channel bottom and sides is called tractive force. (Engineers Without Borders-‐Duke, 2011)
5.3 Profile Stabilization Nowadays, it is practically impossible to avoid human intervention in river flow. Several main activities intervene in the natural flow of a river including provisioning projects, hydropower projects and river engineering methods that protect settlements, industrial plants and traffic areas from flooding and erosion. A drop in groundwater level, which occurs as a consequence of bed erosion in a river, must be avoided so that the surrounding agriculture and ecologically valuable habitats are

55
not harmed. The groundwater level corresponds closely to neighboring open channel flows. Civil engineering measures should secure certain groundwater levels in agricultural areas so that the production is not endangered. In recent decades the importance of the ecological continuity (including fish passes and allowing sediment transport) in watercourses and the maintenance as well as restoration of natural developed structures and communities in waters has been recognized. Consequently, today river engineering is more oriented towards natural and sustainable river development, decommissioning and restoring heavy regulated streams. Stream bank or profile stabilization aims to protect the flow profile against changes. It consists of vegetative, structural and bioengineering methods to stabilize and protect profiles. There are different strengths of regulation:
• Heavy regulation allows no change in a river profile • If a river is not regulated any type of change is possible • A compromise between these two is to allow changes within certain limits
(these limits can be set by ownership, the goal to prevent damages or the limits can be defined for other uses)
5.3.1 Profile stabilization construction materials A variety of materials are used to stabilize profiles. These materials can be separated into two groups: live and dead materials. Live materials include plants, plant parts and plant communities. Planting reed, grass and woody vegetation is one of the simplest forms of stabilizing a riverbank. The plant roots help stabilize the soil and control shallow mass movement. Dead materials include stone, wood, iron or steel, concrete and synthetic materials. They can be applied either alone or in combination with live materials. In ecological (near natural) hydraulic engineering, the applied materials are mainly part plants, dumped or placed wood and stones. In some cases metals in the form of piers, wire mesh and geotextiles made of synthetic materials or natural fibers are used for special constructions. Sealing materials such as concrete, asphalt, pavements, synthetic materials, etc. are generally not considered in near-‐natural hydraulic engineering. The materials should be adapted to the requirements of each water section. For example in non-‐bed load rivers building blocks should not be
56
used. The used plant must correspond not only to the catchment area, but also to the respective location, hydrology, climate and water flow of the area. Biological engineering structures in flood protection are based on suitable vegetation in the riparian vegetation zone and river area above the summer average water level. The properties of live materials are that they fulfill ecological objectives, stabilize soil due to their rooting, provide an area-‐wide protection of embankment, regenerate and regulate themselves. They are also aesthetically compatible with the landscape. However, these materials are an inadequate protection from extreme loads and are not very effective immediately after construction. Stabilizing a profile through vegetation prevents contaminants or excess nutrients from entering the water and offers shade and cover for the wildlife. In some situations optimal profile stabilization is achieved through the construction with dead materials. Dead materials fulfill technical and economic objectives, require a small amount of space, can be used for steep (even vertical) slopes, resist high loads, are effective immediately after construction and can be permeable or impermeable depending on the situation. They do not, however, contribute to the landscape or ecological quality.
5.3.2 Vegetation profile of a watercourse For waters with low flow velocities, reed plants are suitable for planting as bank protection. Their strong roots help secure and quickly regenerate the banks after a period of high water or overflow. Well-‐rooted grass embankments form a natural and ecologically good bank protection for shallow embankments and short term flow velocities up to 1.8 m/s. These must be mowed regularly. The cheapest way is the grazing by sheep. Trees along watercourses form the largest part of a natural vegetation community. They form a stable bank with their roots, provide protection through shade and serve as a valuable habitat for many animals. Profile stabilization under the water surface is also very important. In the underwater zone construction materials that are used include stone, wood, synthetic materials, concrete, metals and bitumen. It also includes aquatic plants. Stone is very water resistant and has a large variety of applications. Wood such as oak, larch, alder, pine, spruce and fir are also useful. Synthetic materials, such as PVC or PE can be used as geomembranes. Concrete can be used as an embankment wall or groundsill. Metals are used as anchors in the form of wires or wire mesh, and bitumen can be used as a concrete joint sealing compound. The underwater zone is

57
usually permanently submerged. Plants such as pondweeds and water lilies can inhabit this zone, which reduce the water’s flow rate by friction. The roots of such plants help bind the soil and protect the channel from erosion. Above the underwater zone three further zones can be classified.
• The reed-‐bank zone • The softwood (shrub) zone • The hardwood (tree) zone
Reeds have a high protective effect. They protect the slope of the profile by covering it with their shoots and leaves. They cause a higher roughness and lower velocity of the water flow, slow the water’s flow rate by friction and reinforce the soil. The lower part of this zone is normally submerged for only half the year. Brushes, reed grasses, cattails and other plants that bind soil with roots and shoots inhabit this area. Another important benefit of reeds is that they have a large purifying capacity and effect on water. Planting reeds is a natural design for bank protection in rivers that do not have too high of a velocity rate. This practice does not apply where tidal conditions exist. The most important factor that is crucial for the success of stabilizing a profile is the appropriate selection of the reed. The species should be chosen according to the soil, water chemistry and temperature, flow and light exposure. The main types of reed found in our waters are reed canary grass (phalaris arundinacea) and canary reed (phragmites communis). Reed canary grass supports riverbanks very well due to their strong root system. During flooding the grass lies down and, since the stalk is usually not broken off, later rises by itself. This makes it suitable for higher velocities. If higher velocities occur during the growing season the stalk breaks off, water penetrates into the hollow stem, and causes the roots to rot. The next zone is the softwood or shrub zone. It is only flooded during periods of average high water. Trees and shrubs such as willow, alder, dogwood and viburnum inhabit it. These plants all have a high regenerative capacity and support the profile through their root systems, while also slowing the water speed by friction. This zone is also important in providing protection to tree trunks from damage by, for example, ice. They prevent the formation of strong eddies around large trees during floods. Shrub vegetation is very beneficial along the impact bank of a stream meander, where maximum scouring occurs. The incorrect use of shrub vegetation tends to reduce the channel width, which can increase the probability of floods. However, brief flooding of riverside woods and undeveloped bottomlands does not created significant damage.

58
The tree zone is flooded only during periods of high water. Tree roots hold soil in place through their root systems and are a great provider of shade and protection. Trees that can be found along the rivers in Austria include the cottonwood, alder, white willow, narrow-‐leafed ash, common oak and elm. When arranging trees along a watercourse, many factors should be considered. Factors that impact the effect of trees, in particular the amount of shade are:
• The composition of species of trees and shrubs • The arrangement along the water course (maximum effectiveness for shade
when planted in the south) • Density-‐ preferably vegetation should be placed in multiple lines • Height (should be chosen depending on the width of the watercourse)
The natural bank protection of watercourses is the riparian vegetation, in particular plants with strong root systems. Riparian areas are defined as a strip of moisture-‐loving vegetation that loves growing along the edge of a natural body of water. Its exact boundary is often difficult to determine because it is a transition zone between the water body and the upland vegetation. The functions of riparian vegetation include:

59
• Stabilizing the bank through deep roots that hold soil together • Reducing erosion and therefore sediment in the water which keeps spawning
areas clear • Reducing nutrients making water treatment easier • Providing a source of large woody debris which serves as shelter for animals • Providing shade which regulates stream temperatures • Supplying small organic debris including twigs and leaves necessary for
many organisms • Reducing stream velocity during high flow events
As this diagram shows, higher growth in the forelands reduces the velocity and thus the discharge capacity in the vegetation free cross section. This is based on the fictitious resistance coefficient in the vertical separation surface (vegetation boundary), which is a mathematical measure of the effect of momentum exchange, depending on the growth density. For example, very dense vegetation in the foreland has less impact in diminishing the flow in the main channel than one of a low density.
Velocity in [m
/s]
width in [m]

60
5.3.3 Artificial profile stabilization There are also many man-‐made methods to stabilize riverbanks that are made of natural materials such as willow mattresses, fascine rolls, wattle fences, packed fascine work, riprap and bank walls. A willow mattress is a natural construction for the protection of riverbanks. It is made out of thin, about 100 to 250 cm long branches, capable of sprouting new branches and twigs. The branches are held together with interweaving wire or other branches. They are set on the slope in flow direction obliquely spread upwards, and then with rods, or, even better, with low wattle fences kept down, the latter being "nailed" to stakes in the bank.
After the completion, the mattress covered with a few centimeters of cohesive soil, so it does not dry out until rooting. At the foot of the slope, using the Fascines roll or riprap additionally stabilizes the willow mattress. From willow mattress densely vegetated riverbanks arise the protection and habitat for a variety of animals. However, in this way a long time willow monoculture arises.
Willow mattresses can stabilize and secure an embankment up to a slope of about 1: 1 or slightly steeper. A limiting factor is the stability of the earth bank before the willow mattress begins with rooting. Fascines, also known as paddles or fascine rollers, belong to the longitudinal structures and are used to support the stream banks. To prepare the fascine rollers, about 5 to 6 m long willow rods are tied together in the 20 to 40 cm thick bundles. The fascines are built in the level of the average flow by placing them with thick rod ends in upstream direction and fastening them with pegs. A cover of moist soil keeps the fascines and improves the growth and it arises from a tree border, which overtakes the bank stabilization. Immediately after the installation, even before they are expelled and are rooted, the fascines overtake a mechanical protection. The overlapping joints of the individual bundles are always in danger from water destruction. It is therefore advantageous to use and install fascines "endlessly” meaning to avoid joining sections. Fascine constructions may be evaluated as very

61
flexible in construction and ecologically positive. Between the branches and twigs there must always remain enough cavities that serve as shelter for a variety of animals. Fascines made of dead material present therefore certainly also a desirable entry of woody debris in the water. Fascines are sausage-‐like bundles of live woody cuttings, tied together. Placed in shallow ditches cut into the stream bank, and secured with live or dead stakes, they will sprout to produce a thick cover of brush. Most often placed on the slopes parallel to the contour, fascines may be used in combination with other vegetative stabilization methods.
Sink fascines are fascines, in which stones are embedded. Therefore, they can be lowered at deep cracks and be applied as bank stabilization under water. Sink fascines are a combination of wood and stone construction. No willows may be applied here for the border construction, because the plant parts are constantly under water. Because of using of stones the sink fascines are very heavy, so that usually a protection with pegs is not necessary. The use of classical fascines and sink fascines requires much expertise and experience. The use of fascines has low material costs, but high labor costs.
For a rapid and effective protection of banks that already have cracks, rough trees are used (primarily as an emergency measure). Strong branched trees, mainly

62
spruce but also alders, willows and poplars are used for rough trees. They are mounted with their crown downstream. In order that the structure functions
effectively, the branches must always reach the foot. Longer danger spots are secured by hooking several rough trees, in such a way that the upper crown of the tree covers the following stem that is without branches.
The rough trees are not prepared for the construction by conventional felling of trees. The two or three most powerful roots must remain on the tree stem. The tree is fixed with the help of a steel cable loop. Due to the time-‐limited duration of the rough trees, the stabilization of the endangered riparian zones should be supported as soon as possible. Braids serve as a direct bank protection, or the gradual aggradation of damaged areas. The aboveground parts reduce the flow velocity and shear stress and thus cause increased sedimentation and aggradation. The sediment material is in turn rooted through and thus supports the aggradation.
Wattle fences have a pure function of stabilizing the embankments. Higher banks cannot be stabilized by this construction. Wattle fences are suitable only for larger rivers without sediment transport, because otherwise they would be badly damaged and destroyed. Earlier the wattle fences were also used as parallel shoring bank protection over the long distances. This is an unfortunate solution,
because the wattle fence formed by the shoreline is relatively straight and smooth. A more structured bank is only revealed through a succession, if the willow edge of wattle fence is replaced by a site-‐specific tree edge. There are also wattle fences made of non-‐sprouting material. These should be avoided for the reasons described above. If they are unavoidable, they should be completely backfilled and planted immediately. The roots of the trees or bushes must assume the protective function before the wattle fence rots.

63
Engineering constructions predominantly have economic objectives. Security measures are performed in watercourses with the help of technical devices and machines, and using hard (dead) materials. Technical supporting structures are used everywhere where the occurring shear stress of bioengineering control structures can not be accepted without damage, given where there are no living conditions for the vegetation, where lack of space, steep or vertical sides shall be made or where the full protection must be given immediately after completion. Timber walls are suitable for the protection and preservation of steep meadows. Usually the oak, elm and larch in the air-‐water-‐transition zone have the longest life. Under water also other woods show high persistence; for example alder, pine and fir. Firstly the piles are constructed in regular separation distances perpendicularly or slightly inclined towards land driven into the ground. In the solid ground, the driving depth must be approximately equal to the free length of the piles. Krainer wooden walls are suitable for the stabilization of riverbanks from erosion and landslides, on slopes in confined spaces. Essential features in their manufacture are the simple design and quick assembly, dry construction, and water permeability. Krainer concrete walls are made of reinforced concrete, prefabricated wood plates and/or logs. While the runners are arranged parallel to the slope course, are the ties or clamps to extend at right angles and into the embankment. So-‐called spacers support the tie hang from each other. Krainer walls have many niches, suitable single column and settlement areas for fish, invertebrates and microorganisms. A stone construction for bank protection against bank erosion is needed where the free development of the watercourse is not possible and the bioengineering measures are not sufficient. This is especially the case when there are steep embankments and the average discharge is so deep that the woody roots do not reach the toe of the slope. Furthermore, if for example Sediment transport, wave action or high shear stresses (such as river navigation) prevent the plant growth. Stone Set: Large stones and boulders with an edge length of more than about 80 cm and a mass of more than 1.2 tones, are laid with the help of heavy hydraulic excavators to individually set stones. Stone's throw small stones with edge length under about 60 cm and a mass of about 0.5 tons are usually from trucks or rail from the top of a box tipped over the embankment with the help of an excavator or thrown over the embankment.

64
Riprap and stone paving: standing, possibly for cost reasons, only very small pieces with edge lengths of 15 to 20 inches are available, which are processed layers as riprap, has exceeded the limit of semi-‐natural building methods. Such small stones resist small shear stresses, so that adequate security would also be given by bioengineering. Pavement, possibly even with joint grout, mortar or concrete underneath should not be used in near-‐natural hydraulic engineering. In exceptional cases, as in closely built-‐up areas or in the vicinity of objects and traffic systems, have to be the banks (or tears) often supported by stone or concrete. Walls of stone can be built in dry construction, in conjunction with mortar or as a lining of concrete walls. The stones used must be water and frost resistant. The strength of a wall depends on the height, and the pressure exerted on the wall. Roughly speaking, the crown should be at least 0.5 m wide and it is expected that the wall thickness would increase downwards for 10 cm per meter.
5.3.4 Transverse structures Profiles can also be stabilized through transverse structures. These are transverse to the flow line. The goals of transverse structures are:
• The protection of the cross section profile • Controlling sediment transport • The limitation of over flooding and the • Control of bed development •
These structures include: • Sills • Groynes • Dykes • Ramps
Sills are linear transverse structures over the entire flow width, which are installed to stabilize the unstable riverbed causing riverbed relief. This results in more consistent sedimentation zones, a uniform water depth and more balanced flow conditions. Just downstream of the sills pits may arise pits, which have a positive impact on fish stocks. Sills should support the existing bed material and prevent the migration of the settled sediment or at least delay. In this way the bottom slope is stabilized.

65
Groynes are transverse structures over part of the flow width, which consist of a head, body and base. They are dam-‐like structures, which are oriented mostly from the bank inclined upstream, at a right angle to the bank or declined downstream. The groyne base must be carefully integrated into the bank; however, the groyne head must be stabilized because of the turbulent flow in the main stream. The distance between two groins is large approximately as the watercourse width, or 1.5 to 2.5 times the groyne length. Groynes can be constructed from many materials according to the type of groyne. They are usually constructed from rough trees, tracery, fascine, fascine filling, stone filling, greened riprap, wooden piles, stone box or gabion. Groynes made of quarry stone are mainly used in rivers in mountainous areas. If they are short and massive, they are called spurs. Groynes may also result from wood in the form of walls and poles, or piles of wood and stone are mixed up as piling and fixed breakwaters. The effects of groynes are: a reduction of flow velocity near the riverbank, narrowing of the flow width, siltation of groyne fields and an increase in structural diversity. The advantages of constructing groynes are that they are very adaptable, correctable, and ecologically passable and provide positive benefits to recreation such as fishing. There are different types of groynes including the tongue groyne, triangular breakwater, wing groyne and hook breakwater. Longitudinal dykes (also known as training walls) are usually more economical than groynes. If positioned correctly, they are equally or even more effective. Dykes are made of rubble, stone or fascine work (on soft river beds) and may be single (one side) or double (on both sides of the channel).
66
6 Hydraulic Structures
6.1 Dam Engineering Since the beginning of civilization, storage reservoirs have been one of the most important factors of building and maintaining a successful community. The ability to store and direct water has not only optimized organized agriculture, but also has increased general health and the ability to make material and technological progress as well. Dam construction is one of the most major investments in infrastructure internationally. Every year there is a continuous increase in dam completion world wide, especially in countries such as China, Iran, Turkey and Japan. (WWF, 2012) The primary purpose of a dam can be seen as providing for the safe retention and storage of water. Other purposes include creating a hydraulic head or a water surface. Hydraulic heads increase the net pressure on a power plant, and water surfaces enable navigation and lake recreation. Large dams also generate approximately 19 percent of the world’s total electricity. One third of countries worldwide rely on hydropower for more than half of their electricity supply. (The World Commission on Dams, 2012) What are large dams? Since accurate statistics are not available to confirm the total number of dams in service worldwide, the International Commission on Large Dams (ICOLD) defined those exceeding 15m in height or having a storage volume of 1 x 10!m! as “large dams”. (ICOLD, 1996) Accurate statistics exist for this type of dam, and state that there are as many as 48,000 large dams worldwide, half of which are in China. (The World Commission on Dams, 2012) Every dam uses a specific design according to the circumstances of the site. The design also represents an optimum balance of economic and technical considerations at the time of the construction. (Novak P. , Moffat, Nalluri, & Narayanan, 2001) Dams are significantly different from other major civil engineering structures in many important regards:
• Every dam is unique in its foundation geology, material characteristics, catchment flood hydrology according to the site

67
• Dams are required to function at or close to their design load for extended periods
• Dams do not have a structural lifespan although they may have a notional life for accounting purposes
• The greater part of dams are of earthfill, made from a range of natural soils • Dam engineering requires expertise from a range of disciplines; from
mechanics to hydrology There are many different types of dams, which can be classified in two broad groups:
1. Embankment dams are constructed of rockfill and/or earth fill. Upstream and downstream face slopes are similar and of moderate angle, which gives the dam a wide section and high construction volume relative to its height.
2. Concrete dams are as constructed of mass concrete. Face slopes are not similar; slope is generally steep downstream and nearly vertical upstream, and have relatively slender profiles.
Embankment dams are dominant for technical and economic reasons and make up about 85-‐90% of all built dams. The embankment dam has evolved in such a way that it has proven to be adaptable to a wide range of site circumstances. Concrete dams, in contrast, are more demanding in terms of foundation conditions. (Novak P. , Moffat, Nalluri, & Narayanan, 2001)
6.1.1 Embankment Dam Form and Characteristics Embankment dams can be defined as dams constructed from natural materials excavated from the close area surrounding the dam. They can be classified as either rockfill or earth fill dams. The division between both types is not absolute.
1. Rockfill embankments contain an element of compacted earth fill or a thin concrete membrane. An embankment is correctly classified as ‘rockfill’ when over 50% of the material is rockfill, i.e. coarse-‐grained material with high friction. Rockfill embankments that have a thin membrane of asphaltic concrete upstream, reinforced concrete or other manufactured material is referred to as ‘decked rockfill dams’.

68
2. Earth fill embankments are correctly classified if compacted soils account for over 50% of the material. This type of embankment is primarily made of specific engineering soils compacted uniformly in relatively thin layers.
Embankment dams have many positive traits:
• Suitable for wide valleys and steep gorges • Adaptable to a variety of foundation conditions • Minimal transport/ import due to the use of natural materials • High flexibility • When designed properly, deformation possible without the risk of cracks or
fractures The disadvantages in comparison are minor, the most important including a greater probability of damage or destruction of the dam due to overtopping. Therefore adequate spillways and flood relief areas are necessary. (Novak P. , Moffat, Nalluri, & Narayanan, 2001)
6.1.2 Concrete Dam Form and Characteristics Concrete dams are generally suitable to valleys that are of both wide and narrow topography, provided that a competent rock foundation is given. When concrete dams were first constructed, they were made of rubble masonry (also known as random masonry). Due to economic reasons and the simpler construction for complex dams, mass concrete replaced masonry around 1900. Early mass concrete was often used in combination with stone displacers, until additives were found which reduced thermal problems and cracking around 1950. The positive attributes of concrete dams are that they are not sensitive to overtopping under extreme flood conditions (contrarily to embankment dams), they can accommodate a crest spillway if necessary over the entire length (as long as downstream erosion and undermining of the dam are controlled and if possible prevented), and they have a high ability to withstand seismic disturbance without catastrophic collapses. (Novak P. , Moffat, Nalluri, & Narayanan, 2001) The disadvantages of concrete dams are:
• The relative high demand on foundation conditions (preferably stable rock) • Processes materials of high quality and quantity are required • Mass concrete construction is slow, labor intensive and discontinuous

69
• Completed unit costs for mass concrete are higher than those of embankment fills
The most common modern concrete dams are:
1. Gravity dams 2. Arch dams 3. Buttress dams
Gravity dams have a triangular cross-‐section. This provides maximum stability without overstressing the dam or its foundation. Gravity dams rely on their own mass for stability in retaining accumulated water. The forces from the water pressure are transferred by the dam weight into the soil. It is important that tensile stresses do not occur in the foundation. This means that even with a full reservoir and existing water pressure in the area of the wall base, the pressure is transmitted into the soil. This is crucial in order to protect the seal between dam and rock from damage. Due to the high pressure on the ground caused by gravity dams, they can only be constructed on solid rock. The advantages of gravity dams in comparison to earth and rockfill dams are that they can be flooded under extreme flood events without endangering the construction, discharge can be carried over the dam (this means no costs for separate spillways) and discharge pipes can easily be constructed through the dam wall. Usually, gravity dams are formed from single concrete blocks that can transmit the acting forces independently in the bedrock. By anchoring the dam, horizontal forces can be dissipated by the concrete blocks.

70
The profile of a gravity dam must demonstrate an acceptable margin of safety with regard to rotation and overturning, translation and sliding and overstress and material failure-‐ all of which control the overall structural stability of the dam. Arch dams, unlike gravity dams that have vertical slices that transfer forces into the ground, act as horizontal segments that transfer compressive forces into the valley sides (“arch effect”). They are only suitable for narrow and stable valley slopes. Arch dams are generally very thin, curved structures containing reinforcement through either steel rods or pre-‐stressed steel cables. The volume of concrete required is much less than for gravity dams, yet the bedrock on which the foundation is constructed must be more competent in resisting and sustaining high loads. Arch dams are usually built in narrow, deep gorges in mountain regions where the access and availability of construction materials is often a problem. Arch dams can be divided into two groups: constant radius and variable radius dams. Constant radius arch dams commonly face upstream and have a constant radius, while variable radius dams have both downstream and upstream curves (extrados and intrados curves) of systematically decreasing radius. Some dams are also doubly curved (in both horizontal and vertical planes), and then called dome dams. When dams are constructed with two or several contiguous arches or planes they can be described as multiple arch dams. Buttress dams are dams with a solid, watertight upstream side, which are supported at intervals by buttresses on the downstream side. The dam wall may be flat or curved. Buttress dams are generally constructed of reinforced concrete and are very heavy, pushing the dam into the ground. When water pushes against the dam, the inflexible buttresses prevent the dam from falling over. These dams were originally built to retain water for irrigation or mining in areas of scarce or expensive resources but cheap labor. These dams are often used in wide valleys where solid rock is rare. However as designs become more sophisticated, the weaknesses of the dams have become more apparent.
6.1.3 Impacts of Dams The environmental, economic and other socio-‐political impacts and issues associated with dam construction must be fully acknowledged and addressed. Public and political discussions and the increase of consciousness with respect to these issues have led to a growing debate over reservoir projects.
71
The strong interest and increase of consciousness with respect to dam engineering led to growing debates about these projects, as well as to the founding of a 12-‐man “World Commission on Dams” (WCD) in 1998. This commission is charged with reviewing and reporting on the developing effectiveness of large dams internationally. It also addresses key policies and issues for the future of dams and their construction. Many issues related to the environmental and socio-‐political impact of dams are often discussed, including population displacement, the protection of cultural or environmental sites, consequences of sedimentation and the changing flood regime (Novak P. , Moffat, Nalluri, & Narayanan, 2001, pp. 9-‐10). When a dam is constructed, many damages are visible; others however, take place further downstream or after a certain time period. Dams block migratory fish species from the sites where they spawn and feed. To improve this situation, fish ladders have been built-‐ however these are not always effective or a suitable solution for some species. Dams disturb natural fluctuations in water flow. This can affect the deposit of nutrients as well as the lifecycle of species that depend on these fluxions for their survival. Dams change flows according to human demands (e.g. energy, irrigation), instead of how flows would change naturally. (WWF, 2012) Dams can also affect the morphology of the riverbed, floodplains downstream from the construction, as well as coastal deltas; thus often increasing the flood risk, lowering groundwater levels, causing an accumulation of toxic materials, hampering navigation as well as affecting ecosystems as a whole. However, dams are not always negative for species. Once established, dams can become important sites for wildlife such as birds. In order to cause as little damage as possible, it is important to correctly identify and analyze the site and type of dam. Dams also contribute both positive and negative aspects to human life. Dams can be essential in areas such as hydropower and fresh water provisioning. Changes in employment and production systems starting before the construction of the dam (e.g. expropriation of the land, employment of construction workers) as well as the transport of construction material can be very positive. However, people who live from agriculture and depend on the fertile areas, natural flooding, etc. do not always see them as a positive contribution to the area. (Anul, pp. 759-‐768)

72
6.2 Site assessment and selection of type of dam When deciding on a satisfactory site for a reservoir, certain functional and technical requirements must be fulfilled. Natural physical characteristics and the planned function of the dam are critical when looking at the suitability of a site. Both of which must be investigated closely through mapping, surveys, data collection, etc. Technical requirements are determined by hydrological and geological characteristics of catchment and site, which include the presence of a satisfactory site for a dam, availability of materials for construction and the integrity of the reservoir basin with respect to leakage. Once a site is taken into consideration for the construction of a dam, it is investigated extensively to ensure that the site can be developed on the desired scale and at an acceptable cost. The competence of the foundation is determined by its stability, load-‐carrying capacity, deformability and impermeability. Other considerations that are important when assessing a site include economic considerations (e.g. site preparation and construction material costs), environmental and socio-‐political considerations (Novak, Moffat, Nalluri, & Narayanan, 2001). The ideal dam type is determined by estimating the cost and construction program for all design solutions that are technically valid for the observed site. If various alternatives prove to be ideal, it is important to keep those options open in order to assess each with respect to necessary resources, cost and program until a solution is chosen. Socio-‐political and environmental considerations are often crucial points in the determination of the solution. For example, in a situation where site conditions in a steep-‐sided valley may favor an embankment dam, but a spillweir and channel of necessary size are too expensive, the economic balance may lead to the construction of a gravity dam with an overflow crest (Novak, Moffat, Nalluri, & Narayanan, 2001).
73
6.3 Dam Outlet Works Dam outlet works generally consist of spillways and bottom outlets. The spillway design depends primarily on the design flood, dam type and location as well as on the reservoir size and how it operates. The design of bottom outlet works depends on the purpose of the reservoir as well as the sediment inflow and deposition.
6.3.1 Spillways Spillways (also known as overflow channels) can be defined as safe passage ways for floods from the reservoir into the downstream river reach. They are located at the top of the reservoir pool and have two principal components: the controlling spill-‐weir and the spillway channel. The purpose of the spillway channel is to conduct the safe flow of floods downstream of the dam. It often incorporates a stilling basin or other energy dissipating devices. The capacity of a spillway must safely accommodate the maximum design flood. Spillways release floods so that the water does not overtop and damage or even destroy the dam. Water usually does not flow over spillways except during flood periods. Spillways can be classified in various ways: according to function as a main service, emergency or auxiliary spillways, according to its degree of control or according to hydraulic criteria. When looking at the mode of control, spillways can be organized into two groups: Controlled (gated) spillways have mechanical structures or gates to regulate the rate of the flow. The design allows for the usage of almost the full height of the dam for water storage year round. The gates must be operated manually, by remote control, or automatically. Uncontrolled spillways do not have gates. Instead, when the water rises above the crest of the spillway, it is released from the reservoir. The depth of water within the reservoir controls the rate of discharge. Most spillways are uncontrolled, meaning they function automatically as water levels rise. Spillways can also be classified according to hydraulic criteria.

74
• Overfall spillways are generally used in rigid dams and form a part of the main dam if enough length is available. The basic shape of the overfall spillway is derived from the lower envelope of the overall nappe flowing over a high vertical rectangular notch with an approach velocity and a fully aerated space between the nappe.
• Side-‐channel spillways are mainly used when it is not possible or advisable
to use a direct overfall spillway, e.g. with earth and rockfill dams. These are located just upstream and to the side of the dam. After flowing over a crest water enters a side channel that is nearly parallel to the crest. The water is then carried to the downstream side via a chute (in some cases tunnel).
• Chute spillways are a steep channel conveying the discharge from a low-‐
overfall, side-‐channel or special shape spillway over the valley side into the river downstream. The water is carried by an open channel over a short crest or similar structure which is generally at a 90° angle to the conveyance channel. The flow through the channel is supercritical.

75
• Shaft spillways (also called “morning glory”) consist of a funnel-‐shaped
spillway (usually circular), a vertical shaft, and a tunnel terminating in an outflow. The water, which flows over the spillway, is carried by a vertical or sloping tunnel into a horizontal tunnel at nearly stream bed level, before it is carried of the downstream side. The diversion tunnels constructed during dam construction can be used as the horizontal conduit in many cases.
• Siphon spillways are closed conduits in the form of an inverted U with an inlet, short upper leg, throat (the control section), lower leg and an outlet. They work on the principle of a siphon. A hood provided over a conventional spillway forms a conduit. With the rise in reservoir level, water starts flowing over the crest in an overfall spillway. The water however, entrains air and once the air in the crest area is removed, siphon action starts. Under this condition the discharge takes place at a much larger head. Thus the spillway has a larger discharging capacity. For very low flows a siphon spillway operates as a weir; as the flow increases, the upstream water level rises, the velocity in the siphon increases, and the flow in the lower leg begins to exhaust air from the top of the siphon until this primes and begins to flow full as a pipe.
6.3.2 Bottom outlets Bottom outlets are openings in the dam used to draw down the reservoir level. Depending on the type of control gates and the position of the outflow in relation to the tailwater, they operate either under pressure or free flowing over part of their length (Novak P. , Moffat, Nalluri, & Narayanan, 2001, pp. 216-‐218). The flow from the bottom outlets can be used as compensation flow for a river stretch downstream of the dam where the flow limit would otherwise be too low.
6.3.3 Cut-‐offs

76
Seepage under and around the flank of a dam must be controlled carefully. This is achieved by the construction of a cut-‐off below the structure, continued as necessary on either flank. Nowadays, embankment cut-‐offs are usually formed from wide trenches backfilled with rolled clay, often drilled or grouted to form a cut-‐off screen to greater depths.
6.4 Dam diversion works Weirs and barrages are relatively low-‐level dams constructed across a river to raise the river level sufficiently and to divert the flow in full or in part, into a supply canal or conduit for the purpose of irrigation, power generation, flood control, navigation, industrial uses, etc. These diversion structures usually provide a small storage capacity. Weirs can be constructed with or without gates. They are often used to divert floods to irrigated areas, to recharge groundwater or to measure flow. These are usually bulkier than barrages (usually controlled). Barrages include canal regulators, low-‐level sluices and fish ladders.
6.4.1 Fish passes Fish passes are structures that restore the passage of fish and other aquatic life. Many fish species migrate yearly as part of their basic behavior. Fish such as salmon and sturgeon often swim several thousands of kilometers when returning from the sea to their spawning grounds in rivers. Fish passes are of increasing importance for the restoration of free passage for fish and other aquatic species in rivers. These devices are often the only way to make it possible for aquatic fauna to pass obstacles that block their upstream journey. They have become key elements for the ecological improvement of running waters. Fish passes are necessary everywhere where, due to transverse structures (such as dams or weirs), the fish passage has been interrupted. In such devices, a fish is guided in its migration upstream to the main flow. Fish passage problems can occur at almost any site where the water level difference between upstream and downstream of the structure is greater than about half a meter. Typically these sites can be identified by fish leaping clear of the water in an attempt to ascend the structure. If the fish passage is adequate, fish usually do not leap. A fish pass can be designed to be technically suitable for fish to use; however if the fish cannot find the pass it will of course not be effective. According to the shape of the respective watercourse,

77
fish travel to the main flow, from one bank to the other. On a cross-‐river structure (e.g. a weir) fish will therefore always be found particularly there where the main flow is. Fish need sufficiently strong water currents (attraction flow) so that they can find the outlet of the fish ladder. The required flow rates are between 0.8 and 2.0 m / s. In areas with strong turbulence (e.g. stilling basin) cannot be oriented, because the goal-‐directed flow is missing. In principle the fish passes may be divided into 2 groups; in natural and technical designs. Naturally designed fish ladders adapt their design to a large extent by the natural conditions so that these should be built in natural hydraulic engineering and this way should be preferred. Some of the most efficient fish passes have been found to be man-‐made substitutes for river channels. These usually have a low gradient and extend from below the obstruction to a considerable distance upstream. These include rock ramps in various forms. Technical constructions are only acceptable if the boundary conditions for a natural construction are not an option. Therefore also by fish passes little turbulence should exist. The maximum flow velocity should not exceed 2 m / sec. The maximum water level difference should be less than 20 cm, so that the maximum water velocities can be maintained even in the narrow parts. The average velocity must, however, be significantly lower than 2 m/s in order that the small fish can climb. Forming of the calm zones (resting pools) is particularly important.
By means of a bypass channel an existing cross-‐structure (e.g. a weir) is bypassed. lt is of particularly advantage if no structural changes are made to existing systems and that can be integrating well into the landscape. In the sections with steep gradients, the permissible range of flow velocities (vm = 0.4 to 0.6 m / s) are observed only when stones as obstacles are installed.
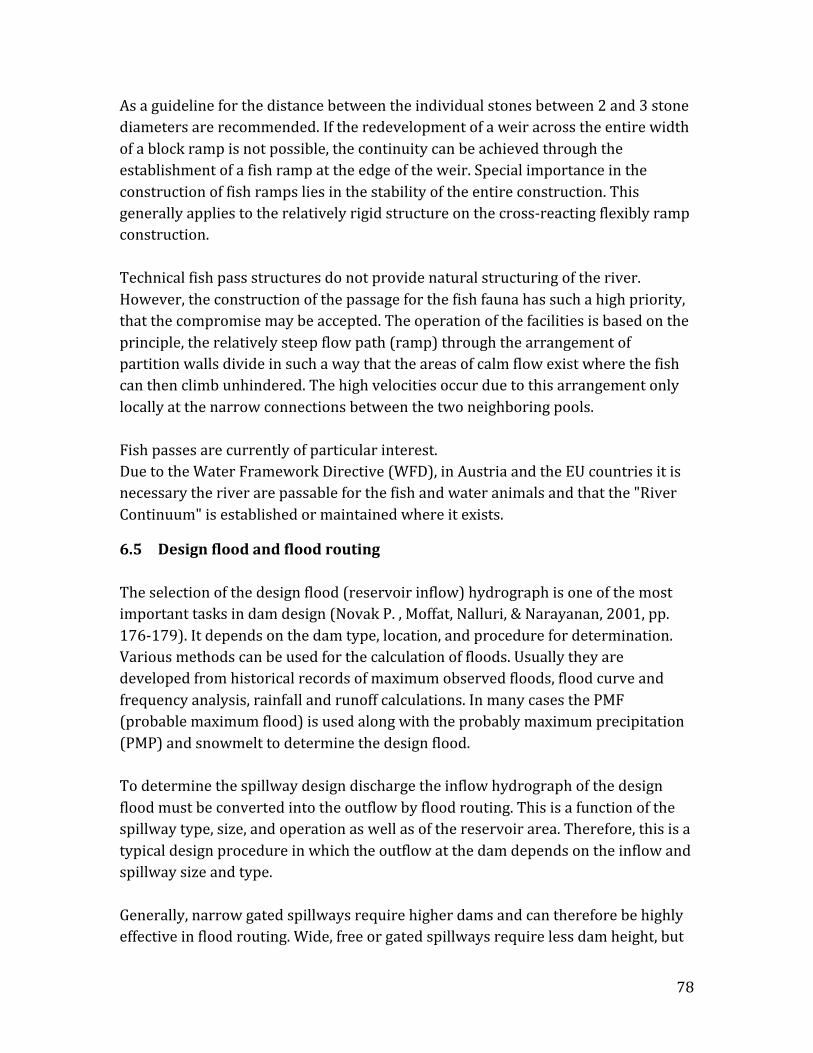
78
As a guideline for the distance between the individual stones between 2 and 3 stone diameters are recommended. If the redevelopment of a weir across the entire width of a block ramp is not possible, the continuity can be achieved through the establishment of a fish ramp at the edge of the weir. Special importance in the construction of fish ramps lies in the stability of the entire construction. This generally applies to the relatively rigid structure on the cross-‐reacting flexibly ramp construction. Technical fish pass structures do not provide natural structuring of the river. However, the construction of the passage for the fish fauna has such a high priority, that the compromise may be accepted. The operation of the facilities is based on the principle, the relatively steep flow path (ramp) through the arrangement of partition walls divide in such a way that the areas of calm flow exist where the fish can then climb unhindered. The high velocities occur due to this arrangement only locally at the narrow connections between the two neighboring pools. Fish passes are currently of particular interest. Due to the Water Framework Directive (WFD), in Austria and the EU countries it is necessary the river are passable for the fish and water animals and that the "River Continuum" is established or maintained where it exists.
6.5 Design flood and flood routing The selection of the design flood (reservoir inflow) hydrograph is one of the most important tasks in dam design (Novak P. , Moffat, Nalluri, & Narayanan, 2001, pp. 176-‐179). It depends on the dam type, location, and procedure for determination. Various methods can be used for the calculation of floods. Usually they are developed from historical records of maximum observed floods, flood curve and frequency analysis, rainfall and runoff calculations. In many cases the PMF (probable maximum flood) is used along with the probably maximum precipitation (PMP) and snowmelt to determine the design flood. To determine the spillway design discharge the inflow hydrograph of the design flood must be converted into the outflow by flood routing. This is a function of the spillway type, size, and operation as well as of the reservoir area. Therefore, this is a typical design procedure in which the outflow at the dam depends on the inflow and spillway size and type. Generally, narrow gated spillways require higher dams and can therefore be highly effective in flood routing. Wide, free or gated spillways require less dam height, but
79
are usually not very effective in regulating floods. As a result the required size of the spillway and its cost decreases with the increase of the dam height, in turn lowering the dam cost.
6.6 Energy dissipation Energy dissipation at dams and weirs is closely associated with spillway design, particularly with the specific discharge q, the difference between upstream and downstream water levels, and the downstream conditions. The magnitude of energy that must be dissipated at high dams with large spillway discharges is enormous. For example, the maximum energy to be dissipated at the Tarbela dam service and auxiliary spillways could be 40000MW, which is about 20 times the planned generating capacity at the site (Locher and Hsu, 1984). Energy dissipation at dams and weirs is closely associated with spillway design, particularly with the chosen specific discharge q, the difference between the upstream and downstream water levels (H.) and the downstream conditions. The passage of water from a reservoir into the downstream reach involves many hydraulic phenomena such as the transition into supercritical flow, supercritical non-‐aerated and aerated flow on the spillway, possibly flow through a free-‐falling jet, entry into the stilling basin with a transition from supercritical to subcritical flow, and echoes of macro-‐turbulence after the transition into the stream beyond the basin or plunge pool. Therefore, it is best to consider the energy dissipation process in five separate stages, some of which may be combined or absent (Novak and Cabelka, 1981). The following figure shows a sketch of the five phases of energy dissipation.
Figure 20: Sketch of the five phases of energy dissipation

80
1: on the spillway surface 2: in a free-‐falling jet 3: at impact into the downstream pool 4: in the stilling basin 5: at the outflow into the river Energy dissipation in modern spillway designs can often be achieved by using free-‐falling jets, either at the end of a “ski-‐jump” or downstream of a flip bucket. The ski-‐jump spillway was first developed by Coyne (1951) and further improved through model studies.
6.7 Dam Safety Reservoirs can be a potential hazard to all types of downstream areas. If a dam breaches, the damage can be catastrophic in both economic and ecologic sections. Catastrophic failure of dams can be caused by extreme flood events, as well as by long periods of increasing stress on the structure of the dam or its foundation. Dam surveillance programs and instrumentation are supposed to detect signs of distress. Instruments placed within or on a dam do not guarantee against serious incidents or failures when inserted alone. Instead, they bring attention to abnormalities in behavior, thus provide early warning signs of distress that may lead to serious problems or even to the failure of a dam.
6.7.1 Instrumentation When new dams are built, instrumentation data is interpreted in order to analyze if the correct design was used and to control the dam’s performance. In existing dams, instruments may be used to detect abnormal deviations in the behavior of the dam. As with any structure, it is important to select the suitable type of instrument according to the design and purpose of the dam. Instruments used to ensure safety of the dam might be classified according to the function of the installation (the following may overlap):
• Construction control • Post-‐construction performance • Service performance/ surveillance • Research/ development

81
When the primary purpose of the instrument is construction control or research purposes, absolute values and trends of parameters may be of equal importance. However, this is not the case when the primary function is to monitor long-‐term performance. Absolute values are then often considered of secondary importance to the early detection of changes (Novak P. , Moffat, Nalluri, & Narayanan, 2001, pp. 269-‐271). The most significant parameters in monitoring dam behavior are: 1. Seepage and leakage (quantity, nature, location and source) 2. Settlement and loss of freeboard in embankments 3. External or internal deformation 4. Porewater pressures and uplift Some of these parameters (seepage and external movement) are of high concern regardless of the type of dam. Others are only critical to specific dams, such as porewater pressure by embankment dams. The minimum amount of monitoring on all dams should be able to detect seepage flows and crest deformations. It is very important to observe the dam of seepage.
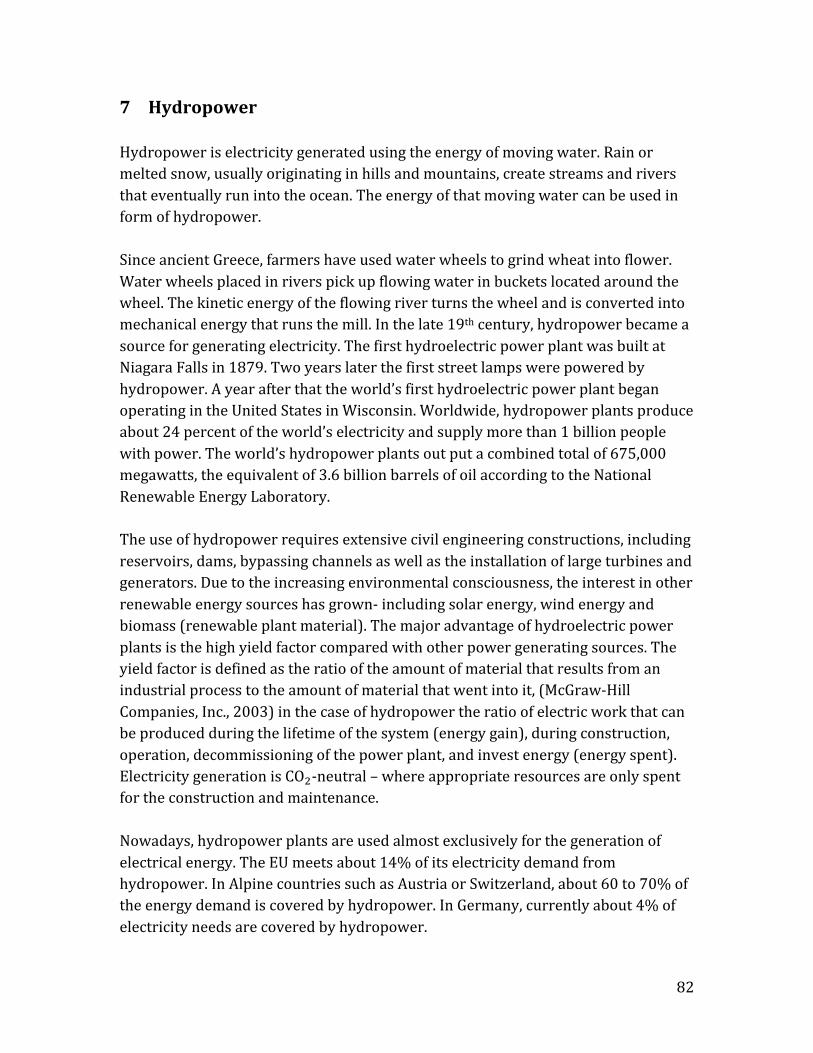
82
7 Hydropower Hydropower is electricity generated using the energy of moving water. Rain or melted snow, usually originating in hills and mountains, create streams and rivers that eventually run into the ocean. The energy of that moving water can be used in form of hydropower. Since ancient Greece, farmers have used water wheels to grind wheat into flower. Water wheels placed in rivers pick up flowing water in buckets located around the wheel. The kinetic energy of the flowing river turns the wheel and is converted into mechanical energy that runs the mill. In the late 19th century, hydropower became a source for generating electricity. The first hydroelectric power plant was built at Niagara Falls in 1879. Two years later the first street lamps were powered by hydropower. A year after that the world’s first hydroelectric power plant began operating in the United States in Wisconsin. Worldwide, hydropower plants produce about 24 percent of the world’s electricity and supply more than 1 billion people with power. The world’s hydropower plants out put a combined total of 675,000 megawatts, the equivalent of 3.6 billion barrels of oil according to the National Renewable Energy Laboratory. The use of hydropower requires extensive civil engineering constructions, including reservoirs, dams, bypassing channels as well as the installation of large turbines and generators. Due to the increasing environmental consciousness, the interest in other renewable energy sources has grown-‐ including solar energy, wind energy and biomass (renewable plant material). The major advantage of hydroelectric power plants is the high yield factor compared with other power generating sources. The yield factor is defined as the ratio of the amount of material that results from an industrial process to the amount of material that went into it, (McGraw-‐Hill Companies, Inc., 2003) in the case of hydropower the ratio of electric work that can be produced during the lifetime of the system (energy gain), during construction, operation, decommissioning of the power plant, and invest energy (energy spent). Electricity generation is CO!-‐neutral – where appropriate resources are only spent for the construction and maintenance. Nowadays, hydropower plants are used almost exclusively for the generation of electrical energy. The EU meets about 14% of its electricity demand from hydropower. In Alpine countries such as Austria or Switzerland, about 60 to 70% of the energy demand is covered by hydropower. In Germany, currently about 4% of electricity needs are covered by hydropower.
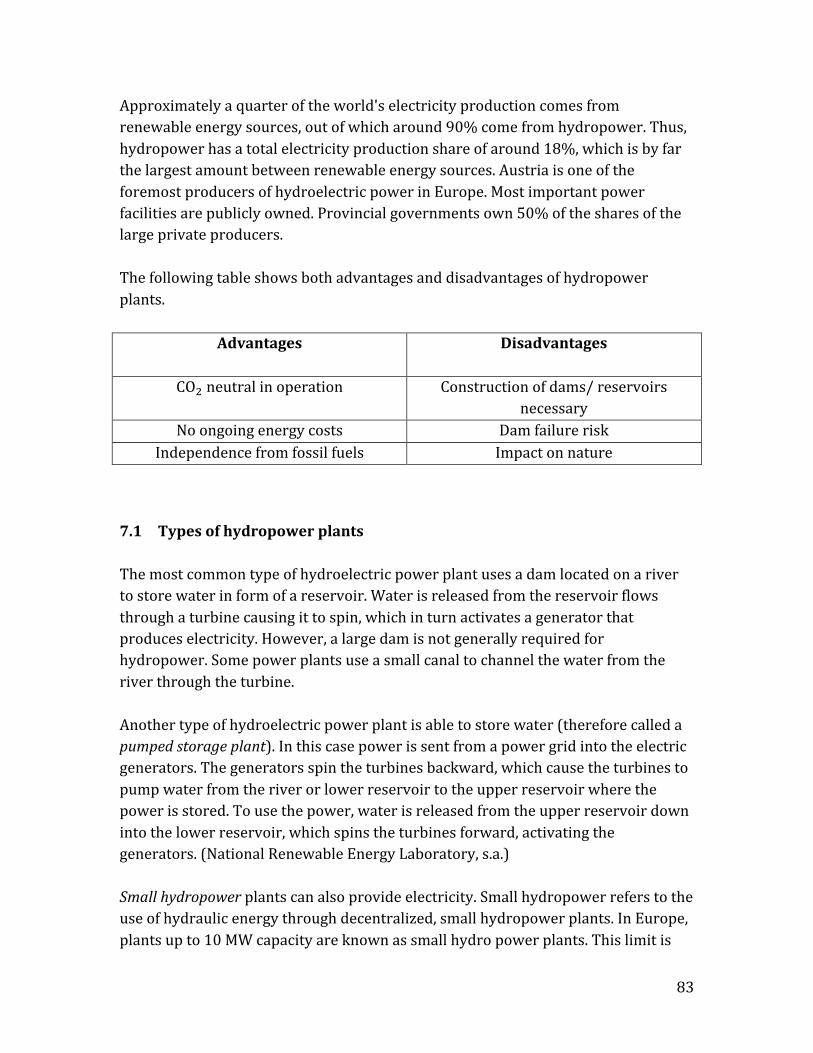
83
Approximately a quarter of the world's electricity production comes from renewable energy sources, out of which around 90% come from hydropower. Thus, hydropower has a total electricity production share of around 18%, which is by far the largest amount between renewable energy sources. Austria is one of the foremost producers of hydroelectric power in Europe. Most important power facilities are publicly owned. Provincial governments own 50% of the shares of the large private producers. The following table shows both advantages and disadvantages of hydropower plants.
Advantages Disadvantages
CO! neutral in operation Construction of dams/ reservoirs necessary
No ongoing energy costs Dam failure risk Independence from fossil fuels Impact on nature
7.1 Types of hydropower plants The most common type of hydroelectric power plant uses a dam located on a river to store water in form of a reservoir. Water is released from the reservoir flows through a turbine causing it to spin, which in turn activates a generator that produces electricity. However, a large dam is not generally required for hydropower. Some power plants use a small canal to channel the water from the river through the turbine. Another type of hydroelectric power plant is able to store water (therefore called a pumped storage plant). In this case power is sent from a power grid into the electric generators. The generators spin the turbines backward, which cause the turbines to pump water from the river or lower reservoir to the upper reservoir where the power is stored. To use the power, water is released from the upper reservoir down into the lower reservoir, which spins the turbines forward, activating the generators. (National Renewable Energy Laboratory, s.a.) Small hydropower plants can also provide electricity. Small hydropower refers to the use of hydraulic energy through decentralized, small hydropower plants. In Europe, plants up to 10 MW capacity are known as small hydro power plants. This limit is

84
arbitrary and is higher in some countries (e.g. China 30 MW). Small hydro power plants operate on the same principle as large plants. They differ mainly by the performance class. The use of small hydropower guarantees added value effects for the Austrian economy by creating and maintaining jobs during construction, expansion and revitalization of such facilities. In Austria there is a total of about 1900 small hydropower plants with an output of electrical energy of 4000 GW/h. Currently small hydropower covers about nine percent of Austria’s electricity demand and supplies around 1.6 million households with electrical energy. This quantity is equivalent to the electricity production of five to six power plants in the size of Freudenau-‐Danube-‐Vienna. Through the use of small hydropower around 4.1 million tones of CO! can be prevented which would result from electiricy production from fossil fuels
7.2 Components of a hydropower plant Hydropower plants harness water’s energy and use simple mechanics to convert energy into electricity. Hydropower plants are actually based on a rather simple concept-‐ water flowing through a dam turns a turbine, which turns a generator.
Figure 21: Inside a hydropower plant

85
The basic components of a conventional hydropower plant are:
• The dam: most hydropower plants rely on a dam that holds back water, creating a large reservoir. Often this reservoir is used as a recreational lake.
• Intake: gates on the dam open and gravity pulls the water through the
penstock, a pipeline that leads to the turbine. Water builds up pressure as it flows through this pipe.
• Turbine: the water strikes and turns the large blades of a turbine, which is
attached to a generator above it by way of a shaft. The most common type of turbine for hydropower plants is the Francis Turbine, which looks like a big disc with curved blades. A turbine can weigh as much as 172 tons and turn at a rate of 90 revolutions per minute (according to the Foundation for Water and Energy Education).
• Generators: as the turbine blades turn, so do a series of magnets inside the
generator. Giant magnets rotate past copper coils, producing alternating current by moving electrons.
• Transformer: the transformer inside the powerhouse takes the alternating
current and converts it to higher-‐voltage current.
• Power lines: out of every power plant come four wires-‐ the three phases of power being produced simultaneously plus a neutral or ground common to all three.
• Outflow: used water is carried through pipelines, called tailraces, and re-‐
enters the river downstream The water in the reservoir is considered stored energy. When the gates open, the water flowing through the penstock becomes kinetic energy because it’s in motion. The amount of electricity that is generated is determined by several factors. Two of those factors are the volume of water flow and the amount of hydraulic head. The head refers to the distance between the water surface and the turbines. As the head and flow increase, so does the electricity generated. The head is usually dependent on the amount of water in the reservoir.

86
Hydropower generator The generator is the heart of the hydroelectric power plant. Most hydropower plants have several of these generators that generate electricity. Each generator is made of certain basic parts: -‐shaft -‐excitor -‐rotor -‐stator As the turbine turns, the exciter sends an electrical current to the rotor. The rotor is a series of large electromagnets that spins inside a tightly wound coil of copper wire, called the stator. The magnetic field between the coil and the magnets creates an electric current.
7.2.1 Turbines Water turbines are divided according to their construction type, or after their functionality. Depending on the mode of operation they are divided into impulse turbines and reaction turbines.
Figure 22: Generator and turbine

87
Besides such division of turbines, in particular the available head and available discharge determine which turbine will be used. The most important representatives of reaction turbines are the Francis turbine and Kaplan turbine. The most commonly built impulse turbine is named after its inventor Pelton. Reaction turbines (Kaplan and Francis turbines) are closed systems that are positioned completely under water. The pressure difference between the top and bottom of the turbine impeller sets the turbine in a rotary motion. All reaction turbines are equipped with a draft tube. On the way towards the downstream water, through the draft tube, the flow energy is converted to the pressure energy and thus the total energy head increases. Without the draft tube, the energy of water flowing out of the turbines with high velocities would be lost for the power generation. Particular attention should be given to the elevation of the turbine blades. Positioned too high relative to the downstream water level causes a risk of cavitation, which in effect causes erosion of the turbine blades.
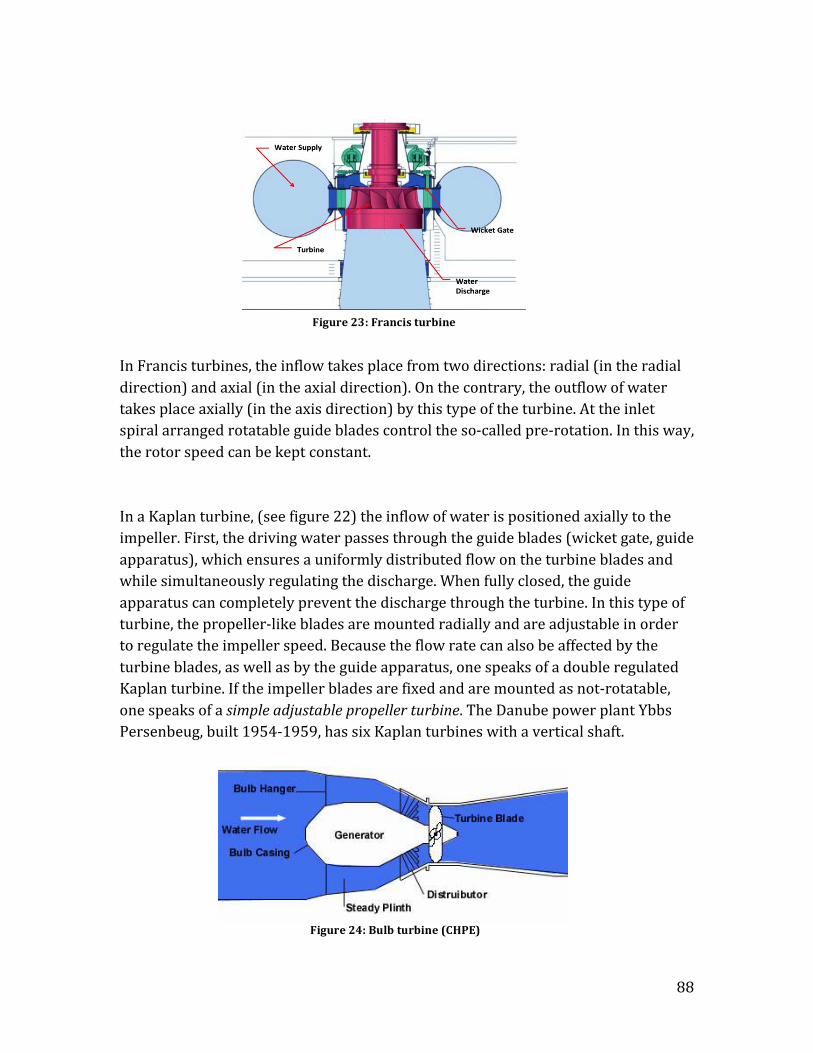
88
In Francis turbines, the inflow takes place from two directions: radial (in the radial direction) and axial (in the axial direction). On the contrary, the outflow of water takes place axially (in the axis direction) by this type of the turbine. At the inlet spiral arranged rotatable guide blades control the so-‐called pre-‐rotation. In this way, the rotor speed can be kept constant. In a Kaplan turbine, (see figure 22) the inflow of water is positioned axially to the impeller. First, the driving water passes through the guide blades (wicket gate, guide apparatus), which ensures a uniformly distributed flow on the turbine blades and while simultaneously regulating the discharge. When fully closed, the guide apparatus can completely prevent the discharge through the turbine. In this type of turbine, the propeller-‐like blades are mounted radially and are adjustable in order to regulate the impeller speed. Because the flow rate can also be affected by the turbine blades, as well as by the guide apparatus, one speaks of a double regulated Kaplan turbine. If the impeller blades are fixed and are mounted as not-‐rotatable, one speaks of a simple adjustable propeller turbine. The Danube power plant Ybbs Persenbeug, built 1954-‐1959, has six Kaplan turbines with a vertical shaft.
Figure 23: Francis turbine
Figure 24: Bulb turbine (CHPE)

89
In the 1990s an additional machine was added by the full operation of the power plant, this time as a bulb turbine. Bulb turbines are a further development of the Kaplan turbine. In this construction, the shaft is horizontal or installed slightly inclined horizontally. In this case, the generator is in waterproof housing (generator bulb), which is surrounded by flowing water. Due to the flow deflection minimization, the full-‐load efficiency of bulb turbines is higher than by conventional Kaplan turbines. These turbines are therefore generally designed for lower heads. Nevertheless, heads up to 25 m have been observed. An example of the bulb turbine is the hydroelectric power plant Freudenau in Vienna. It was built between 1992 and 1996, has six machine sets, each with 28.7 MW and has an impeller diameter of 7.50 meters. The S-‐turbine is a further development of the bulb turbine. The name of this turbine comes from the s-‐shaped curved draft tube. As a result from the standardized design, it is economically interesting for smaller power plants. Its configuration makes it possible for the turbine shaft to pass through the pipe to the downstream side of the power plant. The generator is thus easily accessible (not underwater) in the machine hall. This arrangement is easy to maintain.
The Pelton wheel is a type of impulse turbine. It extracts energy from the impulse of moving water. The water flows along the tangent to the path of the runner. Nozzles direct forceful streams of water against a series of spoon-‐shaped buckets mounted around the edge of a wheel. As water flows into the bucket, the direction of the water velocity changes to follow the contour of the bucket. When the water-‐jet contacts the bucket, the water exerts pressure on the bucket and the water is decelerated as it does a "U-‐turn" and flows out the other side of the bucket at low velocity. Pelton's paddle geometry was designed so that when the rim runs at half the speed of the water jet, the water leaves the wheel with very little speed, extracting almost all of its energy, thus allowing for a very efficient turbine. The
Figure 25: Pelton wheel (HK RE Net 2010)

90
Pelton wheel is an impulse turbine that is among the most efficient types of water turbines. Pelton turbines are designed for fall heights up to 2000 m (high altitude) and capacities up to 300 MW.
7.3 Hydroelectric power
7.3.1 Energy determination
P = M! ∙ω [Nm/s] or
P = η ∙ ρ ∙ Q ∙ g ∙ H! [W] η ... overall efficiency of the hydroelectric power plant [0.8 to 0.9] ρ ... density of water [kg/m³] g ... acceleration of gravity [m/s²] Q ... discharge [m³/s] Hn ... net head [m] P ... power [kw] The available energy of the water flow ρ ∙ Q with the potential H ∙ g is converted into a turbine rotational power. The power P of a turbine corresponds to the turning moment M! multiplied by the angular velocity ω of the rotating turbine. This results in an estimate of the recoverable power P and its not pure dimensional relationship. In modern power plants the turbine efficiency factor η inclusive the losses between the turbine inlet and outlet is about 0.8 to 0.9. The relative discharge is the ratio of actual discharge and the design discharge Qa. The design discharge is the maximum amount of water that can be discharged through the turbines of a hydroelectric plant. That also means that this amount of water is the maximum that can be used to generate electrical power. If the available discharge is greater, the excess water is discharged over the weir. Due to natural variations in the runoff in the river, related design flow of the turbine is, however, not continuously available. Hydroelectric power plants in central

91
European rivers reach or exceed the selected design discharge only for about 30 to 60 days per year.
7.3.2 Power production plan
To estimate the annual energy production, the mean discharge-‐duration curve of flow (flow duration curve Q) must be known (an exceeding duration curve describes how many days in a year is the given discharge been exceeded).
By calculating the power production, consideration of the net head is also necessary. The net head H duration curve is derived from the difference between the downstream water level and upstream water level duration curve. The multiplication of flow duration curve Q and the head duration curve H, provides continuous power duration curve P over a year. By integrating the power duration curve P; the annual work of the hydropower plant can be determined.

92
The demand for electricity is not constant throughout the day. Between 7am and 2pm and in the evening again the demand increases. The lowest demand is during the night. The comparison between winter and summer shows that results due to lower temperatures (electric heating) and shorter days (light), there is a
significantly higher demand for electricity in winter days. To cover the demand for electricity reliably at all times, the power production sector should be able to cover the base load as well as the peak demand. For the coverage of the peak demand gas-‐power plants, or (especially in Austria) pump storage power plants are used. The fastest adaptation to increased power demand is found in pumped storage power plants, which can change within seconds from pump to turbine operation.
Figure 26: Energy demand summer vs. winter
Figure 27: Power production according to power plant type (Austria, 2004)
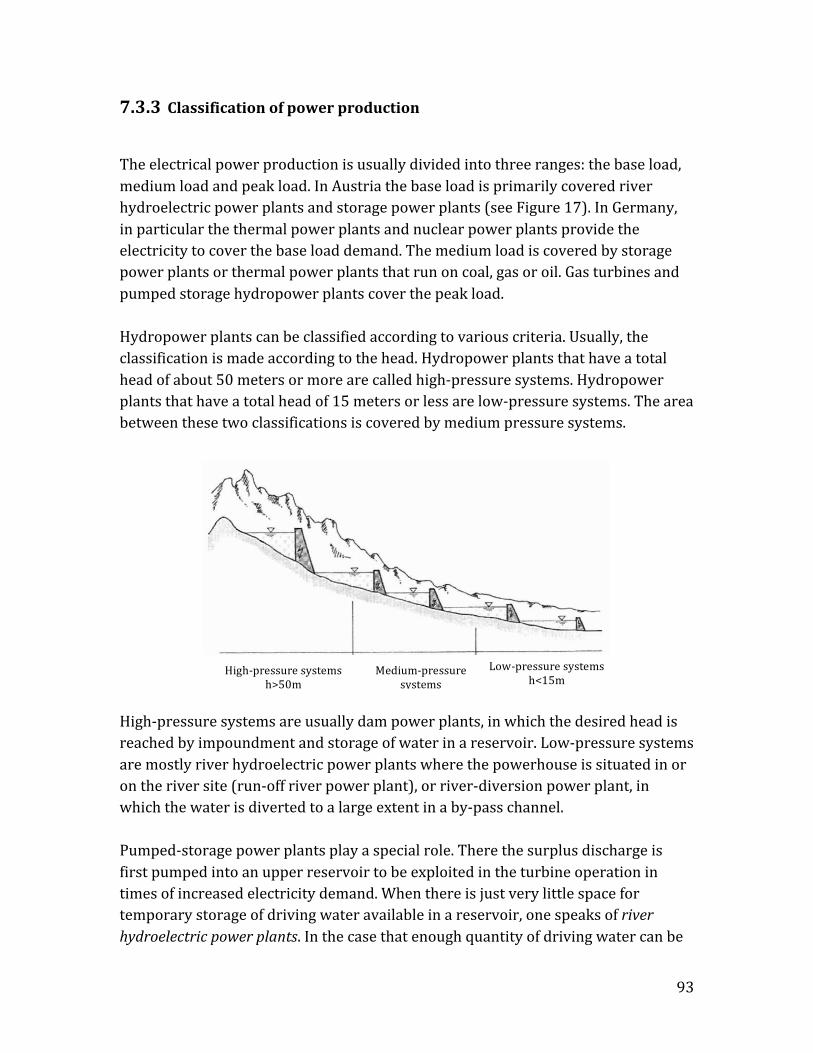
93
7.3.3 Classification of power production
The electrical power production is usually divided into three ranges: the base load, medium load and peak load. In Austria the base load is primarily covered river hydroelectric power plants and storage power plants (see Figure 17). In Germany, in particular the thermal power plants and nuclear power plants provide the electricity to cover the base load demand. The medium load is covered by storage power plants or thermal power plants that run on coal, gas or oil. Gas turbines and pumped storage hydropower plants cover the peak load. Hydropower plants can be classified according to various criteria. Usually, the classification is made according to the head. Hydropower plants that have a total head of about 50 meters or more are called high-‐pressure systems. Hydropower plants that have a total head of 15 meters or less are low-‐pressure systems. The area between these two classifications is covered by medium pressure systems.
High-‐pressure systems are usually dam power plants, in which the desired head is reached by impoundment and storage of water in a reservoir. Low-‐pressure systems are mostly river hydroelectric power plants where the powerhouse is situated in or on the river site (run-‐off river power plant), or river-‐diversion power plant, in which the water is diverted to a large extent in a by-‐pass channel. Pumped-‐storage power plants play a special role. There the surplus discharge is first pumped into an upper reservoir to be exploited in the turbine operation in times of increased electricity demand. When there is just very little space for temporary storage of driving water available in a reservoir, one speaks of river hydroelectric power plants. In the case that enough quantity of driving water can be
High-‐pressure systems h>50m
Medium-‐pressure systems
15m< h < 50m
Low-‐pressure systems h<15m

94
temporarily stored for times of increased electricity need, one speaks of storage power plants.
Low-‐pressure systems High-‐pressure systems River power plants Storage power plants
Run-‐off-‐river p.p. River-‐diversion p.p Dam power plant Pumped-‐storage p.p
Among the low-‐pressure systems are hydroelectric power plants with less than about 15 m head. They can be found in the middle reaches of rivers and therefore have significantly higher discharges than intermediate or high-‐pressure systems. River hydropower plants are built in combination with weirs. The weir dams the river to the desired elevation (upper water level, afflux), thereby causing the usable energy difference between upper and lower water level. The weir should be able to discharge flood waves as well.
Figure 28: Arrangement of a power plan in a river
The arrangement of a power plant differs in a river in terms of its position to the weir: (a) In the block design, power station and weir are arranged side by side as separate structures. Between the weir and power plant the separation pier provides a hydraulically favorable flow to the power plant. (b) two-‐sided power stations are sometimes built on border rivers between two countries. Each operator has its own power plant on its bank while the weir is a bilateral project.
95
(c) Island power plants are rare because their accessibility is difficult. The construction only makes sense if the geological conditions for the foundation of the power plant are unique. (d) In a Piers Power Plant, single weir piers are expanded to the power plant units, in each of which a set of machines (turbine and the generator) is housed. (e) By submerged power plants there are missing construction elements over the water level. They can therefore be easily integrated into the landscape and are completely flooded during periods of high water. When arranging a power plant within the bend of a river, it is important to ensure that the inlet of driving water to the turbines is kept free of sediment. Due to the spiral flow in the river bend, sediment is transported to the inner curve of the river. Therefore, the more ideal position of the plant is on the outside bend of the river. When a diversion power plant is constructed, weir and power plant are often separated; even kilometers apart. The power plant is built outside of the river site. This proved to be important in the past with regard to constructional facilities. An additional advantage is the high energy concentration that can be reached at certain topographic conditions through large heads. The problem here is the diversion of water from the river course. It is then supplied for many kilometers by only so-‐called residual water discharge. Hydropower plants with a head over 50 meters are classified as high-‐pressure systems. These are found mainly in the mountains. In high altitudes of a mountain region, dams collect the inflowing water and lead it through the headrace tunnel to a power plant in the valley. We previously mentioned another type of hydropower plant, namely the pumped-‐storage plant (see 7.1). In a conventional hydropower plant, the water from the reservoir flows through the plant, exits and is carried down stream. A pumped-‐storage plant has two reservoirs:
• Upper reservoir: like a conventional hydropower plant, a dam creates a reservoir. The water in this reservoir flows through the hydropower plant to create electricity. It is usually much higher than the lower reservoir and is located where possible on hilltops.
• Lower reservoir: water exiting the hydropower plant flows into a lower reservoir rather than re-‐entering the river and flowing downstream.

96
Using a reversible turbine the plant can pump water back to the upper reservoir. This is done in off-‐peak hours. The second reservoir refills the upper reservoir. By pumping water back up, the plant has more water to generate electricity during periods of peak consumption. With the help of pump storage power plants, excess electrical energy can be stored until power is needed in times of high demand again. Despite good efficiency factors of around 80%, pumped storage plants are only economical if cheaper electricity for pumping is available. This is often the case by the run-‐off river power plants, which produce electricity around the clock but in times of low electricity demand, achieve low prices. Today the pump storage power plants are mainly used for power frequency regulation in the European electricity grid. This task is becoming increasingly important by the rapid expansion of wind power plants and wind farms, because the electricity produced by them is very irregular.
97
8 Scale Models This chapter introduces the possibilities and limitations of modeling techniques as well as the predictive capabilities of hydraulic models. Ideally, the models should serve as an accurate basis for decisions about the use of different model techniques for various hydraulic engineering problems. Hydraulic engineering facilities and measures are usually expensive structures. Planning errors often lead to costly repairs or even catastrophes involving property damage or even fatalities. For that reason, hydraulic requirements on planned structure devices should be defined and tested prior to the planning phase.
Scale modeling techniques Computational techniques Hydraulic scale model (hydraulic model) Mathematical models
(physical model) Numerical models Computation models
Generally, the verification of these requirements is possible by means of scale models and by the application of computational techniques. Although many engineers use the terms mathematical, numerical and computational model as synonyms, there is a clear distinction between them. A mathematical model is a set of algebraic equations based on the physics of the prototype flow, representing the flow in nature. A numerical model is an approximation of the mathematical model in the form of a computable set of parameters describing the flow at a set of discrete points. The computational model is the implementation of a general numerical model for a specific situation. There are many computational systems available and the user has to choose carefully among them; this choice requires, or at least is supported by, the understanding of basic mathematical model. Computational models are often cheaper than the equivalent physical scale models. However, the computational models can only be applied where the physics of the problem is completely known and where sufficient topographical and other relevant data are available. Furthermore, their accuracy may be limited (sometimes severely) by the schematization and discretization procedure and lack of calibration.
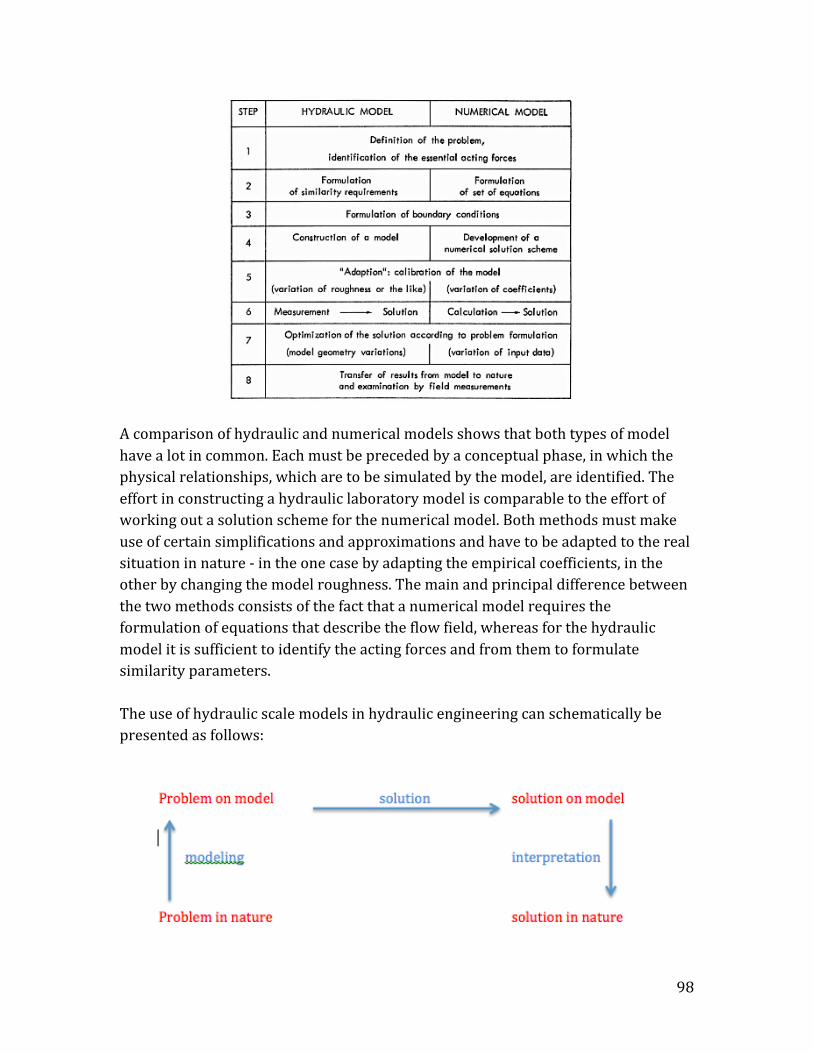
98
A comparison of hydraulic and numerical models shows that both types of model have a lot in common. Each must be preceded by a conceptual phase, in which the physical relationships, which are to be simulated by the model, are identified. The effort in constructing a hydraulic laboratory model is comparable to the effort of working out a solution scheme for the numerical model. Both methods must make use of certain simplifications and approximations and have to be adapted to the real situation in nature -‐ in the one case by adapting the empirical coefficients, in the other by changing the model roughness. The main and principal difference between the two methods consists of the fact that a numerical model requires the formulation of equations that describe the flow field, whereas for the hydraulic model it is sufficient to identify the acting forces and from them to formulate similarity parameters. The use of hydraulic scale models in hydraulic engineering can schematically be presented as follows:
99
Modeling: existing hydraulic problem in nature are reproduced in a reasonable way in the model. The solution of the problem in the model is not yet the solution of the problem in the nature. In the third step, the model solution has to be interpreted correctly. The more reliable the model is, the easier the interpretation is. To get a reliable model, two additional steps are needed: Calibration – adjusting the model to the data from the nature. The model then forms a specific situation from nature. Calibration alone is not sufficient to guarantee reliability of the model. Verification – use another known situation from the nature, without further modifying of the model itself. In a „good model“, the same situation should occur as in the nature. It must be emphasized that the model studies do not substitute the measurements in nature (which are often very expensive). In fact, the model studies need such data. Type of model Hydraulic model Numerical model River and tidal models with fixed bed River and tidal models with movable bed River and tidal models for transport processes Lake and reservoir models Harbor and control models
Local problems, complex geometry Bed load transport, erosion and deposition problems Near-‐field problems Detailed questions, fundamental experiments Mainly used
Large scale problems, simple geometry Suspended load transport (bed load transport for very simple geometry) Far-‐field problems Mainly used Wave pattern for simple geometry
Many problem–solution methods in the domain of hydraulic engineering were once almost exclusively predictable through physical models. Nowadays they are faster and easier to solve with the application of numerical models. However, a great field has remained where physical models are still irreplaceable. Corresponding areas of application of hydraulic and numerical models (simplified) are indicated in the table. Of course, it is often desired that both methods (hydraulic scale model and

100
numerical model) are parallel carried out, and that they are complementary to each other. Type of model Hydraulic model Numerical model Models of hydraulic structures: • Discharge
characteristics • Energy dissipation • Erosion • Flow forces • Vibrations • Cavitation Pipe flow models Groundwater models
Complex geometry Complex geometry Necessary Complex geometry Necessary Necessary Local problems, complex geometry (sediment transport Detailed questions
Simple geometry Simple geometry Simple geometry Mainly used Mainly used
The most important role in the decision making process is played by the limiting factors of each type of model. The limitations given in the following table show that the limiting factors inherent to hydraulic and numerical models are of entirely different nature in these two cases. Hydraulic models are limited on the one hand by model size, by the discharge and the energy head of the flow, i.e. by laboratory space and pumping capacity. The other principal limitation is given by the similarity laws, which must be followed in the hydraulic model. The essential limitation for the application of the hydraulic model experiment is the fact that only a limited number of processes can be down scaled. This limitation does not exist in numerical models. Here the limitations are given by storage capacity and computational speed, which in future can certainly be considerably increased. The decisive limitation is here the fact that for the majority of flow processes of interest in hydraulic engineering no closed system of equations can be formulated. Hydraulic model Numerical model
Principal limitations Model size (laboratory) Discharge (pumping capacity) Energy head (pumping capacity) Model laws
Storage capacity Computational speed Incomplete set of equations Turbulence hypothesis

101
Practical limitations Minimum model scale (surface tension, viscosity, roughness) Model size (upper limitation) Measuring methods and data collection Availability of boundary-‐ and initial conditions
In simplified set of equations: - -‐ accuracy of assumed relationships - -‐ availability of coefficients
space and time resolution (lower limitation) Numerical stability and convergence of the solution scheme Availability of boundary-‐ and initial conditions
A number of practical limitations also exist (see table above). Due to the fact that hydraulic models are usually tested in a laboratory with the same fluid as in nature, i.e. water, certain requirements result in the minimum model scale due to the model laws. With these requirements and with the maximum feasible model size, one obtains limits for the extent of an area that can be modeled correctly in a hydraulic laboratory. As an indication, the maximum area for scale models can be taken to be of the order of about 10 km in nature, for vertically distorted models about 100 km. On the other hand, numerical models experience limitations due to the simplifications in the equations and due to the availability of empirical coefficients. Another practical limitation is given by the resolution of the model, which is determined by the choice of the grid size for the solution scheme. This means that the numerical model is limited in space towards the lower end of the scale whereas the hydraulic model is limited towards the upper end (maximum extension). Therefore, numerical models are usually more suitable for the simulation of large-‐scale flow processes, whereas the hydraulic model is more suitable for investigations of local flow configurations. If one is faced with the decision to solve a problem either by means of a hydraulic model or with the help of a numerical model, a variety of aspects as criteria in the decision process must be considered. The consideration of principal limitations may exclude the one or the other type of model for certain problems beforehand. Furthermore, it is of great importance to decide which degree of accuracy or resolution is required from the model. Another essential question is of the simplicity and economics of the models, i.e. time and cost considerations. The greater flexibility of numerical models is often compensated by the more convincing intuitive power of the hydraulic model. For the credibility of a model it is important to know on the one hand, which experiences are already available with similar types
102
of models, and on the other hand to know the extent of possible feedback between nature and model. It is of crucial importance to know how well and reliably a model can be verified by means of prototype data. Of decisive importance is finally the expected prognostic capability of the model. All these criteria must be considered anew for every new application; no readymade generally applicable recipes can be offered for the decision process. A scale model in hydraulic engineering uses the method of direct (physical) simulation of (hydraulic) phenomena, (usually) in the same medium as in the prototype. Models are designed and operated according to 'scaling laws’ (conditions that must be satisfied to achieve the desired similarity between model and prototype). The ratio of a variable in prototype to the corresponding variable in the model is the scale factor (scale). The whole process of physical modeling is based on the theory of similarity. The scale number (scale) of one parameter is defined as the ratio between prototype (nature) and model value of this parameter. 𝜙! =
!! !!
According to the three base units for length, time and mass, three „similarities" between model and nature can be distinguished:
- Geometric similarity is similarity in form. All lengths of a model can be transferred with the same scale numbers (transfer factor) in the lengths of the nature. -‐ Similar geometry of model and nature. 𝐿! = 𝐿!/𝐿!
- Kinematic similarity denotes similarity of motion. All velocity vectors and time intervals from the model, each of them with the same scale number are transferred in nature -‐ similar to flow pattern in model and nature. 𝑇! = 𝑇!/𝑇!
- Dynamic similarity denotes similarity of forces. All forces are transferred with the same scale number from a model in the nature, i.e. similar forces in model and nature. 𝐹! = 𝐹!/𝐹!
The following forces related to the mass unit are important for river engineering problems: Inertial force 𝑣!/𝐿 Pressure force 𝑝/𝜌𝐿 Friction force 𝑣 /𝐿 Gravitational force g Capillary force 𝜎/𝜌𝐿!
103
Out of these, four independent force ratios can be formed: Inertial force / pressure force = 𝜌/𝑣! = 𝐸𝑢 (Euler number) Inertial force / friction force = 𝑣𝐿/𝑣 = 𝑅𝑒 (Reynolds number) Inertial force / gravity force = 𝑣!/𝑔𝐿 = 𝐹𝑟! (Froude number) Inertial force / capillary force = 𝜌𝑣!𝐿/𝜎 =𝑊𝑒 (Weber number) In flows in which the friction forces are of importance, in addition to the geometric similarity, the Reynolds number Re for model and nature must be kept equal. In addition to the geometric similarity, the Reynolds model law should be followed. Accordingly, in a downscaled model the velocities are higher than in nature. This makes the practical use of such models impossible. In the field of gravity force, besides the geometrical similarity, the Froude number in the model and in nature must also be kept equal.
𝐹𝑟! = 𝑣!𝑔!𝐿!
= 1
Under the assumption that the gravity constant g has the same value in the model and in nature: 𝑣! = (𝑔!𝐿!)!/! = 𝐿!
!/! Similarity conditions by channel flow By free surface flows in open channels the influence of gravity is decisive and the Reynolds influence should be eliminated. By all free surface flows, the Froude similarity law should be followed. It means that by water models the Reynolds number on the model is always smaller than that in the nature:
𝑣! = 𝐿!!/! → 𝑅𝑒! = 𝐿!
!/!
This shows that the viscous forces in the reduced model have a relatively greater importance than in the nature. But, if the flow conditions in nature and in the model are both in hydraulically rough zone, this remains without consequences.
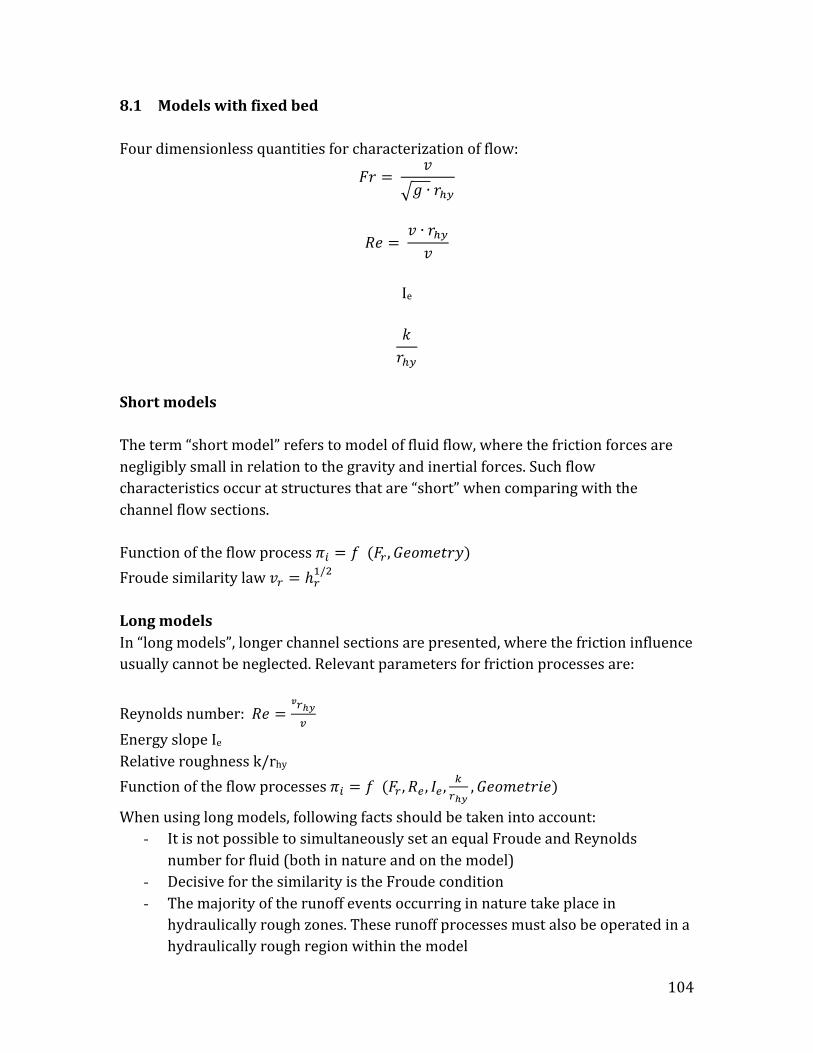
104
8.1 Models with fixed bed Four dimensionless quantities for characterization of flow:
𝐹𝑟 = 𝑣
𝑔 ∙ 𝑟!!
𝑅𝑒 = 𝑣 ∙ 𝑟!!𝑣
Ie 𝑘𝑟!!
Short models The term “short model” refers to model of fluid flow, where the friction forces are negligibly small in relation to the gravity and inertial forces. Such flow characteristics occur at structures that are “short” when comparing with the channel flow sections. Function of the flow process 𝜋! = 𝑓 (𝐹! ,𝐺𝑒𝑜𝑚𝑒𝑡𝑟𝑦) Froude similarity law 𝑣! = ℎ!
!/! Long models In “long models”, longer channel sections are presented, where the friction influence usually cannot be neglected. Relevant parameters for friction processes are:
Reynolds number: 𝑅𝑒 = ! ! !!
!
Energy slope Ie Relative roughness k/rhy Function of the flow processes 𝜋! = 𝑓 (𝐹! ,𝑅! , 𝐼! ,
!!!!
,𝐺𝑒𝑜𝑚𝑒𝑡𝑟𝑖𝑒)
When using long models, following facts should be taken into account: - It is not possible to simultaneously set an equal Froude and Reynolds
number for fluid (both in nature and on the model) - Decisive for the similarity is the Froude condition - The majority of the runoff events occurring in nature take place in
hydraulically rough zones. These runoff processes must also be operated in a hydraulically rough region within the model

105
- By vertical distortion of the model (increasing the flow velocity and thus the Reynolds number), the model discharge will be shifted into the hydraulically rough flow region.
8.2 Models with moveable bed The discharge in open channel (in general: non-‐uniform and unsteady) is described by the following function:
𝜋! = 𝑓 (𝐹! ,𝐹!∗,𝑅! ,𝑑ℎ ,∆,𝐺𝑒𝑜𝑚𝑒𝑡𝑟𝑖𝑒)
As a basic law, here also the Froude similarity law applies: 𝑣! = ℎ!
!/! Similarity conditions In addition to already explained similarity conditions for the models with fixed bed which rely alone on the simulated flow and primarily follow the Froude model law, at models with movable bed additional similarities that affect the bed material and the behavior of the bed are needed: The begin of the sediment transport is specified by the relationship between Fr* and Re * (Shield’s parameters) in nature and on the model. In general, for models with movable bed following similarity criteria are needed:
• Froude similarity criteria, although a few tolerances are acceptable, if some of scale effects can be reduced.
• Similarity of the sediment transport begins i.e. begin of the sediment transport on the model must take place at the same discharge as in the nature.
• Similarity of the sediment transport, i.e. for each discharge it must be a constant relationship between sediment transport on the model and in the nature.
• Similarity of the water levels and/or energy gradient lines. In grain mixtures the grain size distribution curves in nature and on the model should be similar. In nature cohesion loose material should not be reduced on the model under 0.1 -‐ 0.2 mm, otherwise cohesion occurs on the model. Bed forms should be similar between model and nature.
106
Short models are models of runoff processes in which friction processes and therefore the water levels slopes play no significant role. These models are therefore independent of the relative roughness. The following similarity criteria should be applied:
• Froude similarity • Similarity of begin sediment transport (motion) • Similarity of sediment transport
Long models treat the runoff processes, which are determined essentially by friction processes and friction losses. The water surface slope must be similar in nature and on the model. In addition to Fr * and Re * relative roughness d / h is also a parameter.

107
9 Bibliography Blöch, H. (2009). The Water Framework Directive: an Overview. European Commission. Borja, Á. (2005). European Water Framework Directive: A challenge for nearshore, coastal and continental shelf research. Continental Shelf Research , 25 (14), 1768-‐1783. Civil Engineering Formulas. (2004). Hydraulics and Waterworks Formulas. McGraw-‐Hill. Engineers Without Borders-‐Duke. (2011, March 29). wiki.duke.edu. Retrieved August 1, 2012, from https://wiki.duke.edu/download/attachments/19471352/Channel+Design.pdf?version=1&modificationDate=1265562741000 Environment Agency. (2010, January 22). Fluvial Geomorphology. Retrieved August 4, 2012, from Environment Agency: http://evidence.environment-‐agency.gov.uk/FCERM/en/FluvialDesignGuide/Chapter3.aspx EU Commission. (2012, February 23). Environment. Retrieved July 29, 2012, from Water Framework Directive: http://ec.europa.eu/environment/water/water-‐framework/info/intro_en.htm Fetter, C. (2001). Applied Hydrogeology (4th Edition ed.). New Jersey: Prentice Hall. Gore, J. A., & Petts, G. E. (1989). Alternatives in Regulated River Management. Boca Raton, Florida, USA: CRC Press, Inc. Green, D. W., & Perry, R. H. (2007). Perry's Chemical Engineers' Handbook (Vol. 8). New York: McGraw-‐Hill. Han, D. (2009). Concise Hydraulics. Denmark: Ventus Publishing ApS. Han, D. (2010). Concise Hydrology. Frederiksberk, Denmark: Ventus Publishing ApS. ICOLD. (1996). Vibration of Hydraulic Equiptment for Dams. International Commission on Large Dams. Paris: Bulletin 102.

108
ICPDR. (2011). Internation Commission for the Protection of the Danube River. Retrieved July 29, 2012, from River Basin Management: http://www.icpdr.org/main/activities-‐projects/river-‐basin-‐management Jacobson, B. R., Johnson, H. E., Reuter, J. M., & Panfil Wright, M. (2003). Physical Aquatic Habitat Assessment Data, Ozark Plateaus, Missouri and Arkansas. U.S. Geological Survey Data. Leb, C. (2006, August). Compliance, enforcement and dispute settlement under the EU Water Framework Directive. Retrieved July 29, 2012, from IUCN Water Programme: http://cmsdata.iucn.org/downloads/eu_wfd.pdf Matsuda, I. (2004). River Morphology and Channel Processes. Encyclopedia of Life Support Systems . Mays. Lary W. (2005) Water Resources Engineering. John Wiley & Sons NASA. (2008, July 11). Conservation of Momentum. Retrieved August 1, 2012, from NASA: http://www.grc.nasa.gov/WWW/k-‐12/airplane/conmo.html Novak, P., Moffat, A., Nalluri, C., & Narayanan, R. (2001). Hydraulic Structures (Vol. 3). London: Spon Press. PipeFlow. (2012). Pipe Flow Software. Retrieved July 30, 2012, from Pipe Roughness: http://www.pipeflow.com/pipe-‐pressure-‐drop-‐calculations/pipe-‐roughness Ritter, M. E. (2009, October 1). The Physical Environment: an Introduction to Physical Geography. Retrieved August 5, 2012, from http://www4.uwsp.edu/geo/faculty/ritter/geog101/textbook/fluvial_systems/channel_types.html Shiklomanov, I. (1993). World fresh water resources. In P. H. Gleick, Water in Crisis: A Guide to the World's Fresh Water Resources. New York: Oxford University Press. Sterner, R. W. (2011). The Conservation of Mass. Nature Education Knowledge , 2 (1), 11. Strobl, T. (2006). Wasserbau. Berlin: Springer Verlag. The World Commission on Dams. (2012). Retrieved August 10, 2012, from http://www.dams.org/ .

109
University of Waikato. (2009, June 5). The Global Water Cycle. Retrieved August 5, 2012, from Science Learning Hub: http://www.sciencelearn.org.nz/Contexts/H2O-‐On-‐the-‐Go/ Vischer, D., & Hager, W. H. (1998). Dam Hydraulics. Chichester, England: John Wiley & Sons Ltd. Waterwise. (2008). Water Wise. Retrieved July 29, 2012, from Water Resources: http://www.waterwise.ie/Default.aspx?StructureID_str=11 Weight, W., & Sonderegger, J. (2001). Manual of Applied Field Hydrology. New York: McGraw Hill Publishing Co. WWF. (2012). Dam facts and figures. Retrieved from WWF Global: http://wwf.panda.org/what_we_do/footprint/water/dams_initiative/