Luxury Goods Worldwide Market Study: Spring 2010 Update · Bain Luxury Market Update (April...
15
Luxury Goods Worldwide Market Study: Spring 2010 Update April 16, 2010
Transcript of Luxury Goods Worldwide Market Study: Spring 2010 Update · Bain Luxury Market Update (April...

Luxury Goods Worldwide Market Study: Spring 2010 Update
April 16, 2010

Bain Luxury Market Update (April 16, 2010)
• 2009 was the worst year ever for the luxury market with a -8% decrease
• Results began to improve only at the end of the year, after 3 negative quarters
- Holiday season better than expected- Inventory reduction: end of de-stocking
• The crisis is structurally changing the market- Market is concentrating: larger brands gaining market share- New wave of M&A and IPO operations - No compromise on quality and top-of-mind brands
• Bain forecasts +4% for 2010 (current exchange rates)- Growth spread across all geographies except Japan- Asia and especially China driving growth - All categories recovering after a terrible 2009- Retail becoming more and more important over wholesale- Online channel speeding up its growth
“Tell me the fairytale about the
economy”

2009: Luxury market saw severe shrinking
0
40
80
120
160
€200B
1995
77
1996
84
1997
93
1998
97
1999
109
2000
129
2001
134
2002
133
2003
129
2004
136
2005
147
2006
160
2007
170
2008
166153
Worldwide Luxury Goods Market trend (1995-2009)
2009
CAGR 95-0011%
CAGR 00-041,4%
11% 10% 4% 12% 18% 0% -3%
CAGR:5%
5% 8%
-2%
8%
BOOM (DEMOCRATIZATION)
CONSOLIDATION EXPANSION CRISIS
6%4% -8%
CAGR 04-078%
CAGR 07-09-5%

America and Europe hit hardest, Japan continues its unrelenting decrease
2008
32%
39%
12%
5%
13%
€166B
2009
29%
38%
12%
6%
15%
€153B
Worldwide Luxury Goods Market by Area
-16%
-8,5%
-10%
+10%
-8%
YoY ‘09E vs ‘08
+1%
Americas
Europe
Japan
Asia-Pacific
Rest of World

2008
4%
21%
22%
23%
28%
€166B
2009
4%
19%
24%
24%
27%
€153B
Hard luxury deeply impacted by consumer spending reduction and channel de-stocking
Worldwide Luxury Market by Category
-4,5%
-10,5%
-1,5%
-17%
Accessories
Hard Luxury
Apparel
Perfume and Cosmetics
Art de la table-9%
-8%
YoY ‘09E vs ‘08
Tenth circle: Ladies Shoes

# Brands
30%
50%
18%
220
Luxury Goods Market2009
35%
20%
10%
35%
€153B2%
Crisis is confirming that big is better!
Average brand size
€1,4 B
€0,25 B
€0,8 B
Winners (>+5%)
Neutral (-5/+5%)
Stressed (-15/-5%)
Losers (<-15%)
“I just wanted to say I’ve always been a big fan”
Worldwide luxury market by growth rate ranges
€3,5B

Holiday season showed first signals of recovery
Consumption performance Main Trends (Industry Quotes)
Holiday dollar
-13,0%
-10,0% -10,0%
0,0%
0,0%-3,4% -2,3% -2,6% 0,0%-3,4% -2,3% -2,6%
Luxury Goods Market growth by quarter (2009, QoQ growth)
1Q 2Q 3Q 4QBuild-up of2009 growthBuild-up of2009 growth
“On Christmas Eve we went home with big smiles on our faces.”
“New York's Fifth Avenue, like much of the Northeast, was a wet, sloppy sea of shoppers dodging umbrellas and skipping over puddles to get into gift destinations. ”
“November and December were so strongthat I see them as a harbinger for 2010.”
“It was so busy on our shoe floor that we actually had to close it for awhile to reorganize the assortment. It was a good day, a strong day.”
-8,3%
“Was anyone working? Cyber Monday seen bigger than 2008.”

2010: results to date are very positive
Sell-out 1Q 2010 Sell-in FW 2010
“We are optimistic for FW, and have increased budgets accordingly. Our business is most buoyant in the top-end luxury.”
“We are predicting business will come back strong in the fall. We are seeing the return of our classic customer.”
“FW10 sell-in is around no more than +1% +2%compared to previous year.”
“She is out stimulating the economy –can I take a message?”
• Strong results in first monthsof 2010 for listed players (LVMH, Dior Couture, Tiffany)
• Luxury retail stores show impressive like-for-like growth (+15-20%)
• US department storespositive sell-out trends: +8%in January, +6% in February, +13% in March
• Inventory de-stocking is over

2010 will be the inflection point for the restart of growth
Bain Forecast at 04/16/10
0
50
100
150
€200B
2009
153
2010F
158
+4%
Source: Bain analysis
Main Assumptions
• First semester average market trend shows strong recovery: 5% - 10% across all regions
• Slower growth in second half of the year
By semester
By channel
• Retail L4L sees strong improvement, especially thanks to traffic increase (10% - 15%)
• New openings will remain cautious, mainly driven by expansion in Asiaand Latin America
• Wholesale regaining momentum after 2009; more controlled mark-down campaigns
ESTIMATES

The recovery will be spread across (almost) all geographies and categories
Geographic areas Product categories
Asia Pacific ex-China
China
Source: Bain analysis
Japan
Americas
Europe
RoW
+3% +4%
+4%
-3%
+10%
+15% +0%
+2% +0%
+4% +4%Total
Art de la table
+5%
+2%Perfume and cosmetics
Leather, Shoes &
Accessories
+4%Watches and Jewelry
Apparel
Other
Total
ESTIMATES

Drivers for 2010 recovery have a twofold root
Hard roots Soft roots
• Macroeconomic indicators recovering worldwide, even if at different speeds
- GDP projections for 2010: +4,3%
- Growth driven by China +10%
• Strong urbanization and infrastructure investments in Asia, especially in China
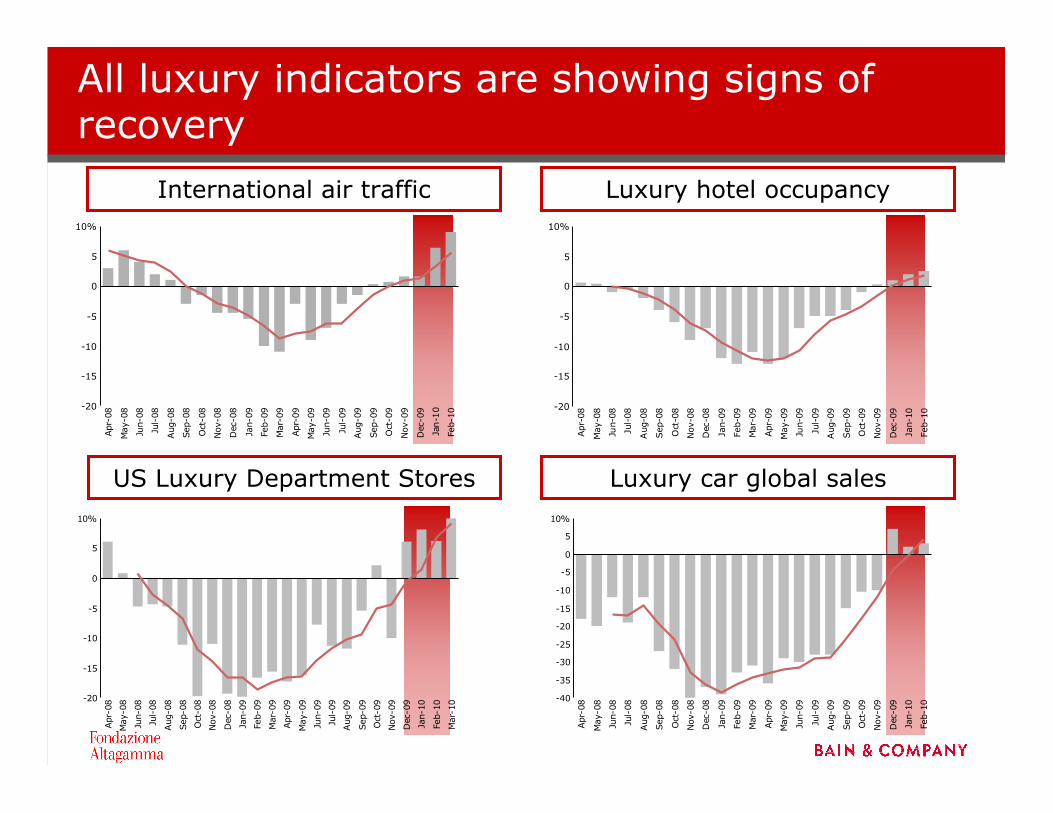
• International passenger traffic increasing by 4.5% in 2010, after a -4.2% in 2009
• Political stability in US enhancing consumer confidence
• Slight decrease of unemploymentrate
• Consumer attitude improving: Confidence Index expected to increase in 2010
• Recovery in footfall and conversion rates
• Boom of e-commerce sales
• Chinese consumers continue to spend heavily in luxury
“I see your consumer confidence remains undeterred”
-20
-15
-10
-5
0
5
10%
Apr
-08
May
-08
Jun-
08
Jul-
08
Aug
-08
Sep
-08
Oct
-08
Nov
-08
Dec
-08
Jan-
09
Feb-
09
Mar
-09
Apr
-09
May
-09
Jun-
09
Jul-
09
Aug
-09
Sep
-09
Oct
-09
Nov
-09
Dec
-09
Jan-
10
Feb-
10
Mar
-10
-20
-15
-10
-5
0
5
10%
Apr
-08
May
-08
Jun-
08
Jul-
08
Aug
-08
Sep
-08
Oct
-08
Nov
-08
Dec
-08
Jan-
09
Feb-
09
Mar
-09
Apr
-09
May
-09
Jun-
09
Jul-
09
Aug
-09
Sep
-09
Oct
-09
Nov
-09
Dec
-09
Feb-
10
Jan-1
0 -20
-15
-10
-5
0
5
10%
Apr
-08
May
-08
Jun-
08
Jul-08
Aug
-08
Sep
-08
Oct
-08
Nov
-08
Dec
-08
Jan-
09
Feb-
09
Mar
-09
Apr
-09
May
-09
Jun-
09
Jul-09
Aug
-09
Sep
-09
Oct
-09
Nov
-09
Dec
-09
Jan-
10
Feb-
10
-40
-35
-30
-25
-20
-15
-10
-5
0
5
10%
Apr
-08
May
-08
Jun-
08
Jul-
08
Aug
-08
Sep
-08
Oct
-08
Nov
-08
Dec
-08
Jan-
09
Feb-
09
Mar
-09
Apr
-09
May
-09
Jun-
09
Jul-
09
Aug
-09
Sep
-09
Oct
-09
Nov
-09
Dec
-09
Jan-
10
Feb-
10
All luxury indicators are showing signs of recovery
International air traffic
US Luxury Department Stores
Luxury hotel occupancy
Luxury car global sales
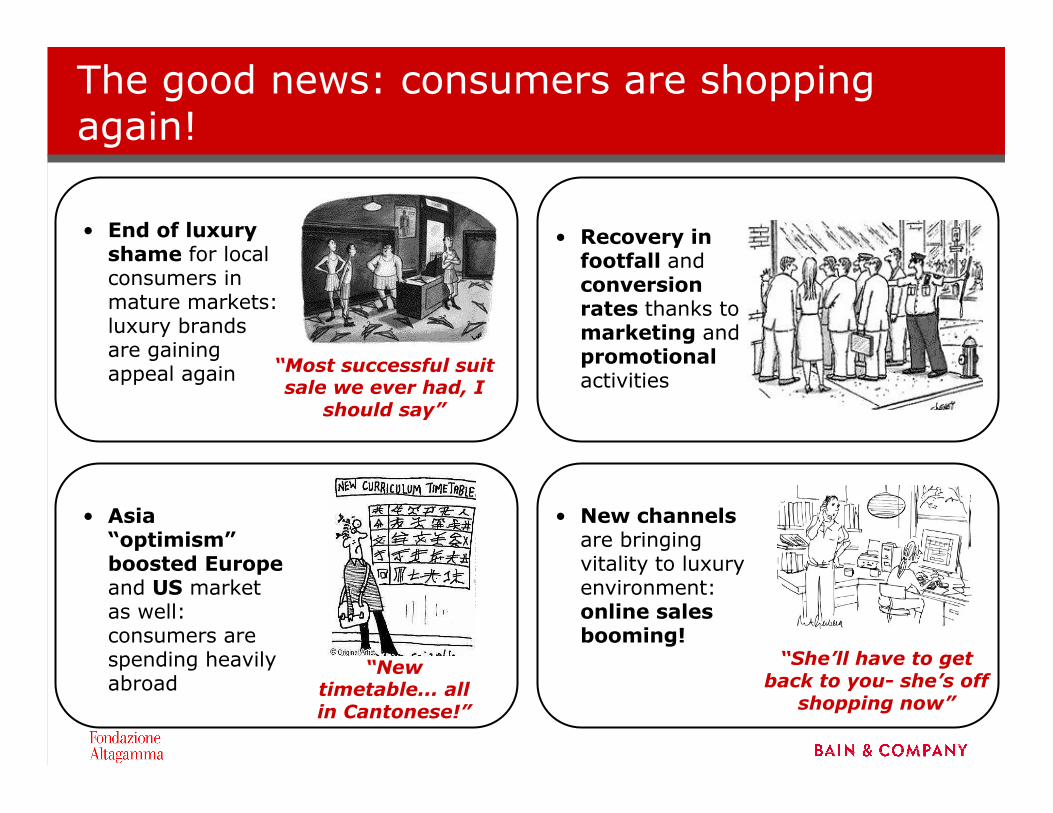
The good news: consumers are shopping again!
• Recovery in footfall andconversion rates thanks to marketing and promotional activities
• End of luxury shame for local consumers in mature markets: luxury brands are gaining appeal again
• Asia “optimism”boosted Europeand US market as well: consumers are spending heavily abroad
• New channels are bringing vitality to luxury environment:online sales booming!
“Most successful suit sale we ever had, I
should say”
“She’ll have to get back to you- she’s off
shopping now”
“New timetable... all in Cantonese!”

“Post-war” we are assisting to some structural changes in the market
Competition• Polarization and concentration...
-Mega-brands taking share-Failures and bankruptcies (but brands do not disappear)-Restart of M&A activity and IPOs-Acceleration in generational shifts and managerialization
• ...but consumers always want and need newness
Channels• Retail overperforming wholesale but not still at full potential• Concentration of wholesale distribution • Strategic rethinking of Department Stores formats• New opportunities from web and digitalization of experience
Consumer behaviour
• Increasing attention for value for money but new and diverse value drivers:
-Cheap & chic not still at full potential-Customization widely spread across categories and products-Customer experience and service-Innovation -Need to “justify” the premium price... brand is not enough
• Huge consumer diversity along all segmentation axes
Geography• Asia becoming the key market• Chinese consumers driving global market growth• Japan structurally deflating

Strategic pay-offs going forward!
Year of the Tiger
Breakfast @ Tiffany.com
Store sweet store!
Because they are worth it!
Winners take it all