
Luxembourg real estate investment funds November · PDF file4 executive summary The...
48
alfi survey Luxembourg real estate investment funds November 2014
Transcript of Luxembourg real estate investment funds November · PDF file4 executive summary The...
alfi survey
Luxembourg real estate investment fundsNovember 2014


3
Executive summary 4
Introduction 61. CSSF Data on Real Estate Investment Funds in Luxembourg 62. Survey Coverage 73. Luxembourg Real Estate Funds - the Framework 7
3.1 Direct REIFs vs Funds of REIFs 73.2 Regulatory Framework: Regulated vs Unregulated Structures 73.3 Legal Structures 8
4. Scope and Methodology 94.1 Scope 94.2 Methodology 9
Part I - Direct Real Estate Funds & Real Estate SICARs 101. Introduction 102. Initiator Origins 113. Legal Structure and Regime 114. Fund Structure 135. Investment Style 146. Liquidity 157. Term 168. Geographical focus of fund investments 179. Target Sectors 1810. Net Asset Value (NAV) distribution 1911. Gross Asset Value (GAV) distribution 2012. Target Gearing of Funds 2113. Fees 2114. Number of Investors 2315. Type of Investors 2316. Investor Origins 2417. Accounting Standards 2518. Frequency of NAV Calculation 2719. Valuation Standards 2920. Stock Exchange Listing 2921. Currency 29
Part II - Funds of Real Estate Investment Funds 301. Introduction 302. Initiator Origins 313. Legal Structure and Regime 324. Investment Style 325. Liquidity 336. Term 347. Geographical focus of fund investments 358. Target Sectors 369. Net Asset Value (NAV) 3710. 2015 Target NAV distribution 3711. Fees 3812. Type of Investors 3913. Accounting Standards 4014. Currency 4015. Frequency of NAV Calculation 4116. Stock Exchange Listing 41
Appendix 42Service Providers 42Glossary 45Acknowledgements 47
4
executive summary
The Association of the Luxembourg Fund Indus-try (ALFI) has published the 2014 Real Estate Investment Funds (REIF) survey, its ninth edition. The survey illustrates the evolution of the REIF market for direct real estate funds (Direct Funds) and Real Estate SICARs, but also for Funds of REIFs, as at 30 June of 2014.
2013 was another good year for Luxembourg
domiciled REIFs as the population continued to expand by 15 Direct Funds, (slightly down from 25 in 2012), but Q1 and Q2 of 2014 have brought increased activity, with 15 funds launched in the six month period, bringing the total of Direct Funds surveyed to 237 vehicles (including 17 Real Estate SICARs), an increase of 10% since the last ALFI REIF Survey and 276% since 2006, a com-pound annual growth rate (CAGR) of 21%.
Highlights Trends in direct REIFs
About 44% of the surveyed funds have been set up as a “Fonds Commun de Placement” (FCP) and this usually in combination with the SIF regime. The trend toward the FCP form has re-versed compared to earlier findings since SICAVs now account for the same proportion, and all new launches of Direct Funds continue to be Special-ised Investment Funds. In all, 83% of the total Direct Funds fall within the SIF regime.
In 2013 all new Direct Fund launches were triggered by initiators in Europe with Benelux, German and Swiss groups being the most active.
Investment strategies
The most common target sector is still ‘multi-sec-tor’ (57%) with a preference for ‘office’ at 27% and for ‘residential’ at 21% in 2013. Early signs for 2014 is a preference for the ‘retail’ sector at 30% of the early launches in 2014.
A single country investment focus represents 41% of the geographic investment strategies (up from 35% and 27% in the preceding two years), which supports the trend toward simplification but also underlines the suitability of Luxembourg invest-ment vehicles for multi-national investment. 79% of the surveyed Direct Funds invest in Europe, whereas 8 funds invest in the Americas only and 11 in the Asia/Pacific region only.
Fund structures
Though umbrella funds remain popular due to various practical and cost considerations, the trend over the last few years has been towards simplification of structures and strategies; hence
66% of the Direct Funds have a single compart-ment structure. This is true for 71% of the Core funds, which represent both 47% of the 2013 fund launches and 47% of the total Direct Fund popula-tion. Opportunity (84%) and Core funds (65%) are mostly closed-ended, with a third of Core funds offering some form of liquidity to investors. In to-tal 70% of funds are closed-ended, reflecting the inherent illiquidity of real estate as an asset class and the difficulties of achieving investor liquidity on demand.
The trend towards simplification of funds has continued.
SIFs account for all of the Real Estate Funds launched in the last 30 months and is now firmly established as the favored regime for regulated Real Estate Funds in Luxembourg.
Fund sizes and gearing
Similar to the findings of the 2012 and 2013 ALFI Surveys, average fund sizes continue to decrease, with the most common NAV range dropping below EUR 100 million for the first time (also impacted by new launches). Funds have become smaller, which aligns with the more cautious capital raising forecasts of 2014 and preceding years. While target gearing is down in most of the ranges, the results are mixed, indi-cating some optimism in relation to the ability to borrow.
Fees
As in the previous surveys, the most commonly used basis for management fee calculation is GAV. 53% of these funds are charging between 0.51%-1.5%.
5
Investors
Investors are mainly European but a significant portion comes from the Americas, Asia and the Middle East, which confirms the global appeal of the SIF regime.
Luxembourg domiciled Direct Funds and Funds of REIFs are used mainly for small groups of insti-tutional investors, with 84% having less than 25 investors.
Only 2% reported having more than 100 investors. The Direct Funds are widely distributed (but with focus on specific geographical areas), with only 27% limited to a single country, and 24% being sold in more than six countries, confirming the attractiveness of Luxembourg REIFs to a global investor base.
Fund reporting
Funds reporting under IFRS have seemingly stabilized at 42% of the total, while the larger proportion (77%) of funds launched during 2013
and reporting under Lux GAAP is less prevalent (at 50%) in the early launches of 2014. Reporting preference is impacted by the investment strat-egy: Core funds (57% Lux-GAAP), Opportunity funds (72% Lux-GAAP), Value-Added funds (50% Lux GAAP).
53% of the funds reporting under IFRS make adjustments, whereas only 39% do so under Lux-GAAP. Funds of REIFs generally (79%) report under Lux-GAAP, a trend that has gained signifi-cant momentum over the past four years.
50% of the Direct Funds report a quarterly NAV, similar across all funds regardless of investment focus. Since 70% of Direct Funds are closed-end-ed, the reporting of a monthly NAV (13%) is mainly due to investors’ demand for performance measurement rather than unit redemption.
57% of the Direct Funds have an annual valuation with 8% requiring monthly valuations, a signifi-cant increase over recent years. Almost all of the funds use an independent appraiser, with RICS (68%) being the preferred standard.
This latest edition of the ALFI REIF survey confirms that Luxembourg remains the favored location to establish and maintain multi-national and multi-sectoral regulated real estate investment funds which continue to appeal to institutional investors and fund managers around the world.
6
introduction
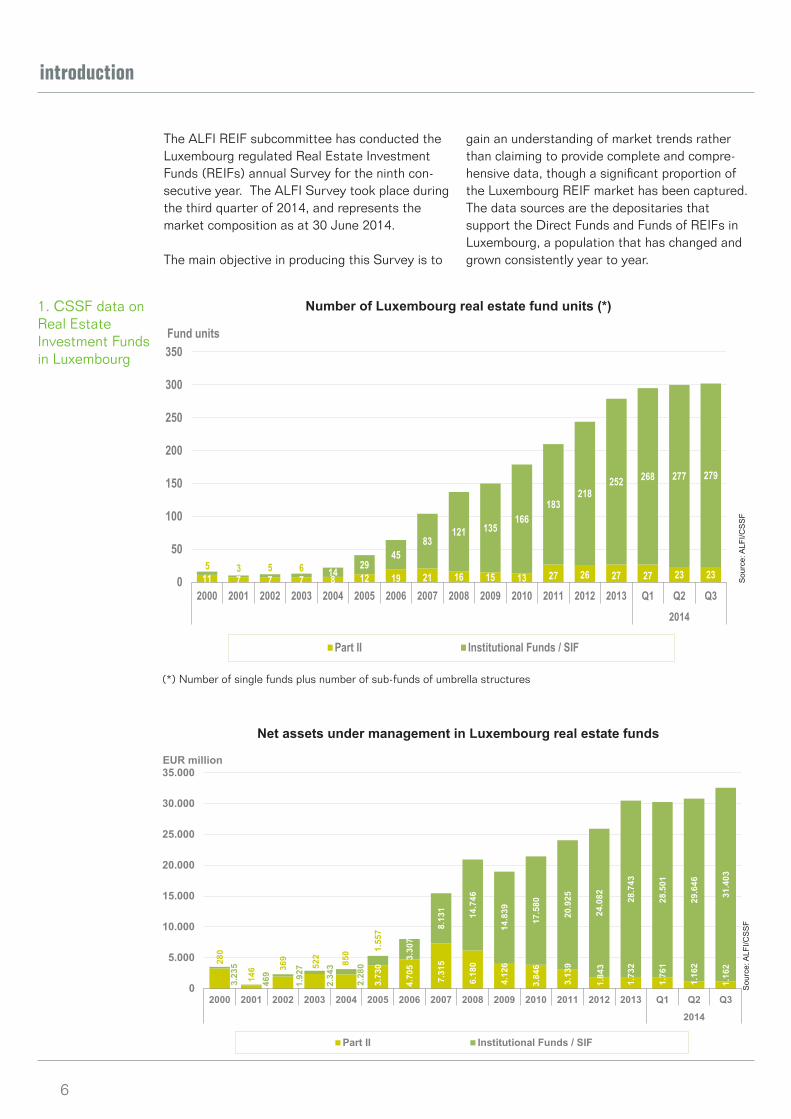
The ALFI REIF subcommittee has conducted the Luxembourg regulated Real Estate Investment Funds (REIFs) annual Survey for the ninth con-secutive year. The ALFI Survey took place during the third quarter of 2014, and represents the market composition as at 30 June 2014.
The main objective in producing this Survey is to
gain an understanding of market trends rather than claiming to provide complete and compre-hensive data, though a significant proportion of the Luxembourg REIF market has been captured.The data sources are the depositaries that support the Direct Funds and Funds of REIFs in Luxembourg, a population that has changed and grown consistently year to year.
1. CSSF data on Real Estate Investment Funds in Luxembourg
Number of Luxembourg real estate fund units (*)
(*) Number of single funds plus number of sub-funds of umbrella structures
Net assets under management in Luxembourg real estate fundsS
ourc
e: A
LFI/C
SS
FS
ourc
e: A
LFI/C
SS
F
11 7 7 7 8 12 19 21 16 15 13 27 26 27 27 23 235 3 5 6 14
2945
83121 135
166183
218252 268 277 279
0
50
100
150
200
250
300
350
2000 2001 2002 2003 2004 2005 2006 2007 2008 2009 2010 2011 2012 2013 Q1 Q2 Q3
2014
Part II Institutional Funds / SIF
Fund units
3.23
5
469
1.92
7
2.34
3
2.28
0
3.73
0
4.70
5
7.31
5
6.18
0
4.12
6
3.84
6
3.13
9
1.84
3
1.73
2
1.76
1
1.16
2
1.16
2280
146 36
9
522
850 1.
557
3.30
7
8.13
1
14.7
46
14.8
39
17.5
80
20.9
25
24.0
82 28.7
43
28.5
01
29.6
46
31.4
03
0
5.000
10.000
15.000
20.000
25.000
30.000
35.000
2000 2001 2002 2003 2004 2005 2006 2007 2008 2009 2010 2011 2012 2013 Q1 Q2 Q3
2014
Part II Institutional Funds / SIF
EUR million
7
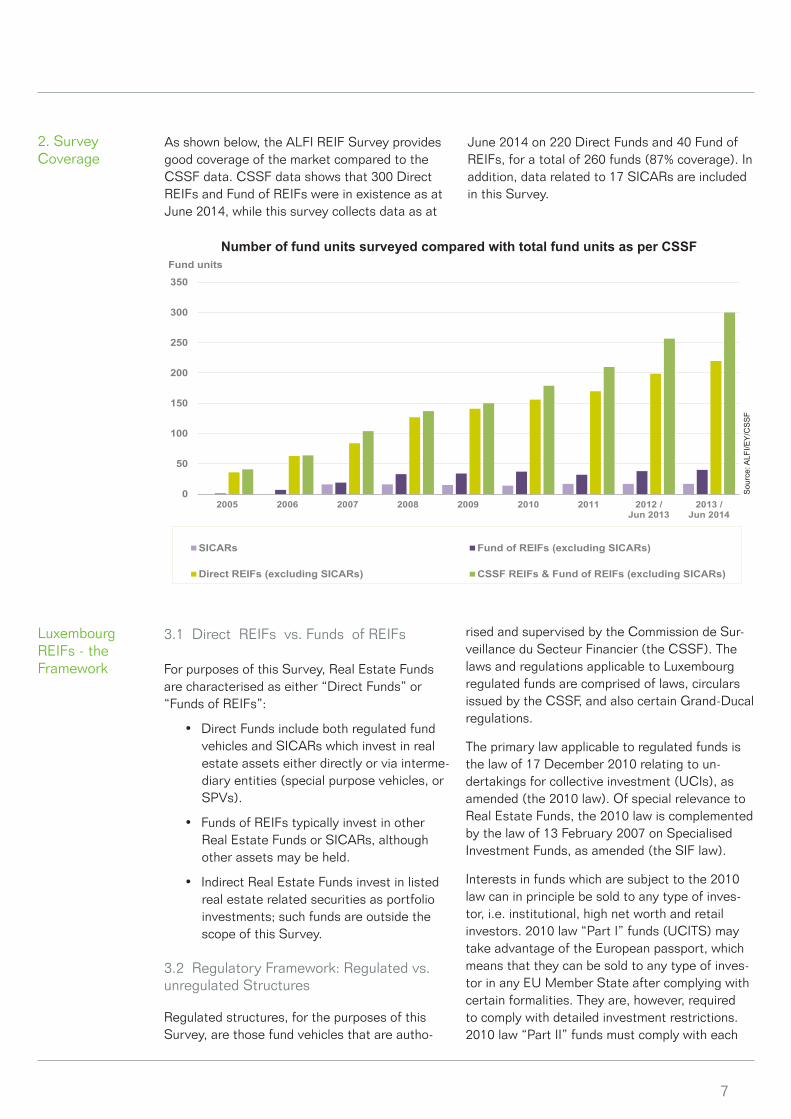
2. Survey Coverage
As shown below, the ALFI REIF Survey provides good coverage of the market compared to the CSSF data. CSSF data shows that 300 Direct REIFs and Fund of REIFs were in existence as at June 2014, while this survey collects data as at
June 2014 on 220 Direct Funds and 40 Fund of REIFs, for a total of 260 funds (87% coverage). In addition, data related to 17 SICARs are included in this Survey.
Number of fund units surveyed compared with total fund units as per CSSF
Luxembourg REIFs - the Framework
3.1 Direct REIFs vs. Funds of REIFs
For purposes of this Survey, Real Estate Funds are characterised as either “Direct Funds” or “Funds of REIFs”:
• Direct Funds include both regulated fund vehicles and SICARs which invest in real estate assets either directly or via interme-diary entities (special purpose vehicles, or SPVs).
• Funds of REIFs typically invest in other Real Estate Funds or SICARs, although other assets may be held.
• Indirect Real Estate Funds invest in listed real estate related securities as portfolio investments; such funds are outside the scope of this Survey.
3.2 Regulatory Framework: Regulated vs.unregulated Structures
Regulated structures, for the purposes of this Survey, are those fund vehicles that are autho-
rised and supervised by the Commission de Sur-veillance du Secteur Financier (the CSSF). The laws and regulations applicable to Luxembourg regulated funds are comprised of laws, circulars issued by the CSSF, and also certain Grand-Ducal regulations.
The primary law applicable to regulated funds is the law of 17 December 2010 relating to un-dertakings for collective investment (UCIs), as amended (the 2010 law). Of special relevance to Real Estate Funds, the 2010 law is complemented by the law of 13 February 2007 on Specialised Investment Funds, as amended (the SIF law).
Interests in funds which are subject to the 2010 law can in principle be sold to any type of inves-tor, i.e. institutional, high net worth and retail investors. 2010 law “Part I” funds (UCITS) may take advantage of the European passport, which means that they can be sold to any type of inves-tor in any EU Member State after complying with certain formalities. They are, however, required to comply with detailed investment restrictions. 2010 law “Part II” funds must comply with each
Sou
rce:
ALF
I/EY
/CS
SF
0
50
100
150
200
250
300
350
2005 2006 2007 2008 2009 2010 2011 2012 /Jun 2013
2013 /Jun 2014
SICARs Fund of REIFs (excluding SICARs)
Direct REIFs (excluding SICARs) CSSF REIFs & Fund of REIFs (excluding SICARs)
Fund units

8
relevant member state’s local distribution rules, and are required to comply with certain invest-ment restrictions (much less stringent than for “Part I” funds).
Interests in funds which are subject to the SIF law may only be sold to “well-informed investors”. In addition to the usual market of institutional and professional investors, this opens SIFs to high net worth individuals who meet the requirements of the SIF law. SIFs are not subject to general investment restrictions but must ensure adequate risk diversification and disclosure; exceptions are subject to review by the CSSF on a case-by-case basis.
Another useful Luxembourg vehicle is the SICAR, which is not classified as a fund. The “Société d’Investissement en Capital à Risque” is gov-erned by the law of 15 June 2004, as amended. It is an investment vehicle tailored to qualified investors investing in venture capital and private equity. The SICAR can take various legal forms (such as the S.C.S., S.A., S.à r.l., S.C.A. or other legal structures) and, while regulated, is not sub-ject to diversification requirements.
Unregulated vehicles are typically set up as com-panies under the law of 10 August 1915 on com-mercial companies, as amended. They often take the form of private limited companies (S.à r.l.) or partnerships limited by shares (S.C.A.). When companies have as their main purpose the holding and financing of participations in other companies (which in their turn may own real estate) such companies are often referred to as “SOPARFI’s”.
SOPARFIs do not enjoy a special legal or tax re-gime, but like any other fully taxable Luxembourg companies, they benefit from the participation ex-emption regime on qualifying participations. While unregulated vehicles operate in a manner similar to regulated funds, unregulated vehicles offer greater flexibility, for example in terms of choice of service providers, and lower set-up and oper-ating costs (as opposed to investment vehicles subject to regulatory oversight and restrictions). Regulated vehicles benefit, among others, from favorable tax status and a high level of investor protection. Unregulated vehicles tend to have a small group of investors and a simple capital structure. Notwithstanding the foregoing, unregu-lated vehicles may have a higher total Net Asset Value than regulated funds with more investors.
This survey is limited to Direct Funds and Funds of REIFs which are regulated by the “product” laws in Luxembourg. It does not take into account real estate investment structures which are not regulated by the “product” laws but which may, nevertheless, be “Alternative Investment Funds” as defined by the Directive 2011/61/EU on alter-native investment fund managers (AIFMD).
3.3 Legal Structures
Real Estate Funds governed by the 2010 law or the SIF law may be set up either in corporate form (“SICAV” or “SICAF”), in contractual form (“FCP”) or as partnerships (“SCS” or “SCSp”). A key determining factor in the selection of one of these structures is the tax regime applicable to investors; FCPs and partnerships are tax trans-parent whereas SICAVs and SICAFs are taxable, with certain exceptions.
Regulated funds governed by the 2010 law or the SIF law as well as the SICAR law may adopt an umbrella structure with multiple sub-funds where, for instance, sub-funds have a different invest-ment policy or are restricted to certain types of investors. The umbrella fund is legally treated as a single entity; however, in principle, each sub-fund is responsible for its own assets and liabili-ties.
For the purpose of this Survey, reference to the number of fund “units” means the number of single funds plus the number of active sub-funds in umbrella structures.

9
4. Scope and Methodology
4.1 Scope
The ALFI Survey covers Direct Funds, Real Es-tate SICARs and Funds of REIFs to which ALFI members provide depositary services. It does not cover unregulated vehicles or AIFs which are not regulated under “product” laws in Luxem-bourg, nor does it cover the intermediary finan-cing vehicles set up for the acquisition of proper-ty or similar collective investment vehicles.
4.2 Methodology
The ALFI Survey is based on a comprehen-sive questionnaire which was sent to all ALFI members. The depositaries and administrators responding are those which service the vast majority of Direct Funds and Funds of REIFs in Luxembourg. The questionnaire, which focused on the status as at June 2014, included ques-tions relating to each fund’s:
• Geographical investment region
• Target segment of investment
• Net Asset Value (NAV), Gross Asset Value (GAV) and target gearing
• Investment style
• Legal regime and structure
• Investor types and origin
• Accounting standard (GAAP)
• Fees
• Distribution method
• Valuation methodology
• Initiator origin
• Service providers including depositary, central administration, audit, legal and tax
Where possible, Survey results are at times compared with those published in Luxembourg Real Estate Funds: A comprehensive survey by Ernst & Young, published in January 2006 and the ALFI REIF Surveys 2007 to 2013.
10
part I - direct real estate funds & real estate SICARs
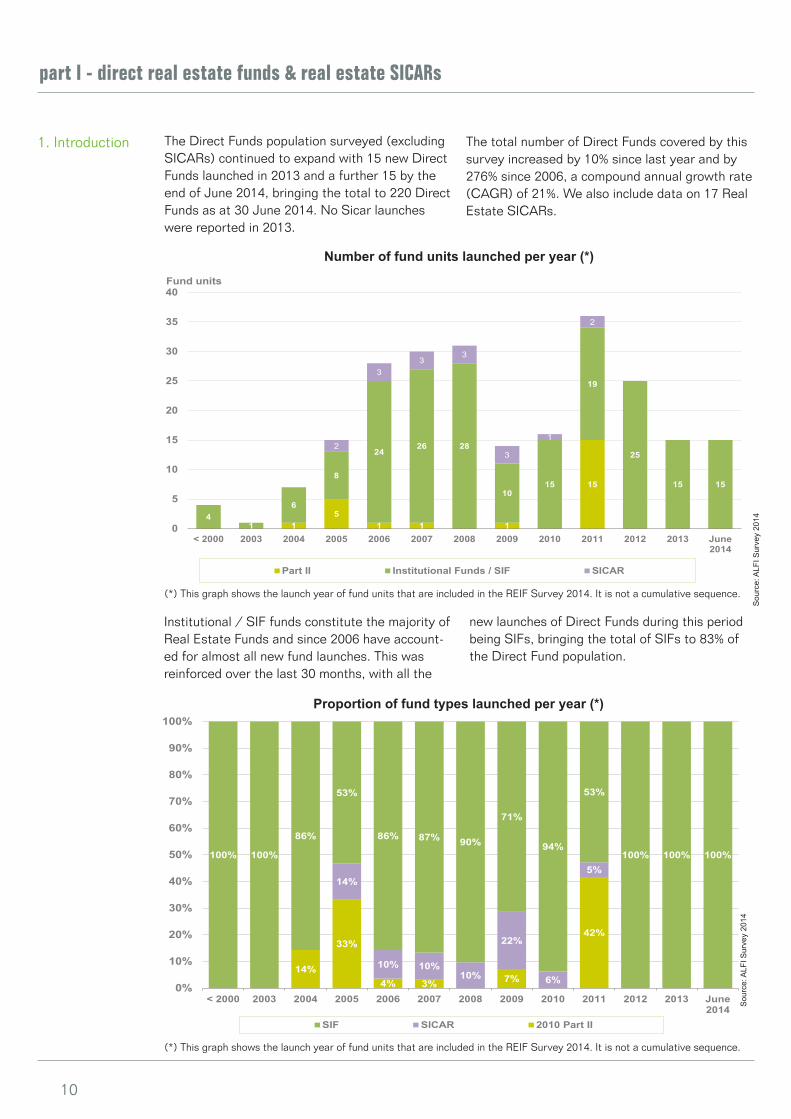
1. Introduction The Direct Funds population surveyed (excluding SICARs) continued to expand with 15 new Direct Funds launched in 2013 and a further 15 by the end of June 2014, bringing the total to 220 Direct Funds as at 30 June 2014. No Sicar launches were reported in 2013.
The total number of Direct Funds covered by this survey increased by 10% since last year and by 276% since 2006, a compound annual growth rate (CAGR) of 21%. We also include data on 17 Real Estate SICARs.
Institutional / SIF funds constitute the majority of Real Estate Funds and since 2006 have account-ed for almost all new fund launches. This was reinforced over the last 30 months, with all the
new launches of Direct Funds during this period being SIFs, bringing the total of SIFs to 83% of the Direct Fund population.
Number of fund units launched per year (*)
14%
33%
4% 3% 7%
42%
14%
10% 10%10%
22%
6%
5%100% 100%
86%
53%
86% 87% 90%
71%
94%
53%
100% 100% 100%
0%
10%
20%
30%
40%
50%
60%
70%
80%
90%
100%
< 2000 2003 2004 2005 2006 2007 2008 2009 2010 2011 2012 2013 June2014
SIF SICAR 2010 Part II
Proportion of fund types launched per year (*)
Sou
rce:
ALF
I Sur
vey
2014
Sou
rce:
ALF
I Sur
vey
2014
15
1 1 1
15
41
6
8
2426 28
1015
19
25
15 15
2
33
3
3
1
2
0
5
10
15
20
25
30
35
40
< 2000 2003 2004 2005 2006 2007 2008 2009 2010 2011 2012 2013 June2014
Part II Institutional Funds / SIF SICAR
Fund units
(*) This graph shows the launch year of fund units that are included in the REIF Survey 2014. It is not a cumulative sequence.
(*) This graph shows the launch year of fund units that are included in the REIF Survey 2014. It is not a cumulative sequence.

11
2. Initiator origins
Proportion of REIFs launched by initiators’ origin (*)
3. Legal structure and regime
Sou
rce:
ALF
I Sur
vey
2014
Sou
rce:
ALF
I Sur
vey
2014
7% 4%
42%
14%
26%
3% 7%
7%
4%4%3%
3%
7%
7% 4%7%
21%
6%
5%
25%
100%
43%
46%
43%53%
45%
29%
50%
11%
16%
47%40%
3%11%
8%
7%
3%
10%
19%
29%
6%
14%
56%
33%
60%
75%
43%36%
23% 26%
14%
25%
14% 20% 20%13%
3%
0%
10%
20%
30%
40%
50%
60%
70%
80%
90%
100%
< 2000 2003 2004 2005 2006 2007 2008 2009 2010 2011 2012 2013 June2014
SIF (SICAV - Sàrl)
SIF (SICAV - SA)
SIF (SICAV - SCA)
SIF (SICAF)
SIF (FCP)
SICAR (SCA)
SICAR (Sàrl)
SICAR (SA)
2010 Part II (SICAF)
2010 Part II (FCP)
Over the years, initiators in Europe were respon-sible for most of the new REIF launches, with UK, German and other European initiators being
the most active, followed by initiators from the United States.
The majority of Real Estate Funds fall under the SIF law (83%) and all new Real Estate Funds launched over the last 30 months have adopted the SIF regime. This reflects the popularity of this
regime for Real Estate Fund initiators seeking an onshore regulated investment fund vehicle for all types of alternative investment fund products (including Direct Funds and Funds of REIFs).
Legal regime and vehicle type combined by launch year (*)
6%3%
25%
13%
18%19%
2%
28% 27% 27%
10%
25%
33%
8%
3%
14%
5%
6%
4%
43%
11%
24%
13%
13%
19%
8% 20%27%
4%
3%8%
7%
7%
10%
7%
7%
5%
8%7%
7%
42%
7%
4%
7%
7%
44%
13%
6%24%
7%
13%
4%
7%
4%
3%
7%
3%
13% 14%
13%
8%
12%
20%50%57% 7%
46%
24%
10%14%
13%
14%
4%12%
13%
100%
26% 25%21%
13%7%
19%
3%6%
0%
10%
20%
30%
40%
50%
60%
70%
80%
90%
100%
< 2000 2003 2004 2005 2006 2007 2008 2009 2010 2011 2012 2013 June2014
Australia/NZ Benelux Canada France Germany
Italy Middle East Nordic/Baltic Other Americas Other Europe
Russia Spain Switzerland UK US
(*) This graph shows the launch year of fund units that are included in the REIF Survey 2014. It is not a cumulative sequence.
(*) This graph shows the launch year of fund units that are included in the REIF Survey 2014. It is not a cumulative sequence.

12
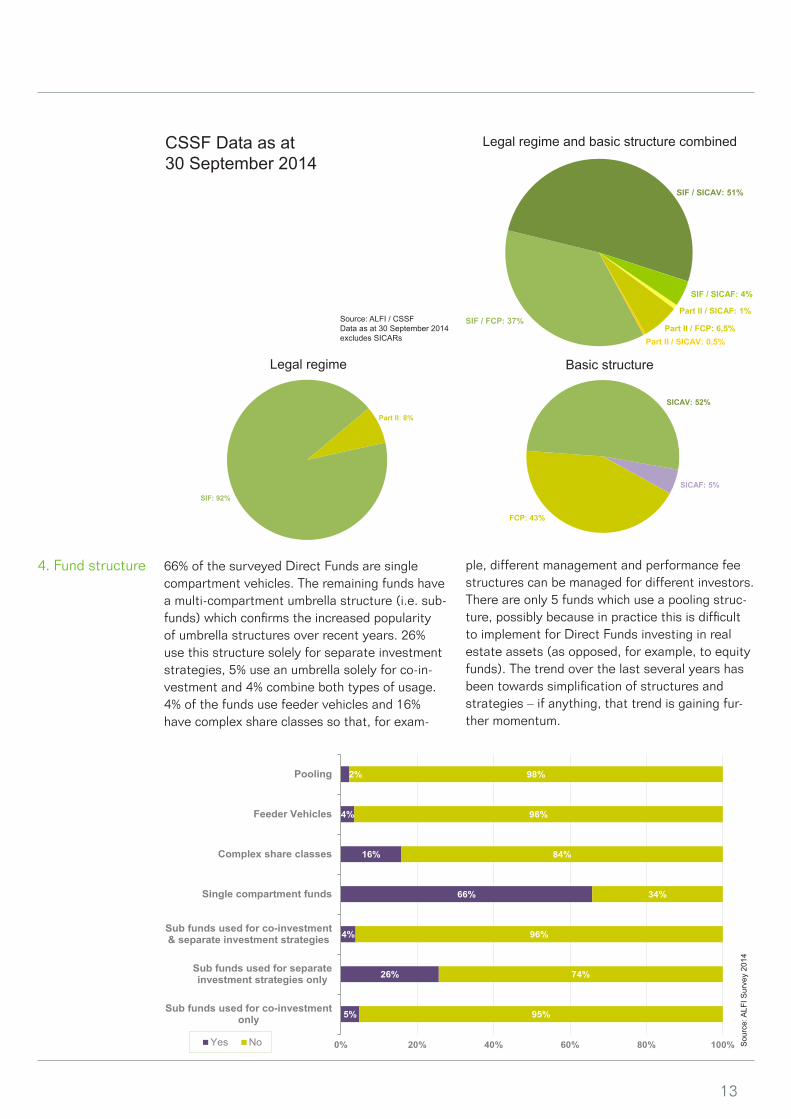
104 of the 220 Direct Funds (excluding SICARs) use the FCP as the vehicle, usually in combination with the SIF regime.
The FCP-SIF and SICAV-SIF are by far the most popular combinations of regulatory regime and fund vehicle, and are roughly equally represented in a combined 87% of all Direct Funds.
The fact that each of the SCA-SICAV and SA-SI-CAV combinations have over the last three years increased their prorata representation in respect of both new launches and the total reflects the versatility of the Luxembourg environment in offering both transparent and opaque vehicles, and in supporting regulatory regimes suitable to initiators’ and investors’ requirements.
Legal regime and structure combined
Legal regime Basic structure
Source: ALFI Survey 2014Data as at 30 June 2014
Part II SICAF: 3%
Part II FCP: 7%SIF FCP: 37%
SIF SICAV - SCA: 21%
SIF SICAV - SA: 21%
SIF SICAV - S.à r.l.: 1%SIF SICAF: 3%SICAR - SA: 1%
SICAR - SCA: 5%
SICAR - S. à r.l.: 1%
Part II: 10%
SIF: 83%
SICAR: 7%
FCP: 44%
SICAV: 43%
SICAR: 7%
SICAF: 6%
Source: ALFI Survey 2014Data as at 30 June 2014
13
5%
26%
4%
66%
16%
4%
2%
95%
74%
96%
34%
84%
96%
98%
0% 20% 40% 60% 80% 100%
Sub funds used for co-investmentonly
Sub funds used for separateinvestment strategies only
Sub funds used for co-investment& separate investment strategies
Single compartment funds
Complex share classes
Feeder Vehicles
Pooling
Yes No
66% of the surveyed Direct Funds are single compartment vehicles. The remaining funds have a multi-compartment umbrella structure (i.e. sub-funds) which confirms the increased popularity of umbrella structures over recent years. 26% use this structure solely for separate investment strategies, 5% use an umbrella solely for co-in-vestment and 4% combine both types of usage. 4% of the funds use feeder vehicles and 16% have complex share classes so that, for exam-
ple, different management and performance fee structures can be managed for different investors. There are only 5 funds which use a pooling struc-ture, possibly because in practice this is difficult to implement for Direct Funds investing in real estate assets (as opposed, for example, to equity funds). The trend over the last several years has been towards simplification of structures and strategies – if anything, that trend is gaining fur-ther momentum.
4. Fund structure
Legal regime and basic structure combined
Legal regime Basic structure
CSSF Data as at30 September 2014
Source: ALFI / CSSFData as at 30 September 2014excludes SICARs
Sou
rce:
ALF
I Sur
vey
2014
Part II: 8%
SIF: 92%
Part II / SICAF: 1%
Part II / FCP: 6,5%Part II / SICAV: 0,5%
SIF / FCP: 37%
SIF / SICAV: 51%
SIF / SICAF: 4%
SICAF: 5%
FCP: 43%
SICAV: 52%

14
5. Investment style
51% of the 220 Direct Funds surveyed (excluding SICARs) are “Core” funds with the remainder split between “Value Added” (34%) and “Oppor-tunity” (15%) fund styles. While these propor-
tions have remained relatively stable from 2009 to 2011, recent launches have focused on Core strategies.
In terms of regulatory regimes, all SICARs must be Opportunity funds, Part II (2010 law) funds predominantly pursue a Core strategy, while the SIF regime is flexible (encompassing Core, Value-Added and Opportunity strategies).Almost half of new Direct Funds launched in 2013 and two thirds of those launched in the first part
of 2014 pursue a Core strategy, continuing the drop in launches of Value-Added and Opportunis-tic funds over recent years. It will be interesting to monitor developments, especially of Oppor-tunistic funds, as more capital returns to the market.
Fund units launched by strategy type (*)
Sou
rce:
ALF
I Sur
vey
2014
Source: ALFI Survey 2014
(*) This graph shows the launch year of fund units that are included in the REIF Survey 2014. It is not a cumulative sequence.
Graph includes SICARs
25%
100%
28%
60%
39%33% 35%
50% 50%
67%
44% 47%
67%25%
43%
27%
43%
40% 39% 14%
31%
19%
28%33%
27%50%
29%
13% 18%27% 26%
36%
19% 14%
28%20%
6%
0%
10%
20%
30%
40%
50%
60%
70%
80%
90%
100%
< 2000 2003 2004 2005 2006 2007 2008 2009 2010 2011 2012 2013 June2014
Opportunity Value-Added Core
Core: 47%
Opportunity: 22%
Value-Added: 31%
15
Source: ALFI Survey 2014
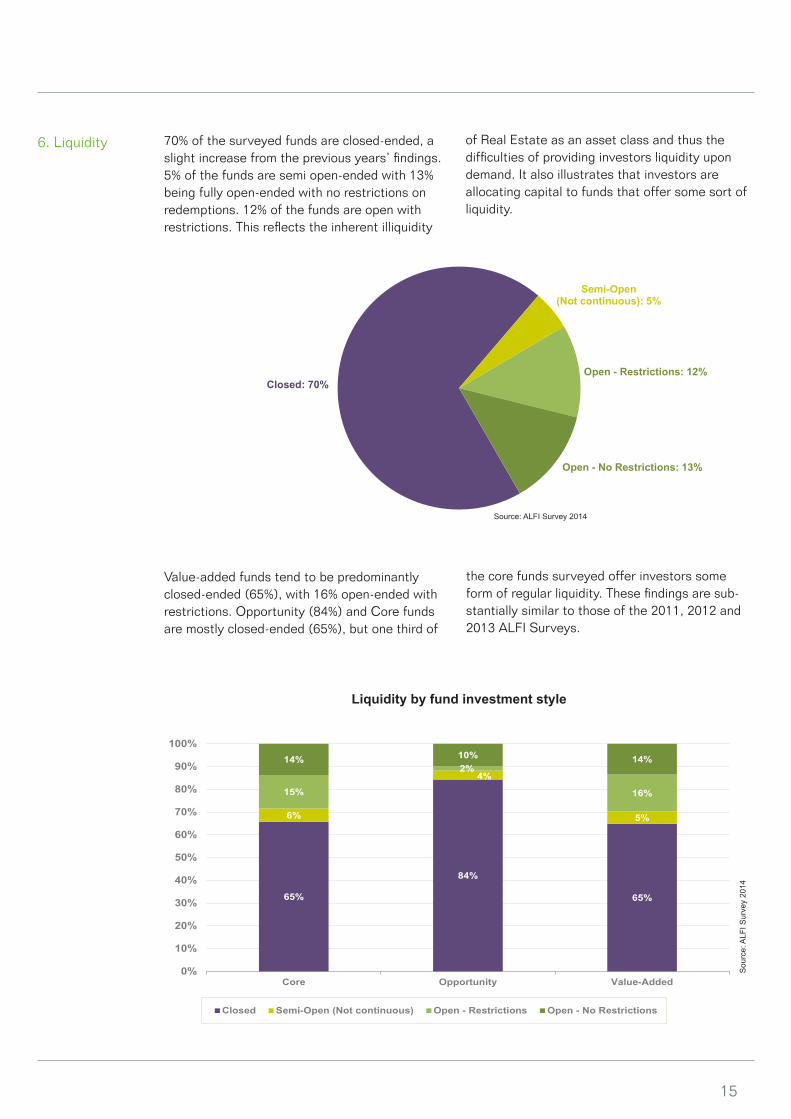
6. Liquidity 70% of the surveyed funds are closed-ended, a slight increase from the previous years’ findings. 5% of the funds are semi open-ended with 13% being fully open-ended with no restrictions on redemptions. 12% of the funds are open with restrictions. This reflects the inherent illiquidity
of Real Estate as an asset class and thus the difficulties of providing investors liquidity upon demand. It also illustrates that investors are allocating capital to funds that offer some sort of liquidity.
Value-added funds tend to be predominantly closed-ended (65%), with 16% open-ended with restrictions. Opportunity (84%) and Core funds are mostly closed-ended (65%), but one third of
the core funds surveyed offer investors some form of regular liquidity. These findings are sub-stantially similar to those of the 2011, 2012 and 2013 ALFI Surveys.
65%
84%
65%
6%
4%
5%
15%
2%
16%
14% 10% 14%
0%
10%
20%
30%
40%
50%
60%
70%
80%
90%
100%
Core Opportunity Value-Added
Closed Semi-Open (Not continuous) Open - Restrictions Open - No Restrictions
Liquidity by fund investment style
Sou
rce:
ALF
I Sur
vey
2014
Closed: 70%
Semi-Open (Not continuous): 5%
Open - Restrictions: 12%
Open - No Restrictions: 13%
16
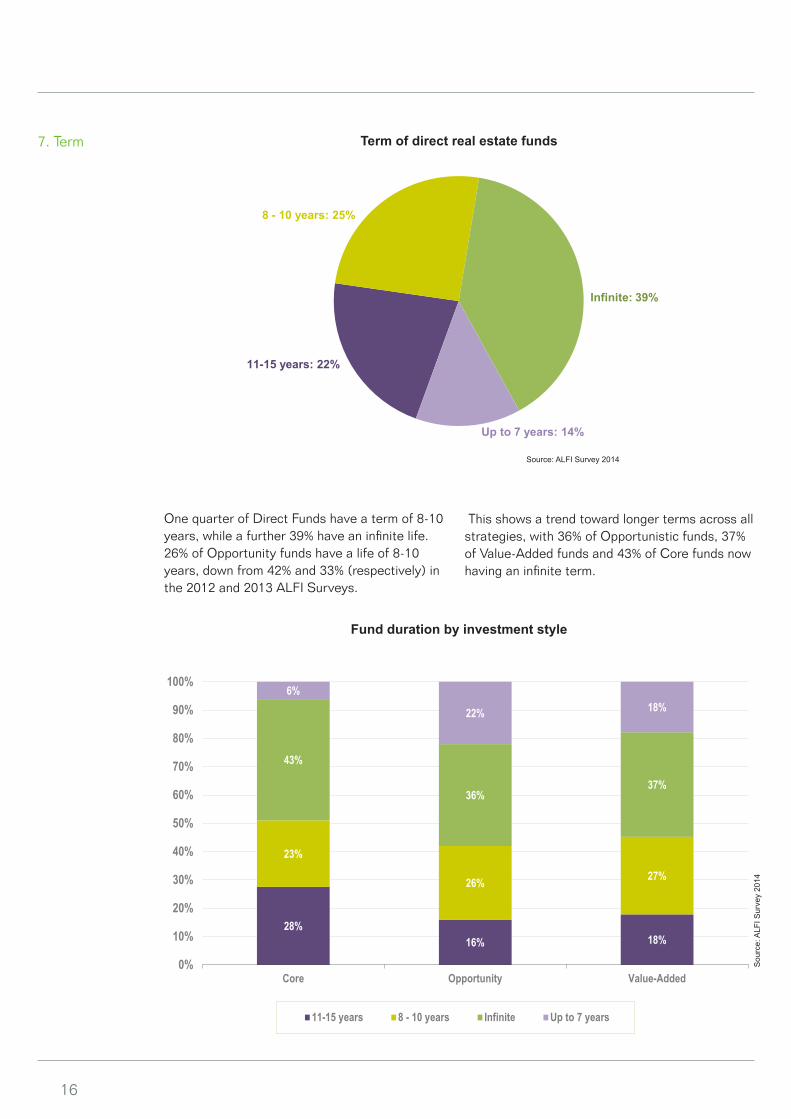
7. Term
One quarter of Direct Funds have a term of 8-10 years, while a further 39% have an infinite life.26% of Opportunity funds have a life of 8-10 years, down from 42% and 33% (respectively) in the 2012 and 2013 ALFI Surveys.
This shows a trend toward longer terms across all strategies, with 36% of Opportunistic funds, 37% of Value-Added funds and 43% of Core funds now having an infinite term.
28%16% 18%
23%
26% 27%
43%
36%37%
6%
22% 18%
0%
10%
20%
30%
40%
50%
60%
70%
80%
90%
100%
Core Opportunity Value-Added
11-15 years 8 - 10 years Infinite Up to 7 years
Fund duration by investment style
Sou
rce:
ALF
I Sur
vey
2014
Source: ALFI Survey 2014
Term of direct real estate funds
11-15 years: 22%
8 - 10 years: 25%
Infinite: 39%
Up to 7 years: 14%
17
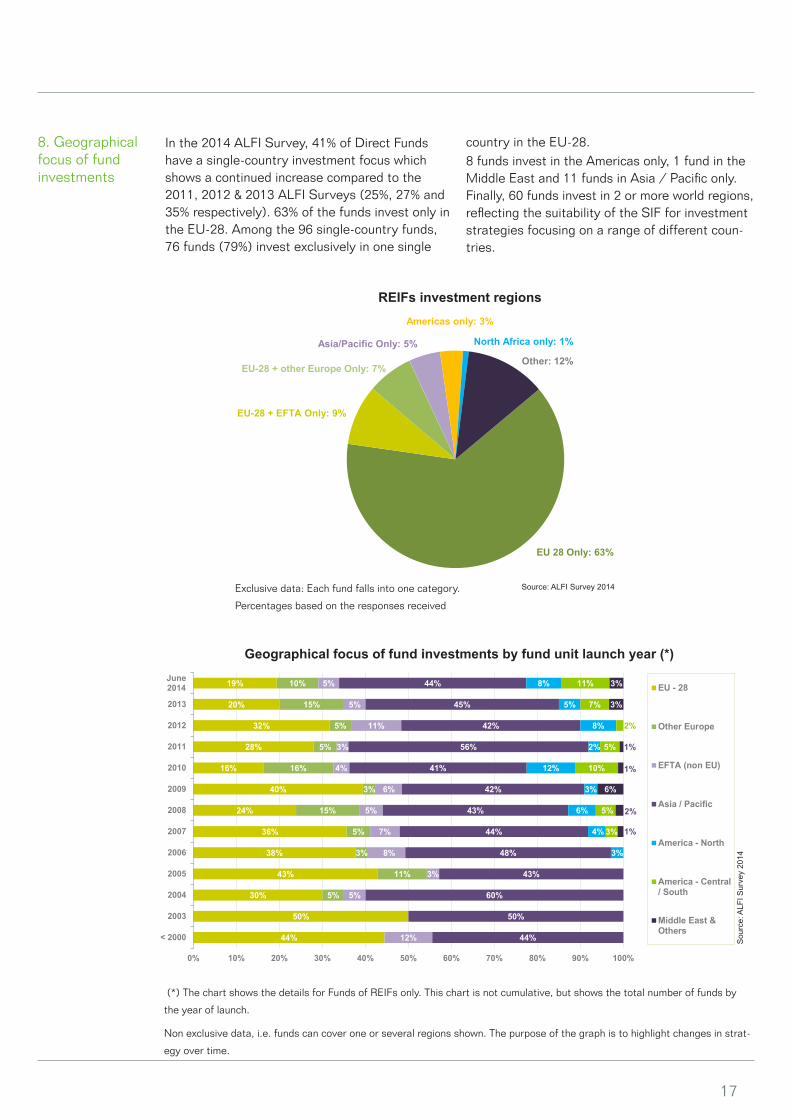
8. Geographical focus of fund investments
In the 2014 ALFI Survey, 41% of Direct Funds have a single-country investment focus which shows a continued increase compared to the 2011, 2012 & 2013 ALFI Surveys (25%, 27% and 35% respectively). 63% of the funds invest only in the EU-28. Among the 96 single-country funds, 76 funds (79%) invest exclusively in one single
country in the EU-28. 8 funds invest in the Americas only, 1 fund in the Middle East and 11 funds in Asia / Pacific only. Finally, 60 funds invest in 2 or more world regions, reflecting the suitability of the SIF for investment strategies focusing on a range of different coun-tries.
Geographical focus of fund investments by fund unit launch year (*)
(*) The chart shows the details for Funds of REIFs only. This chart is not cumulative, but shows the total number of funds by
the year of launch.
Non exclusive data, i.e. funds can cover one or several regions shown. The purpose of the graph is to highlight changes in strat-
egy over time.
Sou
rce:
ALF
I Sur
vey
2014
Source: ALFI Survey 2014
EU 28 Only: 63%
EU-28 + EFTA Only: 9%
EU-28 + other Europe Only: 7%
Asia/Pacific Only: 5%
Americas only: 3%
North Africa only: 1%
Other: 12%
Exclusive data: Each fund falls into one category.
Percentages based on the responses received
44%
50%
30%
43%
38%
36%
24%
40%
16%
28%
32%
20%
19%
5%
11%
3%
5%
15%
3%
16%
5%
5%
15%
10%
12%
5%
3%
8%
7%
5%
6%
4%
3%
11%
5%
5%
44%
50%
60%
43%
48%
44%
43%
42%
41%
56%
42%
45%
44%
3%
4%
6%
3%
12%
2%
8%
5%
8%
3%
5%
10%
5%
2%
7%
11%
1%
2%
6%
1%
1%
3%
3%
0% 10% 20% 30% 40% 50% 60% 70% 80% 90% 100%
< 2000
2003
2004
2005
2006
2007
2008
2009
2010
2011
2012
2013
June2014 EU - 28
Other Europe
EFTA (non EU)
Asia / Pacific
America - North
America - Central/ South
Middle East &Others
REIFs investment regions
18
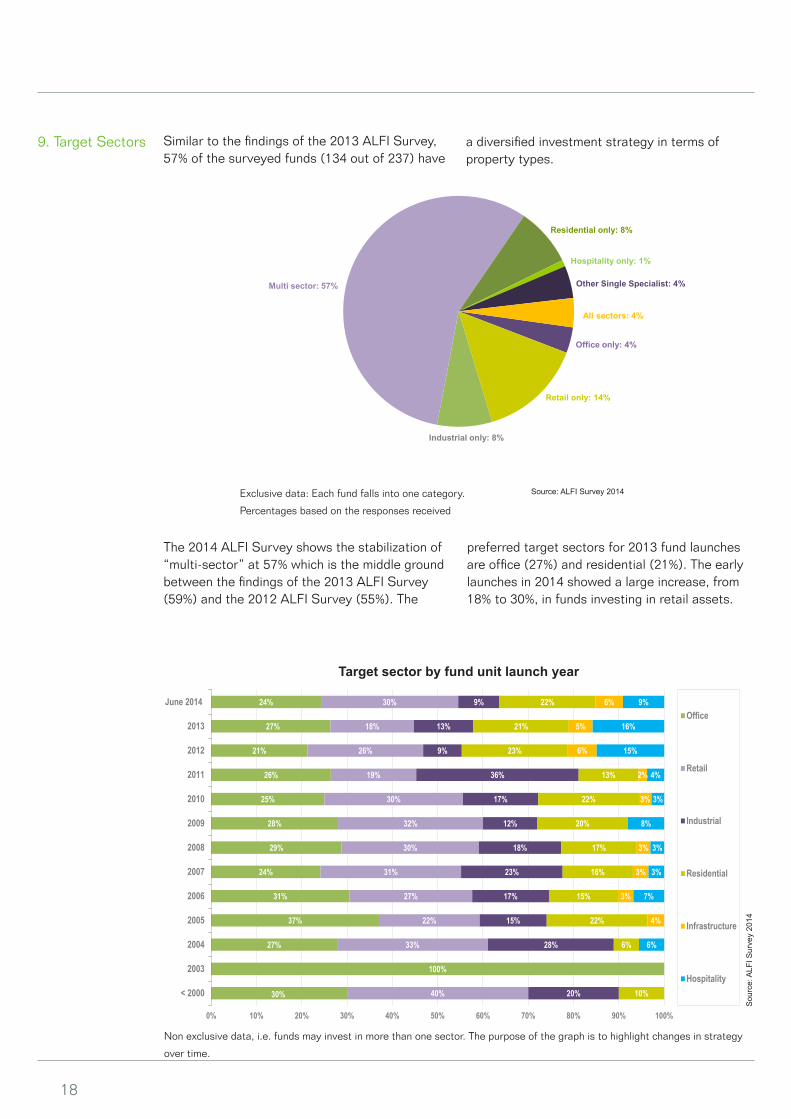
9. Target Sectors Similar to the findings of the 2013 ALFI Survey, 57% of the surveyed funds (134 out of 237) have
a diversified investment strategy in terms of property types.
Source: ALFI Survey 2014
The 2014 ALFI Survey shows the stabilization of “multi-sector” at 57% which is the middle ground between the findings of the 2013 ALFI Survey (59%) and the 2012 ALFI Survey (55%). The
preferred target sectors for 2013 fund launches are office (27%) and residential (21%). The early launches in 2014 showed a large increase, from 18% to 30%, in funds investing in retail assets.
30%
100%
27%
37%
31%
24%
29%
28%
25%
26%
21%
27%
24%
40%
33%
22%
27%
31%
30%
32%
30%
19%
26%
18%
30%
20%
28%
15%
17%
23%
18%
12%
17%
36%
9%
13%
9%
10%
6%
22%
15%
16%
17%
20%
22%
13%
23%
21%
22%
4%
3%
3%
3%
3%
2%
6%
5%
6%
6%
7%
3%
3%
8%
3%
4%
15%
16%
9%
0% 10% 20% 30% 40% 50% 60% 70% 80% 90% 100%
< 2000
2003
2004
2005
2006
2007
2008
2009
2010
2011
2012
2013
June 2014Office
Retail
Industrial
Residential
Infrastructure
Hospitality
Target sector by fund unit launch year
Non exclusive data, i.e. funds may invest in more than one sector. The purpose of the graph is to highlight changes in strategy
over time.
Sou
rce:
ALF
I Sur
vey
2014
Exclusive data: Each fund falls into one category.
Percentages based on the responses received
Office only: 4%
Retail only: 14%
Industrial only: 8%
Multi sector: 57%
Residential only: 8%
Hospitality only: 1%
Other Single Specialist: 4%
All sectors: 4%
19
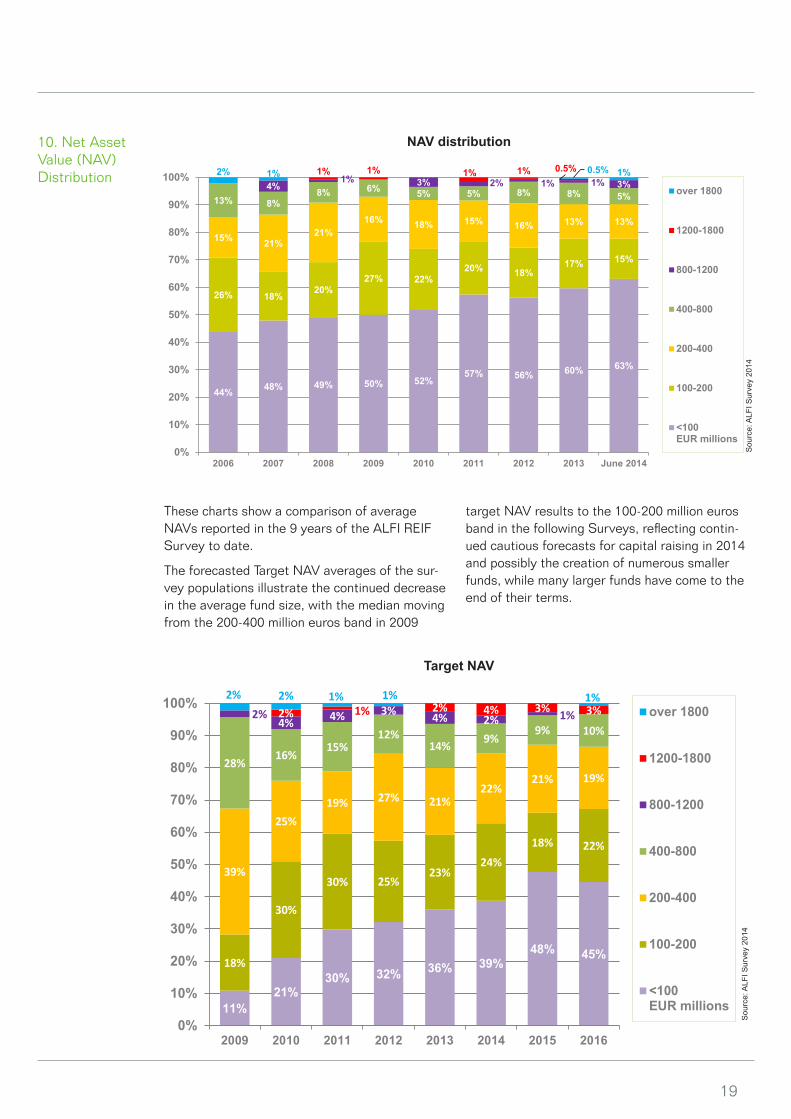
10. Net Asset Value (NAV)Distribution
These charts show a comparison of average NAVs reported in the 9 years of the ALFI REIF Survey to date.
The forecasted Target NAV averages of the sur-vey populations illustrate the continued decrease in the average fund size, with the median moving from the 200-400 million euros band in 2009
target NAV results to the 100-200 million euros band in the following Surveys, reflecting contin-ued cautious forecasts for capital raising in 2014 and possibly the creation of numerous smaller funds, while many larger funds have come to the end of their terms.
NAV distribution
Target NAV
Sou
rce:
ALF
I Sur
vey
2014
Sou
rce:
ALF
I Sur
vey
2014
11%21%
30% 32% 36% 39%48% 45%
18%
30%
30% 25%23%
24%18% 22%
39%
25%19% 27% 21%
22%21% 19%
28%16%
15%12%
14% 9%9% 10%
2%4% 4% 3% 4% 2% 1%2% 1% 2% 4% 3% 3%
2% 2% 1% 1% 1%
0%
10%
20%
30%
40%
50%
60%
70%
80%
90%
100%
2009 2010 2011 2012 2013 2014 2015 2016
over 1800
1200-1800
800-1200
400-800
200-400
100-200
<100EUR millions
44% 48% 49% 50% 52%57% 56% 60% 63%
26% 18% 20%27% 22%
20% 18%17% 15%
15% 21%21%
16% 18% 15% 16% 13% 13%
13% 8%8% 6% 5% 5% 8% 8% 5%
4%1% 3% 2% 1% 1% 3%
1% 1% 1% 1% 0.5%2% 1% 0.5% 1%
0%
10%
20%
30%
40%
50%
60%
70%
80%
90%
100%
2006 2007 2008 2009 2010 2011 2012 2013 June 2014
over 1800
1200-1800
800-1200
400-800
200-400
100-200
<100EUR millions
20
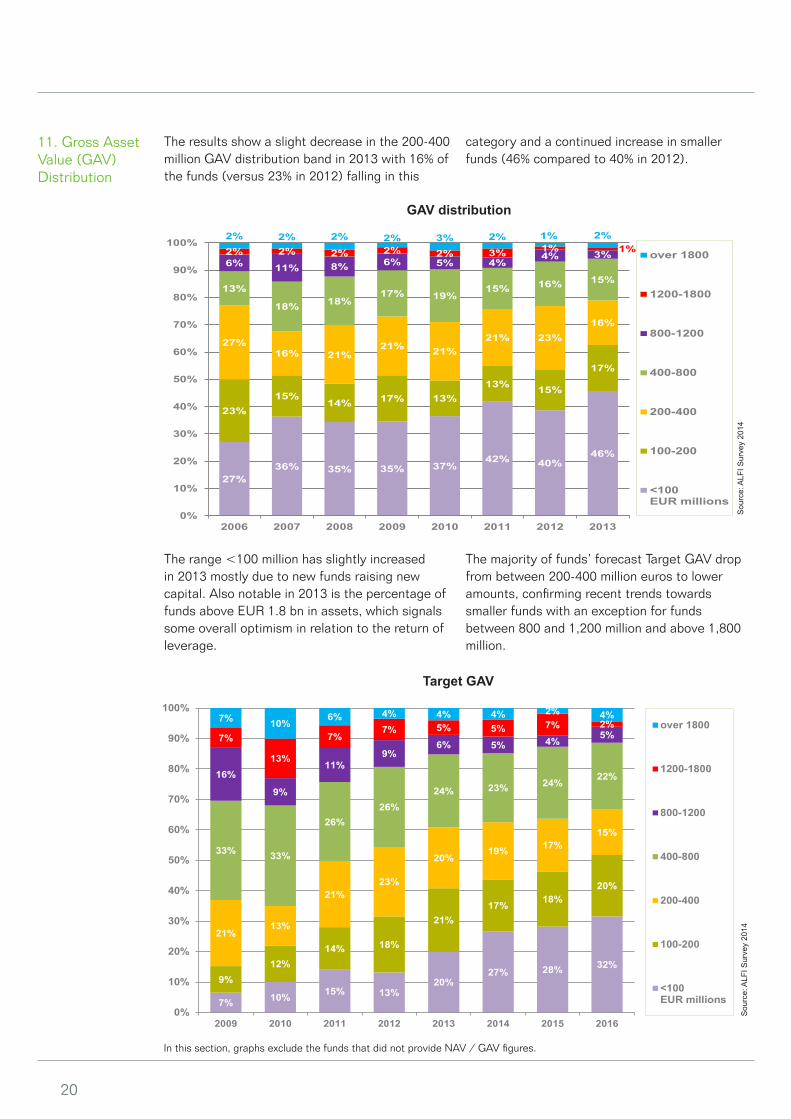
11. Gross Asset Value (GAV)Distribution
The results show a slight decrease in the 200-400 million GAV distribution band in 2013 with 16% of the funds (versus 23% in 2012) falling in this
The range <100 million has slightly increased in 2013 mostly due to new funds raising new capital. Also notable in 2013 is the percentage of funds above EUR 1.8 bn in assets, which signals some overall optimism in relation to the return of leverage.
category and a continued increase in smaller funds (46% compared to 40% in 2012).
The majority of funds’ forecast Target GAV drop from between 200-400 million euros to lower amounts, confirming recent trends towards smaller funds with an exception for fundsbetween 800 and 1,200 million and above 1,800 million.
GAV distribution
Sou
rce:
ALF
I Sur
vey
2014
Target GAV
Sou
rce:
ALF
I Sur
vey
2014
In this section, graphs exclude the funds that did not provide NAV / GAV figures.
27%36% 35% 35% 37%
42% 40%46%
23%15%
14% 17% 13%13% 15%
17%
27%16% 21%
21% 21%21% 23%
16%
13%
18% 18%17% 19%
15% 16% 15%
6% 11% 8% 6% 5% 4%4% 3%2% 2% 2% 2% 2% 3% 1% 1%
2% 2% 2% 2% 3% 2% 1% 2%
0%
10%
20%
30%
40%
50%
60%
70%
80%
90%
100%
2006 2007 2008 2009 2010 2011 2012 2013
over 1800
1200-1800
800-1200
400-800
200-400
100-200
<100EUR millions
7% 10% 15% 13%20%
27% 28% 32%9%
12%14% 18%
21%17% 18%
20%
21%13%
21%23%
20%19% 17%
15%
33% 33%
26%26%
24% 23% 24%22%16%
9%
11%9%
6% 5% 4% 5%7%
13%
7%7% 5% 5% 7% 2%7% 10%
6% 4% 4% 4% 2% 4%
0%
10%
20%
30%
40%
50%
60%
70%
80%
90%
100%
2009 2010 2011 2012 2013 2014 2015 2016
over 1800
1200-1800
800-1200
400-800
200-400
100-200
<100EUR millions
21
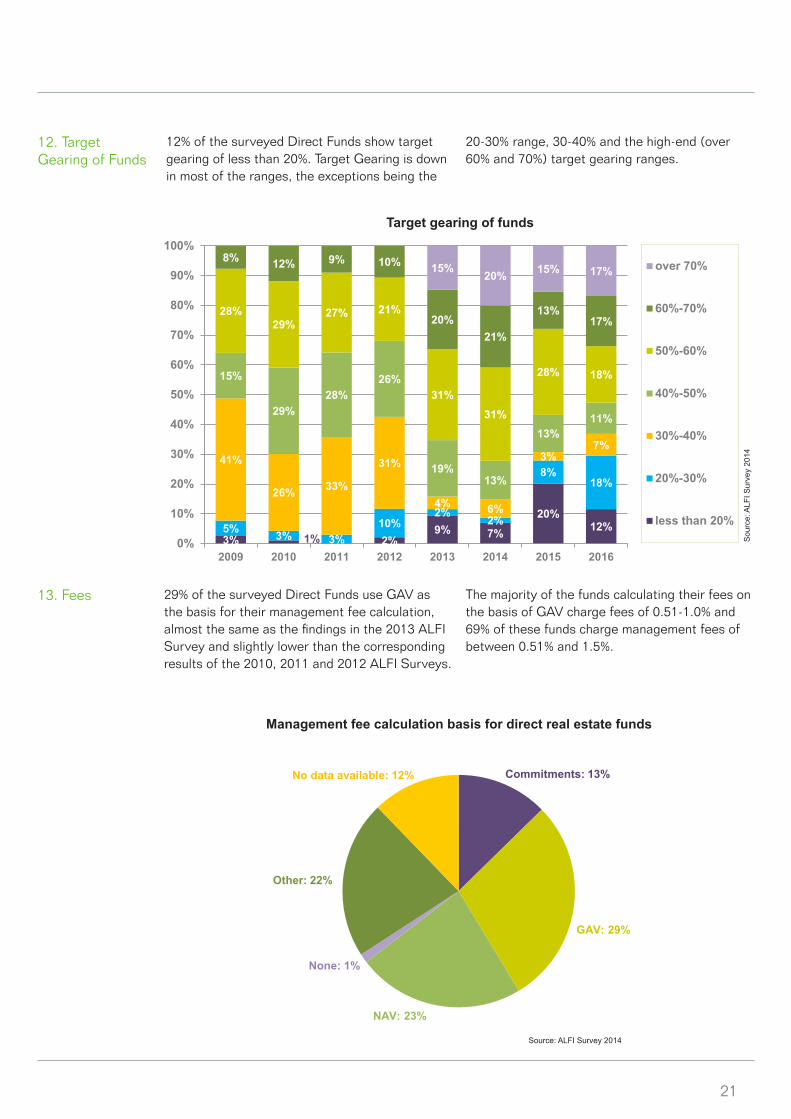
12. TargetGearing of Funds
12% of the surveyed Direct Funds show target gearing of less than 20%. Target Gearing is down in most of the ranges, the exceptions being the
20-30% range, 30-40% and the high-end (over 60% and 70%) target gearing ranges.
13. Fees 29% of the surveyed Direct Funds use GAV as the basis for their management fee calculation, almost the same as the findings in the 2013 ALFI Survey and slightly lower than the corresponding results of the 2010, 2011 and 2012 ALFI Surveys.
The majority of the funds calculating their fees on the basis of GAV charge fees of 0.51-1.0% and 69% of these funds charge management fees of between 0.51% and 1.5%.
Management fee calculation basis for direct real estate funds
Source: ALFI Survey 2014
Target gearing of funds
3% 1% 2%9% 7%
20%12%5% 3% 3%
10%2%
2%
8%18%
41%
26% 33%
31%
4% 6%
3%7%
15%
29%28%
26%
19%13%
13%11%
28%29%
27% 21%
31%31%
28% 18%
8% 12% 9% 10%
20%21%
13%17%
15% 20% 15% 17%
0%
10%
20%
30%
40%
50%
60%
70%
80%
90%
100%
2009 2010 2011 2012 2013 2014 2015 2016
over 70%
60%-70%
50%-60%
40%-50%
30%-40%
20%-30%
less than 20%
Sou
rce:
ALF
I Sur
vey
2014
Commitments: 13%
GAV: 29%
NAV: 23%
None: 1%
Other: 22%
No data available: 12%

22
>1.5%: 21%0.51%-1.0%: 28%
0-0.5%: 21%
1.01%-1.5%: 18%
No data available: 12%
Management fee range for Direct REIFs
Source: ALFI Survey 2014
Almost half of the surveyed Direct Funds do not levy a performance fee. For the funds charging performance fees, 49% charge 20%. 9 Core funds indicated a payout rate of more than 20%, while 16 Core funds have performance fees with a pay-
42%
59%
45%
34%
17% 45%
24% 24%
10%
0%
10%
20%
30%
40%
50%
60%
70%
80%
90%
100%
Core Value-Added Opportunity
20% <20% >20%
Sou
rce:
ALF
I Sur
vey
2014
out rate of 20%. 59% of the Value-Added funds (down from 69% last year) reported a payout rate of exactly 20%, indicating that this remains the market standard.
Performance fee charged
23
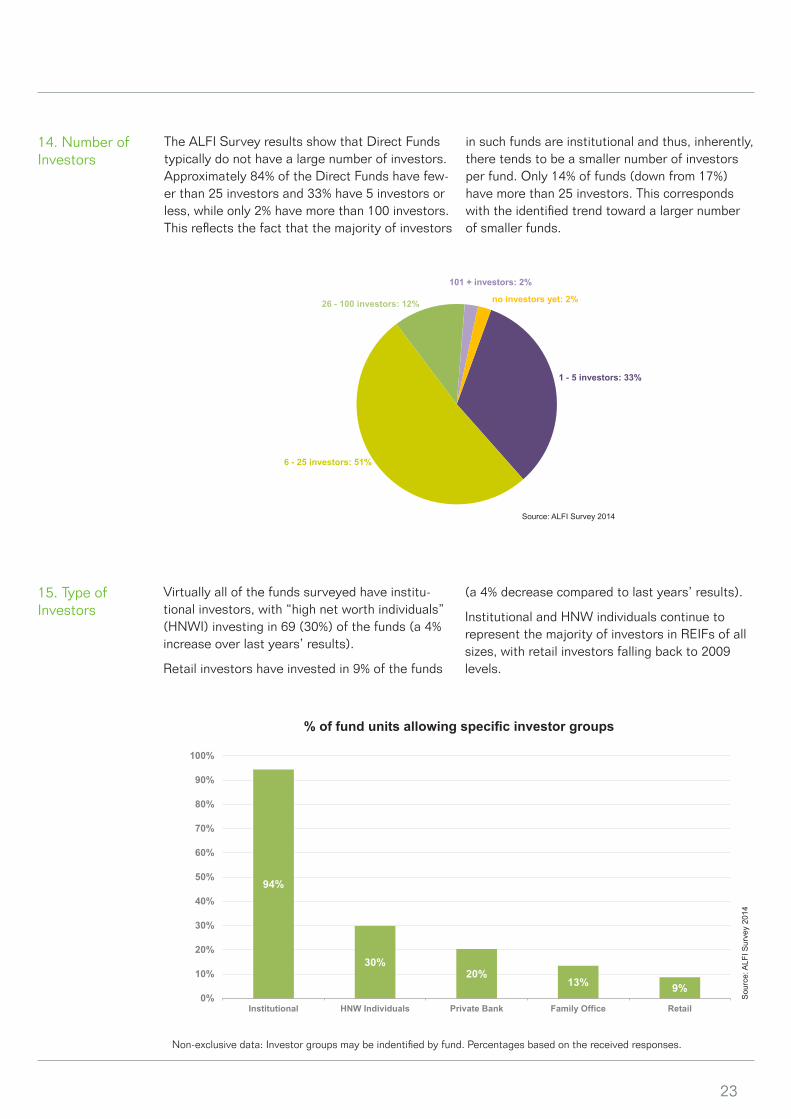
14. Number of Investors
The ALFI Survey results show that Direct Funds typically do not have a large number of investors. Approximately 84% of the Direct Funds have few-er than 25 investors and 33% have 5 investors or less, while only 2% have more than 100 investors. This reflects the fact that the majority of investors
1 - 5 investors: 33%
6 - 25 investors: 51%
26 - 100 investors: 12%
101 + investors: 2%
no investors yet: 2%
15. Type ofInvestors
Virtually all of the funds surveyed have institu-tional investors, with “high net worth individuals” (HNWI) investing in 69 (30%) of the funds (a 4% increase over last years’ results).
Retail investors have invested in 9% of the funds
94%
30%20%
13% 9%0%
10%
20%
30%
40%
50%
60%
70%
80%
90%
100%
Institutional HNW Individuals Private Bank Family Office Retail
% of fund units allowing specific investor groups
Non-exclusive data: Investor groups may be indentified by fund. Percentages based on the received responses.
in such funds are institutional and thus, inherently, there tends to be a smaller number of investors per fund. Only 14% of funds (down from 17%) have more than 25 investors. This corresponds with the identified trend toward a larger number of smaller funds.
(a 4% decrease compared to last years’ results).
Institutional and HNW individuals continue to represent the majority of investors in REIFs of all sizes, with retail investors falling back to 2009 levels.
Source: ALFI Survey 2014
Sou
rce:
ALF
I Sur
vey
2014
24
67%
53%
59%
29%
6%
15%
13%
18%
5%
9%
4%
18%
18%
17%
20%
23%
4%
6%
4%
12%
0% 10% 20% 30% 40% 50% 60% 70% 80% 90% 100%
1 - 5
6 - 25
25 - 100
101 +
Institutional Private Bank Family Office HNW Individuals Retail
investors
Number of investors by type of investor
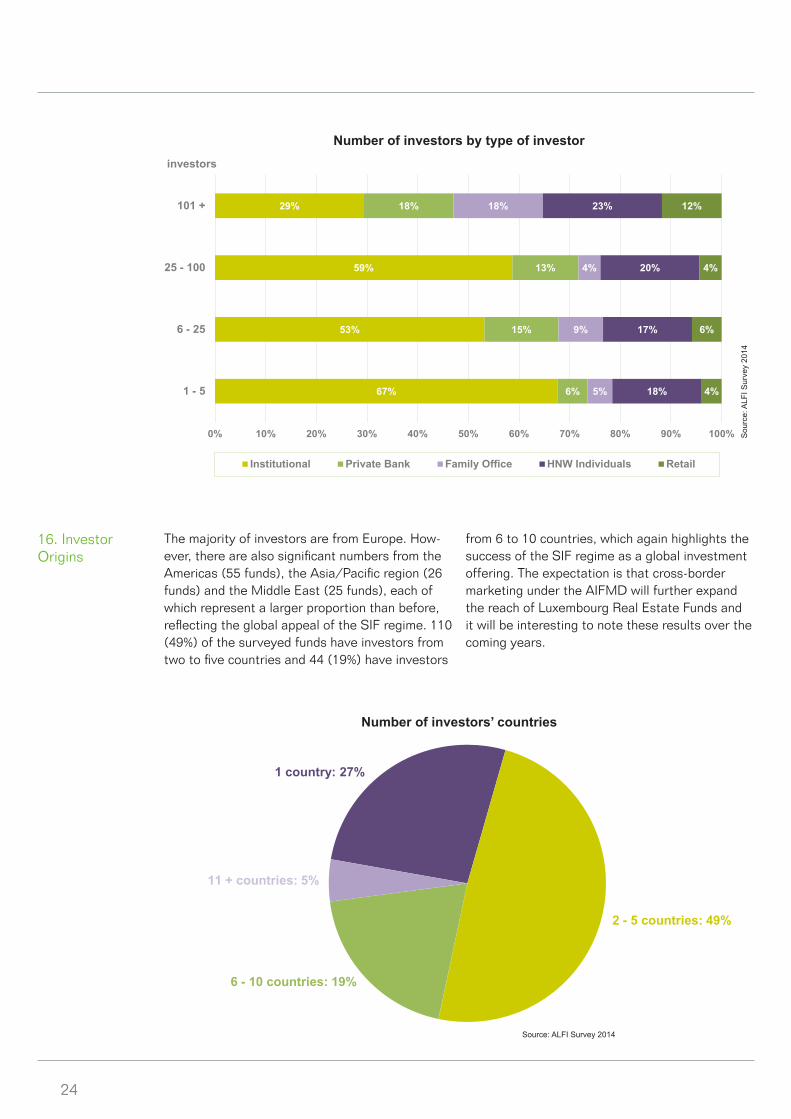
16. Investor Origins
The majority of investors are from Europe. How-ever, there are also significant numbers from the Americas (55 funds), the Asia/Pacific region (26 funds) and the Middle East (25 funds), each of which represent a larger proportion than before, reflecting the global appeal of the SIF regime. 110 (49%) of the surveyed funds have investors from two to five countries and 44 (19%) have investors
Number of investors’ countriesS
ourc
e: A
LFI S
urve
y 20
14
from 6 to 10 countries, which again highlights the success of the SIF regime as a global investment offering. The expectation is that cross-border marketing under the AIFMD will further expand the reach of Luxembourg Real Estate Funds and it will be interesting to note these results over the coming years.
Source: ALFI Survey 2014
1 country: 27%
2 - 5 countries: 49%
6 - 10 countries: 19%
11 + countries: 5%
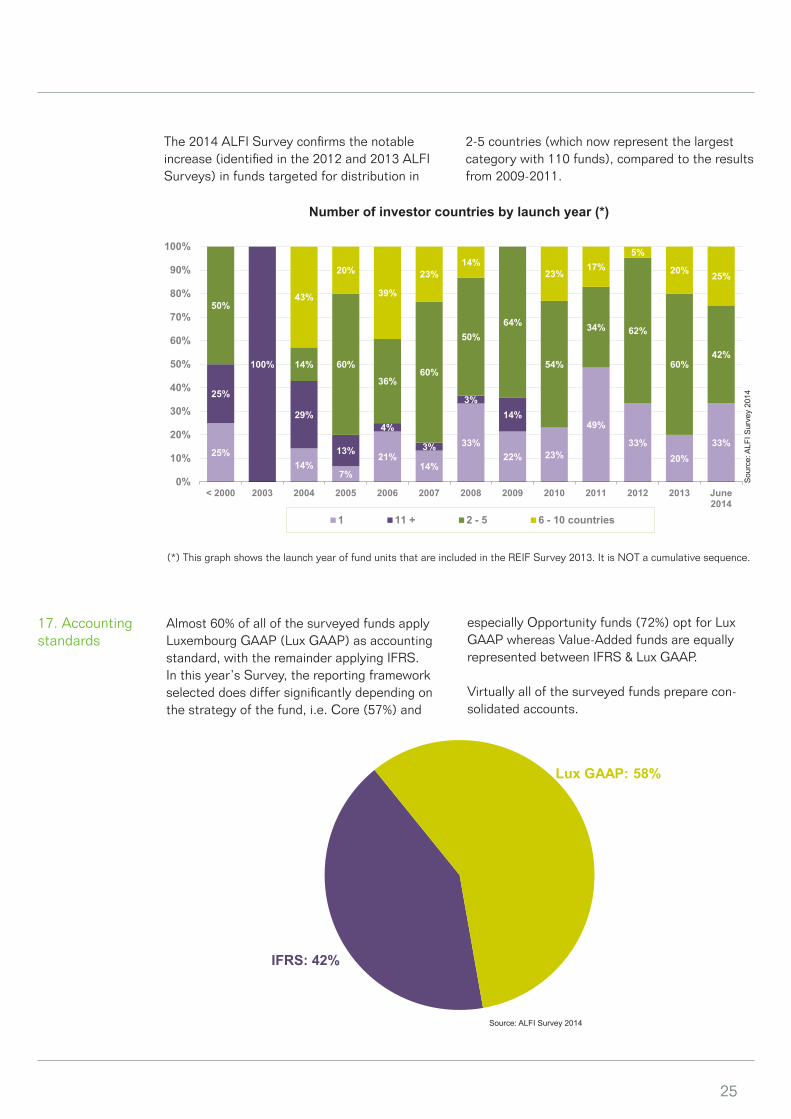
25
The 2014 ALFI Survey confirms the notable increase (identified in the 2012 and 2013 ALFI Surveys) in funds targeted for distribution in
2-5 countries (which now represent the largest category with 110 funds), compared to the results from 2009-2011.
25%14%
7%
21%14%
33%22% 23%
49%
33%20%
33%
25%
100%
29%
13%
4%
3%
3%14%
50%
14% 60%
36%60%
50%64%
54%
34% 62%
60%42%
43%
20%
39%
23%14%
23%17%
5%
20% 25%
0%
10%
20%
30%
40%
50%
60%
70%
80%
90%
100%
< 2000 2003 2004 2005 2006 2007 2008 2009 2010 2011 2012 2013 June2014
1 11 + 2 - 5 6 - 10 countries
Number of investor countries by launch year (*)
(*) This graph shows the launch year of fund units that are included in the REIF Survey 2013. It is NOT a cumulative sequence.
17. Accounting standards
Almost 60% of all of the surveyed funds apply Luxembourg GAAP (Lux GAAP) as accounting standard, with the remainder applying IFRS. In this year’s Survey, the reporting framework selected does differ significantly depending on the strategy of the fund, i.e. Core (57%) and
Sou
rce:
ALF
I Sur
vey
2014
especially Opportunity funds (72%) opt for Lux GAAP whereas Value-Added funds are equally represented between IFRS & Lux GAAP.
Virtually all of the surveyed funds prepare con-solidated accounts.
Source: ALFI Survey 2014
IFRS: 42%
Lux GAAP: 58%
26
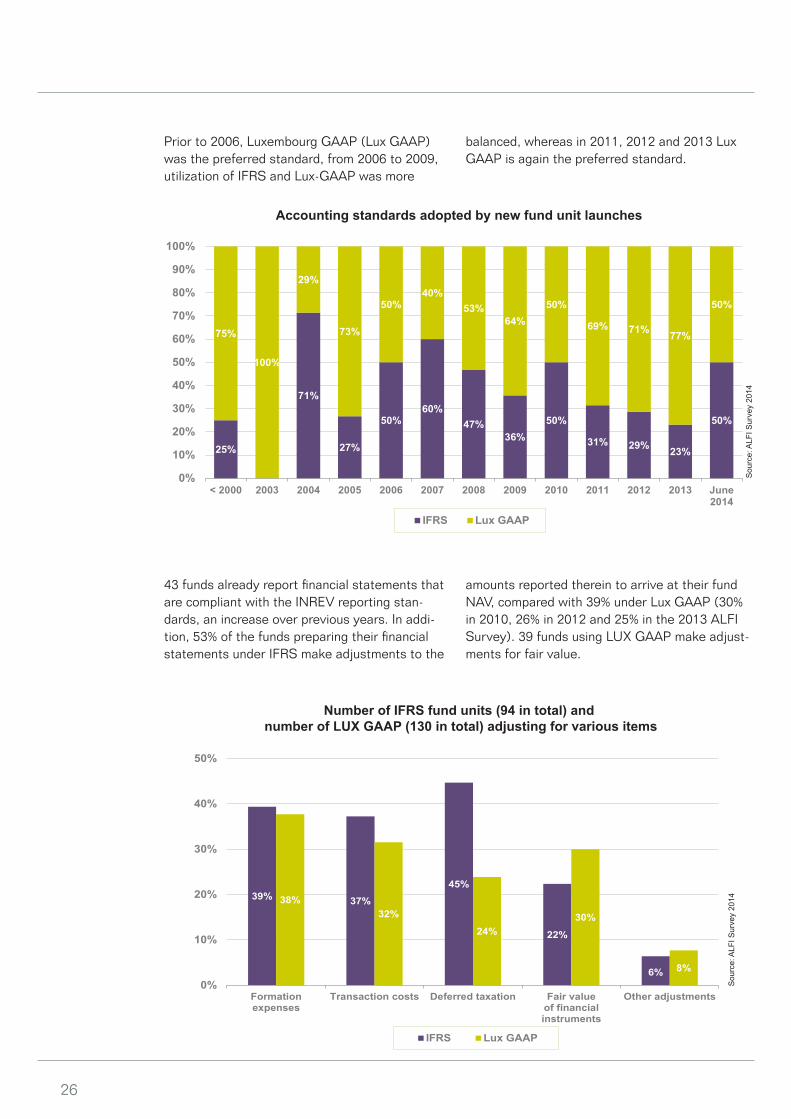
Prior to 2006, Luxembourg GAAP (Lux GAAP) was the preferred standard, from 2006 to 2009, utilization of IFRS and Lux-GAAP was more
balanced, whereas in 2011, 2012 and 2013 Lux GAAP is again the preferred standard.
25%
71%
27%
50%60%
47%36%
50%
31% 29% 23%
50%
75%
100%
29%
73%
50%40%
53%64%
50%
69% 71% 77%
50%
0%
10%
20%
30%
40%
50%
60%
70%
80%
90%
100%
< 2000 2003 2004 2005 2006 2007 2008 2009 2010 2011 2012 2013 June2014
IFRS Lux GAAP
Accounting standards adopted by new fund unit launches
43 funds already report financial statements that are compliant with the INREV reporting stan-dards, an increase over previous years. In addi-tion, 53% of the funds preparing their financial statements under IFRS make adjustments to the
amounts reported therein to arrive at their fund NAV, compared with 39% under Lux GAAP (30% in 2010, 26% in 2012 and 25% in the 2013 ALFI Survey). 39 funds using LUX GAAP make adjust-ments for fair value.
39% 37%
45%
22%
6%
38%32%
24%30%
8%
0%
10%
20%
30%
40%
50%
Formationexpenses
Transaction costs Deferred taxation Fair valueof financialinstruments
Other adjustments
IFRS Lux GAAP
Number of IFRS fund units (94 in total) and number of LUX GAAP (130 in total) adjusting for various items
Sou
rce:
ALF
I Sur
vey
2014
Sou
rce:
ALF
I Sur
vey
2014
27
18. Frequency of NAV Calculation
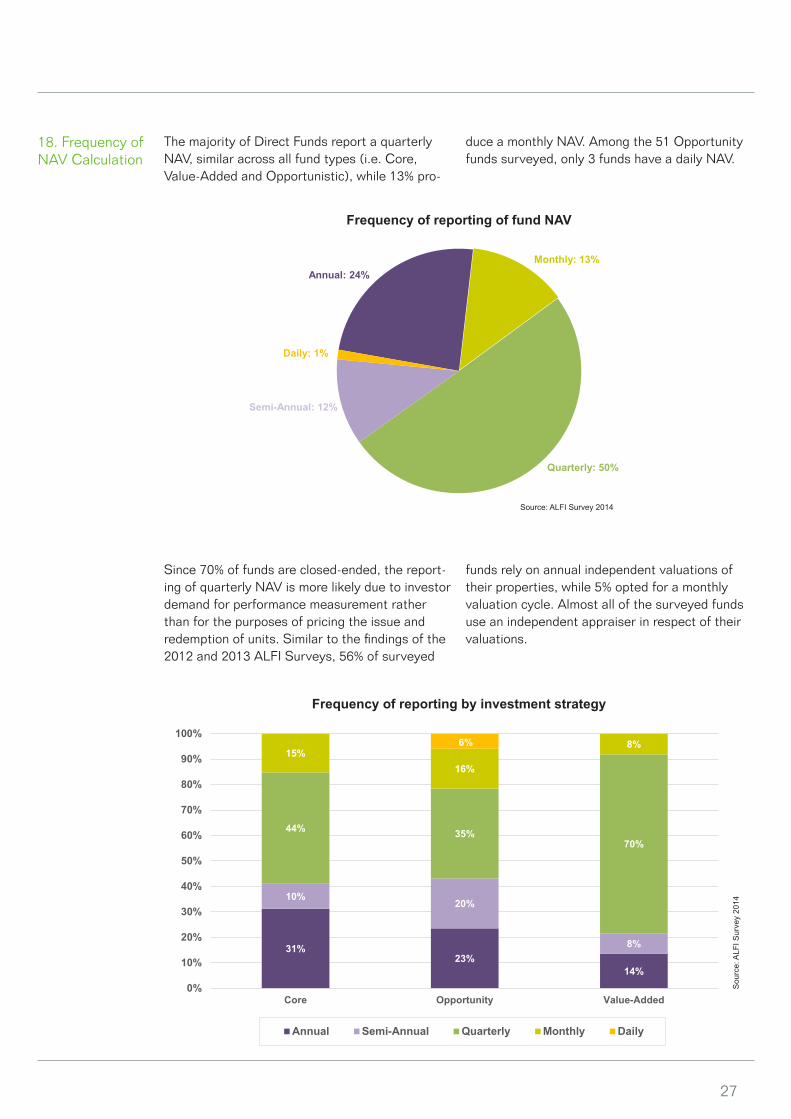
The majority of Direct Funds report a quarterly NAV, similar across all fund types (i.e. Core, Value-Added and Opportunistic), while 13% pro-
duce a monthly NAV. Among the 51 Opportunity funds surveyed, only 3 funds have a daily NAV.
Since 70% of funds are closed-ended, the report-ing of quarterly NAV is more likely due to investor demand for performance measurement rather than for the purposes of pricing the issue and redemption of units. Similar to the findings of the 2012 and 2013 ALFI Surveys, 56% of surveyed
funds rely on annual independent valuations of their properties, while 5% opted for a monthly valuation cycle. Almost all of the surveyed funds use an independent appraiser in respect of their valuations.
Frequency of reporting by investment strategy
Sou
rce:
ALF
I Sur
vey
2014
Source: ALFI Survey 2014
Frequency of reporting of fund NAV
31%23%
14%
10%20%
8%
44% 35%70%
15%16%
8%6%
0%
10%
20%
30%
40%
50%
60%
70%
80%
90%
100%
Core Opportunity Value-Added
Annual Semi-Annual Quarterly Monthly Daily
Annual: 24%Monthly: 13%
Quarterly: 50%
Semi-Annual: 12%
Daily: 1%

28
Inversely to the 2011 ALFI Survey and as was the case for the 2012 ALFI Survey, the frequency of property valuations correlates with the frequen-
cy of reporting of NAVs. It is more balanced for quarterly and monthly NAVs.
None: 1%
Monthly: 8%
Quarterly: 19%
Other: 1%Semi-Annual: 14%
Annual: 57%
Direct real estate funds valuations
100%
25%
52%47%
75%10%
6%
37%
1%
47%
100%
0%
10%
20%
30%
40%
50%
60%
70%
80%
90%
100%
Annual Semi-Annual Quarterly Monthly Other
Prop
erty
Val
uatio
n Fr
eque
ncy
Frequency of NAV Calculation
Monthly
Quarterly
Semi-Annual
Annual
Sou
rce:
ALF
I Sur
vey
2014
Source: ALFI Survey 2014
Frequency of property valuation by frequency of NAV calculation
29
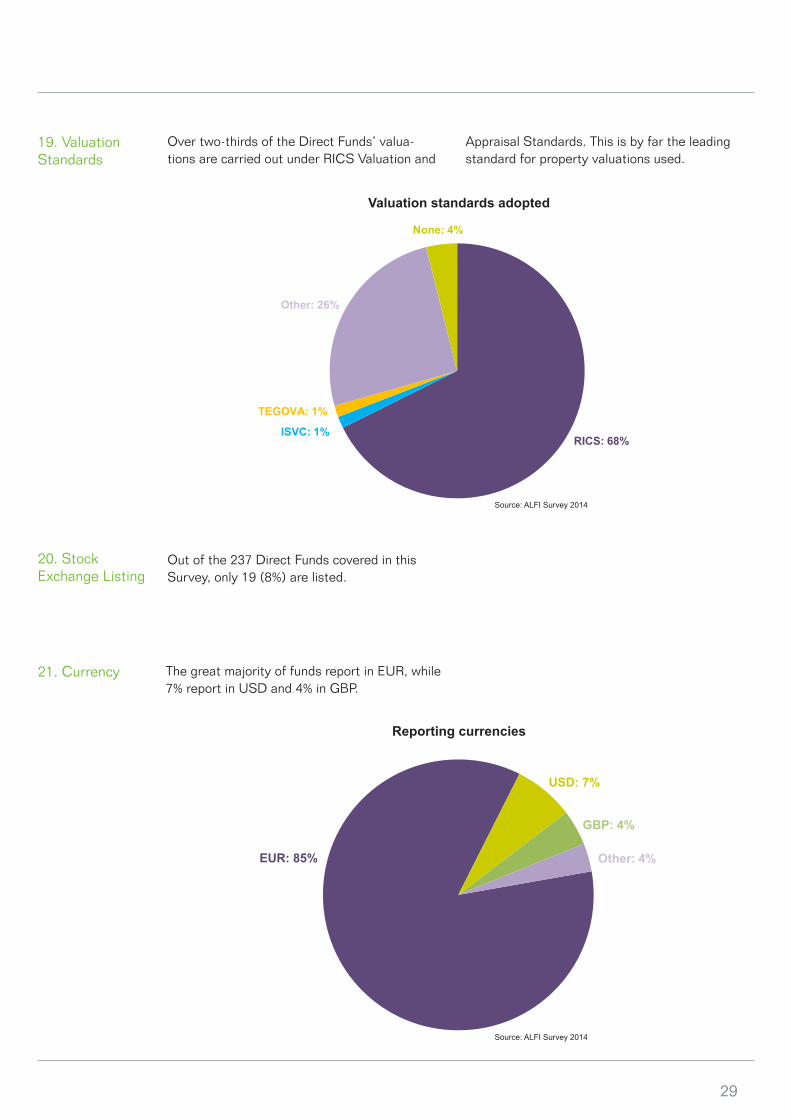
Over two-thirds of the Direct Funds’ valua-tions are carried out under RICS Valuation and
19. Valuation Standards
Appraisal Standards. This is by far the leading standard for property valuations used.
RICS: 68%ISVC: 1%
TEGOVA: 1%
Other: 26%
None: 4%
EUR: 85%
USD: 7%
GBP: 4%
Other: 4%
Valuation standards adopted
Reporting currencies
20. StockExchange Listing
21. Currency
Out of the 237 Direct Funds covered in thisSurvey, only 19 (8%) are listed.
The great majority of funds report in EUR, while 7% report in USD and 4% in GBP.
Source: ALFI Survey 2014
Source: ALFI Survey 2014
30
part II - funds of real estate investment funds
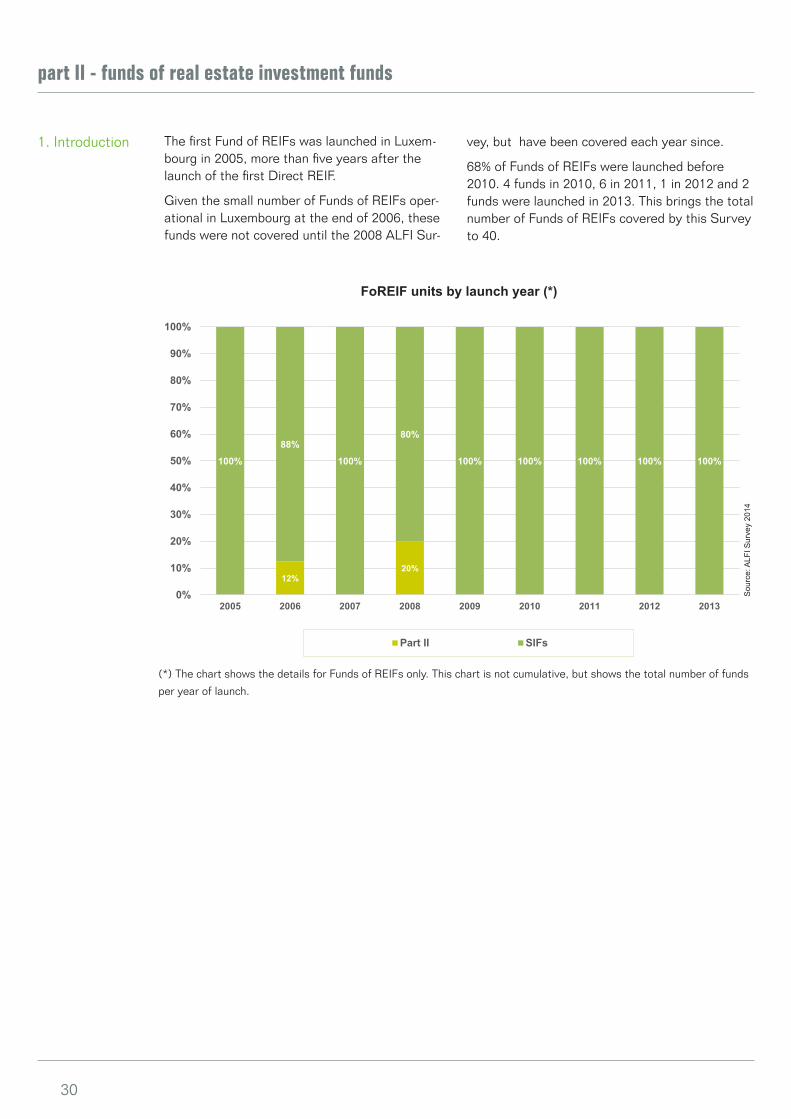
1. Introduction The first Fund of REIFs was launched in Luxem-bourg in 2005, more than five years after the launch of the first Direct REIF.
Given the small number of Funds of REIFs oper-ational in Luxembourg at the end of 2006, these funds were not covered until the 2008 ALFI Sur-
vey, but have been covered each year since.
68% of Funds of REIFs were launched before 2010. 4 funds in 2010, 6 in 2011, 1 in 2012 and 2 funds were launched in 2013. This brings the total number of Funds of REIFs covered by this Survey to 40.
12%20%
100%
88%
100%
80%
100% 100% 100% 100% 100%
0%
10%
20%
30%
40%
50%
60%
70%
80%
90%
100%
2005 2006 2007 2008 2009 2010 2011 2012 2013
Part II SIFs
FoREIF units by launch year (*)
Sou
rce:
ALF
I Sur
vey
2014
(*) The chart shows the details for Funds of REIFs only. This chart is not cumulative, but shows the total number of funds
per year of launch.

31
2. Initiator origins Out of a broad range of initiators across Europe, German initiators have been the most prolific
since 2006, accounting for 30% of the new REIF FoFs.
Origins of initiators ofdirect real estate funds
Origins of initiators offunds of real estate funds
Origin of initiators by fund unit launch year (*)
Sou
rce:
ALF
I Sur
vey
2014
Source: ALFI Survey 2014
Source: ALFI Survey 2014
Asia / Australia & New Zealand: 1.3%
Benelux: 11.5%Germany: 15%
France: 6.5%
Other Europe: 14%
Middle East: 0.4%
Nordic/Baltic: 5%
Switzerland: 8% UK: 19%
US & Other Americas: 18%
Canada: 1.3%
Benelux: 10% Germany: 31%
Nordic/Baltic: 5%
Other Americas: 3%
Other Europe: 31%
Switzerland: 5%
UK: 15%
40%
25%
50%
12%
50%
20%
50%
50%
17%
100%
50%
33%
20%
25%
50%
50%
88%
50% 50%50%
20%
0%
10%
20%
30%
40%
50%
60%
70%
80%
90%
100%
2005 2006 2007 2008 2009 2010 2011 2012 2013
France
Other Americas
UK
Switzerland
Other Europe
Nordic/Baltic
Germany
Benelux
(*) The chart shows the details for Funds of REIFs only. This chart is not cumulative, but shows the total number of funds by the year of launch.
32
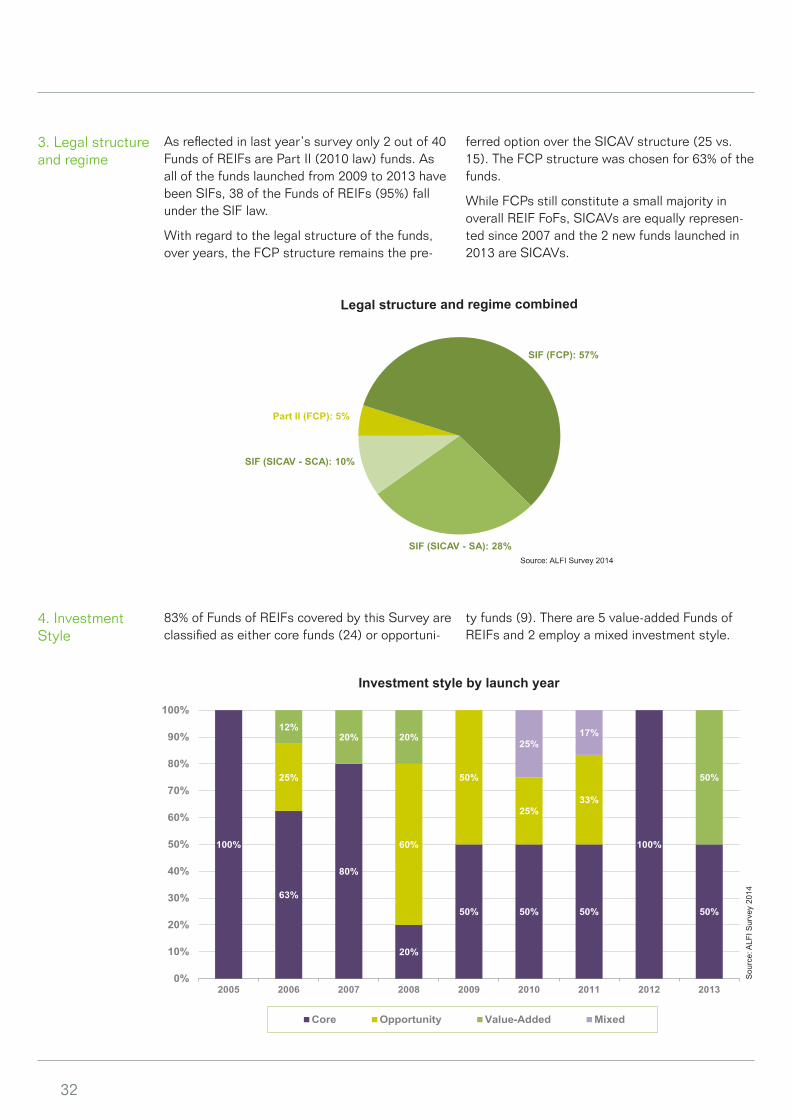
As reflected in last year’s survey only 2 out of 40 Funds of REIFs are Part II (2010 law) funds. As all of the funds launched from 2009 to 2013 have been SIFs, 38 of the Funds of REIFs (95%) fall under the SIF law.
With regard to the legal structure of the funds, over years, the FCP structure remains the pre-
ferred option over the SICAV structure (25 vs. 15). The FCP structure was chosen for 63% of the funds.
While FCPs still constitute a small majority in overall REIF FoFs, SICAVs are equally represen-ted since 2007 and the 2 new funds launched in 2013 are SICAVs.
Legal structure and regime combined
4. Investment Style
83% of Funds of REIFs covered by this Survey are classified as either core funds (24) or opportuni-
ty funds (9). There are 5 value-added Funds of REIFs and 2 employ a mixed investment style.
100%
63%
80%
20%
50% 50% 50%
100%
50%
25%
60%
50%
25%33%
12%20% 20%
50%
25%17%
0%
10%
20%
30%
40%
50%
60%
70%
80%
90%
100%
2005 2006 2007 2008 2009 2010 2011 2012 2013
Core Opportunity Value-Added Mixed
Investment style by launch year
Sou
rce:
ALF
I Sur
vey
2014
3. Legal structure and regime
Source: ALFI Survey 2014
Part II (FCP): 5%
SIF (FCP): 57%
SIF (SICAV - SA): 28%
SIF (SICAV - SCA): 10%

33
5. Liquidity Overall, the majority of Funds of REIFs (72%) are closed-ended. “Open-ended Funds of REIFs with restrictions” and “Open- ended Funds of REIFs
with no restrictions” are almost equally repre-sented in 11 fund launches, (6 funds and 5 funds respectively) since 2005.
50%
75%
100%
40%
100%
75%83%
50%
13%
25%17%
100%
50%
12%
60%50%
0%
10%
20%
30%
40%
50%
60%
70%
80%
90%
100%
2005 2006 2007 2008 2009 2010 2011 2012 2013
Closed Open - No Restrictions Open - Restrictions
Closed72%
Open - No Restrictions15%
Open - Restrictions13%
Open vs. closed-ended funds by launch year (*)
75% 75%
40%
100%
21%
20%
4%
25%40%
0%
10%
20%
30%
40%
50%
60%
70%
80%
90%
100%
Core Opportunity Value-Added Mixed
Closed
Open - NoRestrictions
Open -Restrictions
Fund investment style by liquidity
Liquidity by fund investment style
Sou
rce:
ALF
I Sur
vey
2014
Sou
rce:
ALF
I Sur
vey
2014
Source: ALFI Survey 2014
64%
83%
20%
22%
40%
7% 17%
40%
7%
0%
10%
20%
30%
40%
50%
60%
70%
80%
90%
100%
Closed Open - No Restrictions Open - Restrictions
Core
Opportunity
Value-Added
Mixed
(*) The graph shows the details for Funds of REIFs only. This chart is not cumu-lative, but shows the total number of funds by the year of launch.
34
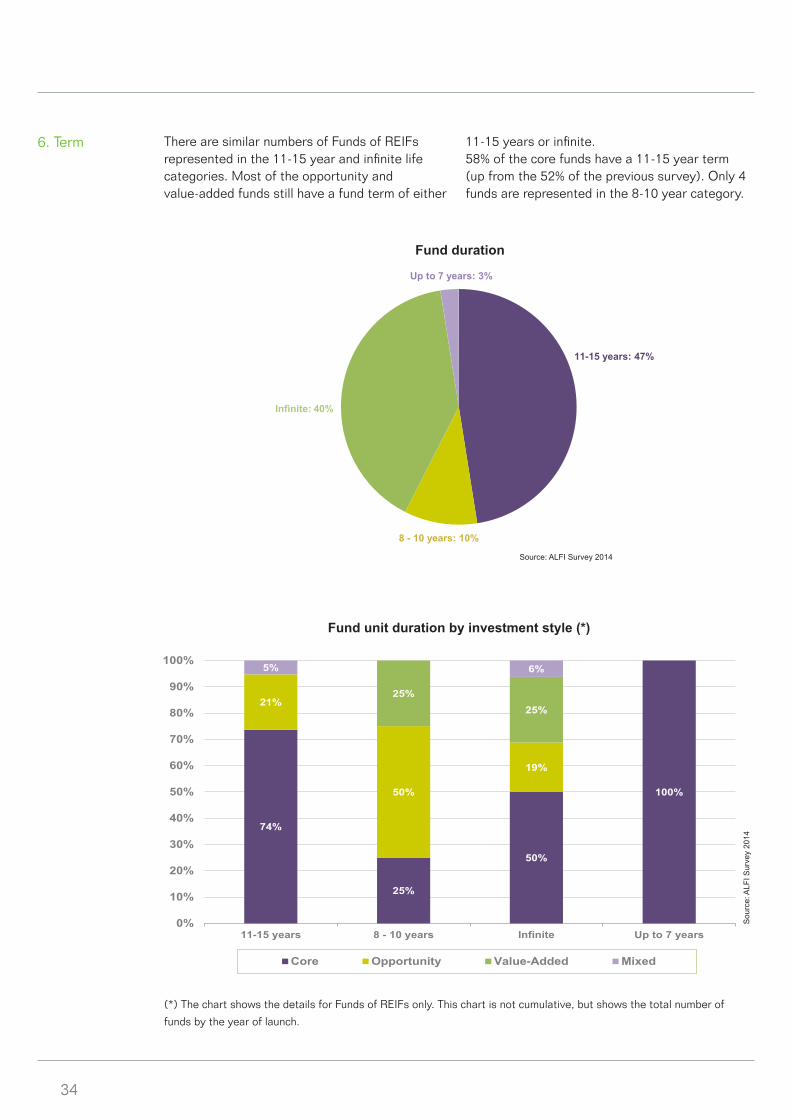
6. Term There are similar numbers of Funds of REIFsrepresented in the 11-15 year and infinite life categories. Most of the opportunity andvalue-added funds still have a fund term of either
11-15 years or infinite.58% of the core funds have a 11-15 year term (up from the 52% of the previous survey). Only 4 funds are represented in the 8-10 year category.
Fund unit duration by investment style (*)
(*) The chart shows the details for Funds of REIFs only. This chart is not cumulative, but shows the total number of
funds by the year of launch.
Sou
rce:
ALF
I Sur
vey
2014
Source: ALFI Survey 2014
Fund duration
74%
25%
50%
100%
21%
50%
19%
25%25%
5% 6%
0%
10%
20%
30%
40%
50%
60%
70%
80%
90%
100%
11-15 years 8 - 10 years Infinite Up to 7 years
Core Opportunity Value-Added Mixed
11-15 years: 47%
8 - 10 years: 10%
Infinite: 40%
Up to 7 years: 3%

35
7. Geographical focus of fund investments
While for many years, the regional focus of in-vestments often varied from one fund to another,
recent launches focused exclusively on the 28 EU member states.
Geographical focus of investments
50%
60%
24%
23%
33%
50%
45%
100%
100%
25%
10%
19%
18%
11%
25%
14%
12%
11%
20%
19%
23%
34%
33%
22%
10%
19%
24%
33%
17%
11%
5%
0% 20% 40% 60% 80% 100%
2005
2006
2007
2008
2009
2010
2011
2012
2013 EU - 28
EFTA (non EU)
Other Europe
Asia / Pacific
America - North
America -Central / South
(*) The chart shows the details for Funds of REIFs only. This chart is not cumulative, but shows the total number of
funds by the year of launch.
Non exclusive data, i.e. funds can cover one or several regions shown. The purpose of the graph is to highlight changes
in strategy over time.
Geographical investment region by fund unit launch year (*)
Source: ALFI Survey 2014
Sou
rce:
ALF
I Sur
vey
2014
EU 28 Only: 37%All Europe only: 17%
Americas Only: 3%
Asia/Pacific only: 13%
Global (ex Europe): 15% Global: 15%
36
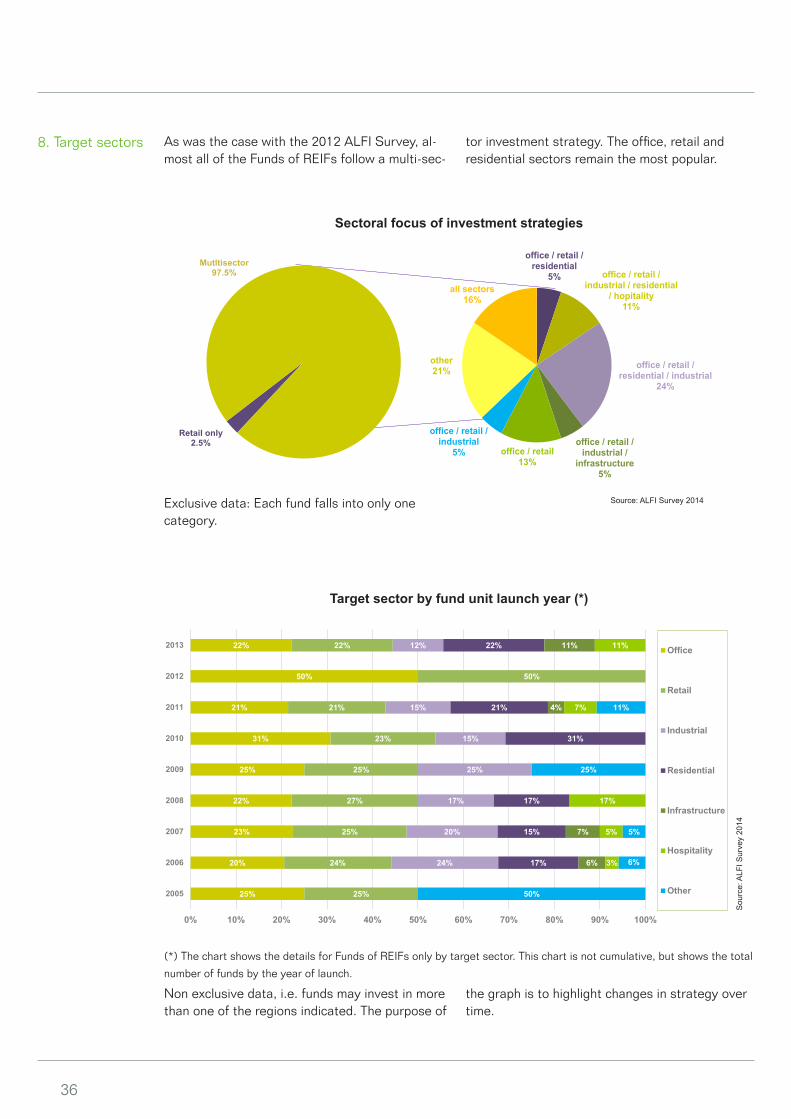
8. Target sectors As was the case with the 2012 ALFI Survey, al-most all of the Funds of REIFs follow a multi-sec-
tor investment strategy. The office, retail and residential sectors remain the most popular.
office / retail / residential
5% office / retail / industrial / residential
/ hopitality11%
office / retail / residential / industrial
24%
office / retail / industrial /
infrastructure5%
office / retail13%
office / retail / industrial
5%
other21%
all sectors16%
Retail only2.5%
Mutltisector97.5%
Source: ALFI Survey 2014
Sectoral focus of investment strategies
(*) The chart shows the details for Funds of REIFs only by target sector. This chart is not cumulative, but shows the total
number of funds by the year of launch.
Non exclusive data, i.e. funds may invest in more than one of the regions indicated. The purpose of
25%
20%
23%
22%
25%
31%
21%
50%
22%
25%
24%
25%
27%
25%
23%
21%
50%
22%
24%
20%
17%
25%
15%
15%
12%
17%
15%
17%
31%
21%
22%
6%
7%
4%
11%
3%
5%
17%
7%
11%
50%
6%
5%
25%
11%
0% 10% 20% 30% 40% 50% 60% 70% 80% 90% 100%
2005
2006
2007
2008
2009
2010
2011
2012
2013 Office
Retail
Industrial
Residential
Infrastructure
Hospitality
Other
the graph is to highlight changes in strategy over time.
Target sector by fund unit launch year (*)
Exclusive data: Each fund falls into only one category.
Sou
rce:
ALF
I Sur
vey
2014

37
9. Net AssetValue (NAV)
The 40 Luxembourg domiciled Funds of REIFs represented a total NAV of 4.4 billion euros at the end of 2013, compared to 4.6 billion euros in the previous year and 3.1 billion euros at the end
of 2011. The average NAV at 31 December 2013 was 110 million euros, ranging from 3 million eu-ros to 370 million euros. As most Funds of REIFs do not use gearing, the NAV and GAV are similar.
10. 2016 Target NAV Distribution
While we note that there is currently very little gearing in Funds of REIFs (NAV = GAV), the
information received in relation to target NAV is, unfortunately, not reliable.
NAV distribution at the end of 2013
Sou
rce:
ALF
I Sur
vey
2014
0
5
10
15
20
25
30
<100 100-200 200-400 EUR mio
fund units
38
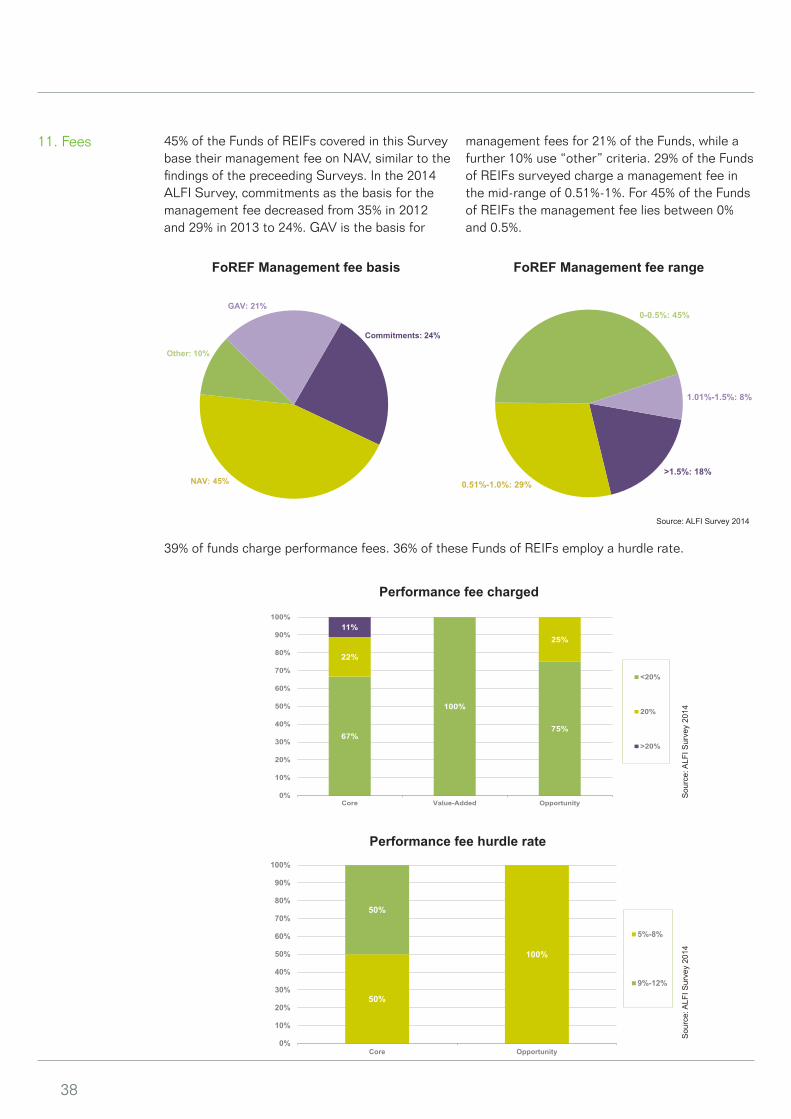
11. Fees 45% of the Funds of REIFs covered in this Survey base their management fee on NAV, similar to the findings of the preceeding Surveys. In the 2014 ALFI Survey, commitments as the basis for the management fee decreased from 35% in 2012 and 29% in 2013 to 24%. GAV is the basis for
management fees for 21% of the Funds, while a further 10% use “other” criteria. 29% of the Funds of REIFs surveyed charge a management fee in the mid-range of 0.51%-1%. For 45% of the Funds of REIFs the management fee lies between 0% and 0.5%.
FoREF Management fee basis FoREF Management fee range
Source: ALFI Survey 2014
39% of funds charge performance fees. 36% of these Funds of REIFs employ a hurdle rate.
67%
100%
75%
22%
25%11%
0%
10%
20%
30%
40%
50%
60%
70%
80%
90%
100%
Core Value-Added Opportunity
<20%
20%
>20%
50%
100%
50%
0%
10%
20%
30%
40%
50%
60%
70%
80%
90%
100%
Core Opportunity
5%-8%
9%-12%
Performance fee charged
Performance fee hurdle rate
Sou
rce:
ALF
I Sur
vey
2014
Sou
rce:
ALF
I Sur
vey
2014
>1.5%: 18%0.51%-1.0%: 29%
0-0.5%: 45%
1.01%-1.5%: 8%
Commitments: 24%
NAV: 45%
Other: 10%
GAV: 21%
39
12. Type ofInvestors
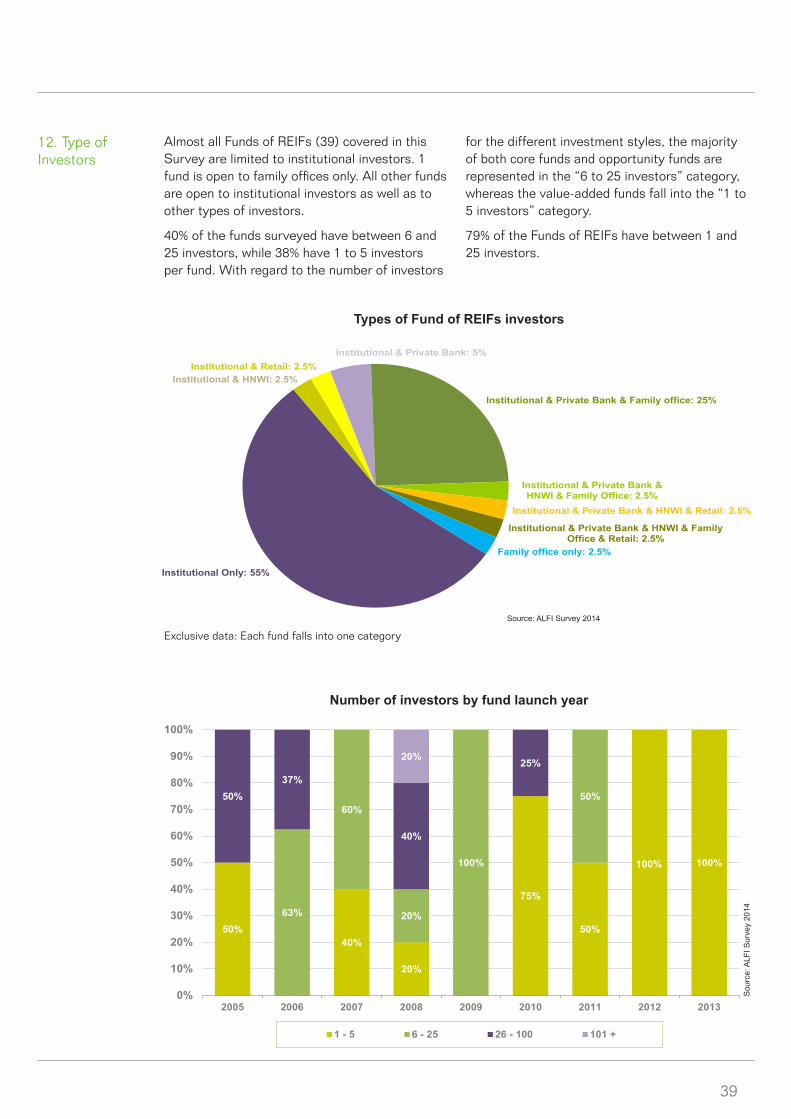
Almost all Funds of REIFs (39) covered in this Survey are limited to institutional investors. 1 fund is open to family offices only. All other funds are open to institutional investors as well as to other types of investors.
40% of the funds surveyed have between 6 and 25 investors, while 38% have 1 to 5 investors per fund. With regard to the number of investors
for the different investment styles, the majority of both core funds and opportunity funds are represented in the “6 to 25 investors” category, whereas the value-added funds fall into the “1 to 5 investors” category.
79% of the Funds of REIFs have between 1 and 25 investors.
Types of Fund of REIFs investors
50%40%
20%
75%
50%
100% 100%
63%
60%
20%
100%
50%50%37%
40%
25%20%
0%
10%
20%
30%
40%
50%
60%
70%
80%
90%
100%
2005 2006 2007 2008 2009 2010 2011 2012 2013
1 - 5 6 - 25 26 - 100 101 +
Number of investors by fund launch year
Sou
rce:
ALF
I Sur
vey
2014
Source: ALFI Survey 2014
Exclusive data: Each fund falls into one category
Institutional Only: 55%
Institutional & Retail: 2.5%Institutional & HNWI: 2.5%
Institutional & Private Bank: 5%
Institutional & Private Bank & Family office: 25%
Institutional & Private Bank & HNWI & Family Office: 2.5%
Institutional & Private Bank & HNWI & Retail: 2.5%
Institutional & Private Bank & HNWI & Family Office & Retail: 2.5%
Family office only: 2.5%
40
13. Accounting standards
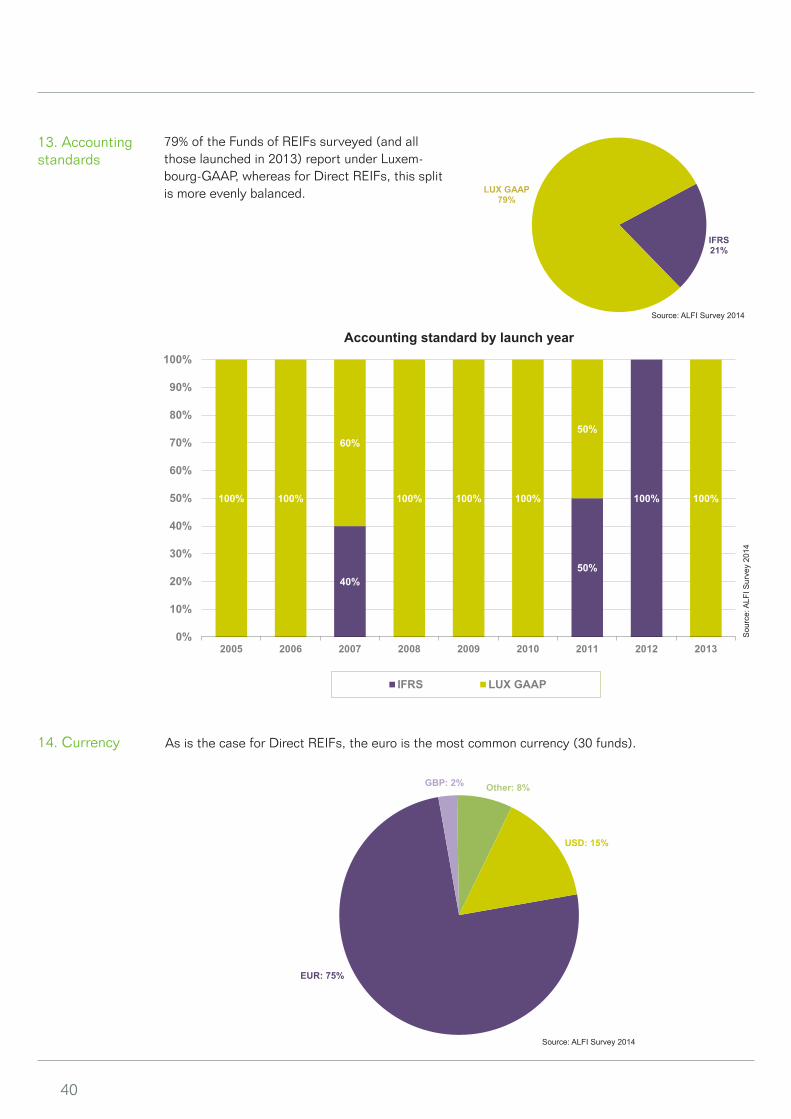
79% of the Funds of REIFs surveyed (and all those launched in 2013) report under Luxem-bourg-GAAP, whereas for Direct REIFs, this split is more evenly balanced.
40%50%
100%100% 100%
60%
100% 100% 100%
50%
100%
0%
10%
20%
30%
40%
50%
60%
70%
80%
90%
100%
2005 2006 2007 2008 2009 2010 2011 2012 2013
IFRS LUX GAAP
IFRS21%
LUX GAAP79%
Accounting standard by launch year
14. Currency As is the case for Direct REIFs, the euro is the most common currency (30 funds).S
ourc
e: A
LFI S
urve
y 20
14
Source: ALFI Survey 2014
Source: ALFI Survey 2014
EUR: 75%
GBP: 2% Other: 8%
USD: 15%
41
15. Frequency of NAV Calculation
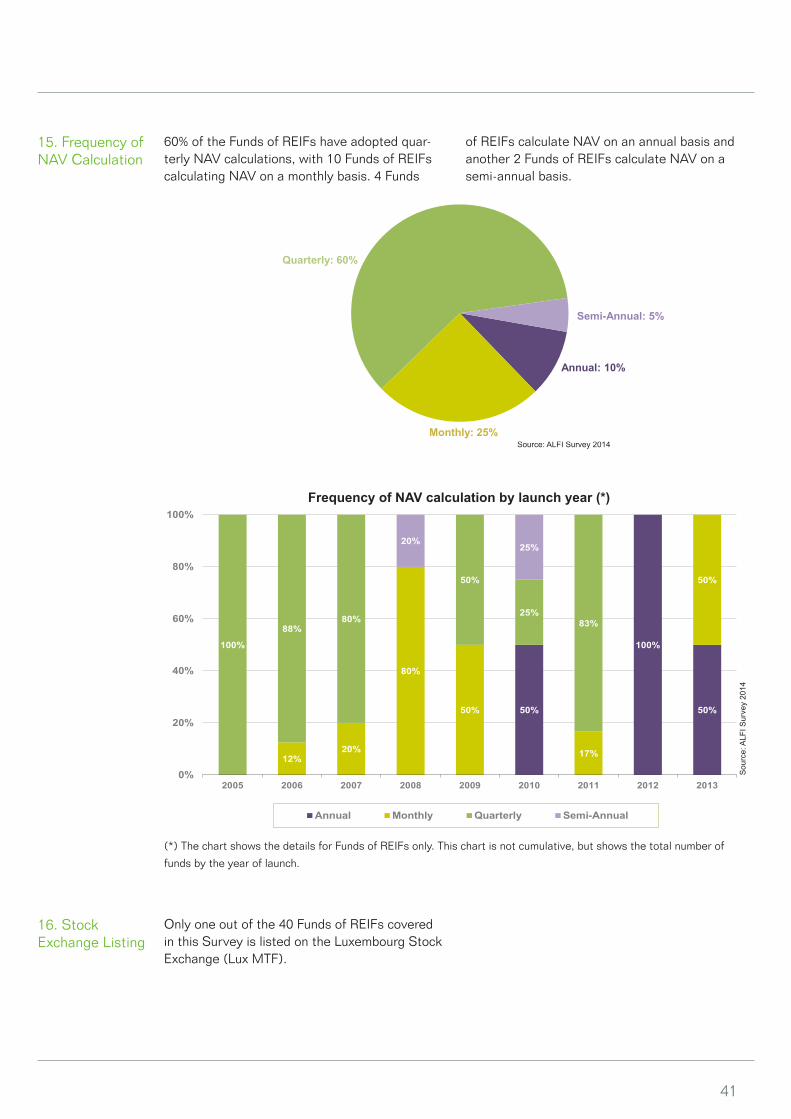
60% of the Funds of REIFs have adopted quar-terly NAV calculations, with 10 Funds of REIFs calculating NAV on a monthly basis. 4 Funds
of REIFs calculate NAV on an annual basis and another 2 Funds of REIFs calculate NAV on a semi-annual basis.
Source: ALFI Survey 2014
50%
100%
50%
12%20%
80%
50%
17%
50%
100%
88%80%
50%
25%83%
20%25%
0%
20%
40%
60%
80%
100%
2005 2006 2007 2008 2009 2010 2011 2012 2013
Annual Monthly Quarterly Semi-Annual
16. Stock Exchange Listing
Only one out of the 40 Funds of REIFs covered in this Survey is listed on the Luxembourg Stock Exchange (Lux MTF).
Frequency of NAV calculation by launch year (*)
(*) The chart shows the details for Funds of REIFs only. This chart is not cumulative, but shows the total number of
funds by the year of launch.
Sou
rce:
ALF
I Sur
vey
2014
Annual: 10%
Monthly: 25%
Quarterly: 60%
Semi-Annual: 5%
42
Service providers
Appendix
The following service providers (listed in alphabetical order) were identified in the responses to the survey:
Accounting - Lux Holdco’s (23)
• A3T S.A.• Alter Domus Alternative Asset Fund Ad-
ministration S.à r.l.• Banque de Patrimoines Privés• Brown Brothers Harriman (Luxembourg)
S.C.A.• CACEIS Bank Luxembourg• CITCO REIF Services (Luxembourg) S.A.• Citibank International Plc (Luxembourg
Branch)• Edmond de Rothschild (Europe)• European Fund Administration S.A.• Experta Corporate and Trust Services S.A. • Finexis S.A.• Fund Solutions SCA• Grant Thornton Abax Investment Services
S.A.• Internos Luxembourg• Intertrust (Luxembourg) S.à.r.l• KPMG• Luxembourg Fund Services S.A.• Pandomus• RBC Investor Services Bank S.A.• RBC Wealth Management• SGG S.A.• TMF Luxembourg S.A.• Trident Trust Company (Luxembourg) S.A.
Accounting - Non Lux SPVs (15)
• Alter Domus Alternative Asset Fund Ad-ministration S.à r.l.
• Brown Brothers Harriman (Luxembourg) S.C.A.
• CITCO REIF Services (Luxembourg) S.A.• EY• Forest Info OÜ• GFB Rio Assessoria Contabil Ltda• Golub, Lacapra, Wilson & De Tiberiis LLP• Grant Thornton Abax Investment Services
S.A.• Internos Luxembourg• Knox House Trust Ltd• KPMG• Partners Group• Secured capital / Corwe Horvath• TMF Luxembourg S.A.• Trident Trust Company (Luxembourg) S.A.
Auditors (10)
• Artemis Audit & Advisory• BDO• Deloitte• EY• Grant Thornton• HRT Révision• KPMG• Mazars• PricewaterhouseCoopers• RSM Audit Luxembourg
Depositaries (28)
• ABN Amro Bank (Luxembourg) S.A.• Alter Domus Depositary Services S.à r.l.• Banque de Luxembourg S.A.• Banque de Patrimoines Privés• Banque et Caisse d’Epargne de l’Etat, Lux-
embourg• Banque Internationale à Luxembourg• Banque LBLux SA• BGL BNP Paribas S.A.• BNP Paribas Securities Services, succurs-
ale de Luxembourg• Brown Brothers Harriman (Luxembourg)
S.C.A.• CACEIS Bank Luxembourg• Citco Bank Nederland N.V., Luxembourg
Branch• Citibank International Plc (Luxembourg
Branch)• Credit Suisse (Luxembourg) S.A.• DekaBank Deutsche Girozentrale Luxem-
bourg S.A.• DZ Privatbank S.A.• Edmond de Rothschild (Europe)• EFG Bank (Luxembourg) S.A.• ING luxembourg S.A.• KBL European Private Bankers S.A.• M.M. Warburg & CO Luxembourg S.A.• Pictet & Cie (Europe) SA• RBC Investor Services Bank S.A.• RBS Global Banking (Luxembourg) S.A.• Skandinaviska Enskilda Banken S.A.• Société Générale Bank & Trust • UBS Luxembourg S.A.• VP Bank (Luxembourg) S.A.
43
Central administrations (including Transfer Agents) (47)
• Adepa Asset Management S.A.• Alcyon S.A.• Alter Domus Alternative Asset Fund Ad-
ministration S.à r.l.• Apex Fund Services (Malta) Limited, Lux-
embourg branch• Atlantic Fund Services S.A.• Bank of New York Mellon (Luxembourg)
S.A.• Banque de Patrimoines Privés• Banque et Caisse d’Epargne de l’Etat, Lux-
embourg• Banque LBLux S.A.• BNP Paribas Securities Services, succurs-
ale de Luxembourg• Brown Brothers Harriman (Luxembourg)
S.C.A.• CACEIS Bank Luxembourg• CF Fund Services S.A.• Citco Fund Services (Luxembourg) S.A.• CITCO REIF Services (Luxembourg) S.A.• Citibank International Plc (Luxembourg
Branch)• Credit Suisse Fund Services (luxembourg)
S.A.• Deka International S.A. • Edmond de Rothschild (Europe)• European Fund Administration S.A.• Experta Corporate and Trust Services S.A. • Fil Investment Management (Luxembourg)
S.A.• Finexis S.A.• Fund Solutions SCA• Grant Thornton Abax Investment Services
S.A.• Heitman International S.à r.l.• Hines Luxembourg S.à r.l.• Intertrust (Luxembourg) S.à.r.l• Invesco Real Estate Management S.à r.l.• Kredietrust Luxembourg S.A.• LRI Invest S.A.• Luxembourg Fund Services S.A.• Luxglobal Trust Services S.A.• M.M. Warburg & CO Luxembourg S.A.• Pandomus• ProLogis Management Services S.à r.l.• Quilvest Luxembourg Services S.A.• RBC Investor Services Bank S.A.
• Schroder Investment Management (Luxem-bourg) S.A.
• SEB Asset Management S.A.• SEB Fund Services S.A.• SGG S.A.• Trident Trust Company (Luxembourg) S.A.• Union Investment Luxembourg S.A.• United International Management S.A.• Universal-Investment-Luxembourg S.A.• VPB Finance S.A.
Domiciliation and Corporate (31)
• Adepa Asset Management S.A.• Alcyon S.A.• Alter Domus Alternative Asset Fund Ad-
ministration S.à r.l.• Apex Fund Services (Malta) Limited, Lux-
embourg branch• Atlantic Fund Services S.A.• AVANA Investment Management Company
S.à r.l.• Banque de Luxembourg S.A.• Banque de Patrimoines Privés• Banque LBLux S.A.• Brown Brothers Harriman (Luxembourg)
S.C.A.• CACEIS Bank Luxembourg• CF Fund Services S.A.• CITCO REIF Services (Luxembourg) S.A.• Citibank International Plc (Luxembourg
Branch)• Edmond de Rothschild (Europe)• European Fund Administration S.A.• Experta Corporate and Trust Services S.A. • Finexis S.A.• Fund Solutions SCA• Grant Thornton Abax Investment Services
S.A.• Intertrust (Luxembourg) S.à r.l.• Invesco Real Estate Management Sàrl• Kredietrust Luxembourg S.A.• LRI Invest S.A.• Luxembourg Fund Services S.A.• Partners Group (Lux) S.à r.l.• RBC Investor Services Bank S.A.• SGG S.A.• Structured Invest S.A.• Trident Trust Company (Luxembourg) S.A.• United International Management S.A.
44
Legal Advisors (25)
• Allen & Overy• AMMC Law• Anold & Porter (UK) LLP• Arendt & Medernach• Ashurst LLP• Baker & McKenzie• Bonn & Schmitt Avocats• Bonn Steichen & Partners• Chevalier & Sciales• Clifford Chance• CMS DeBacker Luxembourg• Dechert Luxembourg• Duvieusart Ebel, avocats associés• Elvinger Hoss & Prussen• Etude DELAGARDELLE Law• Lexfield• Linklaters LLP• Loyens & Loeff• MNKS• OGIER (Luxembourg)• OPF Partners• Peuvrel & Cayphas• SCRM• Speechly Bircham Luxembourg• Wildgen, Partners in law
Tax Advisors (19)
• Allen & Overy• Arendt & Medernach• Artemis Audit & Advisory• ATOZ• BDO• Bonn & Schmitt Avocats• Capita Fiduciary• Clifford Chance• D.M.S et Associés• Deloitte• Elvinger Hoss & Prussen• EY• Grant Thornton• KPMG• Linklaters LLP• Loyens & Loeff• OPF Partners• PricewaterhouseCoopers• RSM
45
2010 Law
2007 Law
AIFMD
CSSF
Direct Fund
EFTA
EU 28
EU Accession
EFTA (non EU)
Emerging Europe
FCP
FoREIF
GAAP
GAV
HNW
HNWI
Indirect Fund
IFRS
Initiator
INREV
Investment style
The law of December 17, 2010 on Undertakings for Collective Investment as may be amended from time to time (“UCIs”)
The law of February 13, 2007 on Specialized Invesment Funds as amended (“SIFs”)
Alternative Investment Fund Managers Directive, Directive 2011/61/EU of the EP and of the Council of 8 June 2011
Commission de Surveillance du Secteur Financier (Luxem-bourg supervisory authority for the financial sector)
Fund investing in property assets or structures holding prop-erty assets
European Free Trade Association
Austria, Belgium, Bulgaria, Croatia, Cyprus, Czech Repub-lic, Denmark, Estonia, Finland, France, Germany, Greece, Hungary, Ireland, Italy, Latvia, Lithuania, Luxembourg, Malta, Netherlands, Poland, Portugal, Romania, Slovakia, Slovenia, Spain, Sweden, United Kingdom
Iceland, Montenegro, Former Yugoslav Republic of Macedo-nia, Serbia, Macedonia, Turkey
Norway, Lichtenstein, Switzerland, Iceland
Albania, Belarus, Bosnia & Herzegovina, Moldova, Russia, Turkey
Fonds Commun de Placement: Common fund, entity without legal personality based on contractual agreement
Fund of Real Estate Investment Fund
Generally Accepted Accounting Principles
Gross Asset Value
High Net Worth
High Net Worth Individual
Fund investing in real estate securities or other Real Estate Funds
International Financial Reporting Standards
Initiator origin region : Europe, Asia/Pacific/ME, Americas
Initiator origin country : The country of the ultimate parent should be used
European Association for Investors in Non-listed Real Estate Vehicles
Core : Stable income returns, stabilised properties located in strong and low risk markets; geared at less than 50%
Value Added : combination of Income and capital return; stabilised properties located in low to medium risk markets, as well as an element in development or opportunistic invest-ments; geared from 40% to 70%
glossary

46
Opportunistic : primarily through capital return; higher risk properties (e.g development projects, property repositioning, assets in higher risk countries or distressed assets); geared is in excess of 60%
International Standards Valuation Committee
Closed-ended : Fund may not, at the request of investors, repurchase directly or indirectly their units or shares
Open-ended : Fund may, at the request of investors, repur-chase directly or indirectly their units or shares
Open-ended with restriction : in addition subject to further conditions such as maximum number of units to be redeemed in a period; extended notice period; early redemption penal-ties etc.
Semi-open ended : series of distinct equity offerings after the initial launch, but not on a continuous basis; ability of investors to redeem capital at certain times during the fund life; infinite life.
Luxembourg Stock Exchange
Net Asset Value
Real Estate Investment Fund
The Royal Institution of Chartered Surveyors
Sociéte anonyme (public limited company)
Société en commandite par actions (partnership limited by shares)
Société en commandite simple (limited partnership)
Société d’investissement à capital fixe (investment company with fixed capital)
Société d’Investissement en Capital à Risque (investment company in risk capital)
Société d’investissement à capital variable (investment com-pany with variable capital)
Fonds d’investissement spécialisé (specialized investment fund)
Société de participations financières (financial holding com-pany)
Special Purpose Vehicle
The European Group of Valuers’ Associations
Undertaking for Collective Investment
ISVC
Liquidity
MTF
NAV
REIF
RICS
SA
SCA
SCS
SICAF
SICAR
SICAV
SIF
SOPARFI
SPV
TEGOVA
UCI

47
acknowledgements
The ALFI Real Estate Funds Sub-Committee would like to thank the following people for their efforts in compiling the data and commentary for the ALFI REIF Survey 2014.
Members of the REIF Publications Working Group:
Catherine Gauthier Brown Brothers Harriman (Luxembourg) S.C.A.Francesco Piantoni Aviva Investors Luxembourg S.A.Johan Terblanche Dechert LLP (WG Co-Chair) Keith Burman ManagementPlus (Sub-Committee Chair) Michael Hornsby EY (Sub-Committee Chair)Robert Hessing Intertrust (WG Co-Chair) Valerie Tollet Deloitte
and
David Zackenfels Association of the Luxembourg Fund Industry - ALFIJean-Jacques Picard Association of the Luxembourg Fund Industry - ALFIRégine Rugani Association of the Luxembourg Fund Industry - ALFI
The ALFI Real Estate Funds Sub-Committee repeats this Survey on an annual basis in the most com-prehensive form possible. ALFI encourages any relevant fund initiators or depositaries who were not included in the 2014 ALFI Survey to contact ALFI before May 2015 to ensure inclusion.
Editor: ALFI a.s.b.l. Photo credits: © ALFI - Régine Rugani

guidelines
alfi - association of the luxemborg fund industry
B.P. 206L-2012 Luxembourg
Tel: +352 22 3026-1Fax: +352 22 30 93
November 2014