Lung Ultrasound Interpretation - Mosby...cardiac contractions to the pleura. Lung pulse signifies...
62
Transcript of Lung Ultrasound Interpretation - Mosby...cardiac contractions to the pleura. Lung pulse signifies...


63
C H A P T E R 9Lung Ultrasound InterpretationIrene Ma � Vicki E. Noble
BackgroundA sonographic assessment of discrete points over the chest wall allows providers to gather a global, accurate assessment of underlying lung pathology.1–3 The interpretation of lung ultrasound patterns requires knowledge and understanding of the unique interactions of ultrasound waves within air-fluid interfaces in both normal and pathologic states. This chapter reviews the characterization of discrete lung ultrasound patterns that allow immediate clinical application in the management and monitoring of patients.
Lungs are predominantly filled with air in the normal state. The lung parenchyma has a fine architecture of pulmonary lobules surrounding respiratory bronchioles. A small amount of serous fluid lubricates the space between the visceral and parietal pleura. Air within the normal lung, directly beneath the vis-ceral pleura, serves as an acoustic barrier to the penetration of ultrasound waves. The normal interlobular and intralobular septa are below the resolution of common ultrasound frequen-cies, and ultrasound waves cannot propagate in air-filled, “dry” lungs with microns-thick septa. The inability of ultrasound waves to propa-gate in normal lungs is the key characteristic
defining the utility of lung ultrasound. As soon as the septa are widened or distended with interstitial fluid due to either permeability defi-cits or elevated hydrostatic pressure, ultrasound waves can propagate into the lung, and the ear-liest finding of lung fluid accumulation is seen as B-lines. As fluid continues to accumulate in the interstitium, alveoli, and eventually pleura, the pathologic findings progress along a spec-trum of air/fluid ratios, from B-lines to alveolar consolidation to pleural effusion (Fig. 9.1).1
Image Interpretation
NORMAL LUNG
The normal lung has three sonographic fea-tures: A-lines, lung sliding, and the curtain sign at the lung bases.
A-lines appear as horizontal lines deep to the pleural line. They are produced by pleural line reverberations from sound waves trapped between the skin/transducer interface and pleura. The distance between two successive A-lines is the same as the distance between the transducer and the pleural line (Fig. 9.2, Video 9.1). The pleura’s dense fibrinous nature makes it highly reflective. There are two reasons why normal aerated lung parenchyma
K E Y P O I N T S
• Normal lung aeration pattern on ultrasound is defined by pleural sliding and A-lines throughout the lungs as well as curtain sign at the lung bases. Although termed “normal aeration”, this pattern can be seen in diseases such as asthma, obstructive lung disease, and pulmonary embolism.
• Presence of lung sliding rules out pneumothorax at the point of interrogation, but absence of lung sliding can be due to causes other than pneumothorax.
• In alveolar consolidation patterns, differentiation between atelectasis and pneumonia requires a visual assessment of lung volume loss vs. gain of the consolidated lobe, and inclusion of other clinical data.

64 2—LUNGS AND PLEURA
as at the lung apices, or when the patient is taking shallow breaths. Providers use M-mode to confirm lung sliding, especially when lung sliding is not obvious by two-dimensional ultrasound. M-mode depicts the movement of all tissues along a single scan line over time. The normal respiratory movement of the vis-ceral pleura by M-mode is referred to as the “seashore” sign (Fig. 9.3).4 The chest wall is less mobile, appearing as a series of horizon-tal lines, whereas the lung parenchyma is more mobile; it moves back and forth, giving it a grainy appearance by M-mode. The chest wall represents the “calm sea” and the lung paren-chyma represents the “rough sand” of the sea-shore sign. Additionally, normal pleura should be uniformly thin (<0.3 mm) and without irregularities.5 Zooming into the pleura may help to better characterize pleural irregularities.
Adjacent to the diaphragm, the normally aerated lung base appears as an impenetrable “curtain” that obscures the area where the diaphragm and subdiaphragmatic structures (i.e., liver/spleen) were seen before respiratory descent (Fig. 9.4 and Video 9.4).
A normal lung ultrasound exam shows a thin pleural line with lung sliding and A-lines throughout both hemithoraces and the curtain sign at the lung bases. These findings allow cli-nicians to conclude that the lung parenchyma is normally aerated or “dry.” When these normal findings appear bilaterally in a dyspneic patient, the differential diagnosis is similar to that of a dyspneic patient with a normal chest radiograph: (1) obstructive airway diseases, such as chronic obstructive pulmonary disease (COPD) or asthma; (2) pulmonary embolism; or (3) nonpulmonary causes (neurologic, neu-romuscular, or acid/base disorders; or disor-ders with reduced oxygen-carrying capacity).
is not visualized by ultrasound: (1) air beneath the pleural line scatters any sounds waves that penetrate through the pleura and (2) normal subpleural interlobular septa are so thin that they fall below the resolution of ultrasound. Therefore A-lines are horizontal lines beneath the pleura that occur at regular intervals, signify that air is present below the pleural line, and are seen with normal air-filled lung parenchyma.
Lung sliding is a dynamic finding seen in healthy lungs when the visceral and parietal pleural surfaces are apposed and the visceral pleural surface moves freely with respirations (Videos 9.2 and 9.3). This dynamic movement of the pleural line has a shimmering appear-ance. The movement may be difficult to appre-ciate where there is less lung movement, such
A B C D
Air Fluid
Figure 9.1 Air/Fluid Ratios and Lung Artifacts. (A) A-lines are seen in a “dry” lung, with no fluid-filled or thickened interlobular septa. (B) B-lines appear as fluid begins to widen the interlobular septa. (C) Consolidation pattern is seen when fluid completely fills the alveoli, displacing air. (D) Pleural effusion with consolidation pattern from compressive atelectasis is seen with fluid accumulation in the pleural space.
Chest wall
Pleural lineRib
Ribshadow
A-lines
Figure 9.2 A-Lines. A-lines are a type of reverberation artifact that appears as horizontal, hyperechoic lines seen deep to the pleural line, repeating at the same distance as between the transducer and the pleural line.

9—LUNG ULTRASOUND INTERPRETATION 65
PATHOLOGIC LUNG
The diseased lung can generally be character-ized by looking at three abnormal findings: absence of lung sliding, B-lines, and consolida-tion (Table 9.1).
ABSENCE OF LUNG SLIDING
As discussed previously, lung sliding is caused by independent respiratory movements of the visceral pleural surface when directly apposed against the parietal pleura. When lung sliding is absent, it is pathologic, and suggests the pos-sibility of a pneumothorax. Air accumulation in between the visceral and parietal pleura
The main utility of the identification of diffuse normal sonographic findings is to effectively rule out the presence of significant pulmonary edema, pneumonia, and pneumo-thorax. To further evaluate the undifferenti-ated dyspneic patient, the ultrasound approach may include a search for deep venous throm-bosis (DVT; see Chapter 34), assessment of the inferior vena cava (IVC; see Chapter 17), and evaluation of left ventricular systolic function (see Chapter 15). The presence of a positive DVT scan in patients with acute respiratory failure but normal lung ultrasound may result in a specificity and positive predictive value for pulmonary embolism as high as 99% and 94%, respectively.1
Pleural line
A-line
Soft tissue
Pleural line
A-line
Chestwall(sea)
Lung(sand)
Figure 9.3 Normal Lung in M-Mode (“Seashore Sign”). The horizontal lines above the pleural line represent the “sea” which is the relatively immobile soft tissue of the chest wall. The grainy tissue below the pleural line represents the “sand” which is the relatively mobile aerated lung parenchyma.
Lu
ng
Figure 9.4 Curtain Sign. Air within the descending lung base obscures the area above the descending diaphragm as the lung descends during inspiration.

66 2—LUNGS AND PLEURA
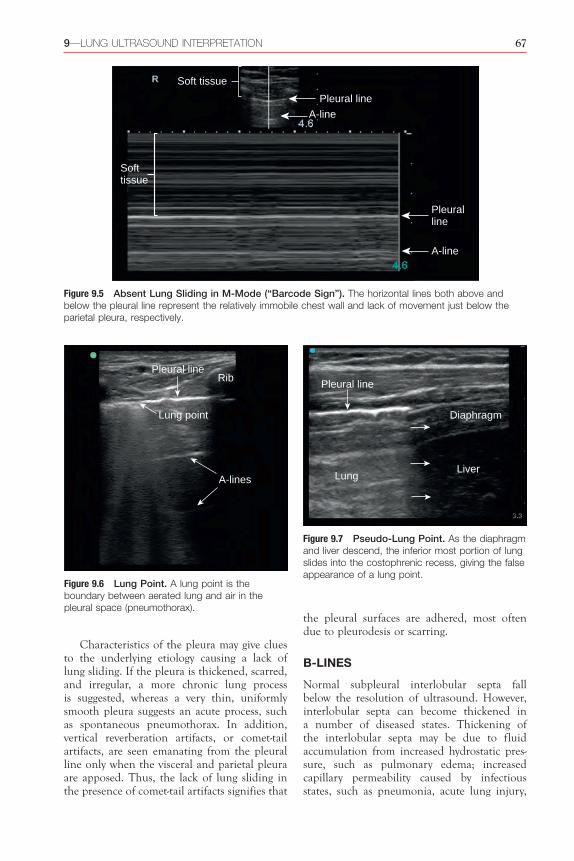
Fortunately, there is a sign that is rela-tively specific to pneumothorax called the lung point. This dynamic sign is caused by an edge of normal aerated lung sliding into view within an interspace where absent lung sliding and A-lines are seen. As the visceral pleura expands and slides into the interspace being examined, pleural air from the pneumotho-rax is pushed away by normal lung, and the sliding visceral pleura can be seen (Fig. 9.6, Video 9.8). Lung point is defined as a sudden appearance of lung sliding and should not be confused with the inferior edge of the lung sliding into view along the heart border or at the lung bases where the “curtain sign” is seen (Fig. 9.7 and Video 9.9). Lung point is 100% specific for pneumothorax and may be localized by sliding the transducer laterally. An estimation of the size of a pneumothorax can be performed by assessing the distance laterally between the sternum and lung point. Large pneumothoraces will have a more lateral lung point.4,8,9
Although only one sign (lung point) is spe-cific for pneumothorax, the presence of a number of findings can rule out pneumotho-rax at the site of ultrasound interrogation, including lung sliding, B-lines (see below), and lung pulse.7 Lung pulse is observed as rhythmic pleural pulsations due to the transmission of cardiac contractions to the pleura. Lung pulse signifies that the visceral and parietal pleura are apposed (Video 9.10).10
obscures visualization of the visceral pleura which is displaced away from the parietal pleura by air (Videos 9.5 and 9.6). However, pneumo-thorax is not the only cause of absent lung sliding, given that pleurodesis (chemical pleu-rodesis, infectious or inflammatory states, or fibrotic lung diseases), lung volume loss (com-plete atelectasis, mucous plugging, pneumonec-tomy), and reduced or absent lung ventilation (apnea, mainstem intubation) also cause a lack of lung sliding (Video 9.7).6 Thus absence of lung sliding is not specific to pneumothorax, but presence of lung sliding definitively rules out pneumothorax with 100% specificity at the site of interrogation.7
When absence of lung sliding is due to causes other than pneumothorax, the absence of lung sliding is “real”—the visceral pleura is truly not moving even though the visceral and parietal pleura are apposed. However, in pneu-mothorax, the visceral pleura is moving, but this movement cannot be visualized because the air trapped in the pleural space scatters all ultrasound waves, preventing them from prop-agating deep enough to reflect off the visceral pleura. Thus, only the immobile parietal pleura is seen, resulting in visualization of absent lung sliding. Lack of movement deep to the parietal pleura can be confirmed using M-mode. The static appearance of the M-mode pattern both above and below the pleural line result in a pattern commonly called the “barcode sign” or “stratosphere sign” (Fig. 9.5).2
Condition Ultrasound Findings
Cardiogenic pulmonary edema
• Diffuse bilateral B-lines• Normal lung sliding• Pleural effusion may be present
Pneumonia • Early:FocalunilateralB-lines,normallungsliding• Advanced:ConsolidationboundedbyB-lines,dynamicairbronchograms,
reduced or absent lung sliding• Pleuraleffusionmaybepresent
COPD or asthma • BilateralA-lineswithnormallungsliding• ReducedorabsentlungslidingwithoutlungpointinsevereCOPD/asthma
Pulmonary embolism • BilateralA-lines• Deepvenousthrombosis
Pneumothorax • Absent lung sliding with lung point• Absent anterior B-lines
COPD, Chronic obstructive pulmonary disease.
TABLE 9.1 Summary of Pathologic Lung Ultrasound Findings
9—LUNG ULTRASOUND INTERPRETATION 67
the pleural surfaces are adhered, most often due to pleurodesis or scarring.
B-LINES
Normal subpleural interlobular septa fall below the resolution of ultrasound. However, interlobular septa can become thickened in a number of diseased states. Thickening of the interlobular septa may be due to fluid accumulation from increased hydrostatic pres-sure, such as pulmonary edema; increased capillary permeability caused by infectious states, such as pneumonia, acute lung injury,
Characteristics of the pleura may give clues to the underlying etiology causing a lack of lung sliding. If the pleura is thickened, scarred, and irregular, a more chronic lung process is suggested, whereas a very thin, uniformly smooth pleura suggests an acute process, such as spontaneous pneumothorax. In addition, vertical reverberation artifacts, or comet-tail artifacts, are seen emanating from the pleural line only when the visceral and parietal pleura are apposed. Thus, the lack of lung sliding in the presence of comet-tail artifacts signifies that
Soft tissue
Pleural line
A-line
Softtissue
Pleuralline
A-line
Figure 9.5 Absent Lung Sliding in M-Mode (“Barcode Sign”). The horizontal lines both above and below the pleural line represent the relatively immobile chest wall and lack of movement just below the parietal pleura, respectively.
Pleural lineRib
Lung point
A-lines
Figure 9.6 Lung Point. A lung point is the boundary between aerated lung and air in the pleural space (pneumothorax).
Pleural line
Diaphragm
LiverLung
Figure 9.7 Pseudo-Lung Point. As the diaphragm and liver descend, the inferior most portion of lung slides into the costophrenic recess, giving the false appearance of a lung point.

68 2—LUNGS AND PLEURA
• B-linesmovewithlungsliding.• B-lines extend to the periphery of the far
field on the screen.The artifacts that are sometimes confused
with B-lines include E-lines and Z-lines. E-lines are similar in appearance to B-lines except that they do not arise from the pleural line.6
Seen in subcutaneous emphysema, E-lines are artifacts caused by the presence of air in the subcutaneous tissues. Although Z-lines do arise from the pleural line, they have the following features that allow them to be differentiated from B-lines2:• Z-lines do not extend to the bottom of
the screen and usually attenuate after 2 to 4 cm.
• Z-lines are less echogenic than the pleuralline.
• Z-linesarenotasdiscreteasBlinesanddonot move with the pleural line.
• Z-lineshavenopathologic significanceandare often seen in normal patients.
CONSOLIDATION
When the alveoli are filled with fluid (pneu-monia) or are collapsed (atelectasis), the lack of air in the lung parenchyma facilitates propaga-tion of ultrasound waves, allowing visualization of the lung. Lung parenchyma becomes well defined with echogenicity similar to the liver, referred to as hepatization (Fig. 9.9 and Video 9.12). Large basilar consolidations by the liver, spleen, and dome of the diaphragm can easily be detected by ultrasound though often remain-ing occult on portable chest radiographs.16–19 It is important to understand that “alveolar con-solidation pattern” is descriptive and not diag-nostic, given its multiple possible etiologies. Additional clinical findings can help differen-tiate between consolidation due to pneumonia versus compressive or resorptive atelectasis.
Pneumonia
Compared with chest radiographs, lung ultra-sound has higher sensitivity for the diagnosis of pneumonia.20,21 In a systematic review, the pooled sensitivity of lung ultrasound was 93% compared with 54% for chest radiographs for the diagnosis of pneumonia, using chest com-puted tomography as the gold standard.21
Lobar pneumonia results in consolidation, which appears as a tissue-like density of the lung (hepatization) without volume loss (Video 9.13).22 Consolidation that is not translobar
or pulmonary hemorrhage; or from collagen, fibrous tissue, or cellular deposition, such as lymphangitic carcinomatosis, interstitial lung diseases, sarcoidosis, or other inflammatory diseases. In these conditions, the widened interlobular septa propagate ultrasound waves, producing a comet-tail reverberation artifact known as B-lines (Fig. 9.8 and Video 9.11).7,11
B-lines are often remembered as being similar to Kerley B-lines seen on conventional chest radiographs.12 Isolated B-lines can been seen in the lung bases due to gravity-dependent fluid widening the septa.11 Fissures can also produce a single B-line. To be pathologic, three or more B-lines must be present in a single rib interspace.7
Mapping the distribution of B-lines can assist in narrowing the differential diagnoses, similar to interpreting bilateral versus unilat-eral opacities on chest radiographs. Bilateral B-lines are present in conditions such as pulmo-nary edema, diffuse interstitial pneumonitis/infections, acute respiratory distress syndrome, and interstitial lung disease.7,13,14 Unilateral or focal B-lines are commonly seen in conditions such as focal pneumonia, atelectasis, lung con-tusion, pulmonary infarct, or malignancy.15
B-lines are commonly confused with other vertically appearing artifacts. B-lines are defined by the following distinctive features, which should be noted during interpretation:• B-lines are ray-like, hyperechoic, vertical,
and discrete.• B-linesemanatefromthepleuralline,never
above the pleural line.
Pleural line B lines
Figure 9.8 B-Lines. B-lines are seen when interlobular septa are thickened due to fluid or scarring. B-lines are also called “lung rockets.”

9—LUNG ULTRASOUND INTERPRETATION 69
punctiform particles (air bubbles) within the bronchioles that move toward the lung periph-ery with respirations (Videos 9.15 and 9.16).2
Although dynamic air bronchograms can be seen in up to 6% of patients with atelectasis, they are far more commonly seen in pneu-monia.2,23 Subpleural consolidation may be present (Fig. 9.11, Video 9.17).
If a pleural effusion is present, the pleural fluid should be characterized. A parapneu-monic effusion is suggested by floating debris or air bubbles (“plankton sign”), with multi-ple tiny echoes swirling within fluid and loc-ulations (Fig. 9.12, Videos 9.18 to 9.20) (see Chapter 10). A well-defined hypoechoic area within a lobe with pneumonia suggests necro-sis or abscess (Fig. 9.13 and Video 9.21).
Atelectasis
Basilar resorptive atelectasis is commonly found in patients on ventilators due to hypoin-flation of lungs or in patients with proximal bronchial obstruction (Video 9.22). A loss of lung volume and “static” air bronchograms are seen with atelectasis (Video 9.23). Static air bronchograms represent trapped air bubbles within the bronchioles and can be seen in up to 40% of patients with pneumonia. Therefore clinical context must be considered in inter-preting these findings. Compressive atelectasis from a pleural effusion leads to volume loss, with lung floating within the effusion, and the
may have the “shred sign,” which is seen as a jagged edge within the consolidated lobe. The shred sign appears at the interface between partially aerated alveoli and completely airless or fluid-filled alveoli from pneumonia (Fig. 9.10 and Video 9.14).22 Two additional features may be seen in pneumonia. First, pleural-line thickening and irregularities can be seen due to inflammation or infection.7 Second, dynamic air bronchograms may be seen.23 Dynamic air bronchograms appear as mobile, hyperechoic,
Consolidatedlung
Diaphragm
Liver
Figure 9.9 Alveolar Consolidation. A consolidation pattern is seen just above the diaphragm (left halfofimage).Echogenicityoftheconsolidatedlungissimilartothatoftheliver;thisisdescribedas“hepatization” of the lung.
Consolidatedlung
“Shred” sign
Aeratedlung
Diaphragm
Figure 9.10 “Shred Sign.” In the far field, an irregular jagged hyperechoic line traverses the lung at the interface of the aerated lung (far field) and consolidatedlung(nearfield);thisiscalledthe“shred sign.”

70 2—LUNGS AND PLEURA
or pleural effusion is present, the vertebral bodies are usually visualized extending above the diaphragm (positive spine sign) (Video 9.26) (See Chapter 10).
DIAGNOSTIC APPROACH TO ACUTE DYSPNEA
Most acute dyspnea resulting in respiratory failure is largely caused by one of four proc-esses: (1) COPD/asthma, (2) pneumonia, (3) pulmonary edema, or (4) pulmonary embo-lism.1,24,25 Fortunately, the lung ultrasound findings discussed previously allow for a highly
lung tip displays sinusoidal movements during respirations (Fig. 9.14, Video 9.24). This move-ment suggests a simple pleural effusion, as higher-viscosity parapneumonic effusions will result in a loss of sinusoidal movements.
A mirror image of the liver or spleen can be seen above the diaphragm due to a delay in sound waves returning to the transducer after reflecting off the diaphragm (see Chapter 6). A positive curtain sign, negative spine sign, and mirror image of the liver/spleen above the dia-phragm are all normal findings that confirm aerated lung is abutting the diaphragm (Video 9.25). However, when a lower lobe pneumonia
Diaphragm
Pleuraleffusion
Figure 9.12 Complex Septated Pleural Effusion. An anechoic space above the diaphragm with linear echogenic septations in a patient with an empyema.
Aeratedlung
Border ofaerated lung
Subpleuralconsolidation
Figure 9.11 Subpleural Consolidation. Alveolar consolidation is shown just beneath the pleural line along the anterior chest wall.

9—LUNG ULTRASOUND INTERPRETATION 71
accurate (>90%) determination of these under-lying conditions in acutely dyspneic patients.1
Given the high sensitivity of lung ultrasound for the causes of acute respiratory failure and to avoid ordering unnecessary and expensive diagnostic tests, a thoracic ultrasound exam is recommended after obtaining a history and performing a physical exam.17,18,24 For common conditions such as congestive heart failure, the presence of positive bilateral B-lines in two or more bilateral lung zones is associated with a high positive likelihood ratio (>7) to diagnose acute heart failure.26 In addition to performing a lung ultrasound exam, providers must be able to associate the various findings described previously with the corresponding
Abscess
Diaphragm
Lung
Figure 9.13 Lung Necrosis.Ananechoic/hypoechoicareaoflungnecrosisisseenwithinanareaofalveolar consolidation just above the diaphragm.
Diaphragm
Spine
Liver
Atelectaticlung
Airbronchograms
Pleuraleffusion
Figure 9.14 Compressive Atelectasis. A pleural effusion is compressing the lower lobe, causing atelectasis with air bronchograms.
PEARLS AND PITFALLS
• Patients with dyspnea but a normal lung ultrasound pattern should be evaluated for COPD/asthma, pulmonary embolism, or nonpulmonary pathologies.
• Presence of lung sliding rules out pneumothorax, but absence of lung sliding can be due to pneumothorax or other causes, such as pleurodesis, lung volume loss, or reduced/absent lung ventilation.
• B-lines are discrete and vertical; they arise from and move with the pleura. B-lines extend to the far field on the screen. For B-lines to be considered pathologic, three or more must appear in a single rib interspace.
• Z-lines should not be confused with B-lines. Although Z-lines are vertical and arise from the pleural line, they do not extend to the far field and are not discrete. Z-lines have no pathologic significance.
• Recall that B-lines can normally be seen in lower lung zones due to gravity-dependent edema and may not be
lung pathologies (Fig. 9.15).27 See Chapter 12 for a case-based illustration of using ultrasound in the evaluation of acute dyspnea.
A summary of lung ultrasound patterns in common conditions is shown in Table 9.2.

72 2—LUNGS AND PLEURA
NoYes
Yes
NoYes
Possiblepneumothorax
B-linespresent
No
Yes
Lungslidingpresent
Yes
No
Consolidation present
Pneumonia vs. atelectasis
NoYes
Very likelypneumonia
Dynamic air bronchograms
Lung pointvisible
Bilateral
History,laboratory
data
Shortnessof Breath
RULED IN:pneumothorax
RULED OUT:pneumothorax
History,laboratorydata, other
imaging
History, physical exam, cardiacultrasound, laboratory data,
other imaging
Consider obstructive lung disease,pulmonary embolism, pulmonary
hypertension, and other non-parenchymal etiologies
Pulmonary edema, pulmonaryfibrosis, diffuse interstitial
processes (viralpneumonia, ARDS, others)
Focal pneumonia,pneumonitis,
pulmonary embolism
RULED OUT:pulmonary edema
History, cardiacultrasound,
laboratory data
Low Likelihood:pulmonary edema
Figure 9.15 Algorithm for Shortness of Breath.
pathologic. Multiple B-lines in the upper lung zones are always pathologic.
• Findings that suggest pneumonia as the cause of consolidation are hepatization, dynamic air bronchograms, the shred sign, loss of sinusoidal movement at the lung tip, preserved or increased lung volume, and an associated
pleural effusion that contains complex features (floating debris or air bubbles, septations).
• Consolidation due to atelectasis is suggested by loss of lung volume, sinusoidal movement of the lung tip with surrounding pleural effusion, and static air bronchograms.

9—LUNG ULTRASOUND INTERPRETATION 73
Co
ndit
ion
Lun
g a
nd
ple
ura
l exa
m fi
nd
ing
s
Co
mm
ents
Up
per
Lo
be
(An
teri
or)
Mid
dle
Lo
be
(An
tero
late
ral)
Low
er L
ob
e(P
oste
rior
Bas
al)
No
rmal
•Sliding
•A-lines
•M-m
ode:seashoresign
-
•Sliding
•A-lines
•Curtainsign
•Negativespinesign
•Afew
B-linesmaynormally
be s
een
in lu
ng b
ases
.
CO
PD
, A
sthm
a•
Apicalblebsm
ayshow
abse
nce
of lu
ng s
lidin
g.•
Pneum
oniam
aybeseenin
acut
e C
OP
D e
xace
rbat
ion.
Pul
mo
nary
em
bo
lism
•FocalB
-linesmaybeseen
arou
nd p
ulm
onar
y in
farc
ts.
Pne
umo
tho
rax
poin
t
•Nosliding
•A-lines
•M-m
ode:stratosphereorbarcordesign
•Sliding
•A-lines
•Curtainsign
•Largepneumothorax:nosliding,A-lines
•Otherconditionswith
absentlungsliding:
pleu
rode
sis,
lung
vol
ume
loss
, re
duce
d or
abs
ent
lung
ven
tilat
ion.
•Lungpointrulesin
pneu
mot
hora
x.•
Insupinepatients,scan
the
ante
rior
ches
t w
all
from
the
cla
vicl
e to
the
di
aphr
agm
bec
ause
air
will
accu
mul
ate
in a
nter
oinf
erio
r co
stop
hren
ic r
eces
s. Con
tinue
d
TAB
LE 9
.2
Sum
mar
y of
Lun
g Ul
tras
ound
Fin
ding
s

74 2—LUNGS AND PLEURA
Co
ndit
ion
Lun
g a
nd
ple
ura
l exa
m fi
nd
ing
s
Co
mm
ents
Up
per
Lo
be
(An
teri
or)
Mid
dle
Lo
be
(An
tero
late
ral)
Low
er L
ob
e(P
oste
rior
Bas
al)
Pul
mo
nary
ed
ema
•DiffusebilateralB
-lines
•Sliding
•Thinpleuralline
Ple
ural
line
-
•B-lines
•Simplepleuraleffusion
may
bepresent
•Nonsevere
pulmonary
edem
a m
ay h
ave
area
s w
ith
A-li
nes.
•ARDSshow
sbilateral
patc
hy B
-line
s in
ters
pers
ed
with
A-li
nes
and
thic
kene
d pl
eura
l lin
e.
Pne
umo
nia
Air
bron
chog
ram
s
Con
solid
ated
lung
•Early:focalunilateralB
-lines,sliding
•Advanced:
consolidation,
dynamicair
bron
chog
ram
s, s
hred
sig
n, t
hick
ened
pl
eura
l lin
e, r
educ
ed s
lidin
g
Dia
phra
gm
Air
bron
chog
ram
s
Con
solid
ated
lung
•Earlyandadvanced:sameas
upperlobe
findi
ngs
•Com
plex
pleuraleffusion
may
bepresent
•Subpleuralconsolidation
may
be
pres
ent.
Ate
lect
asis
Ate
lect
atic
lung
Aer
ated
lung
•Reduced/absentlung
slidingwith
pron
ounc
ed lu
ng p
ulse
(res
orpt
ive)
•Consolidation
•Static
air-bronchograms
•FocalB
-lines
Dia
phra
gm
Live
r
Ple
ural
effu
sion
Ate
lect
atic
lung
•Pleuraleffusion
(com
pressive)
•Elevatedhemidiaphragm
(resorptive)
•Consolidation
•Static
air-bronchog
rams
•FocalB
-lines
•Atelectasisismostcommon
in t
he m
ost
depe
nden
t po
rtio
ns o
f th
e lo
wer
lobe
s.
TAB
LE 9
.2Su
mm
ary
of L
ung
Ultr
asou
nd F
indi
ngs—
cont
’d

9—LUNG ULTRASOUND INTERPRETATION 75
Co
ndit
ion
Lun
g a
nd
ple
ura
l exa
m fi
nd
ing
s
Co
mm
ents
Up
per
Lo
be
(An
teri
or)
Mid
dle
Lo
be
(An
tero
late
ral)
Low
er L
ob
e(P
oste
rior
Bas
al)
Pul
mo
nary
ed
ema
•DiffusebilateralB
-lines
•Sliding
•Thinpleuralline
Ple
ural
line
-
•B-lines
•Simplepleuraleffusion
may
bepresent
•Nonsevere
pulmonary
edem
a m
ay h
ave
area
s w
ith
A-li
nes.
•ARDSshow
sbilateral
patc
hy B
-line
s in
ters
pers
ed
with
A-li
nes
and
thic
kene
d pl
eura
l lin
e.
Pne
umo
nia
Air
bron
chog
ram
s
Con
solid
ated
lung
•Early:focalunilateralB
-lines,sliding
•Advanced:
consolidation,
dynamicair
bron
chog
ram
s, s
hred
sig
n, t
hick
ened
pl
eura
l lin
e, r
educ
ed s
lidin
g
Dia
phra
gm
Air
bron
chog
ram
s
Con
solid
ated
lung
•Earlyandadvanced:sameas
upperlobe
findi
ngs
•Com
plex
pleuraleffusion
may
bepresent
•Subpleuralconsolidation
may
be
pres
ent.
Ate
lect
asis
Ate
lect
atic
lung
Aer
ated
lung
•Reduced/absentlung
slidingwith
pron
ounc
ed lu
ng p
ulse
(res
orpt
ive)
•Consolidation
•Static
air-bronchograms
•FocalB
-lines
Dia
phra
gm
Live
r
Ple
ural
effu
sion
Ate
lect
atic
lung
•Pleuraleffusion
(com
pressive)
•Elevatedhemidiaphragm
(resorptive)
•Consolidation
•Static
air-bronchog
rams
•FocalB
-lines
•Atelectasisismostcommon
in t
he m
ost
depe
nden
t po
rtio
ns o
f th
e lo
wer
lobe
s.
AR
DS
,Acute
respiratorydistress
syndrome;
CO
PD
, ch
roni
c ob
stru
ctiv
e pu
lmon
ary
dise
ase.

9—LUNG ULTRASOUND INTERPRETATION 75.e1
CASE 9.1
CASE PRESENTATION
A 58-year-old man is admitted to the intensive care unit (ICU), intubated for airway protection after a large intracranial hemorrhage. He requires a central venous catheter and is placed in Tren-delenburg position for the procedure. Immedi-ately after the procedure the patient’s oxygen saturation drops to 68% with a rapid decrease in his blood pressure to 75/40 mm Hg. The ICUteam strongly suspects a pneumothorax and prepares to insert a chest tube emergently. While the team prepares for the procedure, a lung ultrasound exam is performed.
ULTRASOUND FINDINGS
An ultrasound exam on the side of catheter placement reveals lung sliding beneath all ante-rior rib interspaces (Video 9.27).
CASE RESOLUTION
Based on the presence of lung sliding, a diagno-sis of pneumothorax is ruled out and efforts to place a chest tube are redirected toward the sta-bilization of vital signs through manual ventilation, fluid resuscitation, and vasopressor initiation. The risks and trauma of emergent chest tube place-ment were thus avoided. The deterioration was attributed to an idiosyncratic vagal response to the Trendelenburg position in the setting of ele-vated intracranial pressure.
Lung ultrasound has higher sensitivity for ruling out pneumothorax than chest radiogra-phy and can be performed more rapidly at the bedside. The presence of lung sliding rules out the possibility of pneumothorax at the site of examination with 100% specificity and should be used in the initial evaluation of suspected pneu-mothorax in a decompensating patient.
CASE 9.2
CASE PRESENTATION
A 28-year-old man with no known past medical history is brought to the emergency department after a motor vehicle accident. He is hypoxemic, tachycardic, and hypotensive. Auscultation of the lungs is limited due to the chaos in the resuscita-tion bay as the team attempts to control bleeding from lacerations to his head and legs. You are concerned about the possibility of pneumotho-rax. The patient’s blood pressure continues to decrease. A focused lung ultrasound exam is performed.
ULTRASOUND FINDINGS
A focused ultrasound exam using the extend-ed-FAST protocol is performed. When thetransducer is placed on the anterior chest wall, absence of lung sliding is identified over multiple contiguous rib interspaces (Video 9.28).
CASE RESOLUTION
Based on absence of lung sliding in a trauma patient, empiric tube thoracostomy is performed with rapid, audible egress of air upon insertion of the tube, followed by stabilization of his vital signs.
Presence of lung sliding rapidly rules out pneumothorax, but absence of lung sliding may be due to other causes besides pneumotho-rax, such as pleurodesis or lung volume loss. However, absence of lung sliding in a patient without history or low likelihood of preexisting pleural disease strongly suggests the presence of a pneumothorax. Given this patient’s recent trauma and unstable condition, empiric tube thoracostomy is indicated. Alternatively, if time allowed, a search to identify the “lung point” sign would rule in pneumothorax with 100% specific-ity before tube thoracostomy.
CASE 9.3
CASE PRESENTATION
A 72-year-old woman presents to the emergency department with shortness of breath. Vital signs are notable for mild hypertension, tachycardia, and oxygen saturation below 90% despite theadministration of 100% oxygen with a nonre-breather mask. Her breathing is labored and lung
auscultation reveals fine crackles bilaterally. Labresults are notable for a mild leukocytosis. Chest x-ray reveals bilateral patchy opacities. The con-sulting physician suspects that the patient is developing acute respiratory distress syndrome (ARDS) from a multifocal pneumonia. A lungultrasound exam is performed.
Continued

75.e2 2—LUNGS AND PLEURA
CASE 9.3—cont’d
CASE 9.5
A 72-year-old man with a history of chronic obstructive pulmonary disease (COPD) presents to the emergency department with shortness of breath. He was found to be hypoxemic with bilateral wheezing on auscultation. His chest radiograph demonstrates hyperinflation without any opacities. A focused lung ultrasound exam is performed.
ULTRASOUND FINDINGS
Lung ultrasound reveals focal B-lines in thepatient’s right posterior lung, with an irregular pleural line and subpleural consolidation (Video 9.31).
CASE RESOLUTION
FocalB-lineswithasubtlesubpleuralconsolida-tion and an irregular pleural line are consistent with an early right-sided pneumonia. In this case, the pneumonia likely exacerbated the patient’s COPD. Antibiotics were promptly administered, along with standard treatment for an acute COPD exacerbation.
Lung ultrasound has higher sensitivity for the detection of pneumonia than chest radiographs. The presence of focal B-lines in conjunction with an irregular pleural line and subpleural consoli-dation are findings that support a diagnosis of pneumonia despite a negative chest radiograph.
CASE 9.4
CASE PRESENTATION
An 81-year-old man with a history of ischemic cardiomyopathy is admitted to the intensive care unit following cardiac arrest. He is hypotensive and presumed to be in cardiogenic shock. He is difficult to oxygenate on the ventilator. Chest radiograph shows alveolar infiltrates with blunting of the right costophrenic angle suggestive of a small pleural effusion. A focused lung ultrasound exam is performed.
ULTRASOUND FINDINGS
Lung ultrasound reveals bilateral A-lines ante-riorly with alveolar consolidation in the right lung base. The consolidated lobe has a tissue-like appearance (hepatization) and dynamic air
bronchograms(Video9.30). A small pleural effu-sion is noted.
CASE RESOLUTION
This patient’s ultrasound findings are consistent with right-lower-lobe pneumonia. Antibiotics are promptly administered, along with hemodynamic support.
Portable chest radiography poorly differen-tiates the causes of basilar opacification. Lung ultrasound is highly sensitive for detecting pleural effusions and can help to differentiate atelectasis from pneumonia. Alveolar consolidation caused by pneumonia is suggested by the presence of hepatization, dynamic air bronchograms, or complex pleural fluid characteristics.
ULTRASOUND FINDINGS
A six-point lung ultrasound exam is performed. Findingsarenotableforrobustlungslidingwithathin, smooth pleural line and confluent B-lines in all examined lung interspaces without any areas of sparing (Video 9.29). In addition, small bilateral pleural effusions are noted that were not seen on chest x-ray.
CASE RESOLUTION
The lung ultrasound findings are consistent with an interstitial syndrome caused by acute cardio-genic pulmonary edema. Initiation of diuretics,
and nitroglycerin as well as discontinuation of antibiotics improved this patient’s oxygen satu-ration and work of breathing.
Lung ultrasound is highly accurate for detect-ing cardiogenic pulmonary edema. Findings of cardiogenic pulmonary edema include the pres-ence of symmetric B-line patterns in bilateral anterior interspaces with a thin pleural line and presence of lung sliding, whereas noncardio-genic pulmonary edema reveals areas of sparing with a thickened, irregular pleural line and dimin-ished or absent sliding.

9—LUNG ULTRASOUND INTERPRETATION 75.e3
CASE 9.6
A 62-year-old woman is admitted to the medical ward for shortness of breath and a large left-sided pleural effusion. She requires a diagnosticand therapeutic thoracentesis. A total of 1.2 liters of serosanguinous fluid is drained. Immediately postprocedure, the patient complains of chest discomfort and shortness of breath. A porta-ble postprocedure radiograph is still pending. A focused lung ultrasound is performed.
ULTRASOUND FINDINGS
Lung ultrasound reveals absence of lung sliding,worrisome for the presence of pneumothorax. However, B-lines are present, thus ruling out pneumothorax (Video 9.32).
CASE RESOLUTION
Despite the absence of lung sliding, the presence of B-lines rules out pneumothorax in this case. The presence of multiple B-lines is more sup-portive of a diagnosis of reexpansion pulmonary edema. She was given supplemental oxygen andclosely observed overnight with resolution of her symptoms over the next hours.
The presence of any of the following three findings rules out pneumothorax: lung sliding, B-lines, and lung pulse. Detection of these find-ings is particularly helpful in patients in whom lung sliding is difficult to appreciate.
Review Questions1. With respect to the eFig. 9.16, which of the
following arrows refer to an A-line?
A
C
B
D
eFigure 9.16 A. AB. BC. CD. DAnswer: D. This view of the anterior chest wall using a linear transducer shows the soft tissue (A), rib (B), pleural line (C), and an A-line (D). A-lines are reverberation artifacts created by repetitive reflections between the pleural line and transducer/skin interface and are found at depths equivalent to the distance between the pleural line and transducer/skin interface.
2. Which of the following lung ultrasound images diagnoses or “rules in” the presence of pneumothorax?A. Video 9.33B. Video 9.34
C. Video 9.35D. Video 9.36Answer: D. Video D demonstrates the lung point, or the boundary or “edge” of between aerated lung and an area of pneumothorax; it is highly specific for pneumothorax. Identification of a lung point diagnoses or rules in pneumothorax. Three findings can rule out pneumothorax: lung sliding, B-lines, or lung pulse. Video A shows pleural sliding and B-lines, two ultrasound findings that rule out pneumothorax. Video B shows absence of lung sliding, which is sensitive for pneumothorax but not specific, since other conditions can also cause absence of lung sliding, including pleurodesis, lung volume loss (e.g., mucous plugging), and absent/reduced lung ventilation (e.g., mainstem intubation). Video C shows a lung pulse that is seen only when the visceral and parietal pleura are apposed, which rules out pneumothorax.
3. All of the following are normal sono-graphic findings of the lung, EXCEPT _______________.A. A-linesB. B-linesC. Z-linesD. Curtain signAnswer: B. B-lines are indicative of interlobular septal thickening, which may be either due to fluid accumulation or the deposition of collagen or fibrous tissue. Although a few B-lines may normally be seen in the lung bases or lobar fissures, B-lines are considered to be pathologic.

75.e4 2—LUNGS AND PLEURA
attenuating structures, most often the ribs. Acoustic enhancement is seen deep to fluid-filled structures, such as a pleural effusion or consolidated lung.
6. Which of the following images is most consistent with a patient presenting with stable chronic obstructive pulmonary disease without any other concomitant lung conditions?A. Video 9.37B. Video 9.38C. Video 9.39D. Video 9.40Answer: A. Patients with stable chronic obstructive pulmonary disease are expected to have normal lung sonographic findings, including the presence of sliding and A-lines, as shown in Video A. Video B shows multiple B-lines in the rib interspaces, suggestive of pulmonary edema. Video C shows a lower lobe pneumonia with dynamic air bronchograms and a complex pleural effusion with fibrinous stranding between the lower lobe and diaphragm. Video D demonstrates subpleural consolidations using a linear transducer.
7. All of the following are lung ultrasound findings suggestive of pneumonia, EXCEPT ______.A. B-linesB. E-linesC. Irregular pleural lineD. Shred signAnswer: B. E-lines are seen in subcutaneous emphysema. Consolidation with dynamic and static air bronchograms, B-lines, pleural irregularities, and pleural effusions are all ultrasound findings suggestive of pneumonia.
8. Which of the following is NOT a defining characteristic of B-lines?A. B-lines move with lung slidingB. B-lines are ray-like, hyperechoic, vertical,
and discreteC. B-lines emanate from the pleural line,
never above the pleural lineD. B-lines usually attenuate after 2 to 4 cmAnswer: D. B-lines extend to the periphery of the far field on the screen, whereas Z-lines attenuate usually after 2 to 4 cm. All of the other characteristics listed are consistent with B-lines.
A-lines, Z-lines, and the curtain sign are all hallmark features of normal lungs.
4. The presence of dynamic air bronchograms is suggestive of which of the following conditions?A. PneumothoraxB. Congestive heart failureC. PneumoniaD. AtelectasisAnswer: C. The presence of dynamic air bronchograms in consolidated lungs is suggestive of pneumonia. Dynamic air bronchograms are more specific for pneumonia versus atelectasis, with only 6% of atelectatic lungs demonstrating dynamic air bronchograms. Dynamic air bronchograms are not a characteristic finding of pneumothorax or congestive heart failure unless there is underlying consolidation.
5. What is the underlying mechanism of the predominant artifact shown in this figure (eFig. 9.17)?
eFigure 9.17 A. ReverberationB. Mirror imageC. Acoustic shadowingD. Acoustic enhancementAnswer: A. This image demonstrates B-lines resulting from reverberation artifact, also called comet tail artifacts. Mirror image artifact can be seen when a strong reflective surface interfaces with the ultrasound beam. The ultrasound waves reflect repeatedly between the object and reflective surface, creating a mirror image of the object deep to the reflective surface. At the level of the diaphragm, a mirror image of the liver or spleen can often be seen above the diaphragm. Acoustic shadowing is seen deep to highly

9—LUNG ULTRASOUND INTERPRETATION 75.e5
References1. Lichtenstein DA, Meziere GA. Relevance of
lung ultrasound in the diagnosis of acute respiratory failure: the BLUE protocol. Chest. 2008;134:117–125.
2. Lichtenstein DA. Whole Body Ultrasonography in the Critically Ill. New York: Springer-Verlag; 2010.
3. Gargani L, Volpicelli G. How i do it: lung ultra-sound. Cardiovasc Ultrasound. 2014;12:25.
4. Lichtenstein DA, Meziere G, Lascols N, et al. Ultrasound diagnosis of occult pneumothorax. Crit Care Med. 2005;33:1231–1238.
5. Reuss J. Sonography of the pleura. Ultraschall Med. 2010;31:8–22, quiz 23–25.
6. Volpicelli G. Sonographic diagnosis of pneumo-thorax. Intensive Care Med. 2011;37:224–232.
7. Volpicelli G, Elbarbary M, Blaivas M, et al. Inter-national evidence-based recommendations for point-of-care lung ultrasound. Intensive Care Med. 2012;38:577–591.
8. Lichtenstein D, Meziere G, Biderman P, Gepner A. The “lung point”: an ultrasound sign spe-cific to pneumothorax. Intensive Care Med. 2000;26:1434–1440.
9. Soldati G, Testa A, Sher S, et al. Occult trau-matic pneumothorax: diagnostic accuracy of lung ultrasonography in the emergency depart-ment. Chest. 2008;133:204–211.
10. Lichtenstein DA, Lascols N, Prin S, Mezière G. The “lung pulse”: an early ultrasound sign of complete atelectasis. Intensive Care Med. 2003;29:2187–2192.
11. Lichtenstein D, Meziere G, Biderman P. The comet-tail artifact. an ultrasound sign of alveo-lar-interstitial syndrome. Am J Respir Crit Care Med. 1997;156:1640–1646.
12. Kerley P. Radiology in heart disease. Br Med J. 1933;2:594–612.
13. Volpicelli G, Mussa A, Garofalo G. Bedside lung ultrasound in the assessment of alve-olar-interstitial syndrome. Am J Emerg Med. 2006;24:689–696.
14. Song G, Bae S, Lee Y. Diagnostic accuracy of lung ultrasound for interstitial lung disease in patients with connective tissue diseases: a meta-analysis. Clin Exp Rheumatol. 2015;34:11–16.
15. Gargani L. Lung ultrasound: a new tool for the cardiologist. Cardiovasc Ultrasound. 2011;9:6.
16. Nazerian P, Volpicelli G, Vann IS, et al. Accu-racy of lung ultrasound for the diagnosis of con-solidations when compared to chest computed tomography. Am J Emerg Med. 2015;33:620–625.
17. Volpicelli G, Caramello V, Cardinale L, Cravino M. Diagnosis of radio-occult pulmonary con-ditions by real-time chest ultrasonography in patients with pleuritic pain. Ultrasound Med Biol. 2008;34:1717–1723.
18. Cortellaro F, Colombo S, Coen D, Duca PG. Lung ultrasound is an accurate diagnostic tool for the diagnosis of pneumonia in the emergency department. Emerg Med J. 2012;29:19–23.
19. Bourcier JE, Paquet J, Seinger M, et al. Perfor-mance comparison of lung ultrasound and chest x-ray for the diagnosis of pneumonia in the ED. Am J Emerg Med. 2014;32:115–118.
20. Chavez M, Shams N, Ellington L, et al. Lung ultrasound for the diagnosis of pneumonia in adults: a systematic review and meta-analysis. Respir Res. 2014;15:50.
21. Ye X, Xiao H, Chen B, Zhang S. Accuracy of lung ultrasonography versus chest radiography for the diagnosis of adult community-acquired pneumo-nia: review of the literature and meta-analysis. PLoS ONE. 2015;10:e0130066.
22. Lichtenstein DA. Lung ultrasound in the criti-cally ill. Ann Intensive Care. 2014;4:1.
23. Lichtenstein D, Mezière G, Seitz J. The dynamic air bronchogram: a lung ultrasound sign of alve-olar consolidation ruling out atelectasis. Chest. 2009;135:1421–1425.
24. Zanobetti M, Poggioni C, Pini R. Can chest ultrasonography replace standard chest radiogra-phy for evaluation of acute dyspnea in the ED? Chest. 2011;139:1140–1147.
25. Ray P, Birolleau S, Lefort Y, et al. Acute respi-ratory failure in the elderly: etiology, emergency diagnosis and prognosis. Crit Care. 2006;10:R82.
26. Martindale JL, Wakai A, Collins SP, et al. Diag-nosing acute heart railure in the emergency department: a systematic review and meta-anal-ysis. Acad Emerg Med. 2016;23:223–242.
27. Bhagra A, Tierney DM, Sekiguchi H, Soni NJ. Point-of-care ultrasonography for primary care physicians and general internists. Mayo Clin Proc. 2016;91(12):1811–1827.

111
C H A P T E R 14Cardiac Ultrasound TechniqueScott Millington
BackgroundA point-of-care cardiac ultrasound examination can be an invaluable clinical tool in the hands of experienced providers. Because cardiac ultrasound requires assessment of both struc-ture and function, the highest quality images should be acquired for optimal assessment. In order to be confident in the interpretation of cardiac ultrasound exam findings, views from two or more imaging planes should be obtained. Although a significant invest-ment of time is required, providers from dif-ferent disciplines and levels of experience can master the techniques described in this chapter.1–7
Novice ultrasound users can find solace in that provider skills and confidence gener-ally increase rapidly after learning the basic transducer positions. Novice users can become comfortable with cardiac ultrasonography with adequately supervised and structured practice. Training traditionally focuses on achieving proficiency in five core cardiac views: para-sternal long-axis, parasternal short-axis (mid-ventricular level), apical 4-chamber, subcostal 4-chamber, and subcostal inferior vena cava (IVC) views.8–10
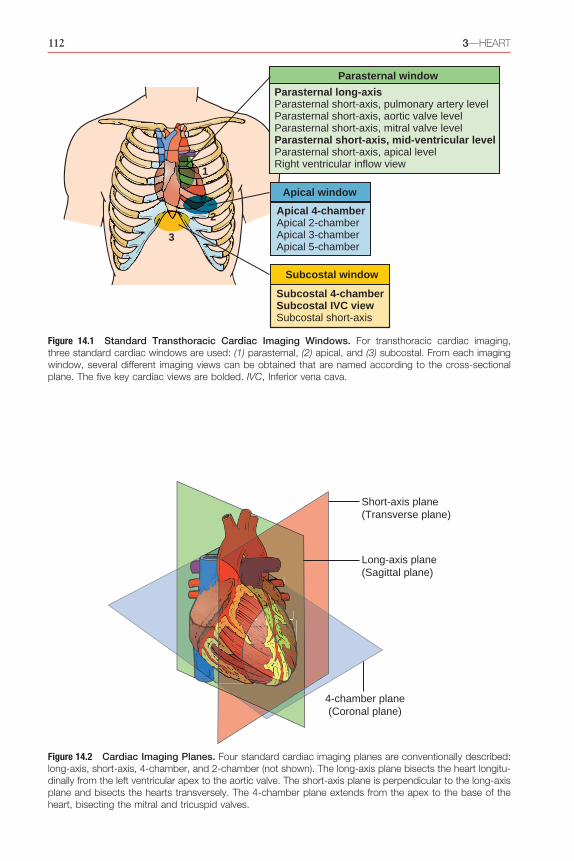
Anatomy: Imaging Windows, Planes, and ViewsAn imaging window refers to an anatomic posi-tion on the body where an ultrasound trans-ducer is placed to visualize specific structures. In transthoracic echocardiography, there are three standard imaging windows: parasternal, apical, and subcostal windows (Fig. 14.1).
An imaging plane refers to an anatomic plane (sagittal, coronal, or transverse) along which the ultrasound beam is aligned. All anatomic structures, unless they are perfectly spherical, have a long and short axis.11 Imaging planes are named in relation to the axes of the heart in cardiac ultrasound, and four planes are conventionally described: long-axis, short-axis, 4-chamber, and 2-chamber. The long-axis plane bisects the heart vertically from the left ventric-ular apex to the aortic valve (AV) at the base of the heart. The short-axis plane is perpendicular to the long axis and generates cross sections of the ventricles. Similar to the long-axis plane, the 4-chamber plane extends from the apex to base of the heart but bisects the tricuspid valve (TV) and mitral valve (MV). The 2-chamber plane is perpendicular to the 4-chamber plane (Fig. 14.2). Between the long and short axes of
K E Y P O I N T S
• To perform a point-of-care cardiac ultrasound exam, five standard imaging views are obtained: parasternal long-axis, parasternal short-axis, apical 4-chamber, subcostal 4-chamber, and subcostal inferior vena cava.
• Providers should visualize cardiac structures in at least two views, ideally from two different windows, to corroborate findings prior to making clinical decisions.
• The core skills of point-of-care cardiac ultrasound are image acquisition and image interpretation, both of which must be mastered before clinical integration can be learned.
112 3—HEART
Parasternal window
Apical window
Subcostal window
Parasternal long-axisParasternal short-axis, pulmonary artery levelParasternal short-axis, aortic valve levelParasternal short-axis, mitral valve levelParasternal short-axis, mid-ventricular levelParasternal short-axis, apical levelRight ventricular inflow view
Apical 4-chamberApical 2-chamberApical 3-chamberApical 5-chamber
Subcostal 4-chamberSubcostal IVC viewSubcostal short-axis
1
2
3
Figure 14.1 Standard Transthoracic Cardiac Imaging Windows. For transthoracic cardiac imaging, three standard cardiac windows are used: (1) parasternal, (2) apical, and (3) subcostal. From each imaging window, several different imaging views can be obtained that are named according to the cross-sectional plane. The five key cardiac views are bolded. IVC, Inferior vena cava.
Short-axis plane(Transverse plane)
Long-axis plane(Sagittal plane)
4-chamber plane(Coronal plane)
Figure 14.2 Cardiac Imaging Planes. Four standard cardiac imaging planes are conventionally described: long-axis, short-axis, 4-chamber, and 2-chamber (not shown). The long-axis plane bisects the heart longitu-dinally from the left ventricular apex to the aortic valve. The short-axis plane is perpendicular to the long-axis plane and bisects the hearts transversely. The 4-chamber plane extends from the apex to the base of the heart, bisecting the mitral and tricuspid valves.

14—CARDIAC ULTRASOUND TECHNIQUE 113
is explored in detail in this chapter. Specific clinical questions may occasionally require use of other windows to obtain views that are not part of a standard point-of-care exam, such as suprasternal views to evaluate the aortic arch. Inability to acquire satisfactory images occurs in a minority of patients, and a transesophageal echocardiogram may be indicated for an ade-quate assessment of the heart (see Chapter 20).12
Transducer MovementsUnderstanding the conventional nomenclature to describe transducer movements is import-ant for communicating with colleagues and training new users. There are four primary movements of the transducer: sliding, rotating, tilting, and rocking (Fig. 14.3).11,13
1. Sliding refers to relocating the transducer on the skin surface; it is the process of
the heart, an infinite number of oblique planes exist that are not conventionally named.
Combining imaging windows and planes gives rise to imaging views. Imaging views are standard cross sections of the heart obtained from specific windows. Within each imaging window, there are several different views that can be acquired along the different imaging planes. Imaging views are named according to the window and plane. For example, in the parasternal window the two principal views are the parasternal long-axis view and parasternal short-axis view.
The human thorax, with its bony ribs and air-filled lungs, is a naturally challenging envi-ronment to image with ultrasound. Despite these barriers, the fundamental transthoracic cardiac ultrasound views are attainable in most patients from the parasternal, apical, and subcostal windows; each of these windows
Rocking
Transducer Movements
Sliding Rotating
Tilting
A
C D
B
Figure 14.3 Transducer Movements. Sliding is relocation of the transducer on the skin surface. Rotating refers to twisting the transducer along its central axis, like a corkscrew. Tilting refers to changing the angle of the imaging plane to obtain serial cross-sectional images. Rocking refers to aiming the ultrasound beam toward or away from the transducer orientation marker to center the image on the screen.

114 3—HEART
ability to acquire high-quality images in most patients regardless of position. Ideally, the patient should be supine and can be rotated to a left lateral decubitus position to bring the heart in direct contact with the anterior chest wall. An imaging window more inferiorly may provide higher quality images in patients with chronic obstructive pulmonary disease.
The parasternal window is imaged by placing a phased-array transducer immedi-ately to the left of the sternum in the third or fourth intercostal space. The optimal window may be located anywhere between the second and fifth intercostal spaces, and providers may slide the transducer an intercostal space above or below to acquire the highest quality image. An optimal parasternal window has the least interference from adjacent ribs and lung. Once the optimal window has been identified, the transducer should be held in place without sliding.
PARASTERNAL LONG-AXIS VIEW
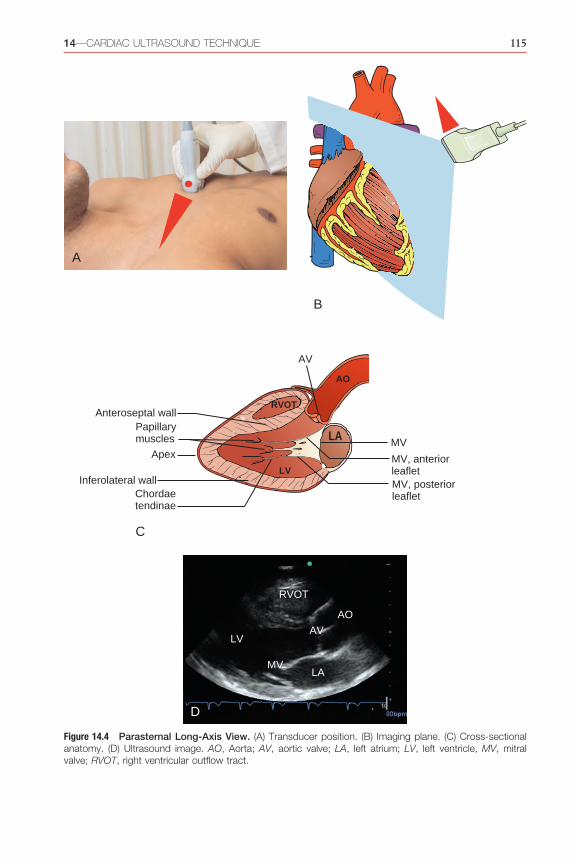
For a PLAX, the probe should be adjusted with the transducer orientation marker pointing toward the patient’s right shoulder (Fig. 14.4; Video 14.1). The ultrasound beam should be positioned parallel to a line running from the patient’s right shoulder to left hip. Images obtained represent anatomic cross sections through the long axis of the heart from the cardiac apex to base.
The right ventricle (RV) is seen anteri-orly, at the top of the screen. While holding the transducer steady, visualize the aortic and mitral valves and center the ultrasound beam over the LV. An ideal view is obtained when both the AV and MV are clearly visualized in the same plane and the ultrasound beam is centered along the long axis of the left ven-tricle (LV). Slight rotation and tilting of the transducer opens the left ventricular cavity to its fullest extent, avoiding the tendency to foreshorten the cavity. This common error can result in overestimation of LV systolic function and underestimation of LV cavity dimension. If a good-quality image cannot be achieved, con-sider sliding the transducer up or down one intercostal space and beginning anew. Alterna-tively, the patient may be positioned in a left lateral decubitus position. Finally, cooperative patients can be asked to consciously regulate their respiratory cycle, ideally by having them hold their breath at end-expiration.
physically moving the point of contact between the transducer and skin.
2. Rotating refers to twisting the transducer on its central axis, like a corkscrew.
3. Tilting refers to changing the angle of the imaging plane while maintaining the point of contact with the skin surface. Tilting allows visualization of serial cross-sectional images of a structure from a single acoustic window, such as tilting the transducer from the cardiac base to apex to acquire serial para-sternal short-axis views. This “cross-plane” movement allows the provider to sweep through a structure of interest from left to right, or from cranial to caudal. Tilting may also be called sweeping or fanning.
4. Rocking refers to aiming the ultrasound beam either toward or away from the transducer orientation marker while main-taining the point of contact with the skin surface. Rocking is similar to tilting but in a perpendicular plane of motion. This “in-plane” movement allows centering of the image on the screen and allows visual-ization beyond the current field of view in a specific direction.
Point-of-Care Cardiac Ultrasound ExamThe number of possible cardiac imaging views can seem limitless at first glance, but the quan-tity of conventionally defined views is limited. From the conventional imaging windows, as many as 16 traditional imaging views can be obtained with a comprehensive transthoracic echocardiogram. From a point-of-care perspec-tive, mastery of five imaging views will allow the vast majority of clinically relevant questions to be addressed:1. Parasternal long-axis view (PLAX)2. Parasternal short-axis, midventricular level
view (PSAX)3. Apical 4-chamber view (A4C)4. Subcostal 4-chamber view (S4C)5. Subcostal IVC view (IVC)
Parasternal Window
IMAGING WINDOW
Cardiac ultrasound exams traditionally begin in the parasternal window. An important advantage of the parasternal window is the
14—CARDIAC ULTRASOUND TECHNIQUE 115
AO
LV
RVOT
LA
Anteroseptal wall
Apex
Papillarymuscles
Inferolateral wallChordaetendinae
MV
MV, anteriorleafletMV, posteriorleaflet
AV
A
B
C
D
RVOT
AO
AVLV
MVLA
Figure 14.4 Parasternal Long-Axis View. (A) Transducer position. (B) Imaging plane. (C) Cross-sectional anatomy. (D) Ultrasound image. AO, Aorta; AV, aortic valve; LA, left atrium; LV, left ventricle, MV, mitral valve; RVOT, right ventricular outflow tract.

116 3—HEART
The short-axis midventricular view is ideal for assessing global LV systolic function and segmental LV wall motion. The nomencla-ture of the LV wall segments is shown in Fig. 14.6. This view also helps assess the shape and function of the interventricular septum in the context of RV dilatation and dysfunction. Large- or moderate-sized circumferential peri-cardial effusions are also well visualized.
The other short-axis planes, beyond the midventricular plane, may be useful in specific clinical contexts and are listed in anatomic sequence, from the cardiac base to the apex (Fig. 14.7):1. Pulmonary artery level: From the midven-
tricular level, the ultrasound beam is tilted superiorly toward the base of the heart. The correct plane has been acquired once the pulmonary valve (PV), main pulmonary artery (MPA), and ascending aorta in short axis are seen (Video 14.2). In rare cases of acute pulmonary embolism (PE), a throm-bus may be seen in the MPA or proximal left or right pulmonary arteries. Pulmonary regurgitation velocities may be used to esti-mate the mean and diastolic pulmonary artery pressures.
2. AV level: From the pulmonary artery level, the transducer is tilted slightly inferiorly, toward the apex of the heart. An ideal image includes a short-axis view of the AV, which may require a slight rotation of the transducer until all three AV cusps appear symmetrically. An ideal image includes the right atrium (RA), TV, RVOT, and left atrium (LA) (Video 14.3). This view allows assessment of the AV and TV.
3. MV level: When rotating from a parasternal long-axis to short-axis view, the distinct “fish mouth” appearance of the MV is usually seen first (Video 14.4). This view allows assessment of MV anatomy, but in acutely ill patients this view has limited utility. LV systolic function may be underestimated compared to the midventricular level due to restriction from the MV annulus.
4. Midventricular, papillary muscle level: This view yields the most useful clinical infor-mation in the vast majority of acutely ill patients. Both papillary muscles are sym-metrically seen in cross section in the center of the circular left ventricular cavity (Video 14.5). Motion of the individual LV chamber wall segments is best assessed at this level, as well as overall LV systolic function.
Key structures that must be identified in the PLAX include the AV, MV, LV, pericardium (both anterior and posterior to the heart), right ventricular outflow tract (RVOT), left ventric-ular outflow tract (LVOT), and portions of the ascending and descending thoracic aorta. The depth should be adjusted to visualize the descending thoracic aorta in the far field.
In the context of point-of-care ultrasound, the PLAX is used primarily to assess LV size and function, AV, MV, and left atrial size. Although imaging is limited to visualization of the anteroseptal and inferolateral LV walls, LV systolic function can be accurately assessed in this view. Pericardial effusions can also be detected, especially when circumferential. Pro-viders cannot reliably comment on RV size or function because only a small cross section of the RVOT is seen; however, a severely dilated RV can be reliably detected. The PLAX pro-vides a basic assessment of the AV and MV and allows evaluation for dynamic obstruction at the level of the LVOT.
PARASTERNAL SHORT-AXIS VIEW
The most effective way to rapidly acquire a high-quality PSAX view is to start with a high-quality PLAX. Starting with the trans-ducer centered over the MV in a PLAX, the transducer is then rotated 90 degrees clockwise to point the transducer orientation marker toward the patient’s left shoulder (Fig. 14.5). Care should be taken to avoid sliding the transducer into a different position on the chest. Using two hands can facilitate a smooth transition from a long-axis to a short-axis view, with one hand rotating the transducer and the other hand stabilizing the transducer on the skin surface.
Five different imaging planes can be achieved in the parasternal short-axis view. For purposes of point-of-care ultrasound, the midventricular level is favored by most pro-viders for its reliable portrayal of global LV systolic function. A midventricular parasternal short-axis view is achieved when both papil-lary muscles are visualized in cross section and appear symmetric, as shown in Fig. 14.5. It is important to rotate the transducer sufficiently to obtain a true cross-sectional image of the LV cavity that appears circular. An oval-shaped LV cavity indicates off-axis imaging or foreshorten-ing, which can lead to erroneous interpretation of LV systolic function.

14—CARDIAC ULTRASOUND TECHNIQUE 117
windows. Ideally, patients should be positioned in a left lateral decubitus position, or at least supine with some leftward rotation. In the critically ill, who may not tolerate being repo-sitioned, apical views may still be achieved, although with some reduction in image quality. In obese or mechanically ventilated patients, acquiring interpretable apical images may not always be possible.
APICAL 4-CHAMBER VIEW
Positioning the transducer over the LV apex is critical for accurate imaging from the apical window, and its position can vary significantly between patients. In general, the apex is located just inferolateral to the left nipple in men and underneath the inferolateral quadrant of the left breast in women. One approach is to slide
5. Apical level: This short-axis view is obtained by tilting the transducer to aim the ultra-sound beam inferiorly, toward the apex of the heart. The LV apex is visualized sequen-tially starting from the midpapillary muscle level and moving inferiorly (Video 14.6). LV systolic function may be overestimated com-pared to the midventricular level. In rare cases, an LV apical thrombus may be seen.
Apical Window
IMAGING WINDOW
In the traditional cardiac imaging sequence, the apical window follows the parasternal window. In general, acquiring adequate quality images from the apical window is more chal-lenging than from the parasternal or subcostal
IVSLV
RV
PM
PMRV
IVSLV
PM
A B
C
D
Figure 14.5 Parasternal Short-Axis View. (A) Transducer position. (B) Imaging plane. (C) Cross-sectional anatomy. (D) Ultrasound image. IVS, Interventricular septum; LV, left ventricle; PM, papillary muscle; RV, right ventricle.

118 3—HEART
and Video 14.7; note the LV, RV, LA, and RA can all be seen clearly in addition to the MV and TV.
The apical 4-chamber view is part of a stan-dard point-of-care cardiac ultrasound exam and can provide a tremendous amount of clinical information. This view allows assessment of RV systolic function and size relative to the LV. The MV and TV can be evaluated, and pericar-dial fluid can also be detected. Adequate assess-ment of global LV systolic function is usually possible, although only the anterolateral and inferoseptal walls are visualized. Although not part of a standard point-of-care exam, addi-tional apical views can provide a more com-plete evaluation of the heart (Fig. 14.9):1. Apical 4-chamber view: This is the basic view
from the apical window, as described above (Video 14.7).
2. Apical 2-chamber view: Starting from an apical 4-chamber view, the transducer is rotated 90 degrees counterclockwise. The
the transducer inferolaterally on the chest from the parasternal short-axis position toward the apex. Alternatively, identify the spleen first and then slide the transducer cephalad to the apex. Once the LV apex is visualized, the transducer is tilted steeply to aim the ultrasound trans-ducer face toward the patient’s right shoulder. The transducer orientation marker should be pointed to the patient’s left side (Fig. 14.8).
The transducer should be rocked to align the interventricular septum in a vertical posi-tion in the center of the screen. The transducer may need to be slightly rotated so the LV and RV cavities are visualized in a true longitudinal cross-section. Subtle adjustments of transducer position may be required to optimize the view of the LV cavity, specifically to avoid foreshort-ening. Foreshortening commonly occurs in the apical window when the transducer is not over the true apex and the heart appears short and globular, rather than long and oval. An ideal apical 4-chamber view is presented in Fig. 14.8
IS
AS
IL
AL
AS = AnteroseptalIS = InferoseptalAL = AnterolateralIL = Inferolateral
Long-axis plane
4-chamber plane
2-chamber plane
Inferior
Sep
tal
Lateral
Anterior
Left ventricleRight ventricle
Figure 14.6 Left Ventricular Wall Segments and Imaging Planes. The left ventricle is divided into three sections along its long axis (basal, midcavity, and apical sections). The basal and midcavity sections have six segments (anterior, anterolateral, anteroseptal, inferior, inferolateral, inferoseptal walls), whereas the apical section has four segments (septal, inferior, lateral, anterior walls).

14—CARDIAC ULTRASOUND TECHNIQUE 119
PA
RVOT
LARA
AVPV
TVRV
PML
AML
A
B
C
D
LV
RV
LV
RV
RVOT
TV
RA
LA
PA
AV
PV RV
LVMV
RV
LV
PM
RV
LV
A. Cardiac Base B. Mitral Valve
C. Midventricle D. Apex
Figure 14.7 Parastornal Short-Axis Imaging Planes and Cross-Sectional Anatomy at Different Levels. (A) Cardiac base—pulmonary artery and aortic valve levels. (B) Mitral valve. (C) Midventricle. (D) Apex. AML, Anterior mitral leaflet; AV, aortic valve; LA, left atrium; LV, left ventricle; PA, pulmonary artery; PML, posterior mitral leaflet; PV, pulmonary valve; RA, right atrium; RV, right ventricle; RVOT, right ventricular outflow tract; TV, tricuspid valve.

120 3—HEART
of regional LV function, specifically of the inferolateral and anteroseptal LV walls.
4. Apical 5-chamber view: Starting from the apical 4-chamber view, the transducer is tilted 20 to 30 degrees anteriorly, to aim the ultrasound transducer face toward the chest wall. The ideal view demonstrates the same four chambers as the apical 4-chamber view (LV, RV, LA, and RA) but with the addition of the LVOT and AV at the 7 o’clock posi-tion (Video 14.10). This view provides addi-tional information about the AV and is used to measure stroke volume or cardiac output using spectral Doppler (see Chapter 21).
ideal view demonstrates only the LV, MV, and LA (Video 14.8). If any part of the RV or LVOT is in view, then the transducer is underrotated or overrotated, respectively. This view allows for assessment of regional LV function, specifically with respect to the anterior and inferior LV walls.
3. Apical 3-chamber view: Starting from the apical 2-chamber view, the transducer is rotated an additional 30 degrees counter-clockwise. The ideal view demonstrates the LV, MV, and LA, with the LVOT and AV now appearing at the 5 o’clock position (Video 14.9). This view allows assessment
Mitralvalve
Tricuspidvalve
LA
LV
RA
RV
LVMV
LARA
RV
TV
A
B
C D
Figure 14.8 Apical 4-Chamber View. (A) Transducer position. (B) Imaging plane. (C) Cross-sectional anatomy. (D) Ultrasound image. LA, Left atrium; LV, left ventricle; MV, mitral valve; RA, right atrium; RV, right ventricle; TV, tricuspid valve.

14—CARDIAC ULTRASOUND TECHNIQUE 121
5. Pericardial tamponade and severe RV dys-function, two conditions that may require urgent intervention, can often be diagnosed effectively from the subcostal window.
6. Hypovolemia and LV systolic dysfunction, two common clinical conditions, can fre-quently be diagnosed from the subcostal window.The transducer is placed immediately below
the xiphoid process in the midline with the transducer orientation marker pointed to the patient’s left side. The transducer should be pressed down firmly, almost flattened under the xiphoid process. In some patients, a sig-nificant amount of pressure is required, and patients should be warned about the potential discomfort. The ultrasound transducer face should be aimed upward toward the heart and left shoulder. If the provider is having difficulty visualizing the heart in this window, patients can bend their knees to relax abdominal wall musculature or perform a brief end-inspiratory breath hold to transiently shift the heart
Subcostal Window
IMAGING WINDOW
In the point-of-care ultrasound context, the subcostal window can provide high-yield information rapidly, especially in acutely ill patients. The subcostal window offers several advantages:1. Supine positioning is favorable for subcos-
tal imaging.2. Surface landmarks are reliable, permitting
rapid image acquisition in most cases.3. In emergent situations, such as during
cardiac arrest, the subcostal area is generally otherwise unoccupied and imaging from here minimizes interference with resuscita-tive efforts.
4. In patients with hyperinflated lungs due to chronic lung disease or mechanical ventila-tion, downward displacement of the heart leads to improved image quality from the subcostal window.
LV
RV
LA
MV
RA
TV
LV
LA
MV
LVRV
MVLARA
AV
LV AV
AO
LA
MV
A B
DC
Figure 14.9 Apical Views in Different Planes. (A) 4-Chamber. (B) 2-Chamber. (C) 3-Chamber. (D) 5-Chamber. AV, Aortic valve; LA, left atrium; LV, left ventricle; MV, mitral valve; RA, right atrium; RV, right ventricle; TV, tricuspid valve.

122 3—HEART
should be visualized in cross section along the long axis of the heart (Fig. 14.10, Video 14.11).
The subcostal 4-chamber view allows assess-ment of RV systolic function and visualization of the RV free wall, which is limited in other views. RV and LV chamber sizes can be compared; however, RV size in this view can be under-estimated since the imaging plane is through the inferior portion, rather than middle, of the RV. The subcostal window has high sensitivity for detection of pericardial effusions and dia-stolic collapse of the RV in cardiac tamponade. In many patients, reasonable visualization of
inferiorly. If bowel or stomach gas impedes image acquisition, the operator can slide the transducer toward the patient’s right, abutting the transducer to the right costal margin where it meets the xiphoid process, and use more of the liver as an acoustic window.
SUBCOSTAL 4-CHAMBER VIEW
Once the heart is in view in the subcostal window, subtle transducer manipulation can help acquire an optimal 4-chamber view. Ideally, the RV, LV, RA, LA, and pericardium
LA
LV
RA
RV
TV
MV
Liver
Apex
SeptumL
LV
LA
RA
RV
A
B
C D
Figure 14.10 Subcostal 4-Chamber View. (A) Transducer position. (B) Imaging plane. (C) Cross-sectional anatomy. (D) Ultrasound image. L, Liver; LA, left atrium; LV, left ventricle; MV, mitral valve; RA, right atrium; RV, right ventricle; TV, tricuspid valve.
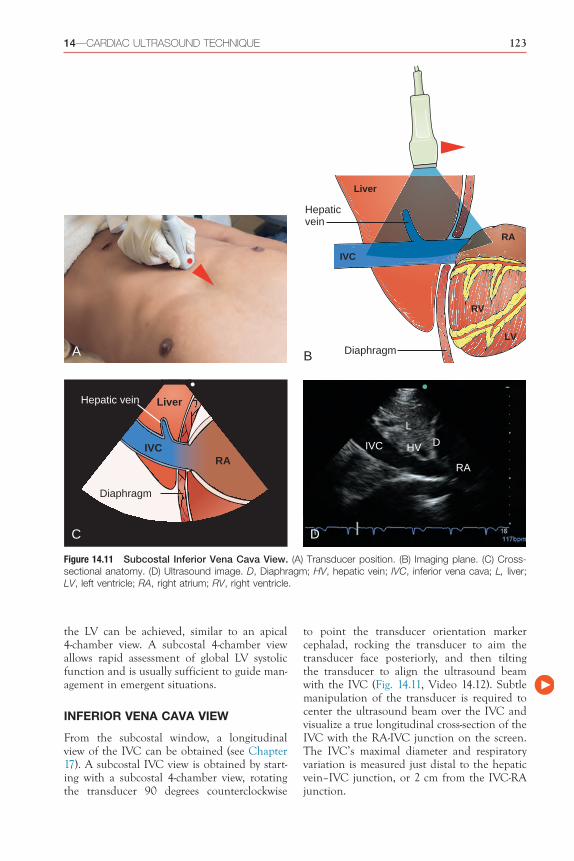
14—CARDIAC ULTRASOUND TECHNIQUE 123
to point the transducer orientation marker cephalad, rocking the transducer to aim the transducer face posteriorly, and then tilting the transducer to align the ultrasound beam with the IVC (Fig. 14.11, Video 14.12). Subtle manipulation of the transducer is required to center the ultrasound beam over the IVC and visualize a true longitudinal cross-section of the IVC with the RA-IVC junction on the screen. The IVC’s maximal diameter and respiratory variation is measured just distal to the hepatic vein–IVC junction, or 2 cm from the IVC-RA junction.
the LV can be achieved, similar to an apical 4-chamber view. A subcostal 4-chamber view allows rapid assessment of global LV systolic function and is usually sufficient to guide man-agement in emergent situations.
INFERIOR VENA CAVA VIEW
From the subcostal window, a longitudinal view of the IVC can be obtained (see Chapter 17). A subcostal IVC view is obtained by start-ing with a subcostal 4-chamber view, rotating the transducer 90 degrees counterclockwise
IVCRA
Liver
Diaphragm
Hepatic vein
LV
RA
RV
Liver
Diaphragm
IVC
Hepaticvein
L
DHVIVC
RA
A B
C D
Figure 14.11 Subcostal Inferior Vena Cava View. (A) Transducer position. (B) Imaging plane. (C) Cross- sectional anatomy. (D) Ultrasound image. D, Diaphragm; HV, hepatic vein; IVC, inferior vena cava; L, liver; LV, left ventricle; RA, right atrium; RV, right ventricle.

124 3—HEART
view, either from the parasternal or subcostal window, is recommended for a complete hemo-dynamic assessment. The subcostal short-axis view is particularly useful in patients who have obstructive lung disease or are mechanically ventilated, as these conditions tend to degrade parasternal image quality.
From the subcostal 4-chamber view, the transducer is rotated 90 degrees counter- clockwise to point the transducer orientation marker toward the patient’s head. Upon rota-tion of the transducer, the first structure to be visualized will be the base of the heart, similar to the pulmonary artery level or the AV level in the parasternal window. To obtain a midventric-ular view at the level of the papillary muscles, tilt the transducer to aim the ultrasound transducer face toward the apex (Fig. 14.13, Video 14.14).
Similar to the parasternal short-axis view, the subcostal short-axis view can be used to assess global LV systolic function and segmen-tal LV wall motion. Interventricular septal dynamics and circumferential pericardial effu-sions can also be seen.
SUPRASTERNAL WINDOW
Although suprasternal imaging is not routinely performed, the suprasternal window allows visualization of the aortic arch, which may be relevant for rapid detection of acute aortic pathologies in the point-of-care context. The patient is positioned supine with the neck extended. The transducer is placed in the suprasternal notch with the transducer ori-entation marker pointed to the patient’s left
An ideal subcostal IVC long-axis view shows the hepatic vein(s) emptying into the IVC, along with the IVC itself draining into the RA. Visualizing the RA-IVC junction avoids a common error of mistaking the abdominal aorta for the IVC. Although the abdominal aorta is commonly more calcified, pulsatile, surrounded by retroperitoneal fat, and located left of the IVC, it is often mistaken for the IVC during a rapid bedside evaluation by novice providers.
Additional Cardiac Views
PARASTERNAL RIGHT VENTRICULAR INFLOW VIEW
From a PLAX, a right ventricular (RV) inflow view is obtained by tilting the transducer to aim the ultrasound transducer face toward the patient’s right hip. The ideal RV inflow view allows visualization of the RV, RA, and TV without any portion of the LV (Fig. 14.12, Video 14.13). This view permits visualization of the posterior leaflet of the TV and assessment of tricuspid regurgitation (TR). If a portion of the LV is seen, the septal leaflet may be mis-taken for the posterior leaflet. In patients with TR, spectral Doppler can be used to measure the pressure gradient across the valve to esti-mate the pulmonary artery systolic pressure.
SUBCOSTAL SHORT-AXIS VIEW
A subcostal short-axis view is similar in appear-ance and clinical utility to the parasternal short-axis view. Acquisition of a short-axis
RATV
RV
Figure 14.12 Parasternal Right Ventricular Inflow View. RV, Right ventricle; TV, tricuspid valve; RA, right atrium.
PM
LV
RVL
Figure 14.13 Subcostal Short-Axis View. L, Liver; LV, left ventricle; PM, papillary muscle; RV, right ventricle.
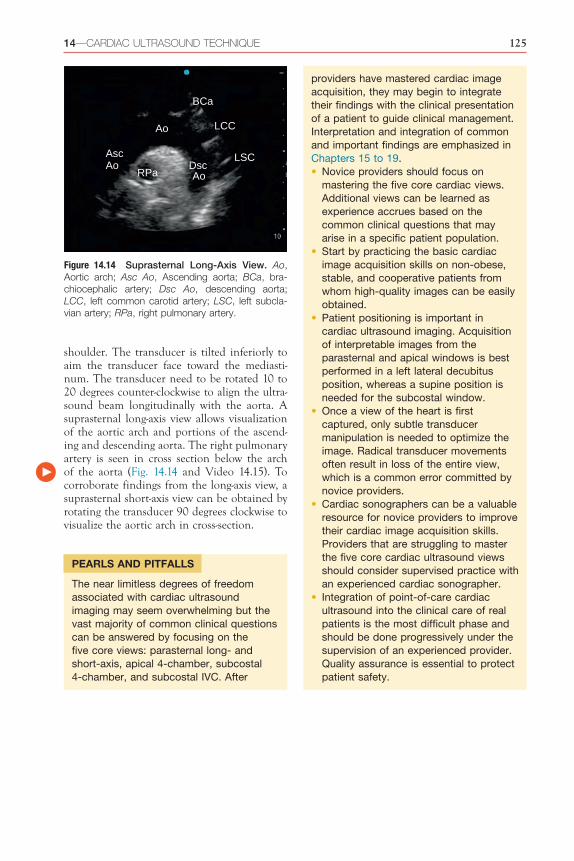
14—CARDIAC ULTRASOUND TECHNIQUE 125
RPa
LCC
Asc LSCAo
BCa
Ao
Ao
Dsc
Figure 14.14 Suprasternal Long-Axis View. Ao, Aortic arch; Asc Ao, Ascending aorta; BCa, bra-chiocephalic artery; Dsc Ao, descending aorta; LCC, left common carotid artery; LSC, left subcla-vian artery; RPa, right pulmonary artery.
providers have mastered cardiac image acquisition, they may begin to integrate their findings with the clinical presentation of a patient to guide clinical management. Interpretation and integration of common and important findings are emphasized in Chapters 15 to 19.• Novice providers should focus on
mastering the five core cardiac views. Additional views can be learned as experience accrues based on the common clinical questions that may arise in a specific patient population.
• Start by practicing the basic cardiac image acquisition skills on non-obese, stable, and cooperative patients from whom high-quality images can be easily obtained.
• Patient positioning is important in cardiac ultrasound imaging. Acquisition of interpretable images from the parasternal and apical windows is best performed in a left lateral decubitus position, whereas a supine position is needed for the subcostal window.
• Once a view of the heart is first captured, only subtle transducer manipulation is needed to optimize the image. Radical transducer movements often result in loss of the entire view, which is a common error committed by novice providers.
• Cardiac sonographers can be a valuable resource for novice providers to improve their cardiac image acquisition skills. Providers that are struggling to master the five core cardiac ultrasound views should consider supervised practice with an experienced cardiac sonographer.
• Integration of point-of-care cardiac ultrasound into the clinical care of real patients is the most difficult phase and should be done progressively under the supervision of an experienced provider. Quality assurance is essential to protect patient safety.
shoulder. The transducer is tilted inferiorly to aim the transducer face toward the mediasti-num. The transducer need to be rotated 10 to 20 degrees counter-clockwise to align the ultra-sound beam longitudinally with the aorta. A suprasternal long-axis view allows visualization of the aortic arch and portions of the ascend-ing and descending aorta. The right pulmonary artery is seen in cross section below the arch of the aorta (Fig. 14.14 and Video 14.15). To corroborate findings from the long-axis view, a suprasternal short-axis view can be obtained by rotating the transducer 90 degrees clockwise to visualize the aortic arch in cross-section.
PEARLS AND PITFALLS
The near limitless degrees of freedom associated with cardiac ultrasound imaging may seem overwhelming but the vast majority of common clinical questions can be answered by focusing on the five core views: parasternal long- and short-axis, apical 4-chamber, subcostal 4-chamber, and subcostal IVC. After

14—CARDIAC ULTRASOUND TECHNIQUE 125.e1
D. Mitral valve approximation to the septum
E. Anterior LV wall motionAnswer: D. The anterior leaflet of the mitral valve is well visualized from a parasternal long-axis view as it approximates the septum during diastole. Although assessment of the mitral and aortic valves with color flow Doppler is often performed from a parasternal long-axis view, the direction of blood flow is perpendicular to the plane of insonation, and therefore, the severity of regurgitation may be underestimated. The anterior wall of the left ventricle is not seen from a parasternal long-axis view, nor is the majority of the right ventricle.
4. The parasternal short-axis view at the midventricular level allows assess-ment of all of the following, except ________________________.A. Aortic valveB. Shape of the interventricular septumC. Left ventricular functionD. Pericardial effusionAnswer: A. The aortic valve is not visible in the parasternal short-axis view at the midventricular level. The aortic valve can be visualized by tilting the transducer cephalad to capture a parasternal short-axis view at the cardiac base.
5. Why is the midventricular level used to assess left ventricular systolic function (LVSF) from a parasternal short-axis view?A. The inferior and lateral walls are not
well visualized at the mitral valve levelB. The inferior and lateral walls are not
well visualized at the apical levelC. Underestimation of LVSF may occur at
the mitral valve levelD. Underestimation of LVSF may occur at
the apical levelE. None of the aboveAnswer: C. All four LV walls (anterior, lateral, septal, and inferior) are well visualized from the mitral valve, midventricular, and apical levels of a parasternal short-axis view. Assessment of LVSF is most accurate at the midventricular level because overestimation of LVSF can occur at the apical level due to the hyperdynamic nature of the apex and underestimation can occur at the mitral valve level due to restriction from the mitral valve annulus.
Review Questions1. Which of the following views is NOT
considered one of the five core views to perform a point-of-care cardiac ultrasound exam?A. Subcostal IVCB. Subcostal 4-chamberC. Apical 2-chamberD. Parasternal short-axisE. Parasternal long-axisAnswer: C. The apical 2-chamber view visualizes the left ventricle, left atrium, and mitral valve but is not considered one of the core point-of-care cardiac views. The five core views are: parasternal long-axis, parasternal short-axis, apical 4-chamber, subcostal 4-chamber, and subcostal inferior vena cava.
2. Match each of the structures listed below with the parasternal long-axis view (eFig. 14.15).Descending thoracic aorta ______
Right ventricle _________
Anterior leaflet of mitral valve ______
Left atrium ______
Chordae tendinae ______
Aortic valve ______
Answers:Descending thoracic aorta __F____
Right ventricle _____E____
Anterior leaflet of mitral valve __B____
Left atrium ___D___
Chordae tendinae __A____
Aortic valve __C____
BA
E
D
C
F
eFigure 14.15
3. The parasternal long-axis view is ideal to assess _________________________.A. Right ventricular functionB. Mitral valve using color flow DopplerC. Aortic valve using color flow Doppler

125.e2 3—HEART
C. Anterior and inferior wallsD. Anteroseptal and inferolateral wallsAnswer: B. The anterolateral and inferoseptal walls are seen in the apical 4-chamber view. The anterior and inferior walls are seen in apical 2-chamber view, and the anteroseptal and inferolateral walls are seen in the apical 3-chamber view. (See Fig. 14.6.)
9. Which of the following statements is true regarding the subcostal 4-chamber (S4C) view?A. Left lateral decubitus position is
preferredB. Hyperinflated lungs improve acquisi-
tion of a S4C viewC. Aortic valve is well visualizedD. Low sensitivity for detection of pericar-
dial effusionsAnswer: B. The downward displacement of the heart in patients with hyperinflated lungs due to chronic lung disease or mechanical ventilation is ideal for imaging from the subcostal window. Supine positioning is standard for acquisition of a S4C view. Although the aortic valve may be seen from off-axis imaging, only the mitral and tricuspid valves are seen from a standard S4C view. The S4C view has high sensitivity for detection of pericardial effusions.
10. Where should IVC collapsibility be mea-sured (eFig. 14.17)?Answer: C. The IVC’s maximal diameter and respiratory variation is measured 2 cm from the IVC-RA junction, or just distal to the hepatic vein–IVC junction.
6. What is the primary transducer manipula-tion that allows visualization of the mul-tiple levels of the parasternal short-axis view?A. SlidingB. RotatingC. TiltingD. RockingAnswer: C. From a parasternal short-axis view at the midventricular level, the transducer should be slowly tilted cephalad or caudad to visualize the multiple levels of the parasternal short-axis view. Care must be taken to avoid sliding to a different location on the chest. In some situations, rocking the transducer may be needed to center the image on the screen, but rotating is rarely needed.
7. Match each of structures listed below with this apical 4-chamber view (eFig. 14.16).Left atrium ______ Right atrium
_________Left ventricle ______ Right ventricle
______Mitral valve ______ Tricuspid valve
______Answers:Left atrium __F____ Right atrium
____C_____Left ventricle __D____ Right ventricle
__A____Mitral valve __E____ Tricuspid valve
_ B_____
B
A
E
D
CF
eFigure 14.16
8. Which of the following left ventricu-lar walls is usually seen from the apical 4-chamber view?A. Lateral and septal wallsB. Anterolateral and inferoseptal walls
BA DC
eFigure 14.17

14—CARDIAC ULTRASOUND TECHNIQUE 125.e3
References1. Melamed R, Sprenkle MD, Ulstad VK, Herzog
CA, Leatherman JW. Assessment of left ventricu-lar function by intensivists using hand-held echo-cardiography. Chest. 2009;135(6):1416–1420.
2. Mark DG, Hayden GE, Ky B, et al. Hand-carried echocardiography for assessment of left ventricular filling and ejection fraction in the sur-gical intensive care unit. J Crit Care. 2009;24(3):470.e471–470.e477.
3. Razi R, Estrada JR, Doll J, Spencer KT. Bedside hand-carried ultrasound by internal medicine residents versus traditional clinical assessment for the identification of systolic dysfunction in patients admitted with decompensated heart failure. J Am Soc Echocardiogr. 2011;24(12):1319–1324.
4. Brennan JM, Blair JE, Goonewardena S, et al. A comparison by medicine residents of physical examination versus hand-carried ultrasound for estimation of right atrial pressure. Am J Cardiol. 2007;99(11):1614–1616.
5. Lucas BP, Candotti C, Margeta B, et al. Diagnos-tic accuracy of hospitalist-performed hand-carried ultrasound echocardiography after a brief train-ing program. J Hosp Med. 2009;4(6):340–349.
6. Martin LD, Howell EE, Ziegelstein RC, et al. Hospitalist performance of cardiac hand-carried ultrasound after focused training. Am J Med. 2007;120(11):1000–1004.
7. Perez-Avraham G, Kobal SL, Etzion O, et al. Left ventricular geometric abnormality screen-ing in hypertensive patients using a hand-carried ultrasound device. J Clin Hypertens (Greenwich). 2010;12(3):181–186.
8. Mayo PH, Beaulieu Y, Doelken P, et al. Amer-ican college of chest physicians/la societe de reanimation de langue francaise statement on competence in critical care ultrasonography. Chest. 2009;135(4):1050–1060.
9. Cardenas-Garcia J, Mayo PH. Bedside ultra-sonography for the intensivist. Crit Care Clin. 2015;31(1):43–66.
10. Arntfield R, Millington S, Ainsworth C, et al. Canadian recommendations for critical care ultrasound training and competency. Can Respir J. 2014;21(6):341–345.
11. Ihnatsenka B, Boezaart AP. Ultrasound: basic understanding and learning the language. Int J Shoulder Surg. 2010;4(3):55–62.
12. Cook CH, Praba AC, Beery PR, Martin LC. Transthoracic echocardiography is not cost-effective in critically ill surgical patients. J Trauma. 2002;52(2):280–284.
13. AIUM technical bulletin. Transducer manipula-tion. American institute of ultrasound in medi-cine. J Ultrasound Med. 1999;18(2):169–175.

219
C H A P T E R 24Peritoneal Free FluidCraig Sisson � Jessica Solis-McCarthy
BackgroundPeritoneal free fluid is divided into intra- and extraperitoneal fluid. Intraperitoneal fluid is located within the peritoneal cavity, whereas extraperitoneal fluid is located outside the peritoneal cavity and is typically referred to as retroperitoneal fluid. In this chapter, we use the term peritoneal free fluid to refer to intraper-itoneal free fluid.
The gravitationally dependent anatomic locations where peritoneal free fluid prefer-entially accumulates have been recognized for over a century.1–3 It has been known that physical examination of the abdomen has low sensitivity for diagnosing intra-abdominal pathologies.4–8 Providers can use ultrasound to detect small amounts of peritoneal free fluid and guide procedures, most often para-centesis. Free-flowing fluid appears black, or anechoic, on ultrasound imaging (Video 24.1).
Ultrasound cannot precisely differentiate types of peritoneal free fluid, such as blood, ascites, urine, or bile. Therefore, historical clues, such as recent trauma or preexisting medical condi-tions, must be considered when interpreting the presence and significance of peritoneal free fluid.
The minimum amount of fluid in the peri-toneal cavity detectable by ultrasound will vary depending on several factors: patient position-ing, etiology of fluid accumulation, elapsed time from onset of fluid accumulation, body habitus, quality of images, and provider skill level.9–13 A range of 100 to 620 mL has been reported as the minimum amount of intraperi-toneal free fluid detectable by ultrasound.14
Etiologies of peritoneal free fluid can be divided into traumatic and atraumatic causes. In trauma patients, the presence of peritoneal free fluid reflects blood until proven otherwise and is a surrogate marker for solid organ injury.
K E Y P O I N T S
• Focused abdominal ultrasonography is a sensitive and reliable bedside technique to detect intraperitoneal free fluid, although it cannot differentiate specific types of fluid.
• Ultrasound is the diagnostic modality of choice for the initial screening of unstable blunt trauma patients for peritoneal free fluid.
• Performing abdominal paracentesis with ultrasound guidance has been shown to increase procedural success rates and reduce the risk of complications.
S E C T I O N 4Abdomen and Pelvis

220 4—ABDOMEN AND PELVIS
Image AcquisitionA low-frequency curvilinear or phased-array transducer is needed to examine the abdomen and pelvis. Three areas must be evaluated in the assessment for peritoneal free fluid: the right upper quadrant, left upper quadrant, and pelvis. The liver, spleen, and urine-filled bladder, respectively, serve as the acoustic windows to evaluate these areas (Fig. 24.1). An empty or rup-tured bladder, subcutaneous emphysema, bowel or stomach gas, wound dressings, and asple-nia can reduce the sensitivity of ultrasound to detect peritoneal free fluid from these windows. Placing the patient in a Trendelenburg or reverse Trendelenburg position helps pool peri-toneal free fluid in gravitationally dependent areas to increase sensitivity of the examination to detect small volumes of fluid.13,14,21
RIGHT UPPER QUADRANT
In the right upper quadrant, three spaces should be visualized: the right subdiaphrag-matic space, hepatorenal space, and the infe-rior pole of the right kidney. Visualizing all three spaces systematically can help avoid missing small collections of fluid. Place the transducer in a coronal plane on the midaxil-lary line between the 9th and 11th ribs with the transducer orientation marker pointing cephalad and rotated slightly posteriorly (Fig. 24.2). Adjust the transducer position to focus on the potential space between the liver and kidney (hepatorenal space or Morison’s pouch) (Fig. 24.3). Tilt the transducer from anterior to posterior through the entire hepatorenal space to visualize the inferior tip of the liver, looking for free fluid. Rock or slide the transducer superiorly to image the right subdiaphragmatic space, and inferiorly to image the inferior pole of the right kidney, which serves as an ana-tomic marker for the right paracolic gutter (Fig. 24.4; Videos 24.2 and 24.3).
LEFT UPPER QUADRANT
In the left upper quadrant, three spaces should be visualized: the left subdiaphragmatic space (perisplenic space), the splenorenal space, and the inferior pole of the left kidney. In contrast to the right upper quadrant, the left upper quadrant is best visualized with the transducer in a more posterior and superior position due to the location of the spleen. Place the transducer in a coronal plane on the posterior axillary
Hemoperitoneum from blunt trauma most commonly originates in the upper abdomen from injury to the spleen or liver.15 The hepa-torenal space is the single most sensitive area for detection of hemoperitoneum secondary to blunt trauma.16 Atraumatic etiologies of peri-toneal free fluid can include emergent causes, such as ruptured ectopic pregnancy, and non- emergent causes, such as chronic ascites due to cirrhosis.
When used for procedural guidance, ultra-sound can guide site selection to perform a diagnostic or therapeutic paracentesis. Ultra-sound guidance for paracentesis has been shown to improve procedural success rates and decrease reduce the risk of complications, as well as decrease hospital costs and length of stay.17–19
Normal AnatomyDetection of peritoneal fluid by ultrasound requires an understanding of the anatomic spaces where free fluid accumulates in the abdomen. The peritoneal cavity is subdivided into greater and lesser peritoneal sacs. The greater peritoneal sac is further divided into supracolic and infracolic compartments by the transverse mesocolon. Pathologic fluid can pass between the supracolic and infracolic compart-ments via the paracolic gutters, the peritoneal spaces lateral to the ascending and descending colon.
In the upright and supine positions, the most gravitationally dependent area of the combined abdomino-pelvic peritoneal space is the pelvis, specifically caudal to the sacral promontory. In the abdominal peritoneal space alone, the hepatorenal space, or Morison’s pouch, is the most gravitationally dependent area above the pelvic inlet in a supine position. When fluid accumulation begins in a supine position, fluid gravitates toward the hepatore-nal space for three reasons. First, the hepato-renal peritoneal reflection is more posterior relative to other abdominal structures. Second, the lordotic curvature of the lumbar spine and anterior location of the sacral promontory rela-tive to the hepatorenal space prevent free fluid from flowing into the pelvis. Third, the phren-icocolic ligament, a peritoneal reflection in the left upper quadrant, shunts blood from the left upper quadrant toward the hepatorenal space.20
However, if a patient has been upright, perito-neal free fluid from the abdomen will pool in the pelvis, regardless of the site of origin.

24—PERITONEAL FREE FLUID 221
Liver
KidneyLung
Diaphragm
Spine
Hepatorenalrecess
Right upperquadrant
A
C D
B Left upperquadrant
Spleen
Kidney
LungDiaphragm
Subdia-phragmaticspace
Splenorenalrecess
Bladder
Uterus
Rectum
Bladder
Rectum
Rectouterinespace
Prostate
Rectovesicularspace
Femalepelvis
Malepelvis
Liver
Hepatorenalrecess
Kidney
Diaphragm
Kidney
Spleen
Diaphragm
Prostate
Male Pelvis
Bladder
Rectovesicularspace
Uterus
Female Pelvis
Bladder
Rectouterinespace
Figure 24.1 Detection of Peritoneal Free Fluid. (A) Right upper quadrant. Visualize the right subdiaphrag-matic space, hepatorenal space (Morison’s pouch, most important area in the right upper quadrant), and the right inferior pole of the kidney. (B) Left upper quadrant. Visualize the left subdiaphragmatic space (most important area in the left upper quadrant), splenorenal space, and left inferior pole of the kidney. (C) and (D) Pelvic window. Visualize the rectouterine space in females (C) and the rectovesicular space in males (D).

222 4—ABDOMEN AND PELVIS
Liver
Free fluid
Free fluid
Stomach
Spleen
KidneyKidney
Peritoneum
Hepatorenalrecess Subdiaphragmatic
perisplenic space
Figure 24.3 Right and Left Upper Quadrant Cross-Sectional Anatomy. Peritoneal free fluid accumulates in the hepatorenal space (Morison’s pouch) and perisplenic space.
Liver
Hepatorenalrecess
Kidney
Diaphragm
LiverKidney
Free fluid
A B
Figure 24.4 (A) Normal right upper quadrant. (B) Peritoneal free fluid in the hepatorenal space in a patient after blunt trauma.
Figure 24.2 Transducer Position in Right Upper Quadrant. Place the transducer on the midaxillary line between the 9th and 11th ribs with the trans-ducer orientation marker pointed cephalad and rotated slightly posteriorly.
posteriorly. First, evaluate the left subdia-phragmatic, or perisplenic space, where fluid is most likely to collect. (Fig. 24.6 and Video 24.4). Similar to the right upper quadrant, tilt the transducer through the perisplenic space from anterior to posterior. In contrast to the hepatorenal space, the splenorenal space is not the preferred location for acculumation of free fluid due to the splenorenal ligaments attaching the spleen, left kidney, and tail of the pancreas. The inferior poles of the left kidney and spleen should be visualized along with the superior portion of the left paracolic gutter.
PELVIS
Peritoneal free fluid in the pelvis accumulates in the rectovesicular space in men and the rectouterine space, or pouch of Douglas, in women (Fig. 24.7). To image the pelvic space, place the transducer in a transverse plane over the pubic symphysis with the transducer marker pointed toward the patient’s right. Tilt the transducer inferiorly into the pelvis until
line between the 6th and 9th intercostal spaces with the transducer marker pointing cephalad (Fig. 24.5). Providers usually have to put their “knuckles to the bed” for supine patients. The image may be improved by rotating the trans-ducer 10 to 20 degrees clockwise with the transducer orientation marker pointing slightly

24—PERITONEAL FREE FLUID 223
the bladder is visualized (Fig. 24.8 and Videos 24.5–24.7). Set the imaging depth to view the bladder in the top one-third to one-half of the screen. Posterior acoustic enhancement is seen deep to the bladder, usually requiring a reduc-tion in the far field gain. It is important to tilt the transducer to visualize the entire bladder from fundus to neck to thoroughly evaluate the rectovesicular or rectouterine space for any free fluid collections (Fig. 24.9; Videos 24.8 and 24.9). Rotate the transducer 90 degrees clock-wise to obtain sagittal views of the bladder and
Figure 24.5 Transducer Position in Left Upper Quadrant. Place the transducer on the posterior axillary line between the 6th and 9th ribs with the transducer orientation marker pointed cephalad and rotated slightly posteriorly.
A
Kidney
Spleen
Diaphragm
B SpleenDiaphragm
Blood
Figure 24.6 (A) Normal left upper quadrant. (B) Peri-toneal free fluid in the left subdiaphragmatic space.
scan the entire bladder from left to right. If the bladder is decompressed, it can be refilled with warm normal saline through the injection port of a urinary catheter with the catheter clamped.
Image InterpretationIn trauma patients, liver or spleen injuries are difficult to visualize, and the presence of peri-toneal free fluid is a surrogate marker for solid organ injury. When the source of bleeding is in the upper abdomen, the hepatorenal space is the most sensitive location to detect perito-neal free fluid in supine patients.16 In the left upper quadrant, free fluid initially accumulates in the left subdiaphragmatic space, whereas in the right upper quadrant, fluid initially accu-mulates in the hepatorenal space.20 In the absence of an anatomic obstruction, fluid in the perisplenic space eventually overflows into the more dependent hepatorenal space in the right upper quadrant.
Normally, there is no visible peritoneal free fluid in the abdomino-pelvic cavity in males. In females, a small amount of physiologic fluid may be present in the pelvis. If the volume of pelvic free fluid appears non-trivial or there is strong clinical concern, the source should be investigated. The urgency to evaluate free fluid in the female pelvis depends on the patient’s stability and clinical situation.
Generally, all types of peritoneal free fluid, including ascites, blood, bile, lymph, and urine appear black, or anechoic, by ultrasound (see Video 24.1). However, peritoneal free fluid that contains clotted blood, pus, or debris appears more echogenic due to high protein content (Videos 24.10 and 24.11). Solid debris from a ruptured hollow viscus can appear heteroge-neously echogenic. Loculations (Videos 24.12 and 24.13) and bowel adhesions to the abdom-inal wall (Video 24.14) can also be seen.
As fluid accumulates in the abdomen, loops of small bowel begin to float freely and are seen tethered posteriorly by the mesentery (Fig. 24.10 and Video 24.15). The perito-neal space can fill with several liters of fluid, which is accompanied by progressive disten-tion of the abdomen. If the peritoneal free fluid is not removed, intra-abdominal pressure will increase, causing reduced diaphragmatic excursion and potentially causing abdominal hypertension which can lead to abdominal compartment syndrome.
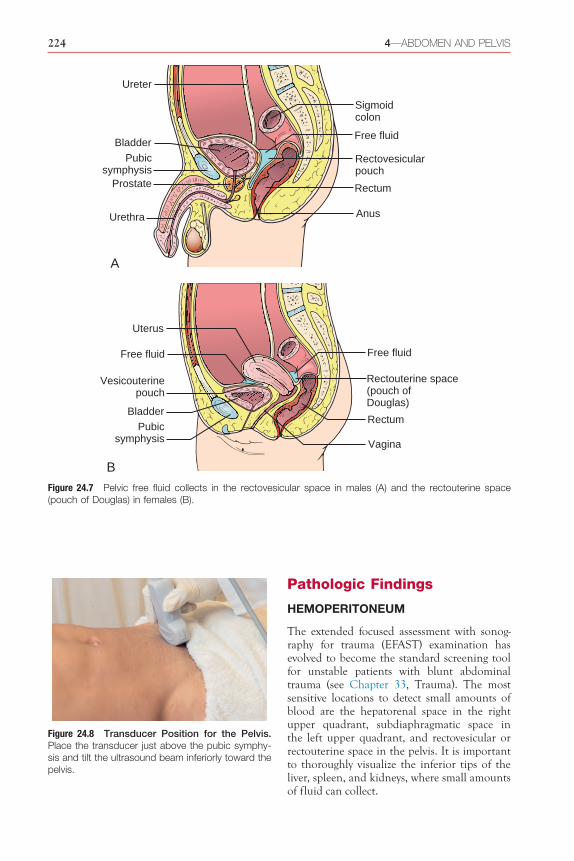
224 4—ABDOMEN AND PELVIS
Pathologic Findings
HEMOPERITONEUM
The extended focused assessment with sonog-raphy for trauma (EFAST) examination has evolved to become the standard screening tool for unstable patients with blunt abdominal trauma (see Chapter 33, Trauma). The most sensitive locations to detect small amounts of blood are the hepatorenal space in the right upper quadrant, subdiaphragmatic space in the left upper quadrant, and rectovesicular or rectouterine space in the pelvis. It is important to thoroughly visualize the inferior tips of the liver, spleen, and kidneys, where small amounts of fluid can collect.
Figure 24.8 Transducer Position for the Pelvis. Place the transducer just above the pubic symphy-sis and tilt the ultrasound beam inferiorly toward the pelvis.
A
Bladder
Prostate
Urethra
Pubicsymphysis
Ureter
Sigmoidcolon
Free fluid
Rectovesicularpouch
Rectum
Anus
BladderPubic
symphysis
Uterus
Free fluid Free fluid
Rectouterine space(pouch ofDouglas)
Rectum
Vagina
Vesicouterinepouch
B
Figure 24.7 Pelvic free fluid collects in the rectovesicular space in males (A) and the rectouterine space (pouch of Douglas) in females (B).

24—PERITONEAL FREE FLUID 225
landmark in the natural history of cirrhosis, with 1- and 5-year mortality rates of 15% and 44%, respectively.23 Ultrasound can differ-entiate ascites from other common causes of abdominal distention, such as adipose tissue, abdominal wall edema (Video 24.16), and gas-filled loops of bowel (Video 24.17). Ascites volume can be qualitatively categorized as small (Video 24.18), moderate, or large (Video 24.19). In advanced stages of cirrhosis, the liver appears small and fibrotic with increased echogenic-ity (Video 24.20), and incidental regenerative nodules or masses may be seen (Video 24.21).
Other PathologiesThe vast majority of atraumatic cases of perito-neal free fluid accumulation are due to ascites from cirrhosis. Other causes include right heart failure, renal failure, pancreatitis, and peritoneal dialysis. In females, pathologic con-ditions related to the ovaries are an important cause of peritoneal free fluid accumulation. A positive pregnancy test without an identi-fiable intrauterine pregnancy associated with the presence of peritoneal free fluid should be considered an ectopic pregnancy until proven otherwise (see Chapter 29, First Trimester Pregnancy). Other sex-specific causes of perito-neal free fluid include ruptured hemorrhagic ovarian cysts and ovarian malignancies. Malig-nant ascites can occur with multiple cancers in both sexes. Less common causes of peritoneal free fluid include portal vein, hepatic vein, and inferior vena caval thrombosis.
ParacentesisUltrasound guidance has proven to reduce the risk of complications and improve procedural success rates when performing paracentesis.17–19
Ultrasound is most often used to mark a needle insertion site prior to performing a diagnostic or therapeutic paracentesis. Before performing paracentesis, the bladder should be emptied, either spontaneously or by placement of a urinary catheter, and the patient should be placed in a supine position with the head of the bed elevated 30 to 45 degrees to pool ascites in bilateral lower quadrants.
Using a low-frequency curvilinear or phased-array transducer, scan the lower quad-rants of the abdomen in a longitudinal plane with the transducer marker oriented cephalad. Scan lateral to the rectus abdominis muscles to
ASCITES
Ascites is the most common complication of cirrhosis leading to hospital admission,22
and development of ascites is an important
Prostate
Male pelvis
Bladder
Rectovesicularspace
A
Bladder
Rectum
Free fluid
Male pelvis
B
Uterus
Female pelvis
Bladder
Rectouterinespace
C
Free fluid
Female pelvisUterus
Rectum
D
Figure 24.9 Normal (A) and abnormal (B) male pelvis with free fluid collecting in the rectovesicular space. Normal (C) and abnormal (D) female pelvis with free fluid collecting in the rectouterine space (pouch of Douglas).

226 4—ABDOMEN AND PELVIS
most gravitationally dependent areas of the abdominopelvic cavity, the right and left upper quadrants and pelvis as described above, to diagnose whether any ascites is present. If only a scant amount of peritoneal free fluid is seen in the lower quadrants, paracentesis cannot be performed safely (Video 24.22).
The abdominal wall has several superficial and deep blood vessels that must be avoided during paracentesis. The inferior epigastric, superficial epigastric, circumflex iliac, and
localize the largest collection of peritoneal free fluid with the greatest distance from nearby organs and the thinnest abdominal wall. Site selection is ideally along the muscular aponeu-rosis lateral to the rectus abdominis muscles (Fig. 24.11). Medial to the muscular aponeuro-sis there is greater risk of injury to the inferior epigastric vessels, and laterally the abdominal wall is thicker and there is also risk of injury to vessels (Fig. 24.12). If no peritoneal free fluid is visualized in the lower quadrants, scan the
Rectusabdominis
Linea alba
Inferiorepigastricartery andveins
Muscularaponeuroses
Thoracoabdominalnerve, artery, and
veinExternal oblique
muscle
Transversusabdominis muscle
Internaloblique muscle
EndoabdominalfasciaPeritoneum
Figure 24.11 Abdominal Wall Cross-Section. The anterolateral muscular aponeurosis of the abdomen wall is the ideal window for paracentesis. Blood vessels of the anterior abdominal wall (inferior epigastric vessels) and lateral abdominal wall (thoraco-abdominal vessels) should be avoided. The lateral abdominal wall has greater adipose tissue and musculature which is not ideal for paracentesis. The avascular linea alba in the midline of the abdomen is an alternative site but the bladder must be decompressed prior to paracentesis.
Ascites Bowels
Figure 24.10 Large Volume of Ascites With Free Floating Loops of Small Bowel Tethered by the Mesentery Posteriorly.

24—PERITONEAL FREE FLUID 227
thoracoepigastric arteries and veins are the major blood vessels in the abdominal wall (Fig. 24.12). Selecting a needle insertion site lateral to the rectus abdominis muscles avoids most inferior epigastric vessels, but the exact loca-tion, size, and branching of the inferior epi-gastric vessels varies significantly. For maximal safety, evaluate the needle insertion site with a high-frequency linear transducer using color flow or power Doppler ultrasound to detect any blood vessels that flow through the intended paracentesis site. Place the color flow or power Doppler box on the abdominal wall over the anticipated needle tract (Video 24.23). If blood vessels are detected, slide the transducer a few centimeters laterally and recheck until a site without any visible large blood vessels is identified.
Although ultrasound is most often used to mark a needle insertion site (static guidance), real-time ultrasound guidance can be used to visualize the needle entering the peritoneal cavity when the fluid collection is small or risk of injury to adjacent organs is high. To perform real-time ultrasound-guided paracentesis, cover the transducer with a sterile sheath and place it in the sterile field. A transverse (out-of-plane) or longitudinal (in-plane) approach can be used to track the needle tip under direct visualiza-tion. The skin and subcutaneous tissues can
Internal thoracicartery and vein
Superiorepigastricartery and vein
Superficialepigastric artery
and veinInferior epigastricartery and vein
Musculophrenicartery and vein
Deep circumflexiliac artery andveinInguinal ligament
Femoralartery and vein
Lateralthoracic vein
Thoracoepigastricvein
Superficialcircumflexiliac artery
and vein
Superficialexternal
pudendalartery and vein
Figure 24.12 Abdominal Wall Vascular Anatomy. Note the location of inferior epigastric, subcostal, cir-cumflex iliac, and thoracoepigastric vessels that should be avoided during paracentesis.
be anesthetized under direct visualization to ensure that you have anesthetized all tissues to the peritoneum (Video 24.24). Similarly, a large-bore needle or needle-catheter is inserted under direct visualization as it enters the peri-toneal cavity, and a diagnostic or therapeutic drainage can be performed (Video 24.25).
PEARLS AND PITFALLS
• A fluid-filled stomach can cause a false-positive interpretation of free fluid in the left upper quadrant, especially in urgent or emergent situations (Fig. 24.13).24
• Previous abdominal surgeries can alter fluid accumulation in gravitationally dependent areas. It is important to note any surgical scars when performing an abdominal ultrasound exam.
• When fluid surrounding the kidneys does not track into the peritoneum, the presence of retroperitoneal fluid should be considered, particularly from a ureteral injury or abdominal aortic aneurysm. This finding is not sensitive for evaluating retroperitoneal structures, and a computed tomography (CT) scan of the abdomen should be obtained.

228 4—ABDOMEN AND PELVIS
• Peritoneal free fluid disperses in dependent areas and does not appear well circumscribed, unless adhesions or scarring are present. A working knowledge of abdominal anatomy and its ultrasound appearance will enable providers to differentiate peritoneal free fluid from other structures, such as renal cysts, seminal vesicles, fluid filled viscera and perinephric fat (Fig. 24.14).
Right upperquadrant
Liver
Renal cyst
Kidney
Figure 24.14 Right Upper Quadrant Renal Cyst Located in the Hepatorenal Space that Could be Mistaken for Free Fluid.
• Gas-filled structures, including the stomach, large and small bowels, and subcutaneous emphysema, do not provide adequate windows to visualize underlying organs. For gas-filled loops of small bowel, firm pressure and gentle tilting of the transducer can often shift loops of bowel aside to improve visualization of underlying structures.
Left upperquadrant
Stomach
Diaphragm
Spleen
Kidney
Figure 24.13 Left Upper Quadrant Window Showing a Fluid-Filled Stomach. Note that the fluid does not layer under the diaphragm, appears well contained, and the normally round edges of the spleen appear sharp or pointed.

24—PERITONEAL FREE FLUID 228.e1
CASE 24.1
CASE PRESENTATION
A 26-year-old man is brought to the emergency department after blunt trauma from a motor vehicle accident. He was a restrained driver in a side-impact collision with airbag deployment. He arrives immobilized on a backboard with a cervical collar in place. He is alert but confused and complaining of chest and abdominal pain. Physical exam reveals diffuse abdominal pain with guarding and rebound tenderness. Vital signs are remarkable for tachycardia (132) and hypotension (80/40s).
ULTRASOUND FINDINGS
A point-of-care ultrasound exam per the focused assessment with sonography for trauma (FAST) protocol is performed. Evaluation of the right and left upper quadrants reveals a large amount of free fluid in the hepatorenal space (Video 24.26) and left subdiaphragmatic space
(Video 24.27). No free fluid is detected in the pelvis (Video 24.28).
CASE RESOLUTION
Two large-bore peripheral intravenous catheters are placed, and he is bolused 2 L of Ringer’s Lactate while type O, uncrossed blood is mobi-lized. Transfusion of two units of blood is started, but his blood pressure remains low. He is emer-gently transported to the operating room for exploratory laparotomy. Splenic and liver injuries are found intraoperatively.
Trauma patients can be rapidly assessed using the FAST exam to detect peritoneal hem-orrhage. Supine trauma patients initially accumu-late free fluid in the hepatorenal space in the right upper quadrant and subdiaphragmatic space in the left upper quadrant before the fluid descends into the pelvis.
CASE 24.2
CASE PRESENTATION
A 66-year-old female with a history of hyperten-sion and untreated rectal cancer presents with a 1-month history of worsening abdominal disten-tion. She complains of decreased exercise toler-ance and shortness of breath. Her abdomen is distended with discomfort to palpation. Lab work reveals a normal white blood cell count and mild elevation of her liver function tests.
ULTRASOUND FINDINGS
Prior to seeing the patient, radiology had been consulted by a colleague to perform an abdom-inal ultrasound exam, and a site was marked with an “X” for paracentesis. Placement of the transducer over the site marked reveals several gas-filled loops of bowel next to the peritoneum and abdominal wall edema (Video 24.29). Sliding the transducer laterally and superiorly reveals a small collection of ascites where paracente-sis can be safely performed (Video 24.30) and where the abdominal wall is thinner, measur-ing only 1.88 cm (eFig. 24.15). Prior to starting the procedure, use of color flow Doppler to
detect any superficial vessels reveals an artery in the subcutaneous tissue of the selected site (Video 24.31). The transducer is moved a few centimeters laterally and a safe needle insertion site is selected.
CASE RESOLUTION
A 16-gauge needle with catheter is inserted at the selected site. A diagnostic and therapeutic paracentesis is performed. A total of 900 mL of chylous ascites is drained. The patient reports some relief and compliments the team on a pain-less procedure. Laboratory evaluation rules out spontaneous bacterial peritonitis and confirms the presence of malignant ascites.
Point-of-care ultrasound can readily differ-entiate abdominal distention due to ascites, gas-filled loops of bowel, adipose tissue, and abdominal wall edema. Ultrasound guidance for paracentesis reduces complication rates and increases procedural success rates. Ultrasound can identify the largest collection of ascites that is safe to drain without any loops of bowel or large blood vessels in close proximity.

228.e2 4—ABDOMEN AND PELVIS
eFigure 24.15 Measurement of the Skin—Peritoneum Distance Prior to Paracentesis.
CASE 24.3
CASE PRESENTATION
A 24-year-old female presents with acute onset of lower abdominal pain. She reports severe right lower quadrant abdominal pain. Her men-strual cycles are irregular at baseline, and her last menses was 2 months ago. On arrival, her pulse is 120 with a blood pressure of 110/65. She has diffuse abdominal tenderness with guarding. Her qualitative serum pregnancy test is positive and her hemoglobin and hematocrit are 9 and 26, respectively. On reassessment, her abdomen appears to have increased distension and repeat pulse and blood pressure are 140 and 90/40, respectively.
ULTRASOUND FINDINGS
A point-of-care abdominal ultrasound exam is performed. An intrauterine pregnancy is not seen. Peritoneal free fluid is detected in the right upper quadrant in the hepatorenal space (Mori-son’s pouch) (Video 24.32), and in the pelvis in the rectouterine space (Pouch of Douglas) (Video 24.33) and vesicouterine space (Video 24.34).
CASE RESOLUTION
Based on her positive pregnancy test, peritoneal free fluid, and impending hemorrhagic shock, a ruptured ectopic pregnancy is suspected. The obstetric service is consulted for emergent exploratory surgery. While the operating room is being prepared, she is given blood products. In the operating room, a ruptured ectopic preg-nancy within the right fallopian tube is seen, and a right salpingo-oophorectomy is performed.
In ambulatory patients, peritoneal free fluid collects in the pelvis, the most gravitationally dependent area of the abdomino-pelvic cavity. In females, peritoneal free fluid collects specifi-cally in the rectouterine space. If enough free fluid is present in the pelvic cavity and the patient is placed supine, some of the fluid may flow along the right paracolic gutter to the hepato-renal space, the most dependent space in the abdominal cavity.

24—PERITONEAL FREE FLUID 228.e3
subdiaphragmatic space, or perisplenic space, which is where fluid is most likely to first accumulate. The splenorenal space typically only contains fluid as overflow from the perisplenic area.
3. Which of the following patient character-istics facilitates ultrasound imaging of the abdominopelvic cavity?A. AspleniaB. Subcutaneous emphysemaC. Urine-filled bladderD. Gas-filled loops of bowelAnswer: C. Fluid-filled structures serve as acoustic windows for sound waves to travel into the abdomino-pelvic cavity to generate ultrasound images. The blood-filled liver and spleen serve as acoustic windows in the right and left upper quadrants. Similarly, a urine-filled bladder is an ideal acoustic window for visualization of pelvic structures. Gas-filled loops of bowel scatter sound waves and prevent visualization of deep structures in the abdomen and pelvis. Subcutaneous emphysema and asplenia also limit ultrasound imaging of the abdomino-pelvic cavity.
4. When point-of-care ultrasound detects peri-toneal free fluid in the pelvis, it is always a pathologic finding in both men and women.A. TrueB. FalseAnswer: B. A small amount of physiologic free fluid may be detected with point-of-care ultrasound in the pelvic cavity of women. However, in women with a positive pregnancy test and abdominal pain, the presence of abdomino-pelvic free
Review Questions1. In a supine position, which is the most grav-
itationally dependent peritoneal reflection above the sacral promontory?A. Splenorenal spaceB. Hepatorenal spaceC. Rectovesicular spaceD. Rectouterine spaceE. Vesicouterine spaceAnswer: B. The hepatorenal space is the most gravitationally dependent area above the sacral promontory. The hepatorenal peritoneal reflection is more posterior relative to other abdominal peritoneal recesses. Also, the lordotic curvature of the lumbar spine and anterior location of the sacral promontory relative to the hepatorenal space prevent free fluid from flowing into the pelvis. Last, the phrenicocolic ligament, a peritoneal reflection in the left upper quadrant, prevents blood from splenic injury from flowing down the left paracolic gutter and shunts blood from the left upper quadrant toward the hepatorenal recess in the right upper quadrant.
2. Similar to the hepatorenal space in right upper quadrant, the splenorenal space in the left upper quadrant is the most import-ant space to evaluate for peritoneal free fluid.A. TrueB. FalseAnswer: B. In contrast to the hepatorenal space in the right upper quadrant, the most important space to evaluate in the left upper quadrant is the left
CASE 24.4
CASE PRESENTATION
A 38-year-old female with a known history of polycystic ovarian syndrome presents with acute right lower quadrant abdominal pain after inter-course. The patient is in distress due to the sharp, severe pain. She is obese with right lower quadrant tenderness to palpation. She denies any past abdominal surgeries. She has an ele-vated white blood cell count (15,000), a negative pregnancy test, and a hemoglobin of 10.
ULTRASOUND FINDINGS
A point-of-care abdominal ultrasound exam reveals peritoneal free fluid with debris in the
rectouterine space (pouch of Douglas). Trans-vaginal ultrasound shows multiple ovarian cysts of varying sizes bilaterally with normal vascular color flow present (Video 24.35).
CASE RESOLUTION
Given the presence of free fluid in the pelvis and multiple cysts in both ovaries, she is diagnosed with a ruptured ovarian cyst. Intravenous fluids and pain medications are administered for symp-tomatic relief. Her abdominal pain improves and repeat hemoglobin levels are stable.
228.e4 4—ABDOMEN AND PELVIS
Answer: A. Ultrasound cannot reliably differentiate different types of peritoneal free fluid (blood vs. ascites vs. bile vs. urine). However, peritoneal free fluid with debris or clotted blood usually appears more echogenic by ultrasound. Ultrasound can accurately detect loculations and abdominal wall adhesions/scarring, and qualitatively assess peritoneal free fluid volume (small, moderate, large).
fluid is an ectopic pregnancy until proven otherwise.
5. Which of the following blood vessels is/are at risk of laceration during paracentesis?A. Inferior epigastric arteryB. Deep circumflex iliac arteriesC. Superficial circumflex iliac arteriesD. Thoracoepigastric veinsE. All of the aboveAnswer: E. All of the blood vessels listed above are present in the subcutaneous tissue of the abdominal wall and should be avoided during paracentesis (see Fig. 24.12). In general, a needle insertion site for paracentesis should be selected lateral to the rectus abdominis muscles to avoid the large inferior epigastric vessels. However, it is important to remember the inferior epigastric vessels are tortuous vessels with several branches that vary in position and can be found lateral to the rectus abdominis muscles. With a high-frequency linear transducer using color flow or power Doppler, providers can evaluate the needle insertion site on the abdominal wall to rule out any large superficial vessels and prevent inadvertent vascular injury.
6. Which of the following images demon-strates a sufficient collection of ascites to safely perform a diagnostic paracentesis?A. Video 24.36B. Video 24.37C. Video 24.38D. Video 24.39Answer: A. A diagnostic paracentesis could be safely performed in this moderate-sized collection of ascites between the liver and small bowels. If there is concern of the liver or small bowels floating intermittently into the needle insertion site, the provider may use real-time ultrasound guidance to track the needle tip entering the fluid collection. Even though the patients in choices B, C, and D have ascites, a sufficient collection of ascites where a needle could be safely inserted is not seen.
7. Which of the following characteristics of peritoneal free fluid cannot be detected by ultrasound?A. Type of peritoneal free fluidB. Presence of loculationsC. Abdominal wall adhesionsD. Volume of peritoneal free fluidE. None of the above
References1. Box C. The abdominal watersheds and their
influence on the localization of intraperitoneal infections. Lancet. 1910;175(4517):848–852.
2. Symington J. The abdomino-pelvic cavity. J Anat Physiol. 1913;47(Pt2):143–158.
3. Mitchell GAG. The spread of acute intraperito-neal effusions. Br J Surg. 1940;28(110):291–313.
4. Rodriquez A. Recognition of intra-abdominal injury in blunt trauma victims. A prospective study comparing physical examination with peri-toneal lavage. Am Surg. 1982;48(9):457–459.
5. Ferrera P, Verdile VP, Bartfield JM, Snyder HS, Salluzzo RF. Injuries distracting from intra-abdominal injuries after blunt trauma. Am J Emerg Med. 1998;16:145–150.
6. Michetti C, Sakran JV, Grabowski JG, et al. Physical examination is a poor screening test for abdominal-pelvic injury in adult blunt trauma patients. J Surg Res. 2010;159:456–461.
7. Richards J, Derlet RW. Computed tomography and blunt abdominal injury: patient selection based on examination, haematocrit and haema-turia. Injury. 1997;28(3):181–185.
8. Soyuncu Y, Cete Y, Bozan H, Kartal M, Akyol AJ. Accuracy of physical and ultrasonographic examinations by emergency physicians for the early diagnosis of intraabdominal haemorrhage in blunt abdominal trauma. Injury. 2007;38: 564–569.
9. Branney W, Wolfe RE, Moore EE, et al. Quan-titative sensitivity of ultrasound in detecting free intraperitoneal fluid. J Trauma. 1995;39:375–380.
10. Gracias V, Frankel HL, Gupta R, et al. Defining the learning curve for the focused abdominal sonogram for trauma (FAST) exam-ination: implications for credentialing. Am Surg. 2001;67:364–368.
11. Goldberg BB, Goodman GA, Clearfield HR. Evaluation of ascites by ultrasound. Radiology. 1970;96:15–22.
12. Paajanen H, Lahti P, Nordback I. Sensitivity of transabdominal ultrasonography in detection of intraperitoneal fluid in humans. Eur Radiol. 1999;9:1423–1425.
13. Abrams B, Sukumvanich P, Seibel R, Moscati R, Jehle D. Ultrasound for the detection of

24—PERITONEAL FREE FLUID 228.e5
associated with thoracentesis procedures. J Clin Ultrasound. 2012;40(3):135–141.
20. Christie-Large M, Michaelides D, James SLJ. Focuses assessment with sonography for trauma: the FAST scan. Trauma. 2008;10:93–101.
21. Salen P, Melanson SW, Heller MB. The focused abdominal sonography for trauma (FAST) exam-ination: considerations and recommendations for training physicians in the use of a new clini-cal tool. Acad Emerg Med. 2000;7:162–168.
22. Runyon BA. Introduction to the revised Amer-ican association for the study of liver diseases practice guideline management of adult patients with ascites due to cirrhosis 2012. Hepatology. 2013;57(4):1651–1653.
23. Runyon BA. Management of adult patients with ascites due to cirrhosis: an update. Hepatology. 2009;49(6):2087–2107.
24. Nagdev A, Racht J. The “gastric fluid” sign: an unrecognized false-positive finding during focused assessment for trauma examinations. Am J Emerg Med. 2008;26:630.e5–630.e7.
intraperitoneal fluid: the role of Trendelenburg positioning. Am J Emerg Med. 1999;17(2):117–120.
14. Patel N, Riherd JM. Focused assessment with sonography for trauma: methods, accuracy, and indications. Surg Clin North Am. 2011;91:195–207.
15. Soto J, Anderson SW. Multidetector CT of blunt abdominal trauma. Radiology. 2012;265(3):678–693.
16. Rozycki G, Ochsner MG, Feliciano DV, et al. Early detection of hemoperitoneum by ultra-sound examination of the right upper quad-rant: a multicenter study. J Trauma. 1998;45(5):878–883.
17. Nazeer S, Dewbre H, Miller AH. Ultrasound-assisted paracentesis performed by emergency physicians vs. the traditional technique: a pro-spective, randomized trial. Am J Emerg Med. 2005;23:363–367.
18. Mercaldi C, Lanes SF. Ultrasound guidance decreases complications and improves the cost of care among patients undergoing thoracentesis and paracentesis. Chest. 2013;143(2):532–538.
19. Patel PA, Ernst FR, Gunnarsson CL. Ultrasonog-raphy guidance reduces complications and costs

323
C H A P T E R 34Lower Extremity Deep Venous ThrombosisAriel L. Shiloh
BackgroundVenous thromboembolic disease (VTE) is a common cause of morbidity and mortality in hospitalized patients and is especially preva-lent in critically ill patients.1–3 Approximately 70% to 90% of patients with an identified source of pulmonary embolism (PE) have a proxi-mal lower extremity deep venous thrombosis (DVT). Conversely, 40% to 50% of patients with a proximal DVT have a concurrent pul-monary embolism at presentation, and simi-larly, in only 50% of patients presenting with a PE can a DVT be found.4–6
Point-of-care ultrasound is readily available as a diagnostic tool for VTE. Both emergency medicine and critical care medicine literature have demonstrated that after brief, focused training sessions, physicians and other health
care providers can perform lower extremity compression ultrasonography exams rapidly and with high diagnostic accuracy to detect DVT.7–13 A meta-analysis of 16 studies showed that point-of-care ultrasound can accurately diagnose lower extremity DVTs with a pooled sensitivity of 96% and specificity of 97%.14
Traditional vascular studies, the duplex and triplex exams, use a combination of two-dimensional (2D) imaging with compres-sion along with the use of color and/or spectral Doppler ultrasound. More recent studies have demonstrated that 2D compression ultrasound exams alone yield similar accuracy as tradi-tional duplex or triplex vascular studies.9,11,15–17
Furthermore, reporting of duplex or triplex exams is often delayed due to limitations in the availability of radiology services. Delays in obtaining such test results can compromise the
K E Y P O I N T S
• Providers can accurately detect lower extremity deep venous thrombosis with point-of-care ultrasound after limited training.
• Compression ultrasound exams are as accurate as traditional duplex and triplex vascular ultrasound exams.
• Compression ultrasound exam at only two sites, the common femoral vein and popliteal vein, permits rapid and accurate assessment of deep venous thrombosis.
S E C T I O N 5Vascular System
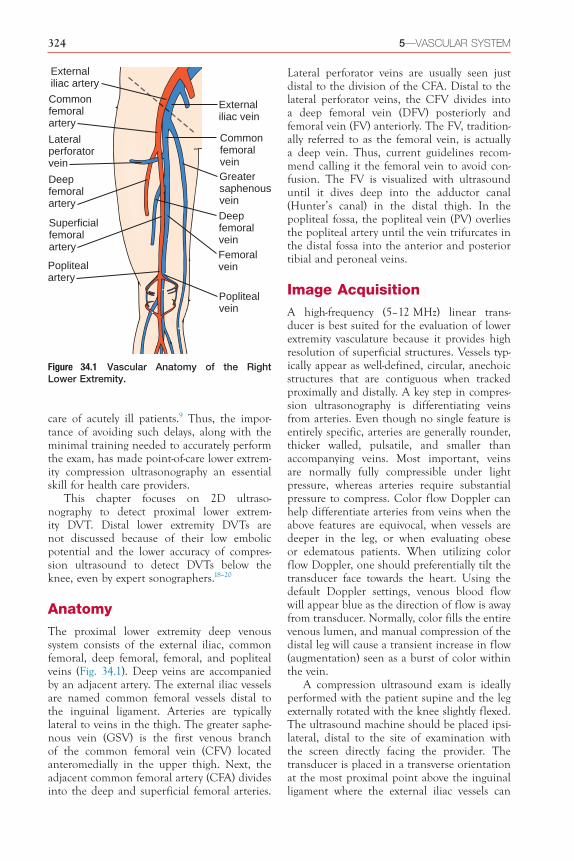
324 5—VASCULAR SYSTEM
Lateral perforator veins are usually seen just distal to the division of the CFA. Distal to the lateral perforator veins, the CFV divides into a deep femoral vein (DFV) posteriorly and femoral vein (FV) anteriorly. The FV, tradition-ally referred to as the femoral vein, is actually a deep vein. Thus, current guidelines recom-mend calling it the femoral vein to avoid con-fusion. The FV is visualized with ultrasound until it dives deep into the adductor canal (Hunter’s canal) in the distal thigh. In the popliteal fossa, the popliteal vein (PV) overlies the popliteal artery until the vein trifurcates in the distal fossa into the anterior and posterior tibial and peroneal veins.
Image AcquisitionA high-frequency (5–12 MHz) linear trans-ducer is best suited for the evaluation of lower extremity vasculature because it provides high resolution of superficial structures. Vessels typ-ically appear as well-defined, circular, anechoic structures that are contiguous when tracked proximally and distally. A key step in compres-sion ultrasonography is differentiating veins from arteries. Even though no single feature is entirely specific, arteries are generally rounder, thicker walled, pulsatile, and smaller than accompanying veins. Most important, veins are normally fully compressible under light pressure, whereas arteries require substantial pressure to compress. Color flow Doppler can help differentiate arteries from veins when the above features are equivocal, when vessels are deeper in the leg, or when evaluating obese or edematous patients. When utilizing color flow Doppler, one should preferentially tilt the transducer face towards the heart. Using the default Doppler settings, venous blood flow will appear blue as the direction of flow is away from transducer. Normally, color fills the entire venous lumen, and manual compression of the distal leg will cause a transient increase in flow (augmentation) seen as a burst of color within the vein.
A compression ultrasound exam is ideally performed with the patient supine and the leg externally rotated with the knee slightly flexed. The ultrasound machine should be placed ipsi-lateral, distal to the site of examination with the screen directly facing the provider. The transducer is placed in a transverse orientation at the most proximal point above the inguinal ligament where the external iliac vessels can
care of acutely ill patients.9 Thus, the impor-tance of avoiding such delays, along with the minimal training needed to accurately perform the exam, has made point-of-care lower extrem-ity compression ultrasonography an essential skill for health care providers.
This chapter focuses on 2D ultraso-nography to detect proximal lower extrem-ity DVT. Distal lower extremity DVTs are not discussed because of their low embolic potential and the lower accuracy of compres-sion ultrasound to detect DVTs below the knee, even by expert sonographers.18–20
AnatomyThe proximal lower extremity deep venous system consists of the external iliac, common femoral, deep femoral, femoral, and popliteal veins (Fig. 34.1). Deep veins are accompanied by an adjacent artery. The external iliac vessels are named common femoral vessels distal to the inguinal ligament. Arteries are typically lateral to veins in the thigh. The greater saphe-nous vein (GSV) is the first venous branch of the common femoral vein (CFV) located anteromedially in the upper thigh. Next, the adjacent common femoral artery (CFA) divides into the deep and superficial femoral arteries.
Externaliliac vein
Externaliliac artery
Commonfemoralvein
Commonfemoralartery
Greatersaphenousvein
Deepfemoralvein
Superficialfemoralartery
Poplitealartery
Deepfemoralartery
Femoralvein
Poplitealvein
Lateralperforatorvein
Figure 34.1 Vascular Anatomy of the Right Lower Extremity.

34—LOWER EXTREMITY DEEP VENOUS THROMBOSIS 325
(Videos 34.3 and 34.4). Continuing distally, the CFA branches into superficial and deep branches before the CFV braches into the femoral vein (FV) and the deep femoral vein (DFV). Along the CFV, lateral perforator veins are usually seen coursing laterally between the superficial and deep femoral arteries (Video 34.5). Distal to the lateral perforators, the CFV divides into the DFV and FV (Video 34.6).
Data have shown high diagnostic utility of a limited two- or three-point compression ultrasound exam in patients who have physical
still be identified without obscuration from overlying bowel gas.
Compressions should be applied every 1 to 2 cm along the lower extremity veins. While sliding the transducer distally along the CFV, identify and compress each of the main branch points (Figs. 34.2 and 34.3). Start by compress-ing the CFV proximal to the GSV branch (Video 34.1) and then the CFV-GSV anasto-mosis (Video 34.2). The proximal portion of the GSV should be examined as thrombus here has high risk of extending into the CFV
Externaliliac vein
Internaliliac vein
Inferiorvena cava
Greatersaphenousvein
Deep femoralveinFemoralvein
Poplitealvein
Commoniliac vein
Commonfemoral vein
Anteriortibial vein
Peroneal vein
Posteriortibial vein
1
2
3
4
5
Lateralperforator
Lateralperforator vein
CFA CFV
CFA CFV
CFV
SFA
DFA
SFA
DFA
FV
DFV
PV
PA
GSV1
2
3
4
5
Figure 34.2 Cross-Sectional Anatomy of Lower Extremity Vasculature. Compressions should be per-formed at each of the following ultrasound exam points: (1) common femoral artery (CFV), (2) CFV–greater saphenous vein (GSV), (3) CFV–lateral perforators, (4) deep femoral vein (DFV)–femoral vein (FV), and (5) popliteal vein (PV). DFA, Deep femoral artery; PA, popliteal artery; SFA, superficial femoral artery.

326 5—VASCULAR SYSTEM
FV
SFA
DFV
DFA
SFA
FV
C
D
GSV
CFACFV
SFACFV
LP
DFA
A
B
Figure 34.3 Lower Extremity Compression Ultrasound Exam. Transducer position and correspond-ing precompression (left) and postcompression (right) ultrasound images are shown at different levels. (A) Common femoral vein–greater saphenous vein (CFV–GSV) level. (B) CFV–lateral perforator (LP) vein level, distal to the bifurcation of the common femoral artery (CFA) into superficial femoral artery (SFA) and deep femoral artery (DFA). (C) Bifurcation of the common femoral vein into femoral (FV) and deep femoral veins (DFV). (D) The femoral vein is deep to the SFA from the mid- to distal thigh.

34—LOWER EXTREMITY DEEP VENOUS THROMBOSIS 327
orientation (Fig. 34.4). The transducer should be held gently to avoid inadvertently collapsing the PV. If an adequate seal between the trans-ducer and skin cannot be attained in the pop-liteal fossa without applying excessive pressure, consider using a narrower linear transducer or applying copious gel. The PV is typically super-ficial or lateral to the artery in the center of the popliteal fossa (Video 34.10). If only small veins are visualized, the transducer is posi-tioned too distal and should be slid proximally toward the posterior thigh. Compressions are performed sequentially to the trifurcation of the PV into anterior and posterior tibial and peroneal veins.
Normal and Pathologic FindingsNormal veins should fully compress; oppos-ing walls should touch with application of
exam findings or symptoms of a DVT (calf pain, tenderness, edema, or redness). A limited compression ultrasound exam must evaluate at a minimum: the CFV-GSV level, the bifurca-tion of the CFV into DFV and FV, and the PV level. The distal course of the FV is not exam-ined in a limited two- or three-point exam. However, given the relative ease and rapidity of performing compression ultrasonography, we recommend performing compressions distally from the CFV along the FV in select patients with high suspicion for lower extrem-ity DVT. Studies have shown that thrombi can be isolated to the FV and not involve a branch point.21–24 Compressions are continued every 1 to 2 cm along the proximal (Video 34.7), middle (Video 34.8), and distal FV (Video 34.9) until the vein dives deep into the adduc-tor canal (Hunter’s canal) in the distal thigh.
Next, the examiner should examine the PV by placing the transducer within the pop-liteal fossa with the transducer in a transverse
A
B
PV
PA
Figure 34.4 Transducer position in popliteal fossa (A) with corresponding precompression and postcom-pression ultrasound images (B). PA, Popliteal artery; PV, popliteal vein.

328 5—VASCULAR SYSTEM
CFA
CFV
DVT
Figure 34.5 Common Femoral Vein Deep Venous Thrombosis. Noncompression of the common femoral vein (CFV) is revealed by the precompression (left) and postcompression (right) images demonstrating a deep venous thrombosis (DVT). CFA, Common femoral artery.
PA
PVDVT
Figure 34.6 Popliteal Vein Deep Venous Thrombosis. Noncompression of the popliteal vein (PV) is revealed by the precompression (left) and postcompression (right) images demonstrating a deep venous thrombosis (DVT). PA, Popliteal artery.
less pressure than is required to compress the adjacent artery. Most deep venous thrombi usually develop around valve sinuses, especially at bifurcations, where decreased blood flow exists.25 Inability to completely compress the venous lumen is the main criterion for diagno-sis of DVT using compression ultrasonography, even if thrombus is not visualized in the vein (Figs. 34.5 and 34.6). Lower extremity DVTs can be detected at any of the examination points: CFV (Video 34.11), CFV-GSV anas-tomosis (Video 34.12), CFV-lateral perforator vein anastomosis (Video 34.13), FV (Video 34.14), and PV (Video 34.15).
Providers should keep in mind that throm-bosis is a spectrum. Early thrombus forma-tion begins with venous stasis, usually seen as spontaneous echo contrast or “smoke” around valve leaflets, and fibrin deposition (Video 34.16). The sonographic appearance of venous thrombi varies based on age, extent, and loca-tion. Acute thrombi are gelatinous in consis-tency, appear anechoic or hypoechoic, and cause greater venous distention than chronic thrombi. Subacute and chronic thrombi are more echogenic due to fibrin deposition and can often be visualized without compression (Video 34.17). Chronic thrombi recanalize,

34—LOWER EXTREMITY DEEP VENOUS THROMBOSIS 329
PEARLS AND PITFALLS
• Providers should have a thorough understanding of lower extremity venous anatomy, including the main segments and branch points, before performing venous compression ultrasound exams.
• Lower extremity compressions should begin at the most proximal visualizable vein segment above the inguinal ligament (external iliac vein).
• Compression ultrasound should always be performed in a transverse orientation because compressions in a longitudinal orientation are prone to the operator sliding to one side of the vessel resulting in erroneous exam findings.
• Firm, rapid, downward compressions of veins should be used to reduce false-positive results. Conversely, forceful compressions should be avoided to reduce false-negative results. Adequate force is being applied if the adjacent artery is slightly compressed.
• After diagnosing a lower extremity deep venous thrombosis (DVT), serial compressions should be avoided in cases of acute, free-floating thrombus.
• Besides DVT, some veins may not compress due to operator error, depth of the vein, obesity, or edema. The depth of some lower extremity deep veins, such as the distal femoral vein, often precludes adequate compression. Compressing the vein at an angle, rather than perpendicularly, can also result in false positives.
retract to the vessel wall, and can cause thick-ening of the vessel wall. Partial compressibility can be seen with chronic thrombi that have retracted to the vessel wall (Video 34.18) or acute, gelatinous thrombi that are adherent to a vessel wall.
Due to their similar appearance and non-compressibility, inguinal lymph nodes can be mistaken for DVTs. It is important to recognize that lymph nodes are discrete, ovoid structures with a hypoechoic cortex and hyperechoic hilum (Video 34.19; see Chapter 41). Additionally, lymph nodes are generally more superficial, not paired, and cannot be tracked proximally or distally along the extremity.

34—LOWER EXTREMITY DEEP VENOUS THROMBOSIS 329.e1
CASE 34.1
CASE PRESENTATION
A 50-year-old man with a history of chronic obstructive pulmonary disease presents to the emergency department with a week-long history of purulent cough, dyspnea, and fever. Chest x-ray demonstrates bilateral infiltrates. He is admitted to the hospital for community-acquired pneumonia. On hospital day 2, he is transferred to the intensive care unit for septic shock and acute hypoxic respiratory failure. On hospital day 4, vasopressors are weaned off and the FiO2 is reduced to 40%. During a spontaneous breathing trial, the patient suddenly becomes hypoxic and tachycardic. Despite re-initiating full ventilatory support, his FiO2 requirement remains at 100% and tachycardia persists. The differential diag-nosis includes mucus plugging with atelectasis, pneumothorax, and venous thromboembolism.
ULTRASOUND FINDINGS
Focused lung ultrasound and lower extremity compression ultrasound exams are performed. Lung ultrasound demonstrates bilateral lung sliding, ruling out the possibility of pneumothorax. Asymmetric areas of B-lines with thickened pleura are noted without signs of consolidation. Com-pression ultrasound of the right leg demonstrates
noncompression of the right common femoral vein (CFV) at the level of the lateral perforator vein, although echogenic thrombus is not visu-alized within the vessel (Video 34.20). The right CFV reveals echogenic thrombus, shown here in a longitudinal view (Video 34.21). Noncom-pression of the venous lumens and identification of echogenic thrombus confirms a diagnosis of lower extremity deep venous thrombosis (DVT).
CASE RESOLUTION
The patient’s acute respiratory failure and lower extremity DVT suggested a high likelihood of pulmonary embolism. The patient was promptly started on unfractionated heparin. On hospital day 6, the patient was successfully extubated and bridged to warfarin therapy.
Lower extremity compression ultrasound exams performed by providers with limited training are highly accurate when compared to duplex or triplex Doppler ultrasound exams. Similar diagnostic accuracy has been demon-strated in studies with patients in hospital wards, emergency departments, and intensive care units. Point-of-care lower extremity compression ultrasound exams allow providers to rapidly iden-tify DVTs and promptly initiate anticoagulation.
CASE 34.2
CASE PRESENTATION
A 65-year-old man with end-stage renal disease, hypertension, and systolic heart failure is admit-ted to the intensive care unit (ICU) with respi-ratory failure and septic shock secondary to Pseudomonas pneumonia. Using ultrasound guidance, a right femoral central venous catheter is placed for vasopressor infusion. On ICU day 7, the nurse notes difficulty infusing medications via the central venous access and inability to with-draw blood. On physical examination, the right lower extremity is edematous and warm com-pared to the left leg. A point-of-care ultrasound is performed to evaluate the right leg.
ULTRASOUND FINDINGS
A lower extremity compression exam demon-strates a hypoechoic, noncompressible, right common femoral vein (CFV). The central venous catheter was noted within the vessel, but no clear thrombus is visualized (Video 34.22). Ini-tially, anticoagulation is held due to concerns of
gastrointestinal bleeding. A repeat exam of the right CFV a few days later demonstrates obvious hyperechoic thrombus formation and propaga-tion of thrombosis distally (Video 34.23).
CASE RESOLUTION
The patient’s unilateral lower extremity swelling was concerning for deep vein thrombosis. Non-compression of the venous lumen, despite the inability to initially visualize a thrombus, prompted strong concern for catheter-related thrombosis. The catheter was carefully removed and thera-peutic anticoagulation was initiated. Serial exam-inations ultimately demonstrated organization of thrombus.
Acute thrombosis has a gelatinous, hypoechoic consistency when visualized early in formation and becomes more hyperechoic with organization of the clot. The inability to com-pletely compress the venous lumen is the main criterion for diagnosis of deep vein thrombosis.

329.e2 5—VASCULAR SYSTEM
Review Questions1. What is the main diagnostic criterion for
diagnosis of deep vein thrombosis?A. Visualization of hyperechoic thrombus
within the venous lumenB. Distention of the venous lumen when
compared to the arterial lumenC. Noncompression of the venous lumenD. Reduction of flow by color or pulsed-
wave Doppler ultrasoundAnswer: C. The inability to completely compress the venous lumen is the main criterion for diagnosis of deep vein thrombosis. Visualization of thrombus is not required, and acute thrombi are usually anechoic. Although distention of the venous lumen supports a diagnosis of deep venous thrombosis, the venous lumen is normally larger than the arterial lumen. Doppler ultrasound is not required to diagnose deep venous thrombosis.
2. What is the characteristic echogenicity of a subacute or chronic thrombus?A. AnechoicB. HypoechoicC. IsoechoicD. HyperechoicAnswer: D. Acute thrombi are gelatinous and anechoic or hypoechoic, while subacute and chronic thrombi are hyperechoic due to fibrin deposition within the clot.
3. Which of the following veins is not nor-mally examined during a 2D compression ultrasonography exam of the lower extrem-ity deep veins?A. Soleal veinB. Greater saphenous veinC. Femoral veinD. Popliteal veinAnswer: A. Distal lower extremity DVTs (below the knee) have low embolic potential. Additionally, compression ultrasound has lower accuracy to detect DVTs below the knee. The common femoral, femoral, and popliteal vein, as well as their main branches, are the proximal lower extremity deep veins that are examined during a 2D compression ultrasound exam.
For examples 4–10, view each video, identify the site, and determine whether the lower extremity compression ultrasound exam is normal or abnormal.
4. Video 34.24 (Answer: E)5. Video 34.25 (Answer: A)6. Video 34.26 (Answer: G)7. Video 34.27 (Answer: B)8. Video 34.28 (Answer: F)9. Video 34.29 (Answer: D)
10. Video 34.30 (Answer: C)A. Right common femoral vein–greater
saphenous vein anastomosis that is PARTIALLY compressible
B. Left common femoral vein–greater saphenous vein anastomosis that is FULLY compressible
C. Popliteal vein that is NOT compressibleD. Popliteal vein that is FULLY
compressibleE. Right common femoral vein–lateral
perforator anastomosis that is FULLY compressible
F. Right common femoral vein–lateral perforator anastomosis that is PAR-TIALLY compressible
G. Femoral vein that is PARTIALLY compressible
References1. Stein PD, Henry JW. Prevalence of acute pulmo-
nary embolism among patients in a general hos-pital and at autopsy. Chest. 1995;108(4):978–981.
2. Twigg SJ, McCrirrick A, Sanderson PM. A com-parison of post mortem findings with post hoc estimated clinical diagnoses of patients who die in a United Kingdom intensive care unit. Int Care Med. 2001;27(4):706–710.
3. Williams MT, Aravindan N, Wallace MJ, Riedel BJ, Shaw AD. Venous thromboembo-lism in the intensive care unit. Crit Care Clin. 2003;19(2):185–207.
4. Guidelines on diagnosis and management of acute pulmonary embolism. Task force on pul-monary embolism, European society of cardiol-ogy. Eur Heart J. 2000;21(16):1301–1336.
5. Kistner RL, Ball JJ, Nordyke RA, Freeman GC. Incidence of pulmonary embolism in the course of thrombophlebitis of the lower extremities. Am J Surg. 1972;124:169–176.
6. Girard P, Decousus M, Laporte S, et al. Diag-nosis of pulmonary embolism in patients with proximal deep vein thrombosis: specificity of symptoms and perfusion defects at baseline and during anticoagulant therapy. Am J Respir Crit Care Med. 2001;164(6):1033–1037.
7. Blaivas M, Lambert MJ, Harwood RA, et al. Lower-extremity doppler for deep venous throm-bosis–can emergency physicians be accurate and fast? Acad Emerg Med. 2000;7(2):120–126.
8. Jang T, Docherty M, Aubin C, et al. Resi-dent-performed compression ultrasonography

34—LOWER EXTREMITY DEEP VENOUS THROMBOSIS 329.e3
color-flow duplex venous scanning for detection of proximal deep venous thrombosis. J Vasc Surg. 1995;22(5):553–557.
18. Brown RB, Klar J, Teres D, Lemeshow S, Sands M. Prospective study of clinical bleeding in intensive care unit patients. Crit Care Med. 1988;16(12):1171–1176.
19. Righini M, Paris S, Le Gal G, et al. Clini-cal relevance of distal deep vein thrombosis. Review of literature data. Thromb Haemost. 2006;95(1):56–64.
20. Tapson VF, Carroll BA, Davidson BL, et al. The diagnostic approach to acute venous thrombo-embolism. Clinical practice guideline. Ameri-can thoracic society. Am J Respir Crit Care Med. 1999;160(3):1043–1066.
21. Adhikari S, Zeger W, Thom C, Fields JM. Iso-lated deep venous thrombosis: implications for 2-point compression ultrasonography of the lower extremity. Ann Emerg Med. 2015;66(3):262–266.
22. Caronia J, Sarzynski A, Tofighi B, et al. Resident performed two-point compression ultrasound is inadequate for diagnosis of deep vein throm-bosis in the critically III. J Thromb Thrombolysis. 2014;37(3):298–302.
23. Zitek T, Baydoun J, Yepez S, Forred W, Slattery DE. Mistakes and pitfalls associated with two-point compression ultrasound for deep vein thrombosis. West J Emerg Med. 2016;17(2):201–208.
24. Maki DD, Kumar N, Nguyen B, et al. Distribu-tion of thrombi in acute lower extremity deep venous thrombosis: implications for sonography and CT and MR venography. AJR Am J Roentge-nol. 2000;175(5):1299–1301.
25. Esmon CT. Basic mechanisms and patho-genesis of venous thrombosis. Blood Rev. 2009;23(5):225–229.
for the detection of proximal deep vein throm-bosis: fast and accurate. Acad Emerg Med. 2004;11(3):319–322.
9. Kory PD, Pellecchia CM, Shiloh AL, et al. Accu-racy of ultrasonography performed by critical care physicians for the diagnosis of DVT. Chest. 2011;139(3):538–542.
10. Magazzini S, Vanni S, Toccafondi S, et al. Duplex ultrasound in the emergency department for the diagnostic management of clinically sus-pected deep vein thrombosis. Acad Emerg Med. 2007;14(3):216–220.
11. Theodoro D, Blaivas M, Duggal S, et al. Real-time B-mode ultrasound in the ED saves time in the diagnosis of deep vein thrombosis (DVT). Am J Emerg Med. 2004;22(3):197–200.
12. Wakai A. Emergency department compression ultrasound to diagnose proximal deep vein thrombosis. J Emerg Med. 2001;21:444–445.
13. Kline JA, O’Malley PM, Tayal VS, Snead GR, Mitchell AM. Emergency-clinician performed compression ultrasonography for deep venous thrombosis of the lower extremity. Ann Emerg Med. 2008;52(4):437–445.
14. Pomero F, Dentali F, Borretta V, et al. Accuracy of emergency physician-performed ultrasonog-raphy in the diagnosis of deep-vein thrombosis: a systematic review and meta-analysis. Thromb Haemost. 2013;109(1):137–145.
15. Lensing AW, Doris CI, McGrath FP, et al. A comparison of compression ultrasound with color doppler ultrasound for the diagnosis of symptomless postoperative deep vein thrombosis. Arch Intern Med. 1997;157(7):765–768.
16. Lensing AW, Prandoni P, Brandjes D, et al. Detection of deep-vein thrombosis by real-time B-mode ultrasonography. N Engl J Med. 1989;320(6):342–345.
17. Poppiti R, Papanicolaou G, Perese S, et al. Limited B-mode venous imaging versus complete