

Friday lunchtime lecture: The secret lives of buildings revealed (with open data)
Lunchtime Data Talk
Housing Data: Home Sales, Affordability, and Realtor/Builder Activity Lawrence Yun, National Association of Realtors David Crowe, National Association of Home Builders December 9, 2013
Housing Finance Policy Center

2 2
NAR Housing Data
Existing Home Sales
Lawrence Yun, Ph.D.
Chief Economist
NATIONAL ASSOCIATION OF REALTORS®
Presentation at the Urban Institute
Washington, D.C.
December 9, 2013

3 3
NAR Data
Existing Home Sales
4 4
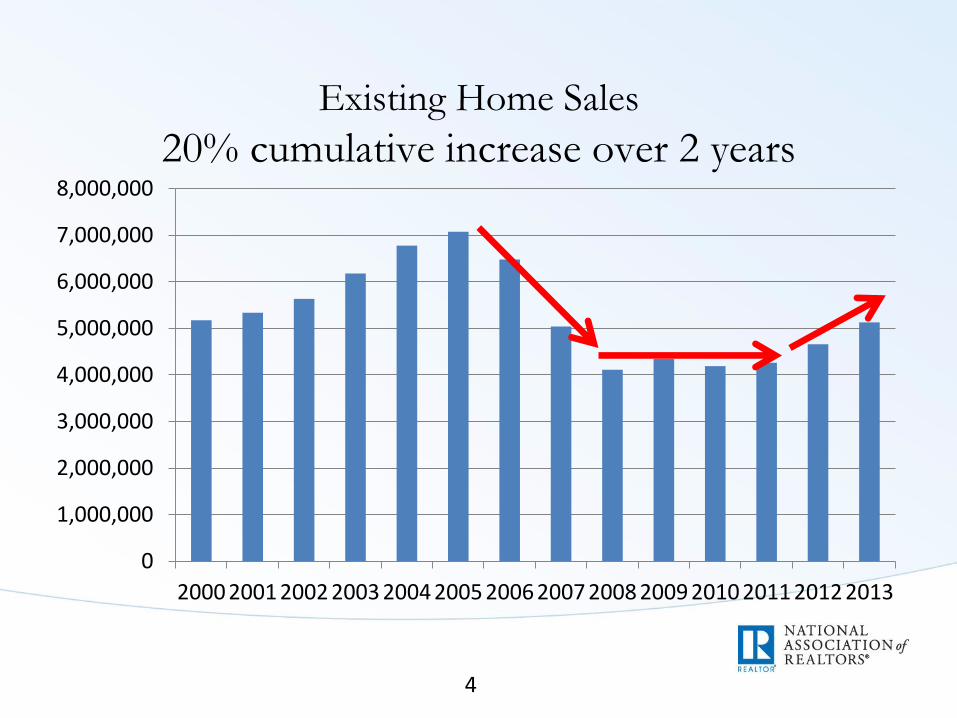
Existing Home Sales
20% cumulative increase over 2 years
0
1,000,000
2,000,000
3,000,000
4,000,000
5,000,000
6,000,000
7,000,000
8,000,000
2000 2001 2002 2003 2004 2005 2006 2007 2008 2009 2010 2011 2012 2013
5 5
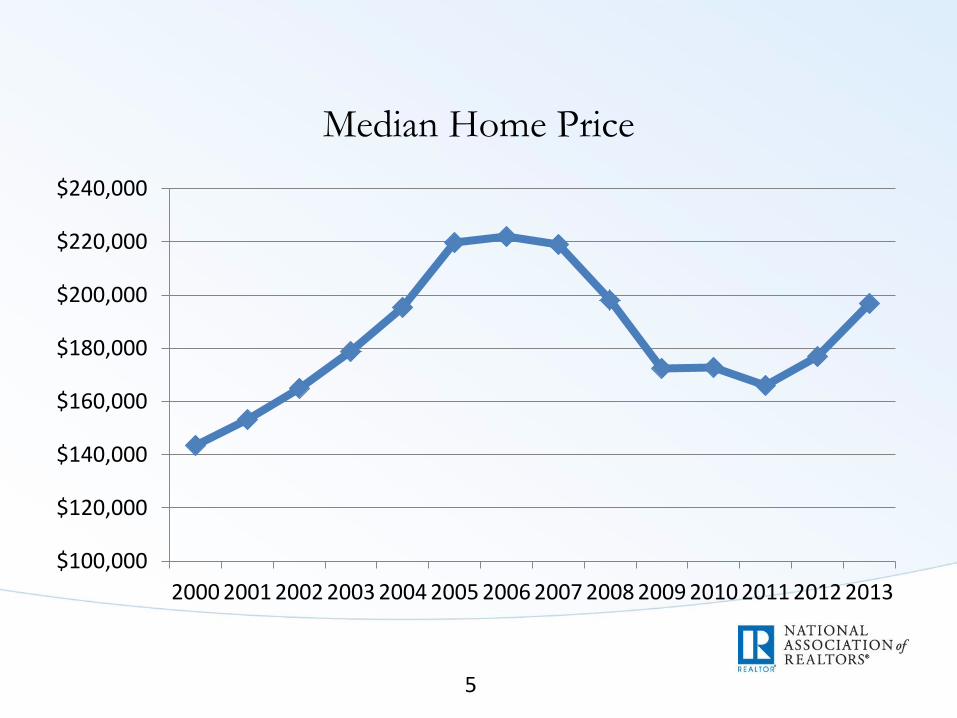
Median Home Price
$100,000
$120,000
$140,000
$160,000
$180,000
$200,000
$220,000
$240,000
2000 2001 2002 2003 2004 2005 2006 2007 2008 2009 2010 2011 2012 2013
6 6
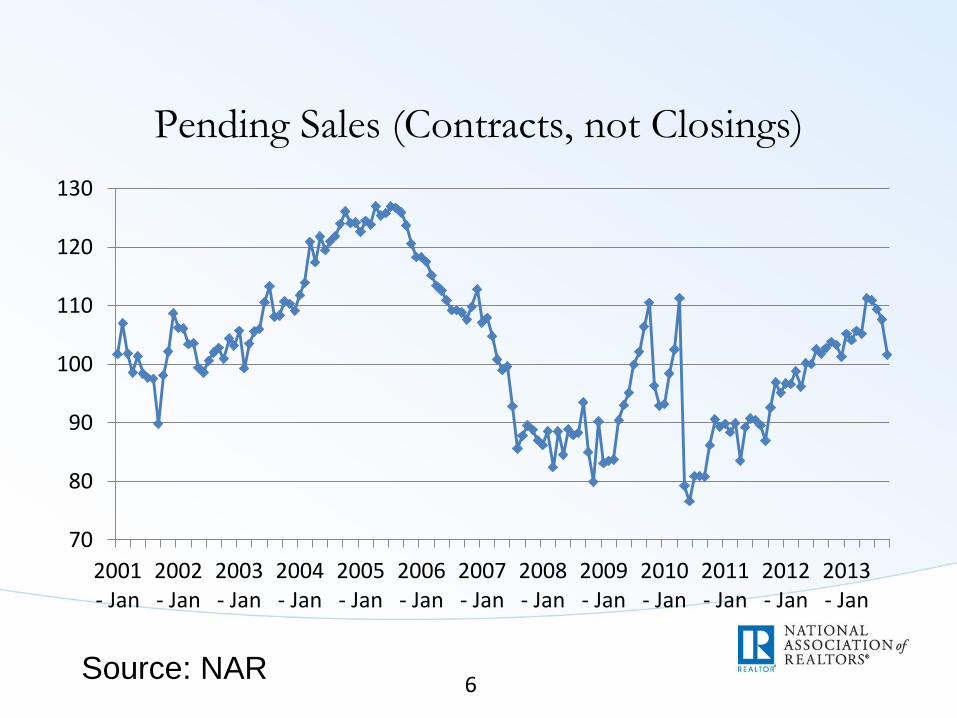
Pending Sales (Contracts, not Closings)
70
80
90
100
110
120
130
2001- Jan
2002- Jan
2003- Jan
2004- Jan
2005- Jan
2006- Jan
2007- Jan
2008- Jan
2009- Jan
2010- Jan
2011- Jan
2012- Jan
2013- Jan
Source: NAR
7 7
Data Collection
• Multiple Listing Service reporting by summary
(form)
• Electronic Connection to Individual Multiple Listing
Service
• State Association Aggregators
– Across MLSs in the state
– One state-association MLS
8 8
Multiple Listing Services
• Multiple listing services enable brokers to cooperate
and make the real estate transaction more efficient
• There are over 900 multiple listing services in the
US
• Monthly Panel
– About 200 boards are selected to participate in
the panel upon which monthly home sales
estimate is based
– Boards are selected for representativeness and
reliability
9 9
Existing Home Sales Overview – Quarterly data
• Single Family Median Prices by Metropolitan
Statistical Area (MSA) for approximately 150 MSAs
• Condominium Median Prices by Metropolitan
Statistical Area (MSA) for approximately 60 MSAs
• Metro-level Affordability Index
– Qualifying Income by MSA
– Affordability Index by MSA
10 10
Pending Home Sales
• Pending sales are those identified by MLSs as
“pending,” typically under contract
– Total pending counts in the MLS or
– Newly pending that occurred during the month
• Pending home sales data is reported as an index
11 11
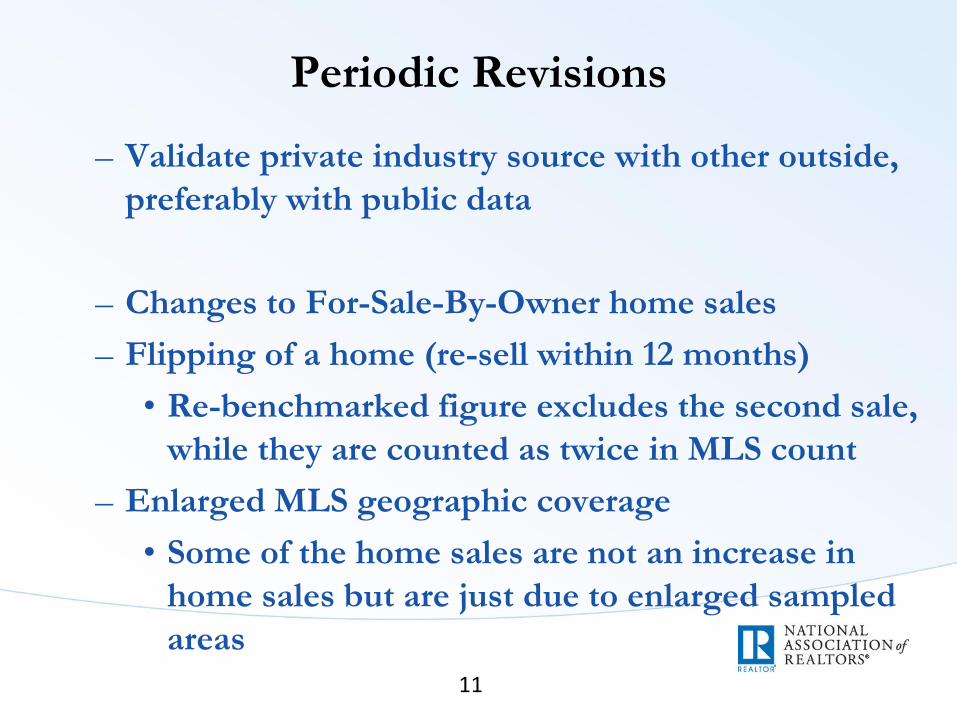
Periodic Revisions
– Validate private industry source with other outside,
preferably with public data
– Changes to For-Sale-By-Owner home sales
– Flipping of a home (re-sell within 12 months)
• Re-benchmarked figure excludes the second sale,
while they are counted as twice in MLS count
– Enlarged MLS geographic coverage
• Some of the home sales are not an increase in
home sales but are just due to enlarged sampled
areas
12 12
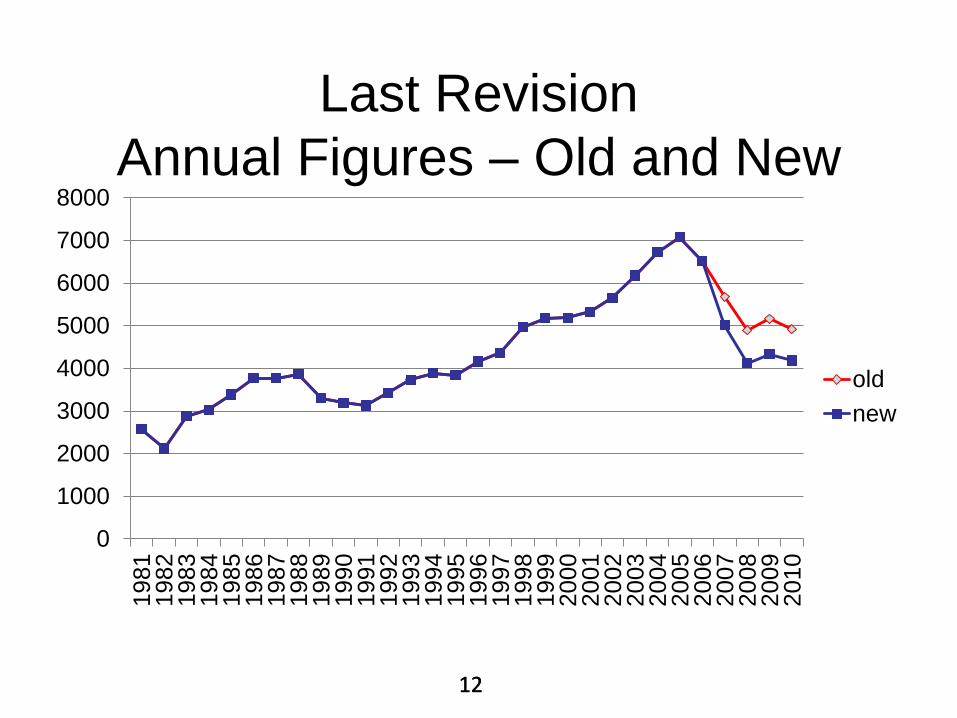
Last Revision
Annual Figures – Old and New
0
1000
2000
3000
4000
5000
6000
7000
8000
19
81
1982
1983
1984
1985
1986
1987
1988
1989
1990
1991
1992
1993
1994
1995
1996
1997
19
98
1999
2000
2001
2002
2003
2004
2005
2006
2007
2008
2009
2010
old
new
13 13
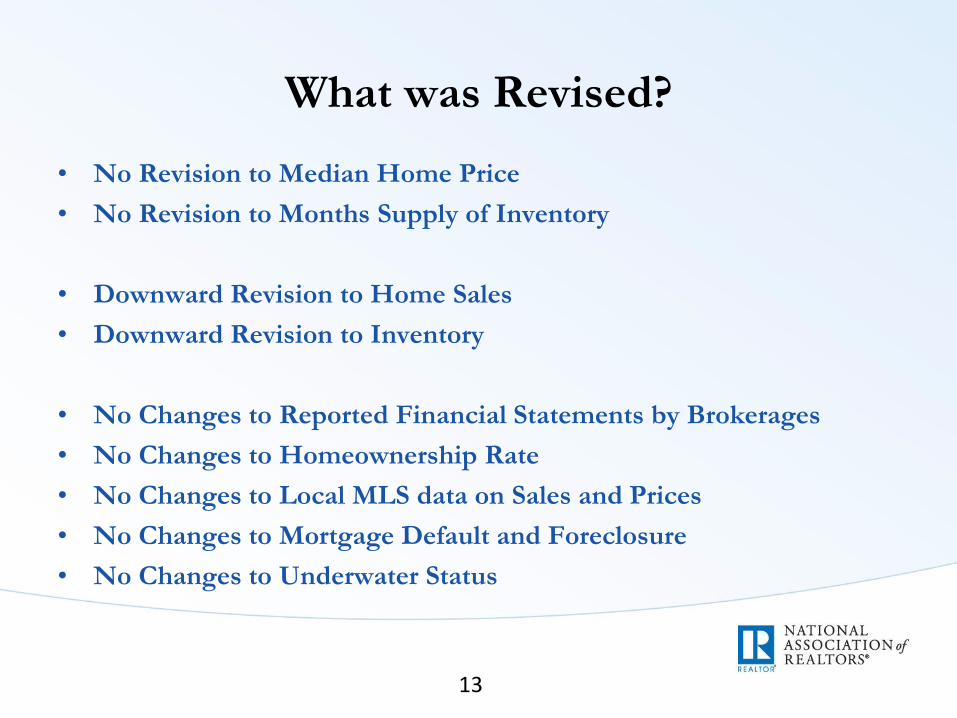
What was Revised?
• No Revision to Median Home Price
• No Revision to Months Supply of Inventory
• Downward Revision to Home Sales
• Downward Revision to Inventory
• No Changes to Reported Financial Statements by Brokerages
• No Changes to Homeownership Rate
• No Changes to Local MLS data on Sales and Prices
• No Changes to Mortgage Default and Foreclosure
• No Changes to Underwater Status
14 14
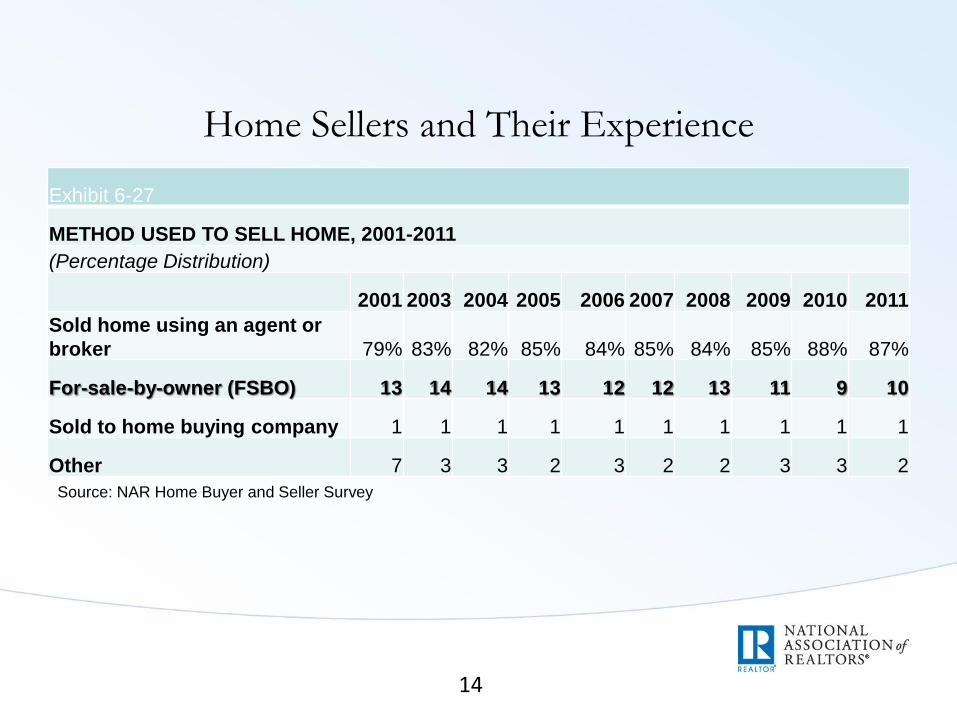
Home Sellers and Their Experience
Exhibit 6-27
METHOD USED TO SELL HOME, 2001-2011
(Percentage Distribution)
2001 2003 2004 2005 2006 2007 2008 2009 2010 2011
Sold home using an agent or
broker 79% 83% 82% 85% 84% 85% 84% 85% 88% 87%
For-sale-by-owner (FSBO) 13 14 14 13 12 12 13 11 9 10
Sold to home buying company 1 1 1 1 1 1 1 1 1 1
Other 7 3 3 2 3 2 2 3 3 2
Source: NAR Home Buyer and Seller Survey
15 15
Future Rebenchmark Plans
• Rebenchmark as better source of data becomes
more readily available or due to notable data drift
– Courthouse Data LPS, CoreLogic, DataQuick
• Realtor Property Resource® (RPR)
– Utilizing detailed property level data of both
deeds records and MLS information as potential
future source
• Exploring the Development of Repeat-Price Index
using Timely MLS data
16
Home Builder Data
David Crowe
Chief Economist
Urban Institute
December 9, 2013

17
New Home Sales
18
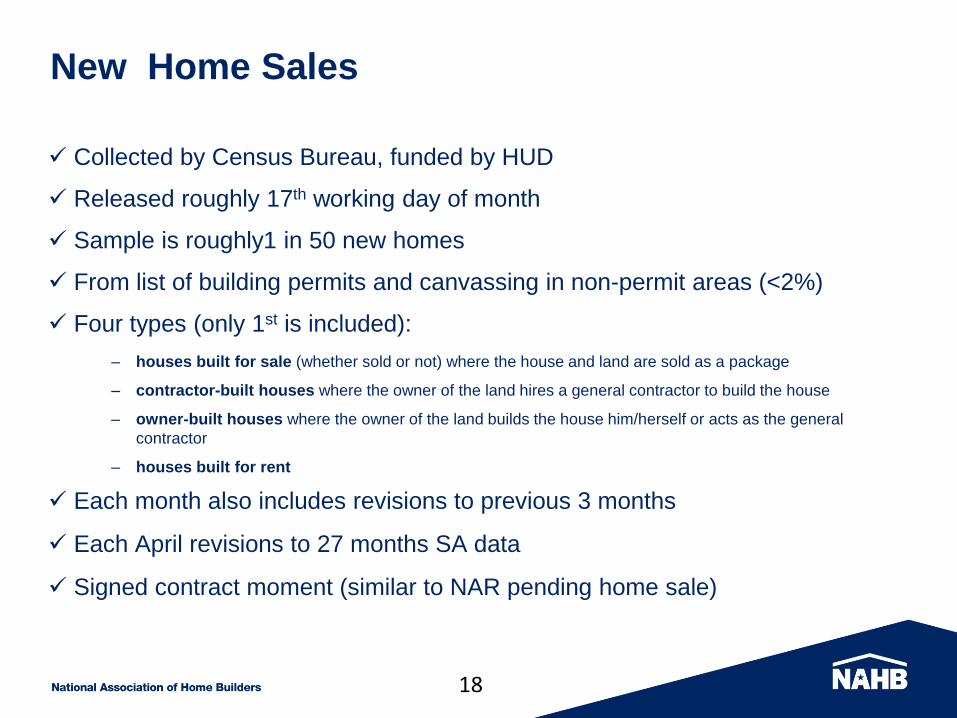
New Home Sales
Collected by Census Bureau, funded by HUD
Released roughly 17th working day of month
Sample is roughly1 in 50 new homes
From list of building permits and canvassing in non-permit areas (<2%)
Four types (only 1st is included):
– houses built for sale (whether sold or not) where the house and land are sold as a package
– contractor-built houses where the owner of the land hires a general contractor to build the house
– owner-built houses where the owner of the land builds the house him/herself or acts as the general
contractor
– houses built for rent
Each month also includes revisions to previous 3 months
Each April revisions to 27 months SA data
Signed contract moment (similar to NAR pending home sale)
19
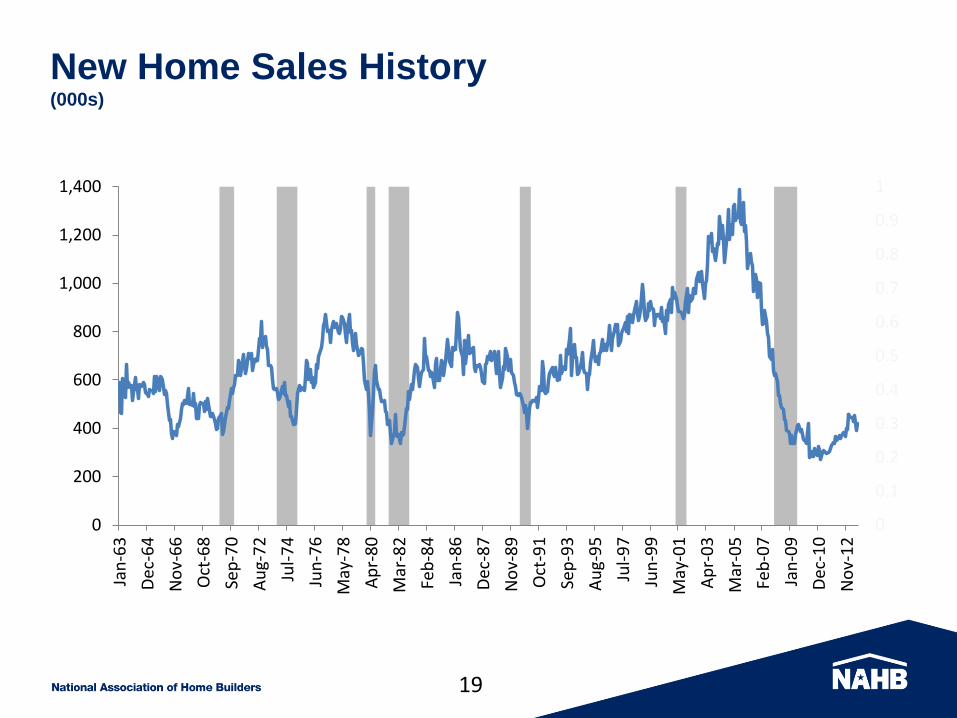
New Home Sales History (000s)
0
0.1
0.2
0.3
0.4
0.5
0.6
0.7
0.8
0.9
1
0
200
400
600
800
1,000
1,200
1,400
Jan
-63
Dec
-64
No
v-6
6
Oct
-68
Sep
-70
Au
g-7
2
Jul-
74
Jun
-76
May
-78
Ap
r-8
0
Mar
-82
Feb
-84
Jan
-86
Dec
-87
No
v-8
9
Oct
-91
Sep
-93
Au
g-9
5
Jul-
97
Jun
-99
May
-01
Ap
r-0
3
Mar
-05
Feb
-07
Jan
-09
Dec
-10
No
v-1
2
20
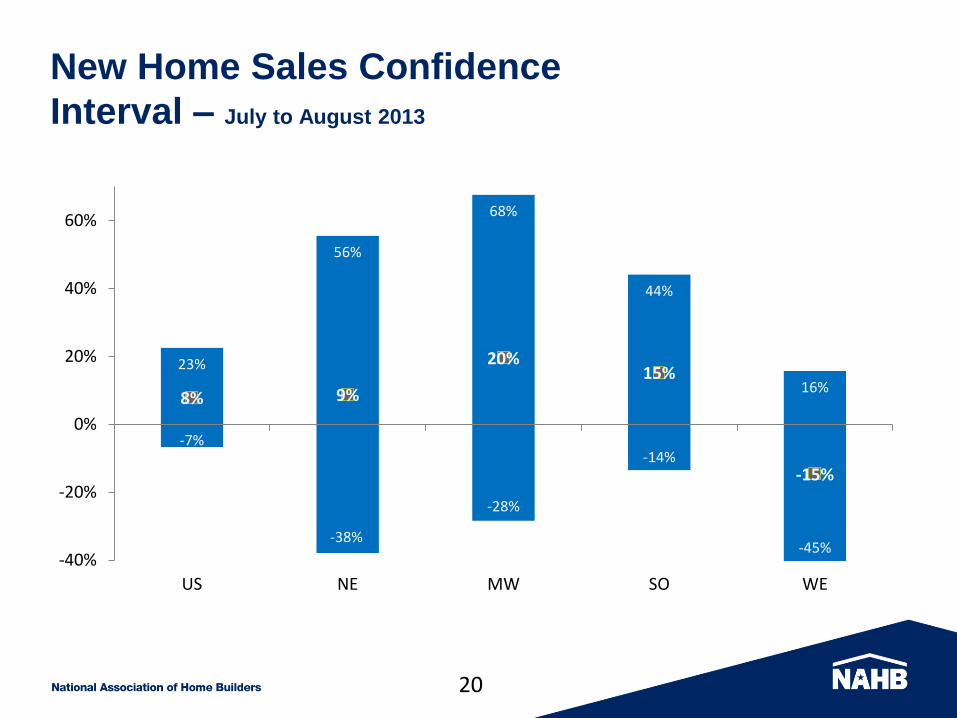
New Home Sales Confidence
Interval – July to August 2013
23%
56%
68%
44%
16%
-7%
-38%
-28%
-14%
-45%
8% 9%
20% 15%
-15%
-40%
-20%
0%
20%
40%
60%
US NE MW SO WE
21
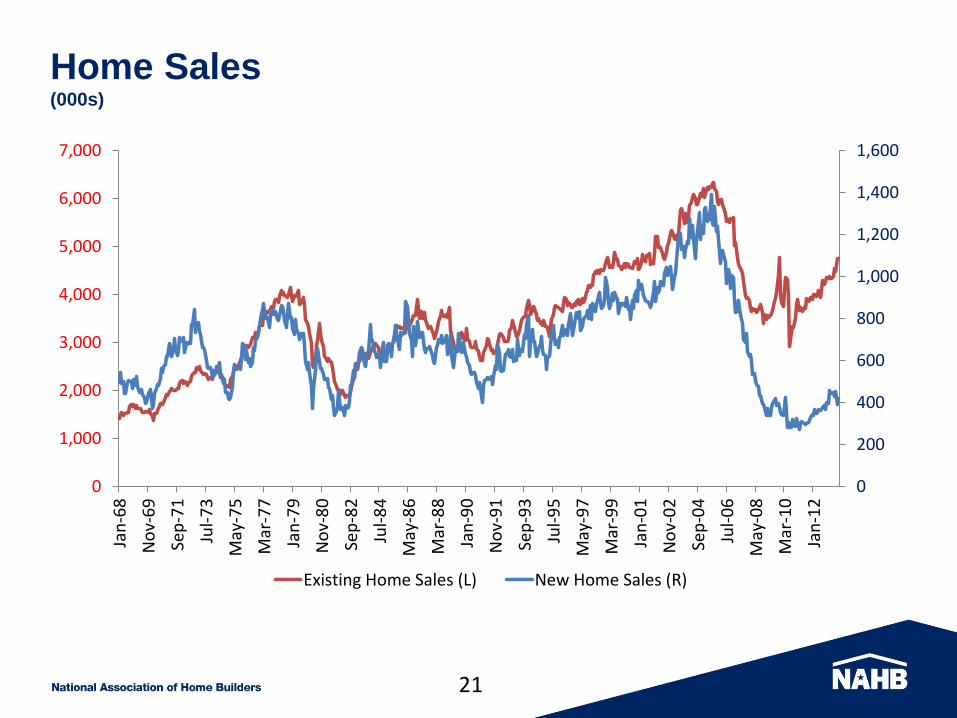
Home Sales (000s)
0
200
400
600
800
1,000
1,200
1,400
1,600
0
1,000
2,000
3,000
4,000
5,000
6,000
7,000
Jan
-68
No
v-6
9
Sep
-71
Jul-
73
May
-75
Mar
-77
Jan
-79
No
v-8
0
Sep
-82
Jul-
84
May
-86
Mar
-88
Jan
-90
No
v-9
1
Sep
-93
Jul-
95
May
-97
Mar
-99
Jan
-01
No
v-0
2
Sep
-04
Jul-
06
May
-08
Mar
-10
Jan
-12
Existing Home Sales (L) New Home Sales (R)
22
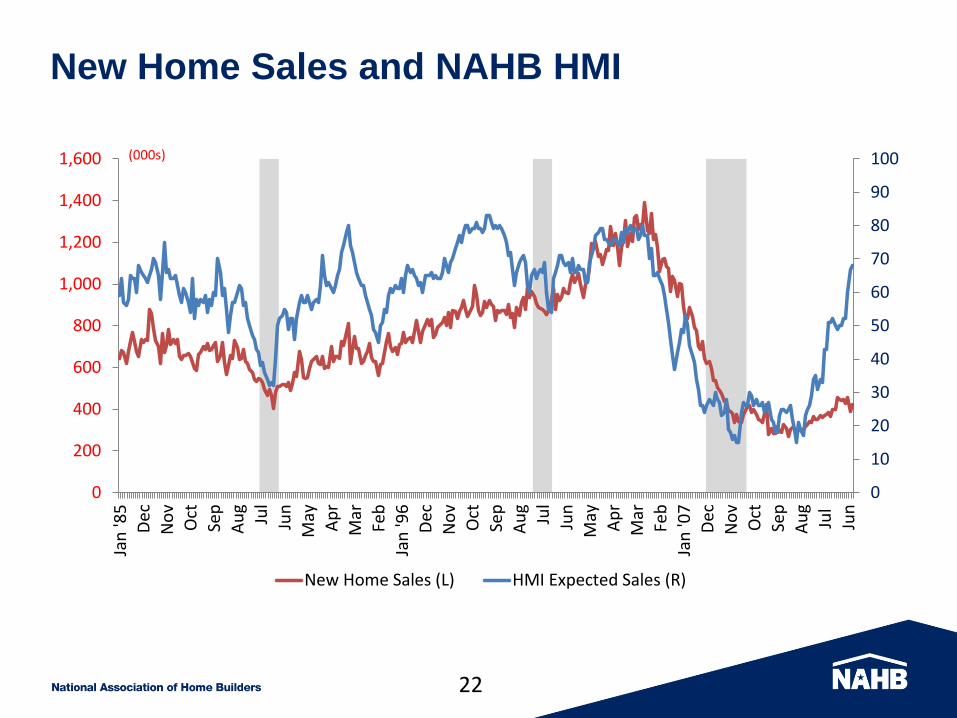
New Home Sales and NAHB HMI
0
10
20
30
40
50
60
70
80
90
100
0
200
400
600
800
1,000
1,200
1,400
1,600
Jan
'85
Dec
No
v
Oct
Sep
Au
g
Jul
Jun
May
Ap
r
Mar
Feb
Jan
'96
Dec
No
v
Oct
Sep
Au
g
Jul
Jun
May
Ap
r
Mar
Feb
Jan
'07
Dec
No
v
Oct
Sep
Au
g
Jul
Jun
New Home Sales (L) HMI Expected Sales (R)
(000s)
23
Housing Opportunity Index
24
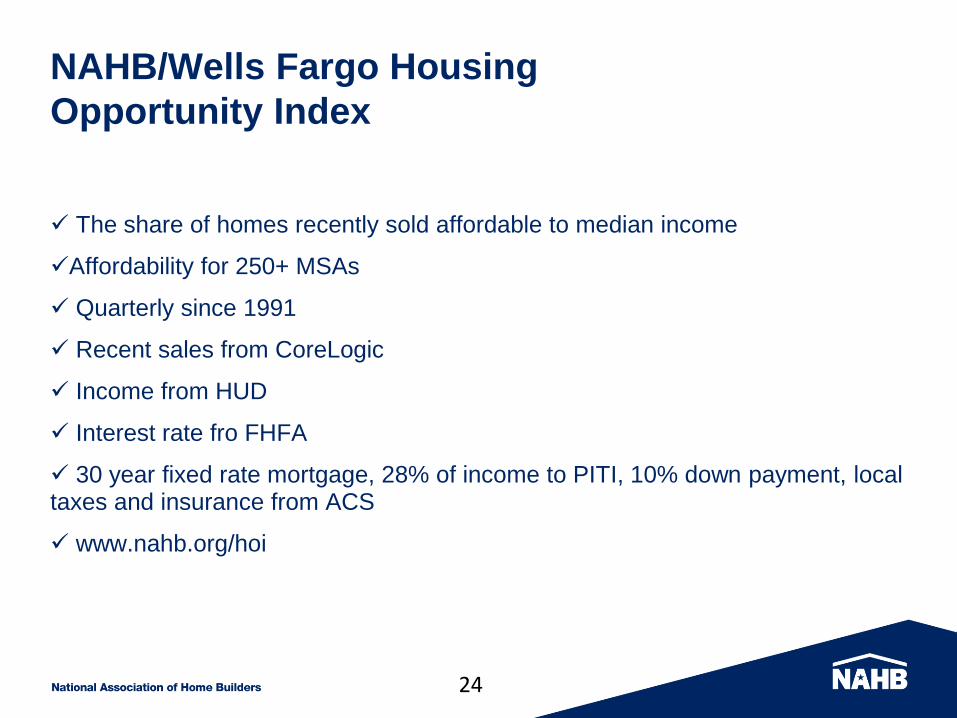
NAHB/Wells Fargo Housing
Opportunity Index
The share of homes recently sold affordable to median income
Affordability for 250+ MSAs
Quarterly since 1991
Recent sales from CoreLogic
Income from HUD
Interest rate fro FHFA
30 year fixed rate mortgage, 28% of income to PITI, 10% down payment, local taxes and insurance from ACS
www.nahb.org/hoi
25
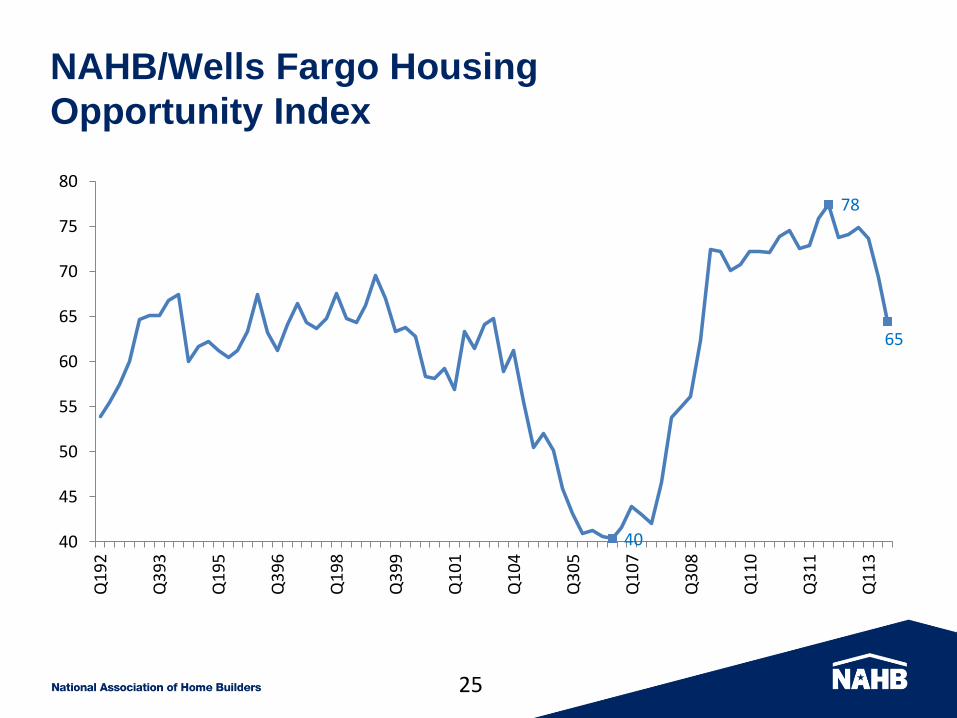
NAHB/Wells Fargo Housing
Opportunity Index
40
78
65
40
45
50
55
60
65
70
75
80
Q1
92
Q3
93
Q1
95
Q3
96
Q1
98
Q3
99
Q1
01
Q1
04
Q3
05
Q1
07
Q3
08
Q1
10
Q3
11
Q1
13
26
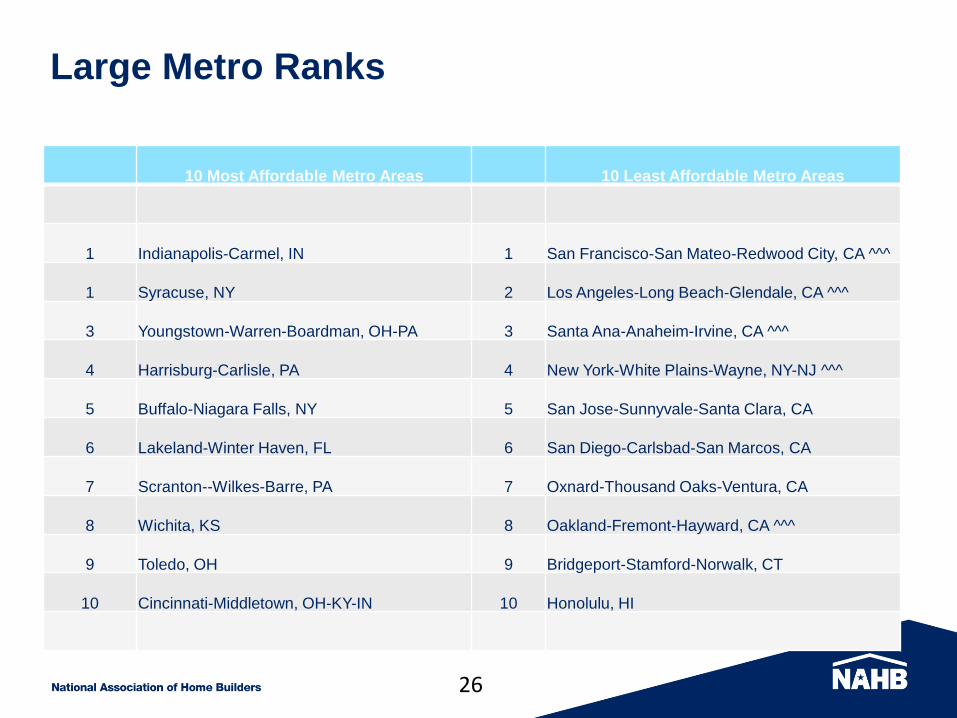
Large Metro Ranks
10 Most Affordable Metro Areas 10 Least Affordable Metro Areas
1 Indianapolis-Carmel, IN 1 San Francisco-San Mateo-Redwood City, CA ^^^
1 Syracuse, NY 2 Los Angeles-Long Beach-Glendale, CA ^^^
3 Youngstown-Warren-Boardman, OH-PA 3 Santa Ana-Anaheim-Irvine, CA ^^^
4 Harrisburg-Carlisle, PA 4 New York-White Plains-Wayne, NY-NJ ^^^
5 Buffalo-Niagara Falls, NY 5 San Jose-Sunnyvale-Santa Clara, CA
6 Lakeland-Winter Haven, FL 6 San Diego-Carlsbad-San Marcos, CA
7 Scranton--Wilkes-Barre, PA 7 Oxnard-Thousand Oaks-Ventura, CA
8 Wichita, KS 8 Oakland-Fremont-Hayward, CA ^^^
9 Toledo, OH 9 Bridgeport-Stamford-Norwalk, CT
10 Cincinnati-Middletown, OH-KY-IN 10 Honolulu, HI
27
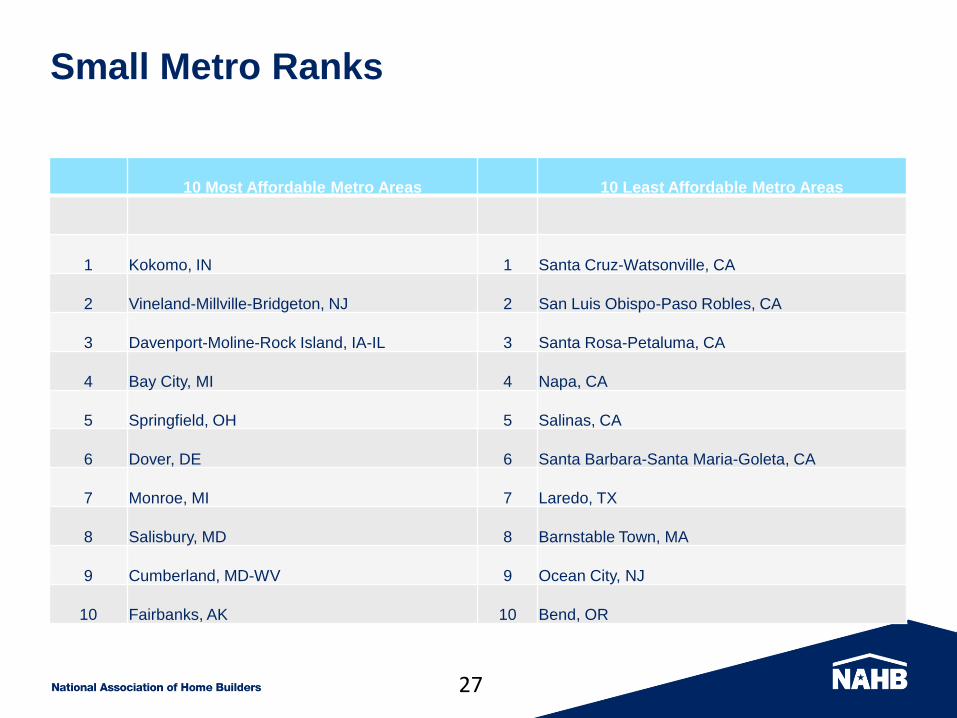
Small Metro Ranks
10 Most Affordable Metro Areas 10 Least Affordable Metro Areas
1 Kokomo, IN 1 Santa Cruz-Watsonville, CA
2 Vineland-Millville-Bridgeton, NJ 2 San Luis Obispo-Paso Robles, CA
3 Davenport-Moline-Rock Island, IA-IL 3 Santa Rosa-Petaluma, CA
4 Bay City, MI 4 Napa, CA
5 Springfield, OH 5 Salinas, CA
6 Dover, DE 6 Santa Barbara-Santa Maria-Goleta, CA
7 Monroe, MI 7 Laredo, TX
8 Salisbury, MD 8 Barnstable Town, MA
9 Cumberland, MD-WV 9 Ocean City, NJ
10 Fairbanks, AK 10 Bend, OR
28 28
NAR Data
Affordability Index
29 29
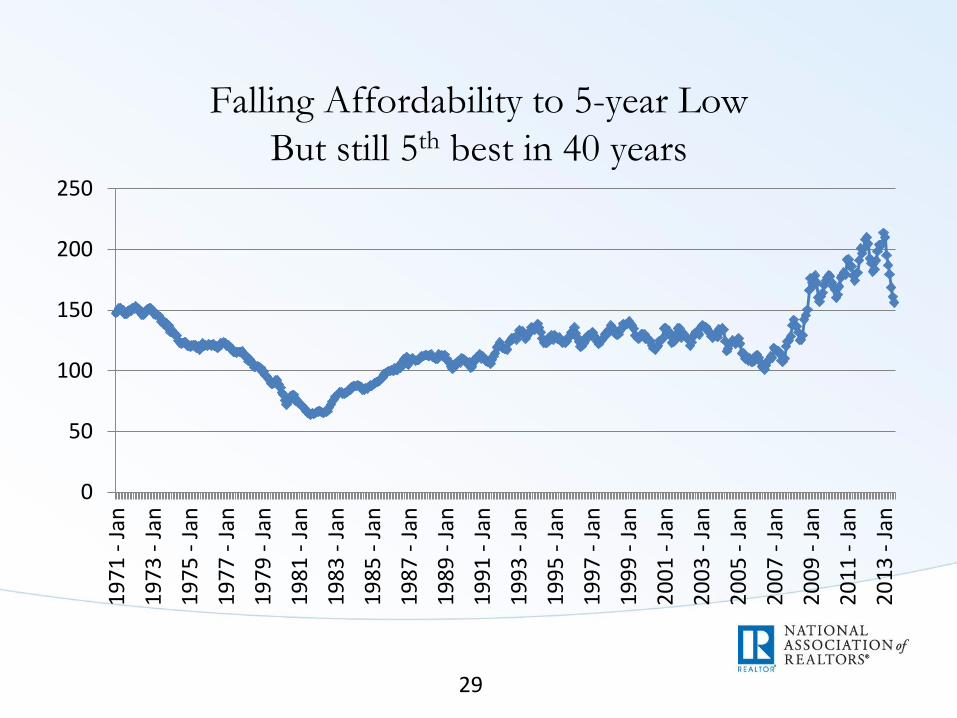
Falling Affordability to 5-year Low
But still 5th best in 40 years
0
50
100
150
200
250
19
71
- J
an
19
73
- J
an
19
75
- J
an
19
77
- J
an
19
79
- J
an
19
81
- J
an
19
83
- J
an
19
85
- J
an
19
87
- J
an
19
89
- J
an
19
91
- J
an
19
93
- J
an
19
95
- J
an
19
97
- J
an
19
99
- J
an
20
01
- J
an
20
03
- J
an
20
05
- J
an
20
07
- J
an
20
09
- J
an
20
11
- J
an
20
13
- J
an
30 30
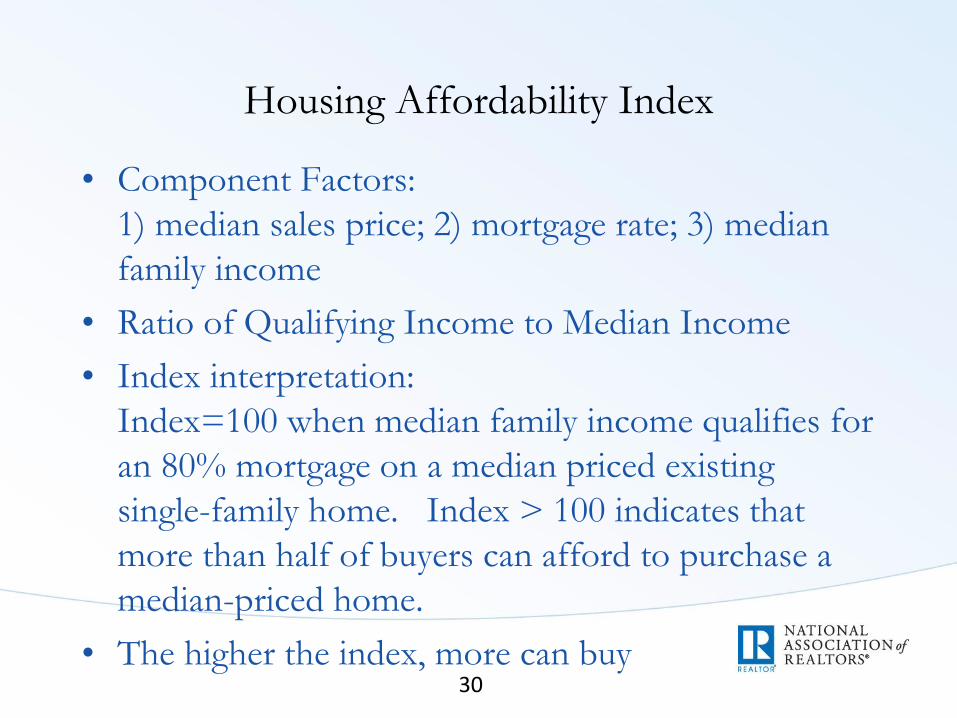
Housing Affordability Index
• Component Factors:
1) median sales price; 2) mortgage rate; 3) median
family income
• Ratio of Qualifying Income to Median Income
• Index interpretation:
Index=100 when median family income qualifies for
an 80% mortgage on a median priced existing
single-family home. Index > 100 indicates that
more than half of buyers can afford to purchase a
median-priced home.
• The higher the index, more can buy
31 31
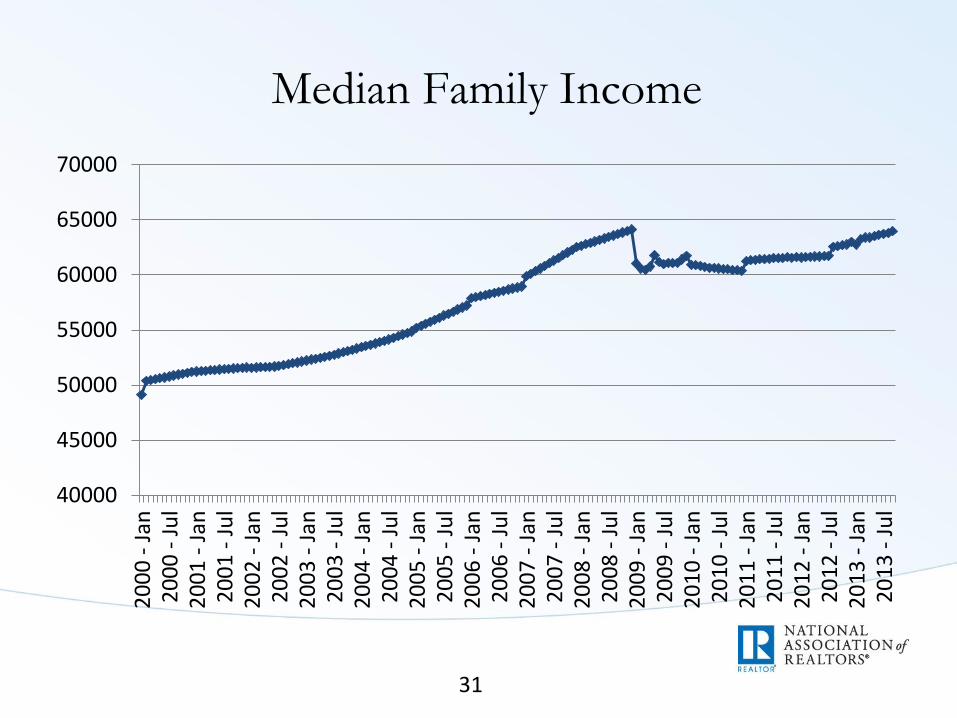
Median Family Income
40000
45000
50000
55000
60000
65000
700002
00
0 -
Jan
20
00
- J
ul
20
01
- J
an2
00
1 -
Ju
l2
00
2 -
Jan
20
02
- J
ul
20
03
- J
an2
00
3 -
Ju
l2
00
4 -
Jan
20
04
- J
ul
20
05
- J
an2
00
5 -
Ju
l2
00
6 -
Jan
20
06
- J
ul
20
07
- J
an2
00
7 -
Ju
l2
00
8 -
Jan
20
08
- J
ul
20
09
- J
an2
00
9 -
Ju
l2
01
0 -
Jan
20
10
- J
ul
20
11
- J
an2
01
1 -
Ju
l2
01
2 -
Jan
20
12
- J
ul
20
13
- J
an2
01
3 -
Ju
l
32 32
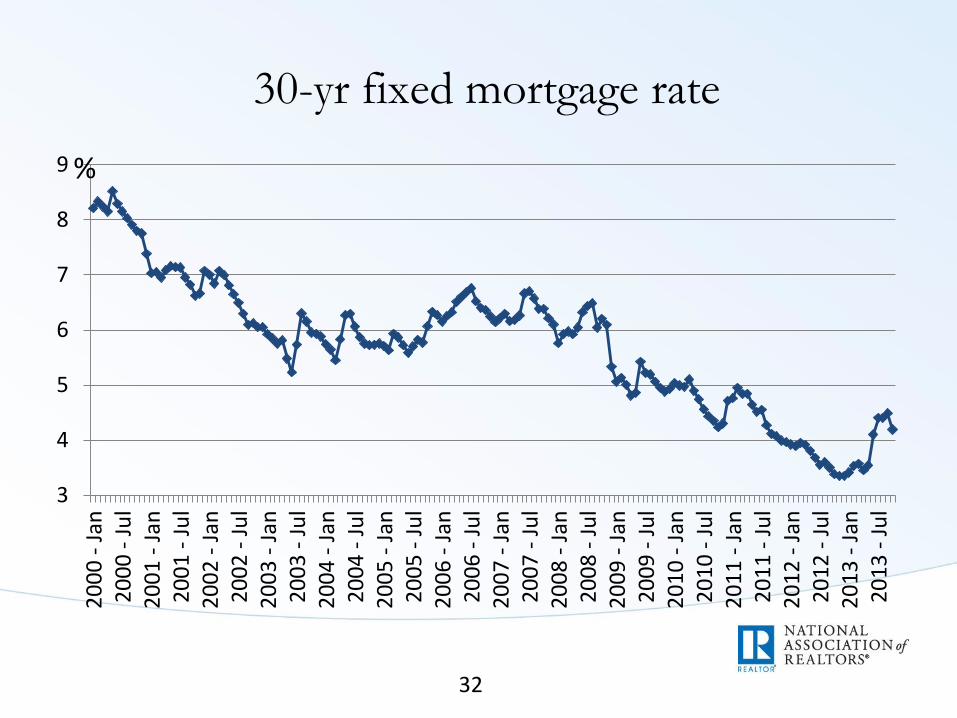
30-yr fixed mortgage rate
3
4
5
6
7
8
9
20
00
- J
an2
00
0 -
Ju
l2
00
1 -
Jan
20
01
- J
ul
20
02
- J
an2
00
2 -
Ju
l2
00
3 -
Jan
20
03
- J
ul
20
04
- J
an2
00
4 -
Ju
l2
00
5 -
Jan
20
05
- J
ul
20
06
- J
an2
00
6 -
Ju
l2
00
7 -
Jan
20
07
- J
ul
20
08
- J
an2
00
8 -
Ju
l2
00
9 -
Jan
20
09
- J
ul
20
10
- J
an2
01
0 -
Ju
l2
01
1 -
Jan
20
11
- J
ul
20
12
- J
an2
01
2 -
Ju
l2
01
3 -
Jan
20
13
- J
ul
%
33 33
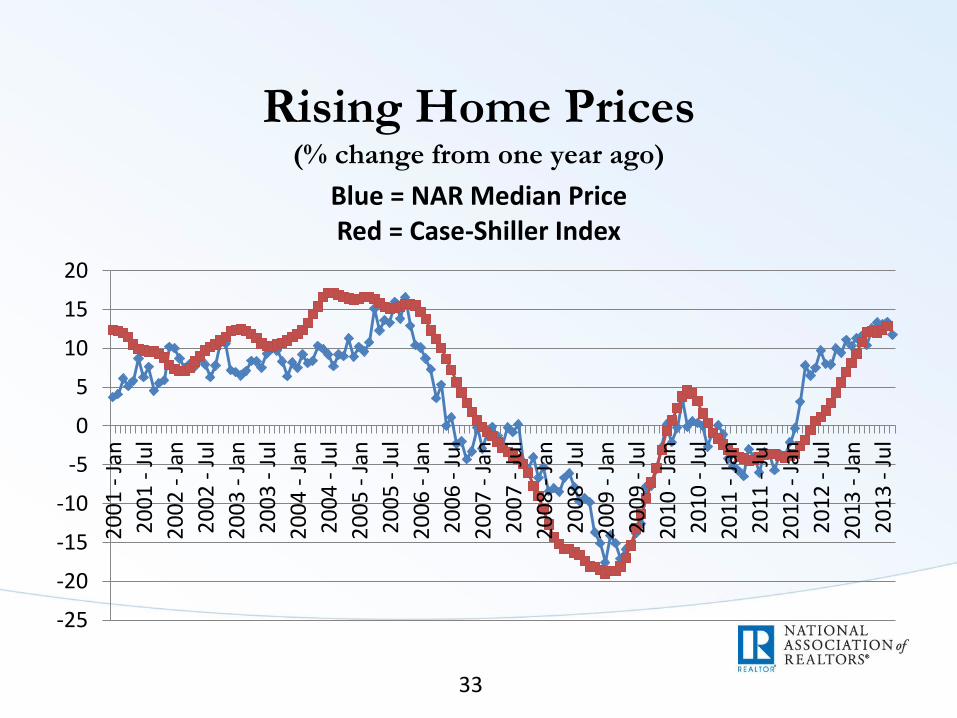
Rising Home Prices (% change from one year ago)
-25
-20
-15
-10
-5
0
5
10
15
20
20
01
- J
an
20
01
- J
ul
20
02
- J
an
20
02
- J
ul
20
03
- J
an
20
03
- J
ul
20
04
- J
an
20
04
- J
ul
20
05
- J
an
20
05
- J
ul
20
06
- J
an
20
06
- J
ul
20
07
- J
an
20
07
- J
ul
20
08
- J
an
20
08
- J
ul
20
09
- J
an
20
09
- J
ul
20
10
- J
an
20
10
- J
ul
20
11
- J
an
20
11
- J
ul
20
12
- J
an
20
12
- J
ul
20
13
- J
an
20
13
- J
ul
Blue = NAR Median Price Red = Case-Shiller Index

34 34
NAR Data
REALTOR Survey Data
35 35
REALTORS® Confidence Index
• Monthly survey of REALTORS® providing information on residential market conditions and outlook
• Random, on-line survey
• Approximately 3,000 responses each month

36 36
Questionnaire
Market Conditions.
• Current Conditions Confidence Index for SF, Condo.
• Six Months Ahead Confidence Index for SF, Condo.
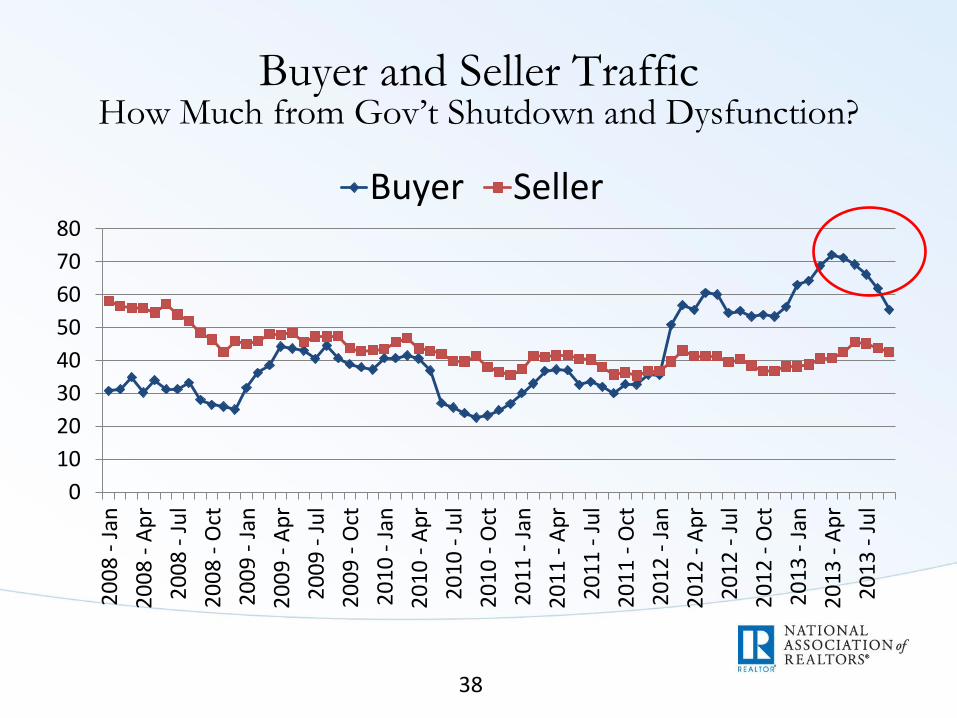
• Buyer and Seller Traffic Index.
• Distressed Sales – Volume, Price Discounts, Property Condition.
• Time on Market.
Buyer and Seller Characteristics.
• Cash/Non-cash.
• Type of Buyer – First Time, Investor
Current Issues
• Special Questions—e.g., impacts of government shutdown, etc.
37 37
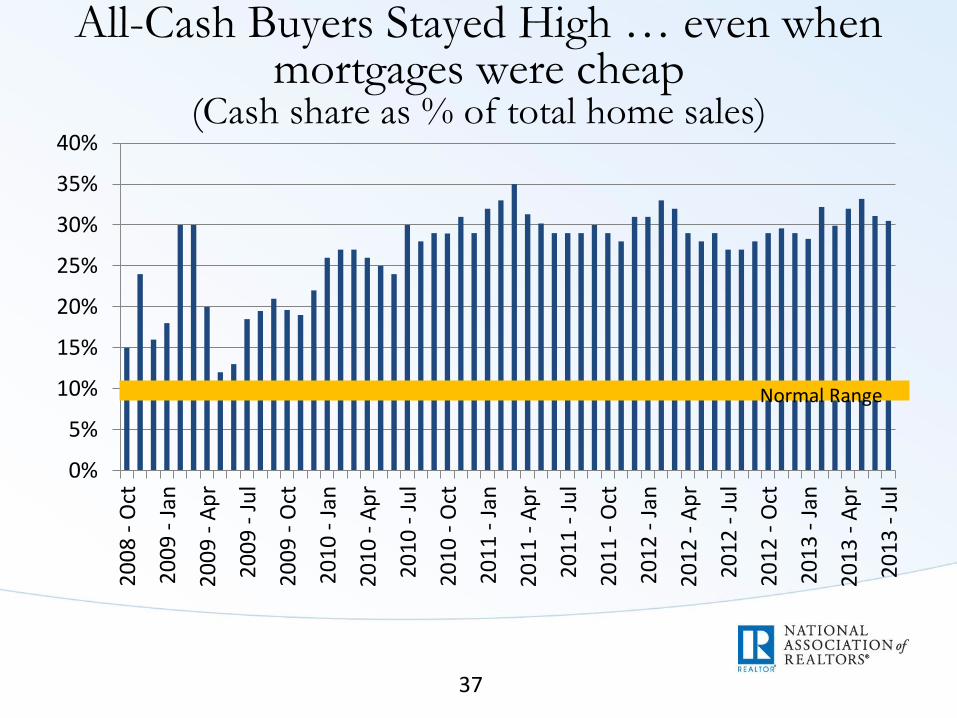
All-Cash Buyers Stayed High … even when mortgages were cheap
(Cash share as % of total home sales)
0%
5%
10%
15%
20%
25%
30%
35%
40%2
00
8 -
Oct
20
09
- J
an
20
09
- A
pr
20
09
- J
ul
20
09
- O
ct
20
10
- J
an
20
10
- A
pr
20
10
- J
ul
20
10
- O
ct
20
11
- J
an
20
11
- A
pr
20
11
- J
ul
20
11
- O
ct
20
12
- J
an
20
12
- A
pr
20
12
- J
ul
20
12
- O
ct
20
13
- J
an
20
13
- A
pr
20
13
- J
ul
Normal Range
38 38
Buyer and Seller Traffic How Much from Gov’t Shutdown and Dysfunction?
0
10
20
30
40
50
60
70
80
20
08
- J
an
20
08
- A
pr
20
08
- J
ul
20
08
- O
ct
20
09
- J
an
20
09
- A
pr
20
09
- J
ul
20
09
- O
ct
20
10
- J
an
20
10
- A
pr
20
10
- J
ul
20
10
- O
ct
20
11
- J
an
20
11
- A
pr
20
11
- J
ul
20
11
- O
ct
20
12
- J
an
20
12
- A
pr
20
12
- J
ul
20
12
- O
ct
20
13
- J
an
20
13
- A
pr
20
13
- J
ul
Buyer Seller

39
NAHB Surveys
40
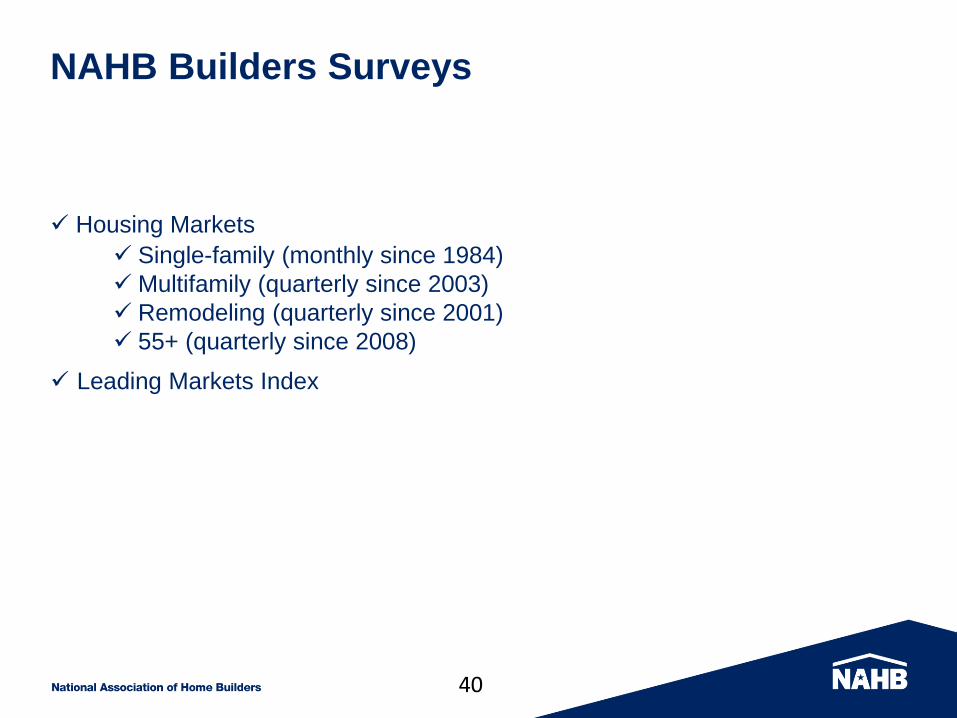
NAHB Builders Surveys
Housing Markets
Single-family (monthly since 1984)
Multifamily (quarterly since 2003)
Remodeling (quarterly since 2001)
55+ (quarterly since 2008)
Leading Markets Index
41
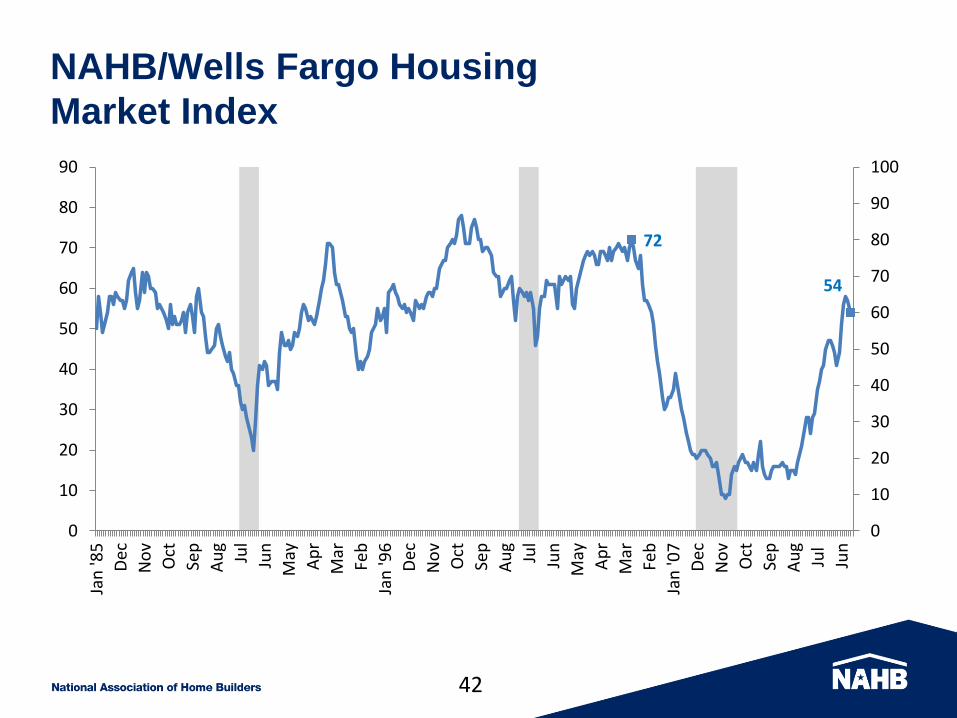
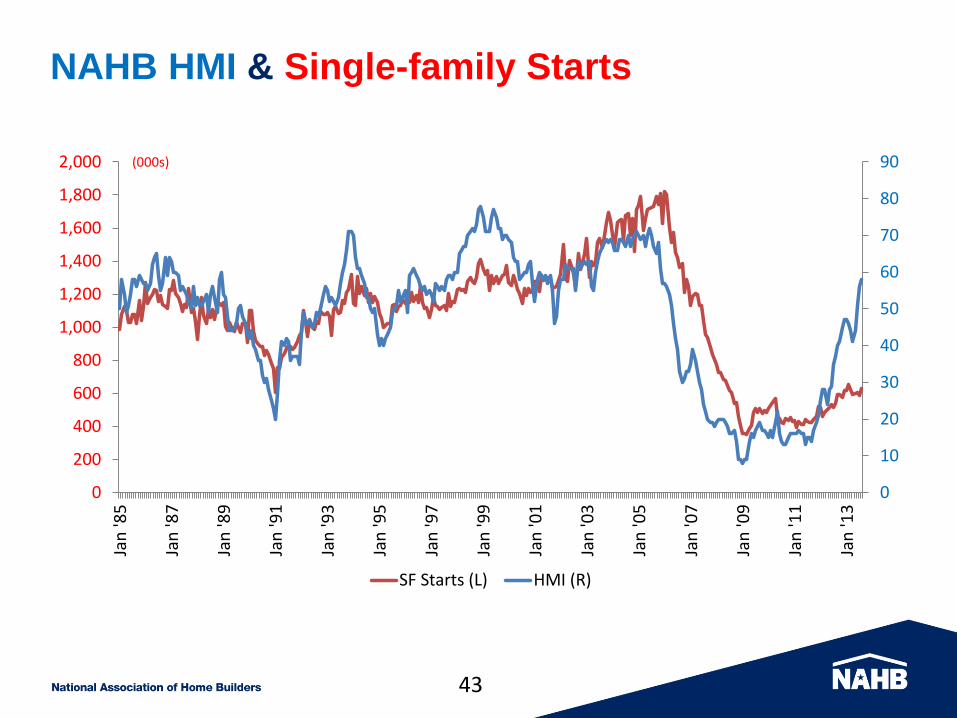
NAHB/Wells Fargo Housing
Market Index
Released monthly on day before starts
Survey in first 10 days of month
Same questions on
Current sales (good, fair, poor),
Expected sales over next 6 months (good, fair, poor)
Traffic (high/very high, average, low/very low)
Diffusion index based from 0 to 100 (good - poor, divide by 2 and add 50) (after seasonal adjustment)
National and four census regions
42
NAHB/Wells Fargo Housing
Market Index
72
54
0
10
20
30
40
50
60
70
80
90
100
0
10
20
30
40
50
60
70
80
90
Jan
'85
Dec
No
v
Oct
Sep
Au
g
Jul
Jun
May
Ap
r
Mar
Feb
Jan
'96
Dec
No
v
Oct
Sep
Au
g
Jul
Jun
May
Ap
r
Mar
Feb
Jan
'07
Dec
No
v
Oct
Sep
Au
g
Jul
Jun
43
NAHB HMI & Single-family Starts
0
10
20
30
40
50
60
70
80
90
0
200
400
600
800
1,000
1,200
1,400
1,600
1,800
2,000
Jan
'85
Jan
'87
Jan
'89
Jan
'91
Jan
'93
Jan
'95
Jan
'97
Jan
'99
Jan
'01
Jan
'03
Jan
'05
Jan
'07
Jan
'09
Jan
'11
Jan
'13
SF Starts (L) HMI (R)
(000s)

44
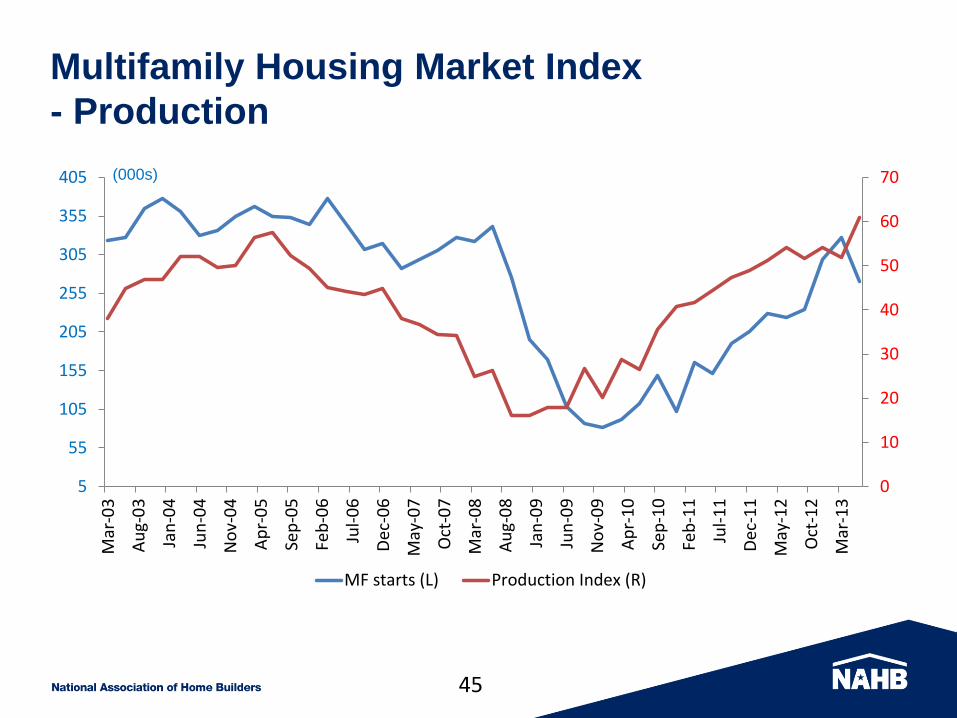
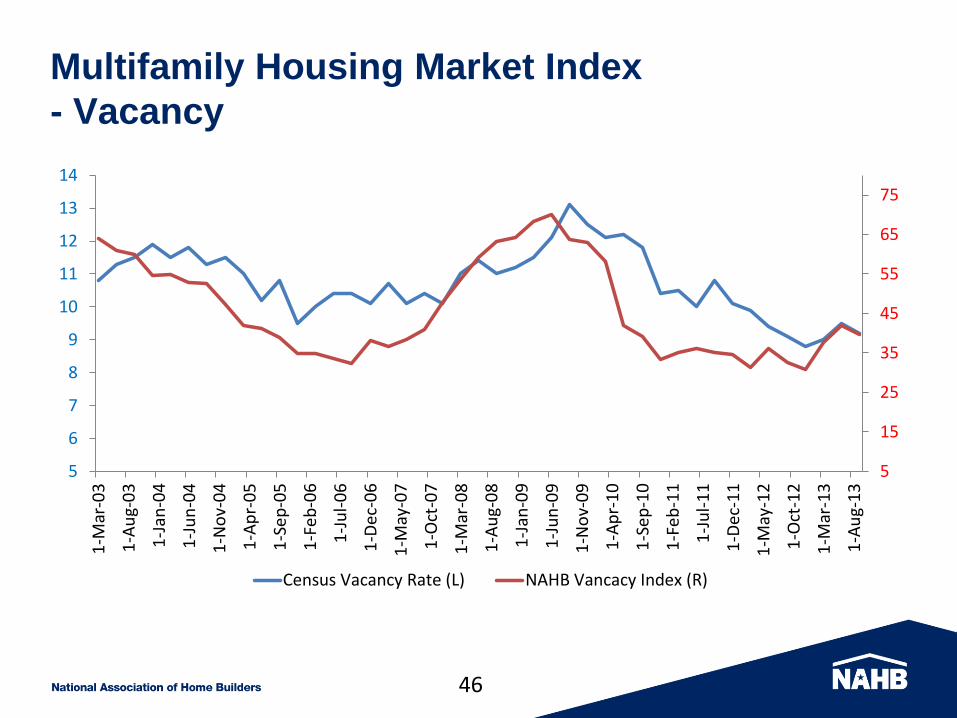
NAHB Multifamily Housing
Market Index
Quarterly 1 ½ month after end of quarter
Production and vacancy indexes
Production index:
Stronger, same, weaker for
low income, market rate and condo markets
Vacancy index:
Higher, same, lower for
Class A, B and C
Diffusion index
45
Multifamily Housing Market Index
- Production
0
10
20
30
40
50
60
70
5
55
105
155
205
255
305
355
405
Mar
-03
Au
g-0
3
Jan
-04
Jun
-04
No
v-0
4
Ap
r-0
5
Sep
-05
Feb
-06
Jul-
06
Dec
-06
May
-07
Oct
-07
Mar
-08
Au
g-0
8
Jan
-09
Jun
-09
No
v-0
9
Ap
r-1
0
Sep
-10
Feb
-11
Jul-
11
Dec
-11
May
-12
Oct
-12
Mar
-13
MF starts (L) Production Index (R)
(000s)
46
Multifamily Housing Market Index
- Vacancy
5
15
25
35
45
55
65
75
5
6
7
8
9
10
11
12
13
14
1-M
ar-0
3
1-A
ug-
03
1-J
an-0
4
1-J
un
-04
1-N
ov-
04
1-A
pr-
05
1-S
ep
-05
1-F
eb
-06
1-J
ul-
06
1-D
ec-0
6
1-M
ay-0
7
1-O
ct-0
7
1-M
ar-0
8
1-A
ug-
08
1-J
an-0
9
1-J
un
-09
1-N
ov-
09
1-A
pr-
10
1-S
ep
-10
1-F
eb
-11
1-J
ul-
11
1-D
ec-1
1
1-M
ay-1
2
1-O
ct-1
2
1-M
ar-1
3
1-A
ug-
13
Census Vacancy Rate (L) NAHB Vancacy Index (R)
47
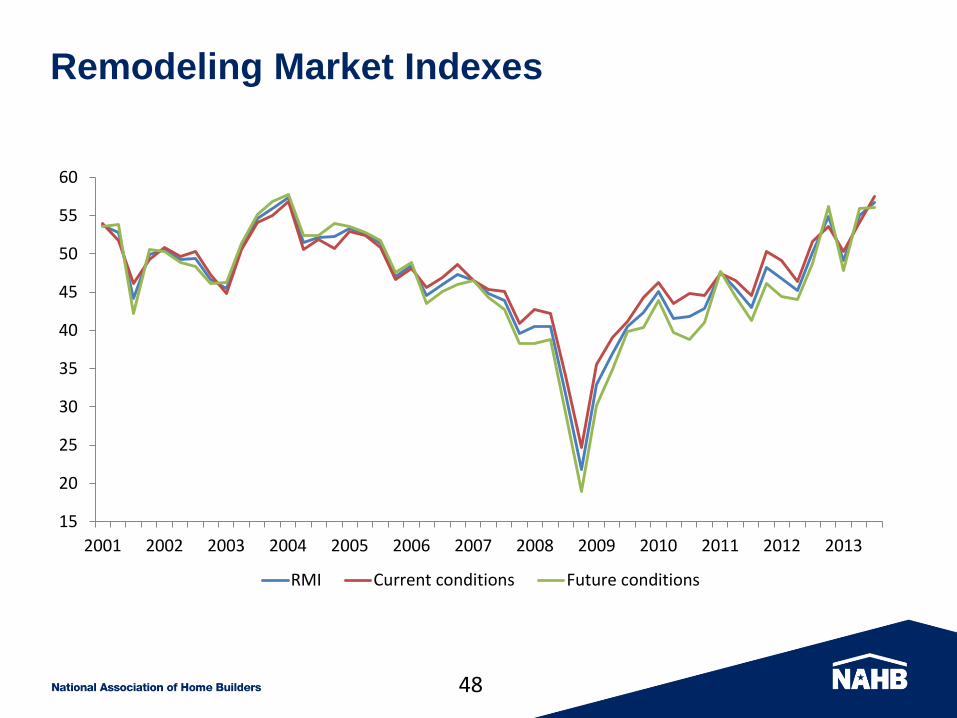
Remodeling Market Index
Current market conditions
Major additions & alterations for owners and renters
Minor additions & alterations for owners and renters
Maintenance & repair for owners and renters
Future market conditions
Calls for bids for owners and renters
Committed work in next 6 months for owners and renters
Backlog of committed jobs
Appointments for proposals
Diffusion index using: higher, about the same, lower ratings
48
Remodeling Market Indexes
15
20
25
30
35
40
45
50
55
60
2001 2002 2003 2004 2005 2006 2007 2008 2009 2010 2011 2012 2013
RMI Current conditions Future conditions
49
NAHB/First American Leading
Markets Index
Progress toward normality
Compare most recent 12 months levels to ‘normal’ year
Single-family permits from Census- last normal 2000-2003
House price index from Freddie Mac - last normal 2000-2003
Employment from BLS – last normal 2007
Index is average of three ratios
Monthly on fourth working day
All 360+ MSAs
50
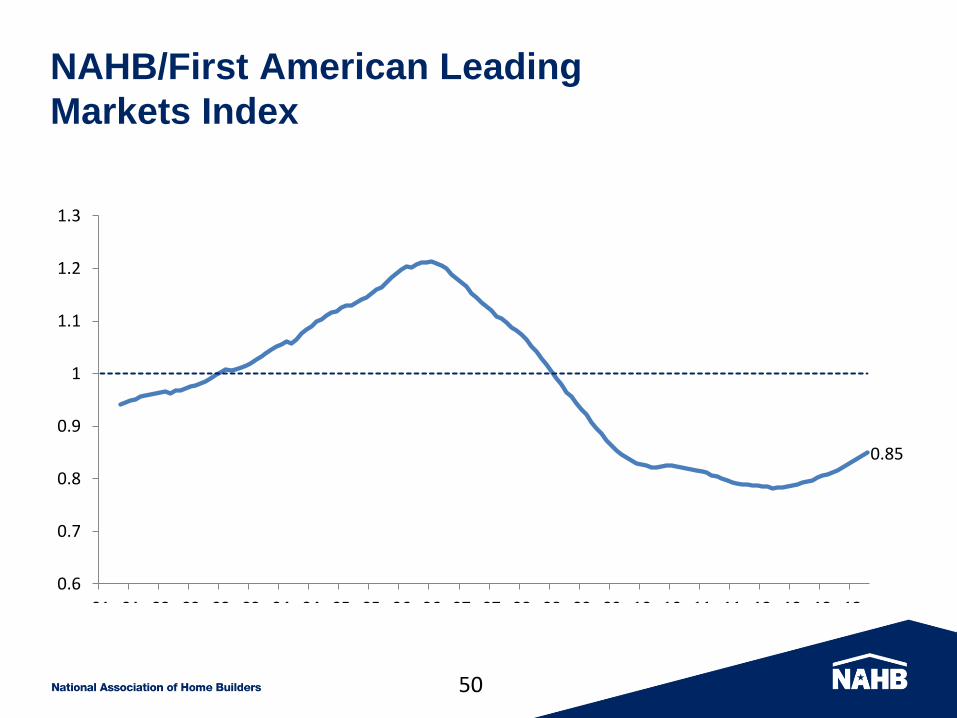
NAHB/First American Leading
Markets Index
0.85
0.6
0.7
0.8
0.9
1
1.1
1.2
1.3
01 01 02 02 03 03 04 04 05 05 06 06 07 07 08 08 09 09 10 10 11 11 12 12 13 13
51
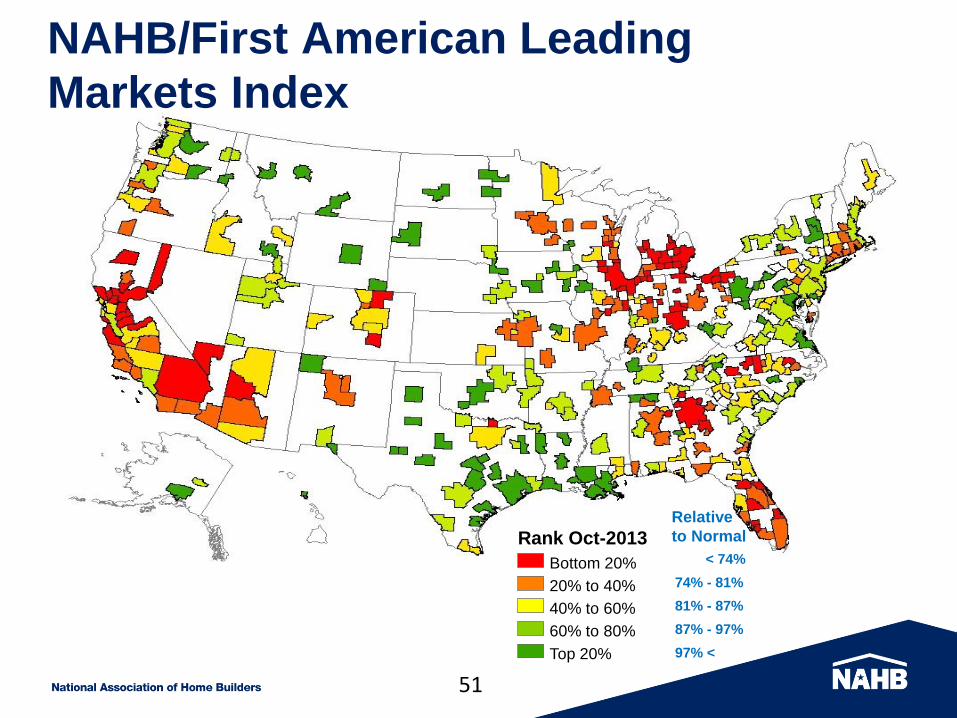
NAHB/First American Leading
Markets Index
Rank Oct-2013
Bottom 20%
20% to 40%
40% to 60%
60% to 80%
Top 20%
Relative
to Normal
< 74%
74% - 81%
81% - 87%
87% - 97%
97% <