Luis J. Álvarez, Emmanuel Dhyne, Marco M. Hoeberichts ...
26
STICKY PRICES IN THE EURO AREA: A SUMMARY OF NEW MICRO EVIDENCE Documentos de Trabajo N.º 0542 Luis J. Álvarez, Emmanuel Dhyne, Marco M. Hoeberichts, Claudia Kwapil, Hervé Le Bihan, Patrick Lünnemann, Fernando Martins, Roberto Sabbatini, Harald Stahl, Philip Vermeulen and Jouko Vilmunen 2005
Transcript of Luis J. Álvarez, Emmanuel Dhyne, Marco M. Hoeberichts ...
STICKY PRICES IN THE EURO AREA:A SUMMARY OF NEW MICRO EVIDENCE
Documentos de Trabajo N.º 0542
Luis J. Álvarez, Emmanuel Dhyne, Marco M. Hoeberichts,Claudia Kwapil, Hervé Le Bihan, Patrick Lünnemann,Fernando Martins, Roberto Sabbatini, Harald Stahl,Philip Vermeulen and Jouko Vilmunen
2005

STICKY PRICES IN THE EURO AREA: A SUMMARY OF NEW MICRO EVIDENCE
STICKY PRICES IN THE EURO AREA: A SUMMARY OF NEW MICRO
EVIDENCE (*)
Luis J. Álvarez, Emmanuel Dhyne, Marco M. Hoeberichts, Claudia Kwapil,
Hervé Le Bihan, Patrick Lünnemann, Fernando Martins,
Roberto Sabbatini, Harald Stahl, Philip Vermeulen and Jouko Vilmunen (**)
(*) We are grateful to national statistical institutes for providing the individual price records, to all IPN members,especially S. Fabiani, J. Galí, V. Gaspar, I. Hernando, J. Hoffmann, T. Mathä, F. Smets and G. Veronese as well as participants at the 2005 meeting of the European Economic Association and at a CEMFI seminar for helpful commentsand suggestions. The views expressed in this paper are those of the authors and do not necessarily reflect the views of the central banks to which they are affiliated.
(**) Corresponding author: Luis J. Álvarez ([email protected]). Authors affiliations: Banco de España (Luis. J. Álvarez), Banque Nationale de Belgique (Emmanuel Dhyne), De Nederlandsche Bank (Marco M. Hoeberichts), Oesterreichische Nationalbank (Claudia Kwapil), Banque de France (Hervé Le Bihan), Banque centrale du Luxembourg (Patrick Lünnemann),Banco de Portugal (Fernando Martins), Banca d’Italia (Roberto Sabbatini), Deutsche Bundesbank (Harald Stahl),European Central Bank (Philip Vermeulen), and Bank of Finland (Jouko Vilmunen).
Documentos de Trabajo. N.º 0542
2005
The Working Paper Series seeks to disseminate original research in economics and finance. All papers have been anonymously refereed. By publishing these papers, the Banco de España aims to contribute to economic analysis and, in particular, to knowledge of the Spanish economy and its international environment. The opinions and analyses in the Working Paper Series are the responsibility of the authors and, therefore, do not necessarily coincide with those of the Banco de España or the Eurosystem. The Banco de España disseminates its main reports and most of its publications via the INTERNET at the following website: http://www.bde.es. Reproduction for educational and non-commercial purposes is permitted provided that the source is acknowledged. © BANCO DE ESPAÑA, Madrid, 2005 ISSN: 0213-2710 (print) ISSN: 1579-8666 (on line) Depósito legal: Imprenta del Banco de España

Abstract: This paper presents original evidence on price setting in the euro area at the
individual level. We use micro data on consumer (CPI) and producer (PPI) prices, as
well as survey information. Our main findings are: (i) prices in the euro area are
sticky and more so than in the US; (ii) there is evidence of heterogeneity and of
asymmetries in price setting behaviour; (iii) downward price rigidity is only slightly
more marked than upward price rigidity and (iv) implicit or explicit contracts and
coordination failure theories are important, whereas menu or information costs are
judged much less relevant by firms.
JEL codes: C25, D40, E31.
Keywords: Price setting, Price stickiness, Consumer prices, Producer prices, survey
data.

Non technical summary
This paper brings together original evidence on price setting in the euro area based on
recently available quantitative individual price data underlying official consumer
(CPI) and producer (PPI) price indices, as well as qualitative information from
surveys of firms. The quantitative datasets are particularly well suited for the analysis
of the key features of price setting behaviour, since they have a comprehensive
coverage of retail and manufacturing prices and are made up of a huge number of
price quotes that extend over several years. This contrasts with the bulk of previous
micro-studies, which mostly focused on very specific products or markets, referred to
the United States and analysed consumer prices only. In addition, we use survey
based data that complement the previous ones, given that certain aspects of firms’
pricing polices can only be investigated on the basis of this information. Specifically,
firms’ responses can provide insights into the relative importance of nominal versus
real rigidities or the type of information set used in the revision of prices.
Our main findings on price setting practices at the micro level can be summarised in 9
main stylised facts.
1. Firms in the euro area change their prices infrequently, on average around once a
year. Price durations are significantly longer than in the US.
2. Price adjustment is heterogeneous across sectors. For consumer prices, flexibility
is highest for energy and unprocessed food and lowest for services. For producer
prices, flexibility is highest for energy and food and lowest for capital goods.
3. Price decreases are common, so there is no evidence of strong downward price
rigidity. The service sector is the main exception.
4. When price adjustments occur, they tend to be quite large: the absolute
magnitude is around 8-10 percent in the retail sector and about 5 percent in the
producer sector.
BANCO DE ESPAÑA 9 DOCUMENTO DE TRABAJO N.º 0542

5. The frequency of price changes is affected by macroeconomic conditions (such as
the inflation rate), sectoral conditions (such as the cost structure or the degree of
competition), time factors (like seasonality) and specific shocks (such as VAT
changes, the euro cash changeover, etc.). Survey evidence also supports the
coexistence of firms with time and state dependent pricing strategies.
6. According to surveys, mark-up pricing is the dominant strategy; price setting
according to main competitors’ prices is also relevant.
7. Survey evidence suggests asymmetries in the adjustment of prices in response to
cost versus demand factors. In particular, prices respond more strongly to cost
increases rather than decreases, while they react more to a fall in demand than to a
rise.
8. Surveys show a coexistence of forward and backward looking price setters.
9. Surveys indicate that implicit or explicit contracts and strategic interactions
among competing firms are the main sources of price stickiness. Menu and
information costs theories are judged much less relevant by firms.
BANCO DE ESPAÑA 10 DOCUMENTO DE TRABAJO N.º 0542

1 Introduction A better empirical understanding of individual price setting is crucial for building macro
models of inflation with adequate micro foundations that may help in the design and conduct
of monetary policy.3 Micro founded macro models of inflation are typically based on highly
stylised assumptions on firms pricing behaviour, as in Calvo (1983) and Taylor (1980).
However, implications for inflation dynamics are not invariant to the type of micro price
setting. In addition, the speed of adjustment of inflation to shocks to the economy is directly
linked to the speed of price adjustment of individual agents.
This paper summarises original evidence on price setting in the euro area based on recently
available quantitative individual price data underlying official consumer4 (CPI) and producer5
(PPI) price indices, as well as qualitative information from surveys of firms.6 These empirical
analyses have been produced in the context of the Inflation Persistence Network (IPN), a
large research effort conducted by economists of the Eurosystem. This approach has allowed
to obtain unprecedented evidence for the euro area, based on three types of data sources.7
The first corresponds to micro consumer prices collected by National Statistical Institutes
(NSIs) to construct national CPIs. Available databases contain several millions monthly price
quotes for 10 euro area countries (Austria, Belgium, Finland, France, Germany, Italy,
Luxembourg, the Netherlands, Portugal and Spain). The second source corresponds to
individual producer prices also collected by NSIs to compute PPIs. Databases are available
for 5 euro area countries (Belgium, Germany, Italy, Portugal and Spain). The typical CPI
and PPI quantitative information used is the price trajectory associated to one particular 3 See Angeloni et al. (2005). 4 See Álvarez et al. (2005a), Álvarez and Hernando (2004), Aucremanne and Dhyne
(2004 and 2005), Baudry et al. (2004), Baumgartner, et al. (2005), Dias et al. (2004 and 2005), Fougère et al. (2005), Hoffmann and Kurz-Kim (2005), Jonker et al. (2004), Lünnemann and Mathä (2005a), Veronese et al. (2005),Vilmunen and Laakkonen (2005) and the summary by Dhyne et al. (2005).
5 See Álvarez et al. (2005b), Dias et al. (2004), Dossche (2005), Sabbatini et al. (2004), Stahl (2005a) and the summary by Vermeulen et al. (2005).
6 See Álvarez and Hernando (2005), Aucremanne and Druant (2004), Fabiani et al. (2004), Hoeberichts and Stokman (2004), Kwapil et al. (2005), Loupias and Ricart (2004), Lünnemann and Mathä (2005b), Martins (2005), Stahl (2005b) and the summary by Fabiani et al (2005).
7 CPI evidence for the euro area is based on the analysis of a common basket of 50 product categories observed during the January 1996-January 2001 period. Corresponding figures for the US are based on a similar basket of 50 products when statistical information at the product category level was available [Bils and Klenow (2004)]. PPI and survey evidence are based on more heterogeneous national samples, although results emerge consistently in all the euro area countries analysed.
BANCO DE ESPAÑA 11 DOCUMENTO DE TRABAJO N.º 0542

product sold in one particular outlet (in the case of CPI) or by one specific manufacturing
firm (in the case of PPI). Examples of price trajectories taken from the Belgian CPI and
Italian PPI datasets are given in Figure 1.
Such large datasets are particularly well suited for the analysis of the key features of price
setting behaviour, since they have a comprehensive coverage of retail and manufacturing
prices and are made up of a huge number of price quotes that extend over several years. This
contrasts with the previous micro-studies,8 which mostly focused on very specific products or
markets, referred to the United States and analysed consumer prices only.
Figure 1 - Examples of individual price trajectories Consumer prices Producer prices
Note : Actual examples of price trajectories, from the Belgian CPI and Italian PPI databases [see
Aucremanne and Dhyne (2004) and Sabbatini (2005)]. Prices are in Belgian Francs and Euro, respectively.
The third source of information stems from surveys of firms, following the seminal work by
Blinder et al. (1998). In the surveys, performed by euro area national central banks (NCBs),
more than 11,000 firms from 9 countries (Austria, Belgium, France, Germany, Italy,
Luxembourg, the Netherlands, Portugal and Spain) were questioned about their price-setting
practices. These qualitative data are complementary to the previous ones, since there are
certain aspects of firms’ pricing polices that can only be investigated on the basis of this
information. In particular, firms’ responses can provide insights into the relative importance
of nominal versus real rigidities or the type of information set used in the revision of
prices. Furthermore, survey analysis allows to empirically assess alternative theories on price
8 Cecchetti (1986) for consumer prices and Stigler and Kindhal (1970) and Carlton (1986) for
producer prices are seminal papers in this area. Recently, Bils and Klenow (2004) for the US and Baharad and Eden (2004) for Israel have exploited similar consumer price data to the ones we use.
20
25
30
35
40
01-97 01-98 01-99 01-00 01-01 01-02350
400
450
500
Price of gasoline in Belgium (left axis) Price of a haircut in Belgium (right axis)
100
105
110
115
120
01-97 01-98 01-99 01-00 01-01 01-020.4
0.45
0.5
0.55
0.6
Price of a printer in Italy (left axis) Price of beer in Italy (right axis)
BANCO DE ESPAÑA 12 DOCUMENTO DE TRABAJO N.º 0542

stickiness. Finally, survey results are also useful in cross checking the evidence obtained from
quantitative databases.9
The remaining of the paper is organized as follows. Section 2 presents a set of stylised facts
describing firms’ price setting practices as they can be captured by the available quantitative
data. Section 3 investigates different aspects of price-setting behaviour, dealing with issues
such as time- and state dependency, asymmetries and factors underlying price stickiness.
Finally, section 4 concludes and highlights implications for monetary policy.
2 Firms price setting practices: stylised facts
The following stylised facts emerge consistently in the different euro area countries
investigated:
Fact 1 – Firms change their prices rather infrequently: on average around once a
year.
Table 1 – Measures of price stickiness in the euro area and the US (p.c. per month unless otherwise stated)
Statistics Euro area US CPI1 Frequency 15.1 24.8 Average duration ( months) 13.0 6.7 Median duration ( months) 10.6 4.6 PPI2 Frequency 20.0 n.a Surveys3 Frequency 15.9 20.8 Average duration ( months) 10.8 8.3 NKPC4 Average durations ( months) 13.5-19.2 7.2-8.4 Internet prices5 Frequency 95.5 94.7
1 Dhyne et al. (2005) for the euro area, Bils and Klenow (2004) for the US. Euro area refers to the aggregate of Austria, Belgium, Finland, France, Germany, Italy, Luxembourg, the Netherlands, Portugal and Spain. 2 Vermeulen et al. (2005). Euro area corresponds to the aggregate of Belgium, Germany, Italy, Portugal and Spain. 3 Fabiani et al. (2005) for the euro area and Blinder et al. (1998) for the US. Euro area refers to the aggregate of Austria, Belgium, France, Germany, Italy, Luxembourg, the Netherlands, Portugal and Spain. Converted from original interval grouped figures
4 Gali et al. (2001 and 2003). Estimates correspond to the GDP deflator and are converted from original quarterly figures. 5 Lünnemann and Wintr (2005). Euro area corresponds to the aggregate of Germany, France and Italy and are converted from original daily figures.
9 In this respect, it is worth mentioning that most surveyed firms sell their main product
predominantly to other firms. This means that survey prices are closer to producer prices than to consumer prices.
BANCO DE ESPAÑA 13 DOCUMENTO DE TRABAJO N.º 0542

On average, 15 p.c. of consumer prices (see Table 1) are changed in a given month in the
euro area compared to 25 p.c. in the US [Bils and Klenow (2004)]. Producer prices set in
the euro area seem to be adjusted slightly more frequently than retail prices: around 20 p.c.
of them are changed in a given month. These frequencies imply average price durations
close to one year in the euro area, while the corresponding duration in the US is slightly
above half a year. In addition, survey results show that in the euro area about two-thirds of
firms do not change their prices more than once a year [Fabiani et al. (2005)]. These results
are also consistent with the estimates of New-Keynesian Phillips curves for the euro area
and the US by Gali et al. (2001 and 2003). In contrast, Lünnemann and Wintr (2005) find that
the frequency of price adjustment does not differ substantially between the US and the three
largest euro area countries using Internet prices for a selection of product categories.
Several factors can be put forward to explain the discrepancy in the frequency of consumer
price changes observed between the euro area and the US: (i) differences in the level and
variability of inflation, (ii) in the structure and degree of competition of the distribution
sector, (iii) in the methods followed by National Statistical Institutes to collect elementary
prices, (iv) in the frequency and magnitude of cost and demand shocks, and (v) in the
composition of the consumption basket. Next we briefly report a few facts underlying each of
the above arguments.
First, both the level and the volatility of inflation was somewhat higher in the United States
than in the euro area in the considered sample period (average monthly inflation was,
respectively, 0.21 p.c. and 0.12 p.c. and its standard deviation 0.20 p.c. and 0.16 p.c.) and the
frequency of price adjustment is found to be positively related to inflation and its variability.
Second, small corner shops have a higher market share in euro area countries, while super and
hypermarkets play a more substantial role in the US [Pilat (1997)] and available evidence
suggests that large retailers change their prices more frequently.10 The third factor is also
relevant, particularly as regards the statistical treatment of sales and promotions: in the
samples used, price changes due to sales we not considered in most euro area countries in
contrast with the US. The fourth factor might also play a role, since the analysis of the
frequency of price changes does not control for differences in cost shocks. To the extent
that wage and other input prices are more flexible in the US, this could help explain the
lower frequency of price changes in the euro area. Finally, the difference in the degree of
price stickiness is unlikely to be due to differences in consumption patterns, as the
10 See Baudry et al. (2004), Dias et al. (2004), Jonker et al. (2004) and Veronese et al. (2005).
BANCO DE ESPAÑA 14 DOCUMENTO DE TRABAJO N.º 0542
expenditure share of the more flexible components of the HICP (see Table 2) is larger in the
euro area compared to the US.
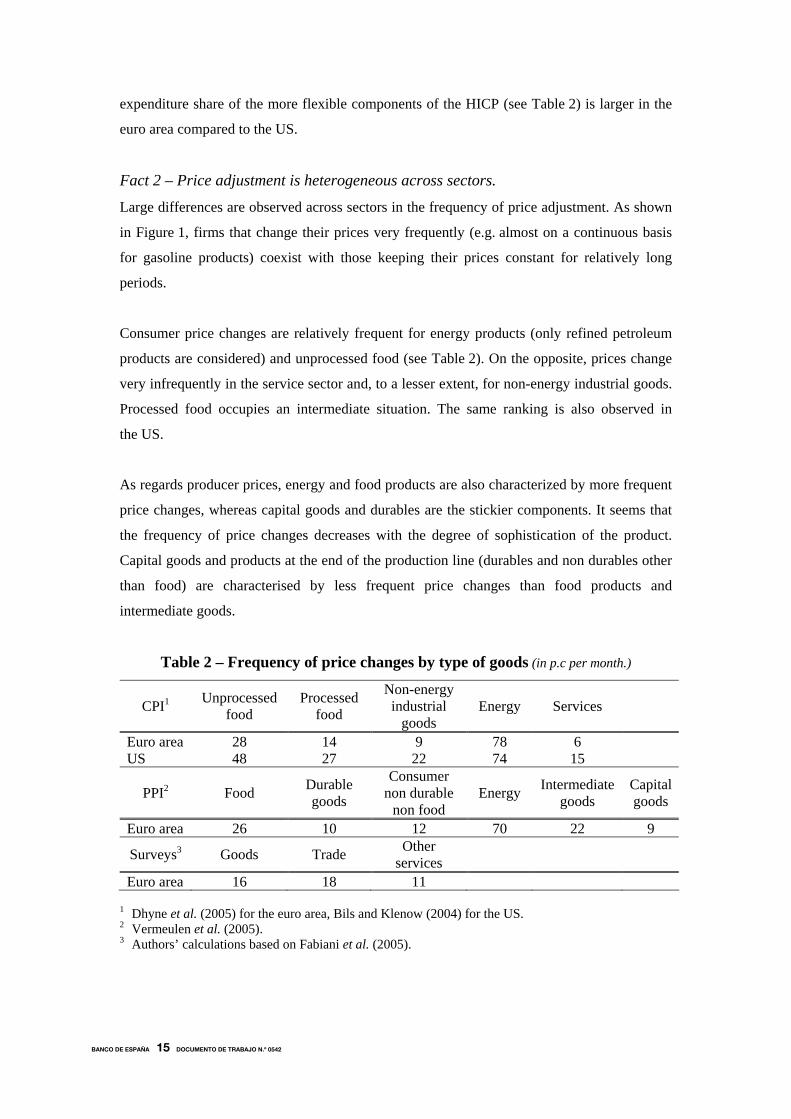
Fact 2 – Price adjustment is heterogeneous across sectors.
Large differences are observed across sectors in the frequency of price adjustment. As shown
in Figure 1, firms that change their prices very frequently (e.g. almost on a continuous basis
for gasoline products) coexist with those keeping their prices constant for relatively long
periods.
Consumer price changes are relatively frequent for energy products (only refined petroleum
products are considered) and unprocessed food (see Table 2). On the opposite, prices change
very infrequently in the service sector and, to a lesser extent, for non-energy industrial goods.
Processed food occupies an intermediate situation. The same ranking is also observed in
the US.
As regards producer prices, energy and food products are also characterized by more frequent
price changes, whereas capital goods and durables are the stickier components. It seems that
the frequency of price changes decreases with the degree of sophistication of the product.
Capital goods and products at the end of the production line (durables and non durables other
than food) are characterised by less frequent price changes than food products and
intermediate goods.
Table 2 – Frequency of price changes by type of goods (in p.c per month.)
CPI1 Unprocessed food
Processed food
Non-energy industrial
goods Energy Services
Euro area 28 14 9 78 6 US 48 27 22 74 15
PPI2 Food Durable goods
Consumer non durable
non food Energy Intermediate
goods Capital goods
Euro area 26 10 12 70 22 9
Surveys3 Goods Trade Other services
Euro area 16 18 11
1 Dhyne et al. (2005) for the euro area, Bils and Klenow (2004) for the US. 2 Vermeulen et al. (2005). 3 Authors’ calculations based on Fabiani et al. (2005).
BANCO DE ESPAÑA 15 DOCUMENTO DE TRABAJO N.º 0542

Finally, survey evidence points out that prices of services other than trade are stickier than
those for manufacturing goods and trade. Within trade, prices of food and energy change
more frequently than for other goods or services, in line with CPI evidence .11
Heterogeneity in the degree of consumer price flexibility is found by Hoffmann and
Kurz-Kim (2005) to be related to the volatility of the respective input prices (wages,
producer and import prices). In line with this result, Álvarez et al. (2005b), Álvarez and
Hernando (2005) and Sabbatini et al. (2005) document that differences in the cost structure
across sectors help explain differences in the degree of price flexibility. Specifically, it is
found that labour intensity negatively affects the frequency of price adjustments, given
that wages are typically changed once a year, whereas the share of intermediate goods
(e.g. energy) in overall inputs affects it positively. Survey evidence in Álvarez and
Hernando (2005) also shows that sectors in which the perceived degree of competition is high
feature less sticky prices (See Section 3 below). Similarly, Lünnemann and Mathä (2005a)
report that the larger the number of competitors a supermarket has the higher the frequency of
price adjustment, whereas a larger market share reduces the frequency of price reductions.
Fact 3 – Price decreases are common
Price changes occur infrequently in the euro area but this is not due to generalised
downward nominal rigidities (see Table 3). As regards micro CPI data, around 40 p.c. of the
price changes observed in a given month are price decreases and a share of 45 p.c. of price
decreases is found with micro PPI data. This somewhat surprising fact is in line with
the evidence obtained by Klenow and Kryvstov (2005) for the US and characterises all euro
area countries. The higher price stickiness observed in the euro area compared to the US is,
therefore, not the result of an excess of downward nominal price rigidity.
Nevertheless, it has to be pointed that although there is not general evidence in favour of
downward price rigidity, large sectoral discrepancies are again observed. Particularly,
price decreases are relatively uncommon in the service sector, where only 1 price change out
of 5 is a price reduction [Dhyne et al. (2005)]. This may reflect that variable costs for
services are rarely reduced, reflecting the intensive use of labour in services and the fact that
wages do not go down frequently.
11 See Álvarez and Hernando (2005).
BANCO DE ESPAÑA 16 DOCUMENTO DE TRABAJO N.º 0542
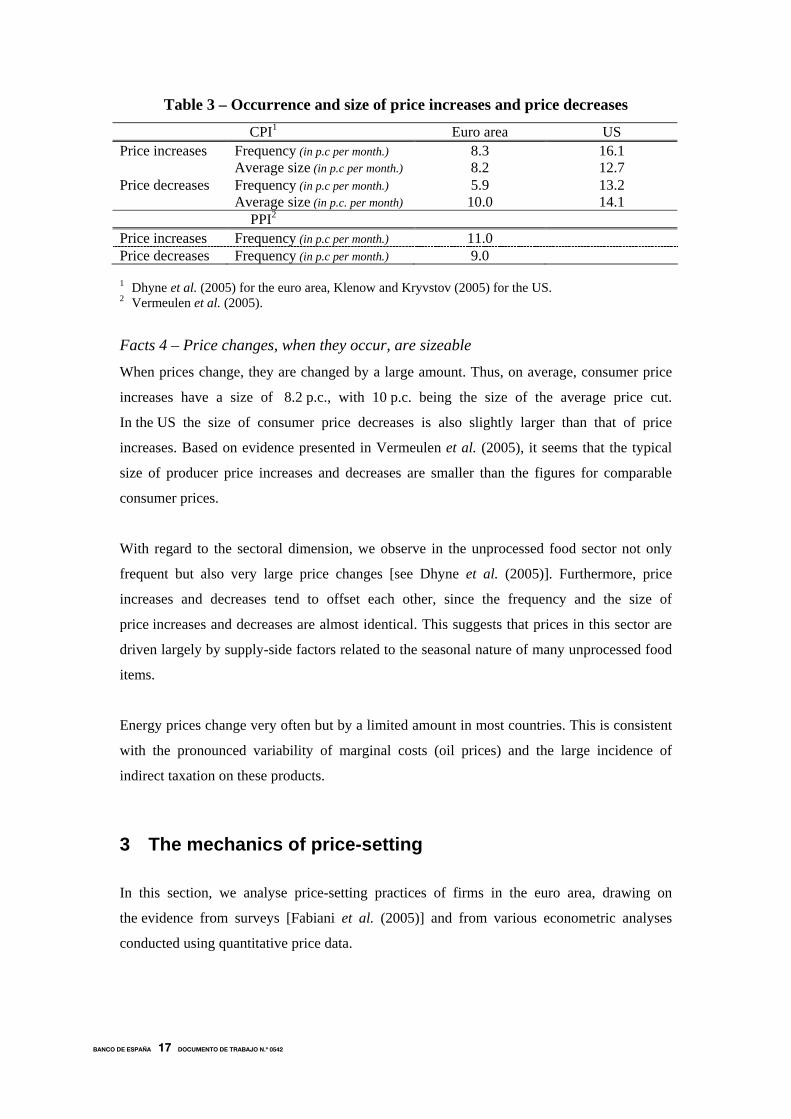
Table 3 – Occurrence and size of price increases and price decreases
CPI1 Euro area US Price increases Frequency (in p.c per month.) 8.3 16.1 Average size (in p.c per month.) 8.2 12.7 Price decreases Frequency (in p.c per month.) 5.9 13.2 Average size (in p.c. per month) 10.0 14.1
PPI2 Price increases Frequency (in p.c per month.) 11.0 Price decreases Frequency (in p.c per month.) 9.0
1 Dhyne et al. (2005) for the euro area, Klenow and Kryvstov (2005) for the US. 2 Vermeulen et al. (2005).
Facts 4 – Price changes, when they occur, are sizeable
When prices change, they are changed by a large amount. Thus, on average, consumer price
increases have a size of 8.2 p.c., with 10 p.c. being the size of the average price cut.
In the US the size of consumer price decreases is also slightly larger than that of price
increases. Based on evidence presented in Vermeulen et al. (2005), it seems that the typical
size of producer price increases and decreases are smaller than the figures for comparable
consumer prices.
With regard to the sectoral dimension, we observe in the unprocessed food sector not only
frequent but also very large price changes [see Dhyne et al. (2005)]. Furthermore, price
increases and decreases tend to offset each other, since the frequency and the size of
price increases and decreases are almost identical. This suggests that prices in this sector are
driven largely by supply-side factors related to the seasonal nature of many unprocessed food
items.
Energy prices change very often but by a limited amount in most countries. This is consistent
with the pronounced variability of marginal costs (oil prices) and the large incidence of
indirect taxation on these products.
3 The mechanics of price-setting
In this section, we analyse price-setting practices of firms in the euro area, drawing on
the evidence from surveys [Fabiani et al. (2005)] and from various econometric analyses
conducted using quantitative price data.
BANCO DE ESPAÑA 17 DOCUMENTO DE TRABAJO N.º 0542

3.1 Competition and price-setting rules
The degree of market competition is a key factor in firms’ pricing strategies. In a market with
perfect competition, prices are set at a unique market clearing level, which equals marginal
costs and there are no mark-ups. Thus, price rigidities after shocks do not arise. Price
stickiness is thus only possible in the presence of some departure from perfect competition.
Under the New-Keynesian sticky price models framework, firms are assumed to operate in
monopolistic markets. Survey results show that, even though the majority of firms seem to
operate in a highly competitive environment, most of them still possess some degree of
price-setting autonomy. Indeed, as shown in Table 4, mark-up pricing is the dominant pricing
rule identified in the euro area: Fabiani et al. (2005) find that, using GDP weights, 54 p.c. of
euro area firms report to follow such a rule. Furthermore, as expected, the use of mark-up
pricing increases as the perceived level of competition goes down.
In addition, survey results show that firms facing strong competitive pressures –proxied by
the importance they attached to competitors’ price changes– tend to adjust their prices more
frequently.12
Table 4 - Survey evidence on price setting (mean scores, unless otherwise stated)
Use of price setting rules (percentages) Markup 54 Competitors' price 27 Other 18 Importance of factors driving price increases Importance of factors driving price decreases Costs of raw materials 3.0 Costs of raw materials 2.5 Labour costs 3.0 Labour costs 2.1 Competitors' price 2.4 Competitors' price 2.8 Demand 2.2 Demand 2.5 Financial costs 2.2 Financial costs 1.9 Source: Fabiani et al. (2005) Note: Mean scores correspond to a scale from 1 (not important) to 4 (very important)
12 Other measures, such as the number of competitors in the main market or the market share, were also analysed but they were considered as poor indicators of how firms’ behaviour is affected by the degree of competition.
BANCO DE ESPAÑA 18 DOCUMENTO DE TRABAJO N.º 0542
3.2 Asymmetries in price reaction to shocks
There is some empirical evidence that price responses are sensitive to the nature and direction
of shocks hitting the economy.13 Survey analysis provides evidence not only on the relative
importance of various factors driving price changes and whether there are asymmetries in
price reactions to the direction of shocks but also on the speed of price responses to different
types of shocks. Regarding the former, cost shocks are more relevant in driving prices
upwards than downwards, while changes in market conditions (in demand and competitors’
prices) matter more for price decreases. Fabiani et al. (2005) provide evidence that labour and
raw materials costs are the most important factors driving prices upward (see Table 4), while
these factors rank fourth and second in explaining price decreases. With regard to market
conditions, the surveys show that the competitor’s price is the most important factor
explaining price decreases, while it ranks third among the explanations for price increases.
In addition, firms in highly competitive markets are more likely to respond to shocks, in
particular to those affecting demand.
As to the time dimension of price responses, Fabiani et al. (2005) conclude that the time lag
of the median firm for a price reaction after a shock lies between 1 and 3 months. This is
broadly in line with a mean lag of around 3 months reported by Blinder et al. (1998) for
the US. Furthermore, on the basis of information coming from the mean lag of a price
reaction to four different types of shocks (cost and demand shocks, both positive and
negative), Blinder et al. (1998) conclude that there is no evidence that prices (i) adjust faster
upward than downward, and (ii) respond more rapidly to cost shocks than to demand shocks.
The findings in the euro area are in line with those obtained for the US.
3.3 Time-dependent versus state-dependent price reviewing
In the theoretical literature time-dependent and state-dependent rules are considered for
modelling price-setting behaviour.14 In the presence of shocks, time-dependent rules might
lead to stickier prices than state-dependent ones.
13 For instance, Peltzman (2000) shows that prices respond asymmetrically to positive and negative cost changes. 14 Under time-dependent rules, prices are reviewed at discrete time intervals, which are independent of the state of the economy and can be either fixed as in Taylor (1980) or stochastic as in Calvo (1983). As opposed to time-dependent rules, in state-dependent rules the timing of price reviews is endogenous and firms decide to review their prices only when there is a sufficiently large shift in market conditions, as in Sheshinski and Weiss (1977) or Dotsey, King and Wolman (1999).
BANCO DE ESPAÑA 19 DOCUMENTO DE TRABAJO N.º 0542
When looking at the micro price datasets there are several indications for the presence of both
rules, although it is difficult to clearly distinguish between the two. In all countries, there is
clear evidence that prices exhibit a seasonal pattern: prices are more likely to be changed in
the first quarter, especially in January, or after the summer, especially in September.
However, this pattern itself does not discriminate between rules, as the observed behaviour
could reflect changes in costs or in demand, which are subject to seasonal patterns as well, or
be related to time-dependent behaviour of price setters. This is also corroborated by the
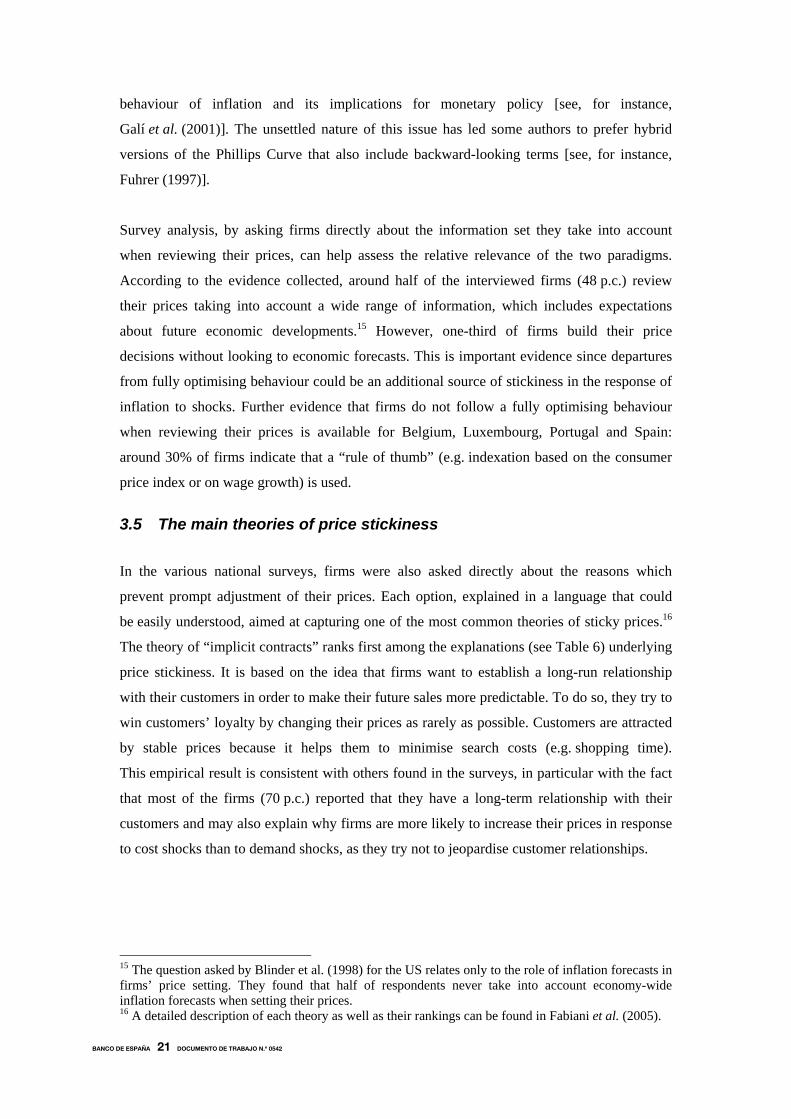
evidence coming from survey analysis, where firms were directly asked whether their
prices are predominantly reviewed at a well-defined frequency or in response to market
conditions. The results show that firms in the euro area apply both time and state dependent
rules (see Table 5): around one-third of them follow pure time-dependent rules whereas the
remaining two-thirds use pricing rules with some elements of state-dependency. Among
this last group of firms those applying a mixed strategy, i.e. that follow time-dependent rules
but switch to state-dependent ones in the event of specific circumstances, are predominant
(46 p.c. of total firms). These findings are in line with those obtained by Blinder et al. (1998)
that report that in the United States the share of firms following time-dependent rules
is 40 p.c.
Additional evidence supporting the use of state-dependent pricing strategies comes from
quantitative data on consumer and producer prices. For instance, Dhyne et al. (2005) report
that the frequency of price adjustment or the probability of price change is generally found to
be influenced by sectoral or aggregate price or wage developments. It is also systematically
found to be affected by changes in indirect taxation and the euro-cash changeover.
Table 5 - Survey evidence on price reviewing (percentages)
Price reviewing rules Information set used in price reviews Time-dependent 34 Rule of thumb n.a. State-dependent 20 Past and present 34 Both 46 Present and future 48 Past, present and future n.a. Source: Fabiani et al. (2005)
3.4 The role of information in pricing behaviour
One unresolved issue in macroeconomic theory is whether inflation should be
modelled primarily as a backward-looking variable, as in the so-called traditional
expectations-augmented Philips Curve, or as a forward-looking variable, as in New
Keynesian Philips Curve (NKPC). In this debate, the main point lies in the short run
BANCO DE ESPAÑA 20 DOCUMENTO DE TRABAJO N.º 0542
behaviour of inflation and its implications for monetary policy [see, for instance,
Galí et al. (2001)]. The unsettled nature of this issue has led some authors to prefer hybrid
versions of the Phillips Curve that also include backward-looking terms [see, for instance,
Fuhrer (1997)].
Survey analysis, by asking firms directly about the information set they take into account
when reviewing their prices, can help assess the relative relevance of the two paradigms.
According to the evidence collected, around half of the interviewed firms (48 p.c.) review
their prices taking into account a wide range of information, which includes expectations
about future economic developments.15 However, one-third of firms build their price
decisions without looking to economic forecasts. This is important evidence since departures
from fully optimising behaviour could be an additional source of stickiness in the response of
inflation to shocks. Further evidence that firms do not follow a fully optimising behaviour
when reviewing their prices is available for Belgium, Luxembourg, Portugal and Spain:
around 30% of firms indicate that a “rule of thumb” (e.g. indexation based on the consumer
price index or on wage growth) is used.
3.5 The main theories of price stickiness
In the various national surveys, firms were also asked directly about the reasons which
prevent prompt adjustment of their prices. Each option, explained in a language that could
be easily understood, aimed at capturing one of the most common theories of sticky prices.16
The theory of “implicit contracts” ranks first among the explanations (see Table 6) underlying
price stickiness. It is based on the idea that firms want to establish a long-run relationship
with their customers in order to make their future sales more predictable. To do so, they try to
win customers’ loyalty by changing their prices as rarely as possible. Customers are attracted
by stable prices because it helps them to minimise search costs (e.g. shopping time).
This empirical result is consistent with others found in the surveys, in particular with the fact
that most of the firms (70 p.c.) reported that they have a long-term relationship with their
customers and may also explain why firms are more likely to increase their prices in response
to cost shocks than to demand shocks, as they try not to jeopardise customer relationships.
15 The question asked by Blinder et al. (1998) for the US relates only to the role of inflation forecasts in firms’ price setting. They found that half of respondents never take into account economy-wide inflation forecasts when setting their prices. 16 A detailed description of each theory as well as their rankings can be found in Fabiani et al. (2005).
BANCO DE ESPAÑA 21 DOCUMENTO DE TRABAJO N.º 0542

Table 6 – Theories of price stickiness
Euro area (mean score)
US (ranking)
Implicit contracts 2.7 4 Explicit contracts 2.6 5 Cost-based pricing 2.6 2 Co-ordination failure 2.4 1 Judging quality by price 2.1 12 Temporary shocks 2.0 Change non-price factors 1.7 3 Menu costs 1.6 6 Costly information 1.6 Pricing thresholds 1.6 8
Sources: Euro area: Fabiani et al. (2005). US: Blinder et al. (1998)
Other explanations underlying price stickiness considered as important by the interviewed
firms were explicit contracts which are costly to renegotiate, marginal costs that vary too little
when costs are an important determinant in firms’ pricing decisions (cost-based pricing) and
coordination failure problems arising from the preference of firms not to change prices unless
their competitors do so. In contrast, alternative explanations of price stickiness such as
menu costs, pricing thresholds and costly information were not considered very relevant
by respondents. These results are in line with previous studies [Apel et al. (2005), Amirault
et al. (2005), Blinder et al. (1998) and Hall et al. (1997)]. However, it is interesting to note
that the existence of implicit or explicit contracts as a source of price stickiness is considered
somewhat less important in the US [Blinder et al. (1998)] than in the euro area. This could
also partly explain the higher frequency of price changes observed in the US.
Finally, it is worth noting that price adjustment takes place in two steps, namely a price
review and a price change. The four theories indicated by firms as the main explanations
underlying price stickiness concern the second stage of price setting, suggesting that the main
impediments for more frequent price adjustments lie at the stage in which firms consider the
possibility of changing the price, without necessarily taking any action. Indeed, the theory of
“costly information”, namely the costs associated with the gathering and processing
information for pricing decisions at the first stage of price adjustment, received the lowest
score in the euro area surveys.
4 Conclusions The research summarized in this paper has produced numerous new empirical results on the
characteristics and determinants of price-setting in the euro area. Three of the most noticeable
are the following. First, prices in the euro area are sticky and considerably than in the US.
BANCO DE ESPAÑA 22 DOCUMENTO DE TRABAJO N.º 0542
Second, there is no apparent general downward price rigidity: around 40 p.c. of price changes
are decreases, although there exist important sectoral differences (in particular in services this
share is around 20 p.c.). Third, price-setting in practice cannot be easily reconciled with one
simple model given the evidence of heterogeneity and of asymmetries. As regards the factors
driving price stickiness, the relevance of some theoretical explanations is confirmed by survey
analyses (explicit contracts, marginal costs and coordination failure); others, instead, are
judged much less relevant by firms (menu costs, pricing thresholds and costly information). Regarding monetary policy, the first finding has two implications. On the one hand, a longer
duration of price spells is expected to reduce the impact of adverse shocks on inflation. On the
other hand, assuming a positive relationship between price rigidity and inflation persistence, a
given deviation of inflation from target requires a stronger reaction of monetary policy to
stabilize inflation under sticky prices than under flexible prices. The second finding suggests
that the Eurosystem can in the long run pursue a low inflation target without impeding real
price adjustments. The implications of the third finding are likely to be more involved, which
suggests that studying optimal monetary policy under asymmetry and heterogeneity is an
important research avenue.
BANCO DE ESPAÑA 23 DOCUMENTO DE TRABAJO N.º 0542
References
ÁLVAREZ, L. J., P. BURRIEL and I. HERNANDO (2005a). Do Decreasing Hazard Functions Make Sense?, ECB Working Paper Series n.º 461.
–– (2005b). Price-setting behaviour in Spain: evidence from micro PPI data, ECB Working Paper Series n.º 522
ÁLVAREZ, L. J., and I. HERNANDO (2004). Price Setting Behaviour in Spain. Stylised Facts Using Consumer Price Micro Data, ECB Working Paper Series n.º 416.
–– (2005). The price setting behaviour of Spanish firms: evidence from survey data, ECB Working Paper Series n.º 538.
AMIRAULT, D., C. KWAN and G. WILKINSON (2004). A survey of the price-setting behaviour of Canadian companies, Bank of Canada Review, Winter 2004-2005, pp. 29-39.
ANGELONI, I., L. AUCREMANNE, M. EHRMANN, J. GALÍ, A. Y. LEVIN and F. SMETS (2005). “New evidence on inflation persistente and price stickiness in the euro area: implications for macro models and policy”, Paper presented at the 20th Congress of the European Economic Association.
APEL, M., R. FRIBERG and K. HALLSTEN (2005). “Micro foundations of macroeconomic price adjustment: survey evidence from Swedish firms”, Journal of Money, Credit, and Banking, 37 (2), pp. 313-338.
AUCREMANNE, L., and E. DHYNE (2004). How Frequently Do Prices Change? Evidence Based on the Micro Data Underlying the Belgian CPI, ECB Working Paper Series n.º 331.
–– (2005). Time-dependent versus State-dependent Pricing: A Panel Data Approach to the Determinants of Belgian Consumer Price Changes, ECB Working Paper Series n.º 462.
BAHARAD, E., and B. EDEN (2004). "Price Rigidity and Price Dispersion: Evidence from Micro Data", Review of Economic Dynamics, 7, pp. 613-641.
BAUDRY, L., H. LE BIHAN, P. SEVESTRE and S. TARRIEU (2004). Price Rigidity-Evidence from French CPI micro-data, ECB Working Papers Series n.º 384.
BAUMGARTNER, J., E. GLATZER, F. RUMLER and A. STIGLBAUER (2005). How Frequently Do Consumer Prices Change in Austria? Evidence from Micro CPI Data, mimeo, Oesterreichische Nationalbank.
BILS, M., and P. KLENOW (2004). “Some evidence on the importance os sticky prices”, Journal of Political Economy, 112, pp. 947-985.
BLINDER, A. S., E. CANETTI, D. E. LEBOW and J. B. RUDD (1998). Asking about prices: a new approach to understanding price stickiness, Russell Sage Foundation, New York.
CALVO, G. (1983). “Staggered Prices in a Utility Maximizing Framework”, Journal of Monetary Economics, Vol. 12, pp. 383-398.
CARLTON, D. (1986). “The rigidity of prices”, American Economic Review, 76, pp. 637-658.
CECCHETTI, S. (1986). “The frequency of price adjustment: a study of the newsstand prices of magazines”, Journal of Econometrics, 31, pp. 255-274.
BANCO DE ESPAÑA 24 DOCUMENTO DE TRABAJO N.º 0542

DHYNE, E., L. J. ÁLVAREZ, H. LE BIHAN, G. VERONESE, D. DIAS, J. HOFFMAN, N. JONKER, P. LÜNNEMANN, F. RUMLER and J. VILMUNEN (2005). Price setting in the euro area: some stylised facts from individual consumer price data, ECB Working Paper n° 524.
DIAS, M., D. DIAS and P. NEVES (2004). Stylised Features of Price Setting Behaviour in Portugal: 1992-2001, ECB Working Paper Series n.º 332.
DIAS, D., C. ROBALO MARQUÉS and J. M. C. SANTOS SILVA (2005). Time or State Dependent Price Setting Rules? Evidence from Portuguese micro data, mimeo, Banco de Portugal.
DOSSCHE, M. (2005). The Patterns of Price Setting in the Belgian Manufacturing Industry, mimeo, National Bank of Belgium.
DOTSEY, M., R. KING and A. WOLMAN (1999). “State-dependent pricing and the general equilibrium dynamics of money and output”, Quarterly Journal of Economics, Vol. 114, pp. 655-690.
FABIANI, S., M. DRUANT, I. HERNANDO, C. KWAPIL, B. LANDAU, C. LOUPIAS, F. MARTINS, T. MATHÄ, R. SABBATINI, and A. STOKMAN (2005). The pricing behaviour of firms in the Euro Area: new survey evidence, forthcoming ECB Working Paper.
FABIANI, S., A. GATTULLI and R. SABBATINI (2004). The pricing behaviour of Italian firms: new survey evidence on price stickiness, ECB Working Paper n.º 333.
FOUGÈRE, D., H. LE BIHAN and P. SEVESTRE (2005). Heterogeneity in Price Stickiness: a Microeconometric Investigation, forthcoming ECB Working Paper.
FUHRER, J. C. (1997). “The (Un)importance of Forward Looking Behavior in Price Specifications”, Journal of Money, Credit, and Banking, 29 (3), pp. 338-350.
GALÍ, J., M. GERTLER and D. LÓPEZ-SALIDO (2001).“European inflation dynamics”, European Economic Review, Vol. 45, pp. 1237-1270.
–– (2003). "Erratum to European Inflation Dynamics [European Economic Review, 45 (2001), pp. 1237-1270]", European Economic Review, 47 (4), pp. 759-760.
HALL, S., M. WALSH and A. YATES (2000). “Are UK companies' prices sticky?”, Oxford Economic Papers, Vol. 52, pp. 425-446.
HOEBERICHTS, M., and A. STOKMAN (2005). Pricing behaviour of Dutch companies: main results from a survey, mimeo, De Nederlandsche Bank.
HOFFMANN, J., and J.-R. KURZ-KIM (2005). Consumer price adjustment under the microscope: Germany in a period of low inflation, mimeo, Deutsche Bundesbank.
JONKER, N., H. BLIJENBERG and C. FOLKERTSMA (2004). Empirical analysis of price setting behaviour in the Netherlands in the period 1998-2003 using micro data, ECB Working Paper n.º 413.
KLENOW, P., and O. KRYVTSOV (2005). State-Dependent or Time-Dependent Pricing: Does it Matter for Recent U.S. Inflation?, mimeo.
KWAPIL, C., J. BAUMGARTNER and J. SCHARLER (2005). The price-setting behavior of Austrian firms: some survey evidence, ECB Working Paper n.º 464.
LOUPIAS, C., and R. RICART (2004). Price setting in France: new evidence from survey data, ECB Working Paper n.º 423.
LÜNNEMANN, P., and T. MATHÄ (2005a). Consumer Price Behaviour in Luxembourg: Evidence From Micro CPI data, forthcoming ECB Working Paper.
BANCO DE ESPAÑA 25 DOCUMENTO DE TRABAJO N.º 0542

–– (2005b). New survey evidence on the pricing behaviour of Luxembourg firms, mimeo, Banque Centrale du Luxembourg.
LÜNNEMANN, P., and L. WINTR (2005). Are Internet Prices Sticky?, mimeo.
MARTINS, F. (2004). The price setting behaviour of Portuguese firms: evidence from survey data, mimeo, Banco de Portugal.
PELTZMAN, S. (2000). “Prices rise faster than they fall”, Journal of Political Economy, Vol. 108, n.º 3, pp. 466-502.
PILAT, D. (1997). Regulation and Performance in the Distribution Sector, OECD Economics Department Working Paper n.º 180.
SABBATINI, R., S. FABIANI, A. GATULLI and G. VERONESE, (2005). Producer price behaviour in Italy: Evidence from micro PPI data, mimeo, Banca d'Italia.
SHESHINSKI, E. S., and Y. WEISS (1977). “Inflation and Costs of Price Adjustment”, Review of Economic Studies, Vol. 44, pp. 287-303.
STAHL, H. (2005a). Producer Price Adjustment at the Micro Level: Evidence from Individual Price Records Underlying the German PPI, mimeo, Deutsche Bundesbank.
–– (2005b). Price setting in German Manufacturing: New Evidence from New Survey Data, mimeo, Deutsche Bundesbank.
STIGLER, G., and J. KINDHAL (1970). The Behavior of Industrial Prices, NBER General Series, n.º 90, New York: Columbia University Press.
TAYLOR, J. B. (1999). “Staggered price and wage setting in macroeconomics”, J. B. Taylor and M. Woodford (eds.), Handbook of Macroeconomics, vol. I, chapter 15.
–– (1980). “Aggregate Dynamics and Staggered Contracts”, Journal of Political Economy, Vol. 88 (1), pp. 1-23.
VERMEULEN, P. et al. (2005). Price setting in the euro area: some stylised facts from individual producer price and survey data, mimeo, ECB.
VERONESE, G., S. FABIANI, A. GATTULLI and R. SABBATINI (2005). Consumer Price Behaviour In Italy: Evidence From Micro CPI Data, ECB Working Paper n.º 449.
VILMUNEN, J., and H. LAAKKONEN (2005). How Often Do Prices Change in Finland? Evidence from Micro CPI Data, mimeo, Suomen Pankki.
BANCO DE ESPAÑA 26 DOCUMENTO DE TRABAJO N.º 0542

BANCO DE ESPAÑA PUBLICATIONS
WORKING PAPERS1
0501 ÓSCAR J. ARCE: The fiscal theory of the price level: a narrow theory for non-fiat money.
0502 ROBERT-PAUL BERBEN, ALBERTO LOCARNO, JULIAN MORGAN AND JAVIER VALLÉS: Cross-country
differences in monetary policy transmission.
0503 ÁNGEL ESTRADA AND J. DAVID LÓPEZ-SALIDO: Sectoral mark-up dynamics in Spain.
0504 FRANCISCO ALONSO, ROBERTO BLANCO AND GONZALO RUBIO: Testing the forecasting performance of
Ibex 35 option-implied risk-neutral densities.
0505 ALICIA GARCÍA-HERRERO AND ÁLVARO ORTIZ: The role of global risk aversion in explaining Latin American
sovereign spreads.
0506 ALFREDO MARTÍN, JESÚS SAURINA AND VICENTE SALAS: Interest rate dispersion in deposit and loan
markets.
0507 MÁXIMO CAMACHO AND GABRIEL PÉREZ-QUIRÓS: Jump-and-rest effect of U.S. business cycles.
0508 LUIS J. ÁLVAREZ, PABLO BURRIEL AND IGNACIO HERNANDO: Do decreasing hazard functions for price
changes make any sense?
0509 ÁNGEL DE LA FUENTE AND JUAN F. JIMENO: The private and fiscal returns to schooling and the effect of
public policies on private incentives to invest in education: a general framework and some results for the EU.
0510 JUAN J. DOLADO, MARCEL JANSEN AND JUAN F. JIMENO: Dual employment protection legislation: a
framework for analysis.
0511 ANA DEL RÍO AND GARRY YOUNG: The determinants of unsecured borrowing: evidence from the British
household panel survey.
0512 ANA DEL RÍO AND GARRY YOUNG: The impact of unsecured debt on financial distress among British
households.
0513 ADELA LUQUE: Skill mix and technology in Spain: evidence from firm-level data.
0514 J. DAVID LÓPEZ-SALIDO, FERNANDO RESTOY AND JAVIER VALLÉS: Inflation differentials in EMU: The
Spanish case.
0515 ISAAC ALFON, ISABEL ARGIMÓN AND PATRICIA BASCUÑANA-AMBRÓS: How individual capital requirements
affect capital ratios in UK banks and building societies.
0516 JOSÉ MANUEL CAMPA AND IGNACIO HERNANDO: M&As performance in the European financial industry.
0517 ALICIA GARCÍA-HERRERO AND DANIEL SANTABÁRBARA: Does China have an impact on foreign direct
investment to Latin America?
0518 MAXIMO CAMACHO, GABRIEL PEREZ-QUIROS AND LORENA SAIZ: Do European business cycles look like
one?
0519 DANIEL PÉREZ, VICENTE SALAS-FUMÁS AND JESÚS SAURINA: Banking integration in Europe.
0520 JORDI GALÍ, MARK GERTLER AND J. DAVID LÓPEZ-SALIDO: Robustness of the estimates of the hybrid New
Keynesian Phillips curve.
0521 JAVIER ANDRÉS, J. DAVID LÓPEZ-SALIDO AND EDWARD NELSON: Sticky-price models and the natural rate
hypothesis.
0522 OLYMPIA BOVER: Wealth effects on consumption: microeconometric estimates from the Spanish survey of
household finances. 0523 ENRIQUE ALBEROLA, LUIS MOLINA AND DANIEL NAVIA: Say you fix, enjoy and relax: the deleterious effect of
peg announcements on fiscal discipline.
0524 AGUSTÍN MARAVALL: An application of the TRAMO SEATS automatic procedure; direct versus indirect
adjustment.
0525 ALICIA GARCÍA-HERRERO AND MARÍA SOLEDAD MARTÍNEZ-PERÍA: The mix of international banks’ foreign
claims: determinants and implications for financial stability.
0526 J. IGNACIO GARCÍA-PÉREZ AND JUAN F. JIMENO: Public sector wage gaps in Spanish regions.
0527 LUIS J. ÁLVAREZ, PABLO BURRIEL AND IGNACIO HERNANDO: Price setting behaviour in Spain: evidence
from micro PPI data.
1. Previously published Working Papers are listed in the Banco de España publications calalogue.
0528 EMMANUEL DHYNE, LUIS J. ÁLVAREZ, HERVÉ LE BIHAN, GIOVANNI VERONESE, DANIEL DIAS, JOHANNES
HOFFMANN, NICOLE JONKER, PATRICK LÜNNEMANN, FABIO RUMLER AND JOUKO VILMUNEN: Price
setting in the euro area: some stylized facts from individual consumer price data.
0529 TERESA SASTRE AND JOSÉ LUIS FERNÁNDEZ-SÁNCHEZ: Un modelo empírico de las decisiones de gasto de
las familias españolas.
0530 ALFREDO MARTÍN-OLIVER, VICENTE SALAS-FUMÁS AND JESÚS SAURINA: A test of the law of one price in
retail banking.
0531 GABRIEL JIMÉNEZ AND JESÚS SAURINA: Credit cycles, credit risk, and prudential regulation.
0532 BEATRIZ DE-BLAS-PÉREZ: Exchange rate dynamics in economies with portfolio rigidities.
0533 ÓSCAR J. ARCE: Reflections on fiscalist divergent price-paths.
0534 M.ª DE LOS LLANOS MATEA AND MIGUEL PÉREZ: Diferencias en la evolución de los precios de los alimentos
frescos por tipo de establecimiento.
0535 JOSÉ MANUEL MARQUÉS, FERNANDO NIETO AND ANA DEL RÍO: Una aproximación a los determinantes de
la financiación de las sociedades no financieras en España.
0536 S. FABIANI, M. DRUANT, I. HERNANDO, C. KWAPIL, B. LANDAU, C. LOUPIAS, F. MARTINS, T. MATHÄ,
R. SABBATINI, H. STAHL AND A. STOKMAN: The pricing behaviour of firms in the euro area: new survey
evidence.
0537 LUIS J. ÁLVAREZ AND I. HERNANDO: The price setting behaviour of Spanish firms: evidence from survey data.
0538 JOSÉ MANUEL CAMPA, LINDA S. GOLDBERG AND JOSÉ M. GONZÁLEZ-MÍNGUEZ: Exchange-rate
pass-through to import prices in the euro area.
0539 RAQUEL LAGO-GONZÁLEZ AND VICENTE SALAS-FUMÁS: Market power and bank interest rate adjustments.
0540 FERNANDO RESTOY AND ROSA RODRÍGUEZ: Can fundamentals explain cross-country correlations of asset
returns?
0541 FRANCISCO ALONSO AND ROBERTO BLANCO: Is the volatility of the EONIA transmitted to longer-term euro
money market interest rates?
0542 LUIS J. ÁLVAREZ, EMMANUEL DHYNE, MARCO M. HOEBERICHTS, CLAUDIA KWAPIL, HERVÉ LE BIHAN,
PATRICK LÜNNEMANN, FERNANDO MARTINS, ROBERTO SABBATINI, HARALD STAHL, PHILIP VERMEULEN
AND JOUKO VILMUNEN: Sticky prices in the euro area: a summary of new micro evidence.
Unidad de Publicaciones Alcalá, 522; 28027 Madrid
Telephone +34 91 338 6363. Fax +34 91 338 6488 e-mail: [email protected]
www.bde.es