LTO International comparison of producer prices for milk 2016
18
LTO International comparison of producer prices for milk 2016 prezzi di latte • melkprijzen • prix du lait • molkeprizen milch preise • milk prices • maelke priser • maidon hinnat
Transcript of LTO International comparison of producer prices for milk 2016

LTO International comparisonof producer prices for milk
2016
prezzi di latte • melkprijzen • prix du lait • molkeprizenmilch preise • milk prices • maelke priser • maidon hinnat

COLOPHON
Publisher
LTO Nederland Vakgroep Melkveehouderij Bezuidenhoutseweg 225 2594 AL Den Haag The Netherlands www.lto.nl
June 2017 In co-operation with
European Dairy Farmers Grüner Kamp 19-21 24768 Rendsburg Germany telephone (+ 49) 4331 4360190 e-mail [email protected] www.dairyfarmer.net
Carried out by ZuivelNL
P.O. Box 93453 2509 AL Den Haag The Netherlands telephone (+31) 70 2191600 e-mail [email protected] www.zuivelnl.org
Download
The report can be downloaded at www.milkprices.nl (in English and in Dutch)
© Copying the text is authorized subject to acknowledgement of source as follows: LTO International Milk Price Comparison, www.milkprices.nl

LTO International Milk Price Comparison 2016 2
Table of contents Foreword . . . . . . . . . . . . . . . . . . . . . . . . . . . . . . . . . . . . . . . . . . . . . . . . . . . . . . . . . . . . . . . . . . . . . . . 3 1. Introduction and notes for readers . . . . . . . . . . . . . . . . . . . . . . . . . . . . . . . . . . . . . . . . .. . . . . . 4 1.1 Introduction . . . . . . . . . . . . . . . . . . . . . . . . . . . . . . . . . . . . . . . . . . . . . . . . . . . . . .. . . . . . 4 1.2 Notes for readers . . . . . . . . . . . . . . . . . . . . . . . . . . . . . . . . . . . . . . . . . . . . . . . . . . . . . . . 4 2. Milk prices in 2016 . . . . . . . . . . . . . . . . . . . . . . . . . . . . . . . . . . . . . . . . . . . . . . . . . . . . . . . . . . . 5 2.1 Milk price comparison . . . . . . . . . . . . . . . . . . . . . . . . . . . . . . . . . . . . . . . . . . . . . . . . . . . 5 2.2 French milk prices . . . . . . . . . . . . . . . . . . . . . . . . . . . . . . . . . . . . . . . . . . . . . . . . . . . . . . . 7 2.3 Milk price developments outside the European Union . . . . . . . . . . . . . . . . . . . . . . . . . . . 8 2.4 Dairy market 2016 . . . . . . . . . . . . . . . . . . . . . . . . . . . . . . . . . . . . . . . . . . . . . . . . . . . . . . 11 3. Milk price and market developments in the first half of 2017. . . . . . . . . . . . . . . . . . . . . . . . . . . . 12 4. Additional information of milk prices per company . . . . . . . . . . . . . . . . . . . . . . . . . . . . . . . . . . 13 Annex I Milk prices 2009 to 2016 . . . . . . . . . . . . . . . . . . . . . . . . . . . . . . . . . . . . . . . . . . . . . . . . . 16 Annex II Average currency exchange rates 2016 and 2015 . . . . . . . . . . . . . . . . . . . . . . . . . . . . . 16 Annex III National milk deliveries and the shares supplied to the dairy companies . . . . . . . . . . . . 17

LTO International Milk Price Comparison 2016 3
Foreword The year 2016 was a year to remember for dairy farmers for several reasons. The average milk price almost reached the lowest point recorded in 2009. However, to dairy farmers it did feel like a low point, given the long period (since mid-2014) of ever-decreasing milk prices and the liquidity problems that their farms experienced as a result. The EU's safety net was drawn upon for good reason, and 2016 again saw the creation of an intervention stock of skimmed milk powder. This stock is still pushing down on the market with all the associated uncertainties. The low milk prices prevailing since the abolishment of the milk quota were the reason why the European Commission launched in 2016 a voluntary milk production reduction scheme. In addition to the low milk prices, 2016 was also marked by major monthly price differences. After the low point in mid-2016, the milk price recovered fast in the second half of 2016. There were big differences in milk prices month-on-month within one calendar year. For dairy farmers, as well as for many other partners in the supply chain, these fluctuations in the market are very difficult to manage. In addition to the milk price, 2016 was a special year for Dutch dairy farmers because the total milk deliveries in the Netherlands reached a record level of 14.3 billion kg. Despite this large volume, there was still considerable room for a milk price increase in the second half of 2016 and at the beginning of 2017. For Dutch dairy farmers, 2016 was an uncertain year because of the introduction of a new restriction in the form of phosphate rights. They will be introduced to reduce phosphate production in the Netherlands below the national ceiling which is used as a condition for the derogation decision under the Nitrates Directive. Because of the uncertainty surrounding references many dairy farmers have kept extra dairy cows. This contributed to an increased milk production. Although the phosphate rights will only be introduced in 2018, the phosphate production and thus the number of dairy cows in the Netherlands must be reduced in 2017. All in all, 2016 was an unpleasant, difficult and uncertain year, but there is now more clarity and there are also positive developments in the dairy market. Kees Romijn Chairman Dairy Committee Dutch Federation of Agriculture and Horticulture LTO Nederland
LTO International Milk Price Comparison 2016 4
1. Introduction and notes for readers
1.1 Introduction The LTO International Milk Price Comparison is published every month at the request of the Dairy Committee of the Dutch Federation of Agriculture and Horticulture (LTO Nederland) at www.milkprices.nl. This is a comparison of prices paid for milk by large European companies and is done in co-operation with European Dairy Farmers (EDF). EDF collects the milk price data and makes them available. Calculations are undertaken by ZuivelNL. The method chosen for the calculations shows the price a dairy farmer would receive if milk of specific (standard) composition, quality and quantity were delivered to the different dairy companies. In this report the following characteristics of the standard milk are taken as a basis: - 4.2% fat; - 3.4% protein; - total bacterial count 24,999 per ml; - somatic cell count 249,999 per ml; - annual delivery 500,000 kg. The prices are exclusive of VAT, ex-farm and inclusive of supplementary payments. It must be emphasized that this is no comparison of the average milk prices paid. The average price paid by a dairy company for milk is dependent on the actual composition, quality, quantity et cetera of the milk delivered. Furthermore, no conclusions can be drawn about the performance of dairy companies on the basis of the milk prices paid. Many more factors play a role in assessing performance. After each calendar year has ended, a report is presented with the calculated milk prices paid for that year. This annual report appears when the supplementary payments of the preceding calendar/ financial year are known and can, thus, be incorporated into the milk prices. The amount of supplementary payments are not corrected for the date of payment. The monthly milk prices are weighted on the basis of national monthly milk deliveries (source: ZuivelNL). The weighting of the 2016 monthly milk prices is based on the average of the monthly deliveries in 2014 and 2015, while 2015 is based on milk deliveries in 2013 and 2014. The present publication comprises the milk prices calculated for the calendar year 2016.
1.2 Notes for readers Chapter 2 features the calculated milk prices for 2016 (paragraph 2.1), followed by an analysis of the development of French milk prices (2.2), milk price developments outside the EU (2.3) and the dairy market in 2016 (2.4). In chapter 3 trends of milk prices and dairy markets in the first half of 2017 are described. In chapter 4 additional information about the calculated milk prices per company is given. The appendices give an overview of milk prices per dairy company from 2009 to 2016 (Annex I) and the average currency exchange rates in 2016 and 2015 (Annex II). Annex III shows total milk supply per country as well the part (%) of raw milk supplied by the dairy companies for which the milk prices are calculated.

LTO International Milk Price Comparison 2016 5
2. Milk prices in 2016
2.1 Milk price comparison The price decreases that set in after the summer of 2014 continued until mid-2016. Unfortunately, this was too late to prevent the average milk price paid by EU dairy companies falling by € 2.77 (8.9%) to € 28.30 per 100 kg in 2016 in comparison with 2015. This made 2016 the second worst milk price year since the start of this milk price comparison in 1999. The only year the milk price was lower was 2009. Besides the low milk prices, 2016 was also memorable for the big differences in monthly price observed. Monthly milk prices bottomed out at the start of the summer and increased strongly again at the end of the year.
Table 1. Milk prices 2016 and 2015 In € per 100 kg of standard milk (excluding VAT and including supplementary payments)
Company
country
2016 (€)
2015 (€)
2016-2015 (€)
2016/2015 (%)
national currency
Granarolo (North) IT 36.83 1 38.93 1 -2.09 -5.4%
Valio FI 35.21 2 36.03 2 -0.83 -2.3%
Danone (Pas de Calais) FR 31.57 3 33.07 6 -1.50 -4.5%
FrieslandCampina NL 30.80 4 33.22 5 -2.42 -7.3%
Sodiaal (Pas de Calais) FR 30.29 5 33.41 4 -3.12 -9.3%
Savencia (Basse Normandië) FR 29.78 6 32.69 7 -2.91 -8.9%
Lactalis (Pays de la Loire) FR 29.31 7 31.67 8 -2.36 -7.4%
Arla Foods DK DK 28.28 8 30.50 9 -2.22 -7.3% -7.5%
Milcobel BE 26.88 9 28.45 10 -1.57 -5.5%
Dairy Crest (Davidstow) UK 26.67 10 34.44 3 -7.77 -22.6% -9.8%
Müller (Leppersdorf) DE 26.10 11 28.16 12 -2.06 -7.3%
Kerry Agribusiness IE 24.84 12 28.29 11 -3.45 -12.2%
DMK DE 24.71 13 27.36 14 -2.66 -9.7%
Dairygold IE 24.63 14 27.85 13 -3.22 -11.6%
DOC Cheese NL 23.96 15 26.54 16 -2.58 -9.7%
Glanbia IE 22.99 16 26.58 15 -3.59 -13.5%
AVERAGE MILK PRICE 28.30 31.07 -2.77 -8.9%
Hochwald eG DE 26.36 31.04 -4.67 -15.1%
Emmi CH 47.46 53.51 -6.05 -11.3% -9.2%
Fonterra NZ 28.02 21.05 6.98 33.1% 33.1%
USA class III US 33.99 35.82 -1.83 -5.1% -5.4%
Notes: A number of changes have happened since the previous publication. The milk prices paid by Finnish Hämeenlinnan Osuusmeijeri and British First Milk have not been calculated and published with effect from 2016. The milk prices paid by Finnish Valio and Irish Dairygold are added and have both been included in the average. Given these changes, the average milk price for 2016 is not the same as the average indicated in the previous publication. Another new addition is the milk price for German Hochwald eG; so far this price has not been included in the average.
Due in part to the fact that milk prices paid by the small Finnish Hämeenlinnan Osuusmeijeri cooperative dairy are no longer being calculated and published, the milk price paid by Italian Granarolo is now at the top of the table, followed by Finnish newcomer Valio. Although the milk prices paid by both companies fell significantly less than average in 2016, this does not explain their top positions. Even if their milk prices had fallen by the average amount, the milk prices paid by both would still be at the top of the table.

LTO International Milk Price Comparison 2016 6
In general, milk prices in Italy and Finland are well above the average applicable in the rest of the European Union. One possible explanation for Italy could be the relative scarcity of farm milk. Italy is a net importer of dairy and much of the raw milk available is used to make special types of cheese (Parmesan and Grana Padano, for example). Milk that is used to make other products is scarcer as a result. Granarolo uses a large volume of milk to make fresh dairy products. Because Finland is a net dairy exporter, this reasoning does not explain the high milk price paid by Valio. However, it does produce a relatively large number of innovative products with high added value. What is striking is the high ranking of Danone and the other French companies. It would seem that French milk prices rank relatively higher in poor milk price years. This is explained in more detail in paragraph 2.2. Thanks in particular to the good operating results achieved in the second half of 2016, FrieslandCampina was able to pay a relatively high supplementary payment which limited the decrease in its milk price. Although the milk price paid by Arla Foods fell less than average (7.3% in comparison with an average of 8.9%), the milk price calculated this year is (just) below the average again. The milk price paid by Milcobel is a provisional figure, as the supplementary payment for 2016 is not known yet. This could mean that the final milk price will ultimately be slightly higher or lower (a maximum of minus € 0.47). Because milk prices are expressed in euro, the milk price calculated for British Dairy Crest depends in part on the strength of the British pound against the euro. As a result of the fall in value of the British pound against the euro, the milk price calculated by Dairy Crest has fallen by 22.6%. However, expressed in the national currency, this decrease falls to just 9.8%. Exchange rate movements largely explain the low (10th in 2014) and relatively high (3rd in 2015) quotations achieved for the milk prices paid by Dairy Crest. The German milk prices paid by Müller and DMK (and newcomer Hochwald eG) are below average, just as they have been in recent years. The Irish milk prices paid by Kerry, Dairygold and Glanbia and Dutch DOC Cheese are at the bottom of the ranking again, just as they have been in recent years. Figure 1 shows that the average milk price in 2016 is at its lowest level since 2009. Figure 1. Average milk prices from 1999 to 2016
31.07
28.30
26
28
30
32
34
36
38
40
€p
er
10
0 k
g

LTO International Milk Price Comparison 2016 7
2.2 French milk prices The milk prices paid by French dairy companies, as shown in the LTO milkprice comparison, are fluctuating relatively less than the milk prices paid by the other companies. This is one of the reasons why French milk prices ‘score’ relatively higher in poor years (2015 and 2016, for example) and lower in good milk price years (2013 and 2014, for example). It would seem that 2014 is an exception to this rule. 2014 is characterized by high milk prices in the first half of the year, followed by a strong decrease in the second half. 2014 could actually be viewed as a transitional year from good to poor milk prices. Figure 2. Average milk prices French and other EU dairy companies 2013-2016
One explanation for this situation is the French milk price system, as set out in contracts between producer organisations and the milk buyers. It should also be observed that the volume of milk that dairy farms are able to supply each year is restricted. If milk is supplied over and above the limit applicable, milk farmers receive a very low price for this so-called surplus milk. The French system is actually similar to the old milk quota system, but different in that the quota is now determined at milk buyer’s level and the super levy previously charged for extra milk has been replaced by a very low milk price, which has the same effect. The French milk price consists of a base price for standard milk, plus or minus various bonuses and/or deductions, depending on actual fat and protein content and quality, etc. The base price is derived from the average base price applicable in the previous year, plus a monthly adjustment (indexation) based on market indicators published by CNIEL. Also, to keep in step with 'competitors' to some extent, allowance is made for the difference between French and German milk prices. The market indicators referred of CNIEL are based on the selling prices achieved for dairy products in previous periods (which is why milk price changes usually happen slightly later in France; see the ‘lagging effect’ in 2014). Because the sale of dairy products in the French domestic market (less fluctuation) affects the market indicators relatively more than the export of basic products to third countries, which fluctuates in price far more, price fluctuations are reduced compared to other countries. Also a franchise is applied to the milk price differences with Germany. This softens fluctuations too. Finally: if the milk price formula set out in contracts is found to result in unwanted outcomes for milk producers (read: the milk price paid is too low), upward price adjustments are possible.
26
28
30
32
34
36
38
40
€/1
00
kg
Other French

LTO International Milk Price Comparison 2016 8
2.3 Milk price developments outside the European Union Emmi Switzerland At 11.3%, the milk price calculated by Swiss Emmi has fallen by more than the average for EU companies (8.9%). This is due in part to the (slight) fall in the value of the Swiss Franc against the euro, but primarily because no allowance has been made for the supplementary payment in the milk price for 2016 at this stage. The milk price for 2015 includes a supplementary payment of € 1.83 per 100 kg, which dairy farmers received at the end of 2016/the start of 2017. The expectation is that milk farmers will receive a supplementary payment for 2016 supply too. However, this will only be known at the end of 2017. The milk price calculated for Emmi is based on one of the regional producer organisations, supplying milk to Emmi. Market management in Switzerland is based on an A-, B- and C-segment for raw milk. Milk in the A-segment is used to make products aided by market support, while milk in the B-segment is intended for products in the free market. The C-segment is reserved for surplus milk. Agreements are made about the monthly milk prices and the volumes of A, B and C milk in consultation between producer organisations and milk buyers. Every month, milk farmers receive an A, B or possibly C price for fixed percentages of the total milk supplied. For example, these percentages and prices (€/100 kg) were as follows on average in 2016: A 67% and € 55.73, B 26% and € 38.49 and C 7% and € 23.17. Based on the average A, B and C price, the milk price calculated in 2016 was € 47.46 per 100 kg (2015: € 53.51) including various bonuses and deductions, but excluding supplementary payments. The milk price of 2015 is inclusive a supplementary payment. Figure 3. Milk prices Emmi 2010 until 2016 (CHF and € per 100 kg standard milk)
Fonterra The Fonterra dairy cooperative processes approximately 87% of all farm milk in New Zealand and 95% of New Zealand’s dairy production is exported. With this in mind, the development in the milk prices paid by Fonterra is a good indication of the prices applicable in the global dairy market. Given the limited amount of competition, the farm gate milk price of Fonterra is determined on the basis of a transparent government-backed methodology. The New Zealand milk price is expressed per kg of fat and protein (milk solids (MS)).
30
35
40
45
50
55
46
48
50
52
54
56
58
60
62
64
2010 2011 2012 2013 2014 2015 2016
€/1
00
kg
CH
F/1
00
kg
CHF per 100 kg €/100 kg

LTO International Milk Price Comparison 2016 9
Fonterra publishes a milk price forecast at the start of each milk price season. This forecast is updated on a regular basis throughout the milk price season, which runs from June to May inclusive. The final milk price is announced once the financial year has ended in September. The milk price forecasts show the turnaround in the dairy market, with a 41% increase in the milk price forecast between 1 August and 18 November 2017. Table 2. Fonterra farmgate milk price (excluding dividend) forecasts 2016/17
NZD/kg MS
Opening 26 May 2016 4,25
1 August 2016 4,25
25 August 2016 4,75
21 September 2016 5,25
18 November 2016 6,00
23 February 2017 6,00
22 March 2017 6,00
24 May 2017 6,15
Throughout the season, the calculated milk price is based on the most recent forecast, plus the dividend expected. The latter is taken into consideration because members are required to buy one share per kg of MS. The member-dairy farmers receive a monthly advance milk price in accordance with a predetermined schedule, which is derived from the milk price forecast and takes cash-flow at farm level into consideration. As such, the advance milk price is different to the amounts specified in the table. The milk price calculated for Fonterra for calendar year 2016 is € 28.02 (2015: € 21.05) per 100 kg. This is based on the final milk price of NZD 4.30 per kg MS (including a dividend of NZD 0.40) in the 2015/16 season and the most recent forecast for the current 2016/17 season, being NZD 6.65 (including a dividend of 0.50). Fonterra has announced an opening milk price of NZD 6.50 per kg MS with effect from June 2017 for the new 2017/2018 season. Including an estimated dividend of NZD 0.50 this corresponds with a milk price including dividend of NZD 7.00 per kg MS. The milk price for the previous season and the forecast for 2017/18 are far higher than the price for the last two milk price seasons; see figure 4. Figure 4. Milk prices Fonterra 1998/99 - 2015/16 including (estimated) dividend
2016/17: forecast 2017/18: opening milk price
4.30
6.65
2
3
4
5
6
7
8
9
19
98
/99
19
99
/00
20
00
/01
20
01
/02
20
02
/03
20
03
/04
20
04
/05
20
05
/06
20
06
/07
20
07
/08
20
08
/09
20
09
/10
20
10
/11
20
11
/12
20
12
/13
20
13
/14
20
14
/15
20
15
/16
20
16
/17
20
17
/18
NZD
pe
r kg
milk
so
lids

LTO International Milk Price Comparison 2016 10
The United States The Class III milk price gives a good indication of how milk prices are developing in the United States of America. The government (USDA) publishes every month milk prices for different classes of raw milk, depending on the destination of the milk: Class IV (butter and skimmed milk powder), Class III (cheese), Class II (other processed milk) and Class I (consumption milk and consumption milk products). The prices of the underlying components (fat and protein, etc.) are published too. These prices are based on extensive market observations. The milk prices paid to milk farmers are largely determined by the milk processor's product folio and, with this in mind, a weighted average of the various class prices. Besides the destination of the milk, milk prices vary depending on market regulation per state, cost deductions by the buyers and/or bonuses paid and, of course, actual content and quality. Because Class III is regarded as the most representative, this is the starting point taken when calculating the USA milk price. Milk prices are converted into an amount per 100 kg of standard milk, based on the corresponding prices of underlying components. Converted into euro and per 100 kg of standard milk, the Class III milk price for the United States in 2016 is € 33.99 (2015: € 35.82). Expressed in dollars per hundredweight (cwt = 45.36 kg), the milk price fell from $ 15.80 in 2015 to $ 14.87 in 2016. In the first four months of 2017, the milk price was an average of $16.17 per cwt. The most recent USDA forecast1 for Class III milk price in 2017 is $ 16.10-16.60 per cwt. Figure 5. USA Class III Milk prices 1999-2017
2017: forecast
1 USDA Market Outlook, 17 April 2017.
15.80
14.87
8
10
12
14
16
18
20
22
$ p
er
cwt
(45
,36
kg)
LTO International Milk Price Comparison 2016 11
2.4 Dairy market 2016
It was a supply-driven market in 2016. The developments on the supply side caused strong fluctuations in the prices of fat-containing products, such as butter, cheese and whole milk powder. There was a strong increase in the global milk production in the first quarter of 2016. Europe, and especially northwest Europe, accounted for most of that increase. Together with a disappointing demand, this caused a market imbalance. The stocks expanded putting pressure on the prices. The price of skimmed milk powder remained around the intervention price level. As a result, intervention stocks continued to grow. The European milk production growth rate slowed down in April and May. The supply also stagnated outside Europe. Because of a weaker than expected supply growth and a slowly recovering demand, the dairy market reached its lowest point in late April and then rebounded strongly in May. The price of skimmed milk powder remained around the intervention price level. This resulted in a rapid increase in intervention stocks. From June, supply fell worldwide. The EU was not the only market where supply was shrinking, Oceania and South America were also producing less milk. The USA was the only exporter of significance with a considerable growth in milk production. The diminished supply caused a sharp price rise during the rest of the year. In particular, fat-containing products recorded strong price increases. Butter prices even reached a record level at the end of November. Initially, the market revival did not affect the price of skimmed milk powder. There were still many interventions in the period from June to August. After that, the price began to rise slowly until well above the intervention price level. The average price dynamic relative to 2015 showed mixed results per product. The average Dutch quotations of skimmed milk powder and whey powder remained virtually unchanged. The average quotation for butter increased by 10%. On the other hand, the average price of whole milk powder (-4%) and the average indicative value for Gouda cheese (-6%) decreased.
LTO International Milk Price Comparison 2016 12
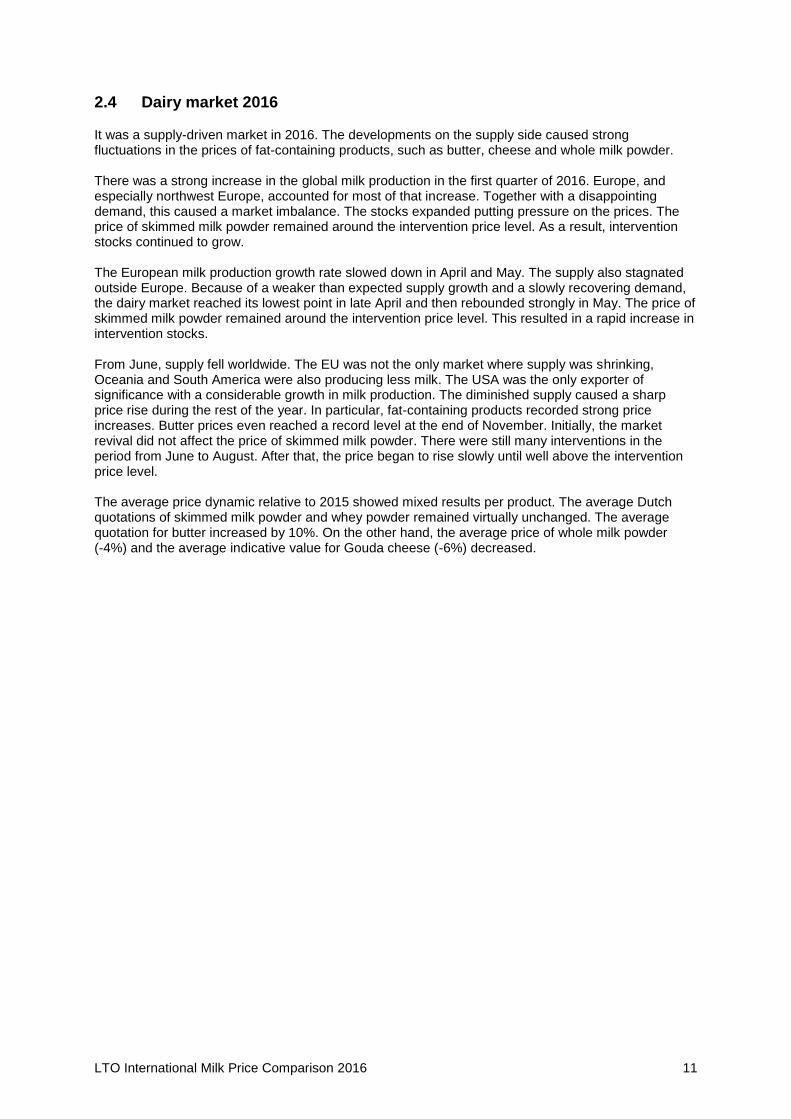
3. Milk price and market developments in the first half of 2017 In early 2017, the dairy market came under pressure. This mainly concerned milk powder. In the first quarter, Dutch price quotations of both whole and skimmed milk powder followed a continuous downward trend. This was mainly due to the weak demand in both the European and global markets. The butter quotations remained unchanged at a high level during this period. After a short period of decline, they began to increase again starting from mid-February. The price of skimmed milk powder fell in late March to around the intervention price level, which caused the market to hit the floor in April. However, this resulted in a small increase in intervention stocks. Starting from May, all prices began to follow a strong upward trend. The butter quotation has been rising continuously since mid-February. In late May, it was at a record level of well above 500 euros per 100 kg. As a result of the continuously increasing prices of butter and cream, milk and cheese prices continued to go up too. The price of skimmed milk powder was also on the rise, although still close to the intervention level. However, this led to no or few purchases for intervention. The rise of the (average) milk prices, which had begun in July 2016, stopped in March 2017. The average milk price also fell slightly in April, but because of the positive developments in the dairy market milk prices are expected to increase in the coming months. Figure 6. Development of average monthly milk prices from January 2014 until June 2017
(May and June estimated)
2014
2015
2016
2017
26
28
30
32
34
36
38
40
42
€/1
00
kg

LTO International Milk Price Comparison 2016 13
4. Additional information of milk prices per company
Granarolo The milk price calculated by Granarolo - which is largely owned by the Granlatte cooperative - fell by 5.4% to € 36.83 per 100 kg in 2016. Valio The milk price calculated is based on milk statements for one of Finland's bigger dairy cooperatives, which - together with 16 other cooperatives - has all of its milk processed by Valio. Together, they are the joint owner of/shareholder in Valio. Valio processes a total of approximately 1.9 billion litres of milk, which represents approximately 80% of Finnish milk production. Although Valio pays the same price for all of the milk it processes, the cooperatives are free to decide how to pay this milk payment to the member-dairy farmers. The milk price calculated includes a supplementary payment of € 0.78 per 100 kg (2015: € 0.68). Danone and Sodiaal Just as is the case for Sodiaal, the milk price calculated by Danone is based on the so-called A-price. A lower B-price was paid for part of the milk supplied within the quota. The Danone B-price is equal to the milk value published by CNIEL, which relates to milk that is used to make butter and skimmed milk powder. The Sodiaal B-price is equal to this price, minus € 15.00 per 1,000 litres. The volume of A-milk supplied is subject to a monthly limit. For Danone suppliers, this is a maximum of 8.5% of the annual quota in the months of November to April inclusive, 9.5% in May and 12.5% in June to October inclusive. Sodiaal is subject to a maximum of 7.5% every month, with the exception of August, September and October, in which no maximum A-volume applies. Based on the standard supply pattern applied in the milk price comparison, surplus milk is supplied in excess of the capped A-volume in only a few months of the year. Added to this, the B-price is paid for just a relatively limited quantity of milk in the same months. As a result, the impact on the milk price calculated under the A/B system is limited. If the milk price comparison were to be based on the average A-price and B-price rather than just the A-price, the milk price calculated by Danone would fall by € 0.02 per 100 kg in 2016 (2015: minus € 0.07). The impact on Sodiaal is bigger, because the maximum A volumes are smaller and a lower B-price is applied. This would mean a decrease of € 0.66 per 100 kg in the milk price calculated by Sodiaal in 2016 (2015: € 0.72), based on an average milk price instead of only the A-price. Sodiaal's 2015 milk price includes a supplementary payment of € 0.24 per 100 kg. The supplementary payment for 2016 is not known yet. FrieslandCampina The milk price calculated by FrieslandCampina includes a pasture bonus (an average amount) of € 0.29 per 100 kg and a supplementary payment of € 3.30 (€ 3.49). The supplementary payment consists of a performance bonus of € 2.09 and a member bonds of € 1.20. Savencia In 2016 Bongrain changed its name into Savencia, Fromage & Dairy. Lactalis In 2015 and 2016, Lactalis used monthly bonuses to support the milk price agreed on contractually. This support equated to an average of € 2.57 per 100 kg in 2016. The milk price calculated includes this support. Arla The milk price paid by Arla is based on Danish milk statements. In addition to the monthly advance-milk price, member-dairy farmers receive a supplementary payment, part of which is converted into member certificates. The supplementary payment for 2016 was 4.61% (2014: 4.71%) of the so-called basic value. This basic value is made up of monthly fat and protein payments minus costs per kg of milk, plus quality bonuses (3%) received. The supplementary payment calculated is DKK 9.40 (of which DKK 2.06 in the form of member certificates) or € 1.25 (2013: € 1.37) per 100 kg of standard milk.

LTO International Milk Price Comparison 2016 14
Milcobel Milcobel has not announced the supplementary payment for 2016 deliveries yet. For the time being, the milk price calculated for 2016 is based on the supplementary payment applicable in 2015, being € 0.47 per 100 kg. The milk prices calculated by Milcobel exclude contributions from the so-called crisis fund. This was € 2.50 per 100 litres for a period of six months from September 2015 to February 2016 inclusive, which equates to € 1.25 per 100 kg on an annual basis. Dairy Crest Davidstow The milk prices calculated by Dairy Crest is based on the agreements made between the producer organisation DirectMilk DPO and Dairy Crest in relation to the milk supplied to the Davidstow cheese factory. Müller Milk farmers that supplied more milk in the last quarter of 2016 than they did in the same month the year before received a bonus of € 3.00 per 100 kg of extra milk. This bonus has not been included in the milk price calculated. Kerry The calculated milk price of Kerry includes a sustainability bonus of 0.1 cent per liter. DMK DMK introduced the Milkmaster sustainability programme in January 2016. Depending on the number of points they have, milk farmers are able to earn a maximum bonus of € 1.00 per 100 kg. The milk price calculated for DMK includes a bonus of € 0.50 per 100 kg. As soon as the average bonus paid is known, it will be included in the milk prices calculated with retrospective effect. Dairygold The milk prices paid by the Irish Dairygold cooperative have been included in the milk price comparison since January 2015. According to the annual report, an amount € 25 mln. was paid out in milk price support in 2016. Based on 1.2 billion kg of milk, this equates to some € 2.00 per 100 kg. Support amounted to approximately € 1.70 per 100 kg in 2015. DOC Cheese The milk prices calculated for DOC exclude supplementary payments. The member bonus of € 0.68 per 100 kg, which had previously been paid out in the form of a supplementary payment, has been included in the monthly milk statements. Depending on the number of points they have, milk farmers are able to earn a maximum sustainability bonus (MELKKompas premium) of € 1.00 per 100 kg. An average bonus of € 0.86 has been included in the milk prices calculated for 2016 and 2015. Finally, a volume bonus of € 0.34 (relates to an annual supply of 500,000 kg) and a quality bonus of € 0.03 per 100 kg has been included in the milk price. However, the one-off bonus of € 1.00 per 100 kg for milk supplied in December 2016 has not been included. This was a one-off payment pursuant to the merger with DMK. DMK and DOC Cheese merged with effect from 1 April 2016 and DOC dairy farmers now receive the DMK milk price. Both cooperatives pay out this amount to their supplying farmers in accordance with their own terms of supply. Because of this there may be differences in the milk prices calculated for DOC and DMK for a standard farms. For example DOC pays out a higher volume-based bonus. As a result of the merger and the uniformization of the milk price systems, DOC milk prices are no longer calculated and published on a monthly basis with effect from 2017.
LTO International Milk Price Comparison 2016 15
Glanbia Ingredients Ireland The milk price calculated by Glanbia Ingredients Ireland (GII) excludes payments received from the support fund of the Glanbia cooperative (an average of € 1.35 in 2016 and € 1.15 per 100 kg in 2015). These coop bonuses have not been included in the milk price calculated, being a payment from the capital of the cooperative and, as such, not linked to the market returns achieved by Glanbia Ingredients. The cooperative owns 36% of all shares in the listed company Glanbia plc and receives a dividend on an annual basis. GII is a joint venture of the cooperative and Glanbia plc. Ornua's payment of 1 cent per litre has also not been included either. Ornua (previously the Irish Dairy Board) is a cooperative that exports the dairy products of its Irish member-dairy companies to third
countries. All profits made are channelled back (in part) to the member-cooperatives, which – as is the
case with Glanbia – are then able to pass on an amount to the dairy farmers.
Hochwald eG The milk price calculated relates to the member-dairy farmers that supply to the Hochwald eG cooperative in South Germany. In 2015, the Hochwald group processed a total of 2.3 billion kg of milk, originating from 5,034 suppliers – 3,729 of which were members of the Hochwald eG cooperative. The remaining milk originated from suppliers to the factories in Lüneburg (North Germany) and Bolsward (the Netherlands). The milk price calculated by Hochwald was € 26.36 per 100 kg in 2016. This milk price includes a supplementary payment of € 0.59. As the supplementary payment for 2016 is not known yet, the amount of the supplementary payment for 2015 has been applied for the time being.
LTO International Milk Price Comparison 2016 16
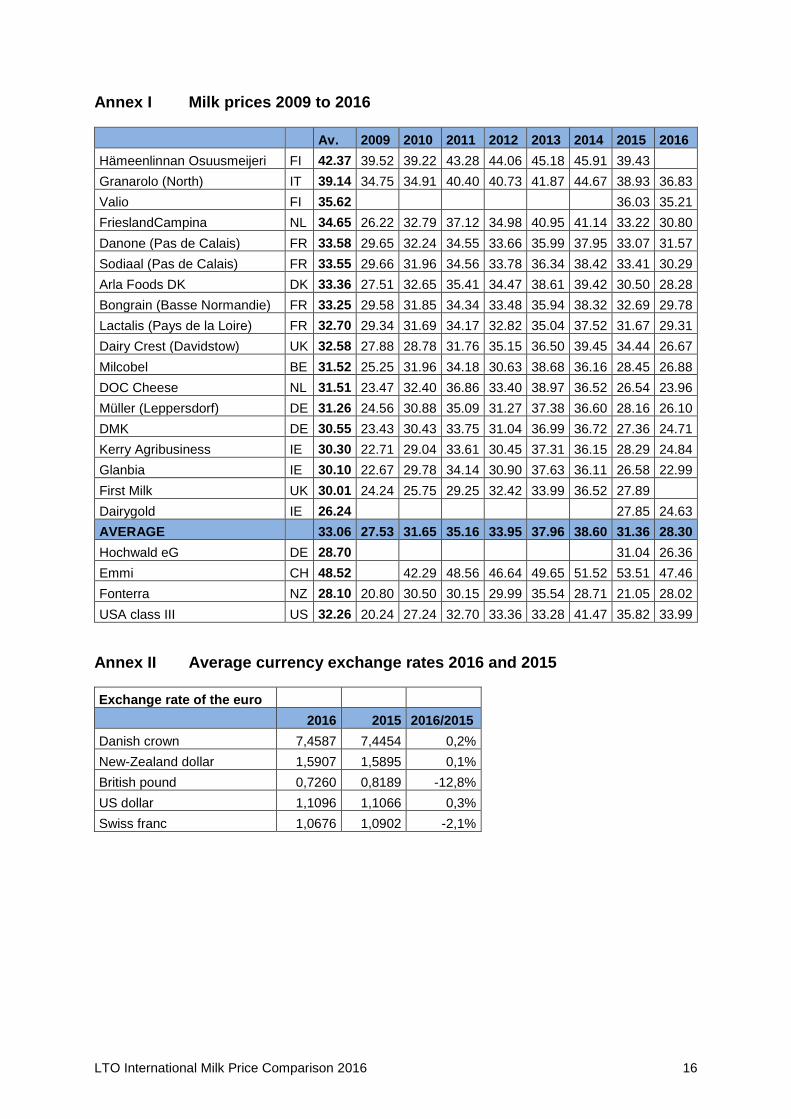
Annex I Milk prices 2009 to 2016
Av. 2009 2010 2011 2012 2013 2014 2015 2016
Hämeenlinnan Osuusmeijeri FI 42.37 39.52 39.22 43.28 44.06 45.18 45.91 39.43
Granarolo (North) IT 39.14 34.75 34.91 40.40 40.73 41.87 44.67 38.93 36.83
Valio FI 35.62 36.03 35.21
FrieslandCampina NL 34.65 26.22 32.79 37.12 34.98 40.95 41.14 33.22 30.80
Danone (Pas de Calais) FR 33.58 29.65 32.24 34.55 33.66 35.99 37.95 33.07 31.57
Sodiaal (Pas de Calais) FR 33.55 29.66 31.96 34.56 33.78 36.34 38.42 33.41 30.29
Arla Foods DK DK 33.36 27.51 32.65 35.41 34.47 38.61 39.42 30.50 28.28
Bongrain (Basse Normandie) FR 33.25 29.58 31.85 34.34 33.48 35.94 38.32 32.69 29.78
Lactalis (Pays de la Loire) FR 32.70 29.34 31.69 34.17 32.82 35.04 37.52 31.67 29.31
Dairy Crest (Davidstow) UK 32.58 27.88 28.78 31.76 35.15 36.50 39.45 34.44 26.67
Milcobel BE 31.52 25.25 31.96 34.18 30.63 38.68 36.16 28.45 26.88
DOC Cheese NL 31.51 23.47 32.40 36.86 33.40 38.97 36.52 26.54 23.96
Müller (Leppersdorf) DE 31.26 24.56 30.88 35.09 31.27 37.38 36.60 28.16 26.10
DMK DE 30.55 23.43 30.43 33.75 31.04 36.99 36.72 27.36 24.71
Kerry Agribusiness IE 30.30 22.71 29.04 33.61 30.45 37.31 36.15 28.29 24.84
Glanbia IE 30.10 22.67 29.78 34.14 30.90 37.63 36.11 26.58 22.99
First Milk UK 30.01 24.24 25.75 29.25 32.42 33.99 36.52 27.89
Dairygold IE 26.24 27.85 24.63
AVERAGE 33.06 27.53 31.65 35.16 33.95 37.96 38.60 31.36 28.30
Hochwald eG DE 28.70 31.04 26.36
Emmi CH 48.52 42.29 48.56 46.64 49.65 51.52 53.51 47.46
Fonterra NZ 28.10 20.80 30.50 30.15 29.99 35.54 28.71 21.05 28.02
USA class III US 32.26 20.24 27.24 32.70 33.36 33.28 41.47 35.82 33.99
Annex II Average currency exchange rates 2016 and 2015
Exchange rate of the euro
2016 2015 2016/2015
Danish crown 7,4587 7,4454 0,2%
New-Zealand dollar 1,5907 1,5895 0,1%
British pound 0,7260 0,8189 -12,8%
US dollar 1,1096 1,1066 0,3%
Swiss franc 1,0676 1,0902 -2,1%

LTO International Milk Price Comparison 2016 17
Annex III National milk deliveries and the shares supplied to the dairy companies
Billion kg Share Companies
Billion kg
Germany 32.0 31% Müller (Leppersdorf) 1.7
Hochwald eG 1.5
DMK 6.7
France 24.7 55% Savencia 3.0
Danone 1.0
Lactalis 5.0
Sodiaal 4.7
United Kingdom 14.6 3% Dairy Crest (Davidstow) 0.5
Netherlands 14.3 78% DOC Cheese 0.9
FrieslandCampina 10.3
Italy 11.5 7% Granarolo 0.9
Ireland 6.9 62% Dairygold 1.2
Glanbia 2.0
Kerry Agribusiness 1.1
Denmark 5.3 89% Arla Foods DK 4.7
Belgium 3.9 31% Milcobel 1.2
Finland 2.4 79% Valio 1.9
Sub total 115.6 42% Share companies
Other EU countries 37.5 Total companies 48.3
EU-28 153.1 32% Share companies
Zwitserland 3.4 26% Emmi 0.9
New Zealand 21.2 85% Fonterra 18.1
United States 96.4


![· MAAHI MILK PRODUCER COMPANY LIMITED maaHl CIN: U01403GJ2012PTC070646 [Registered under Part-IXA of the Companies Act, 1956 as "Producer Company"] (Terms & Conditions) 41 "Maahi](https://static.fdocuments.us/doc/165x107/5e725cf78c9c86035b7fcc77/maahi-milk-producer-company-limited-maahl-cin-u01403gj2012ptc070646-registered.jpg)