LTGEP 2013-2032.pdf
179
CEYLON ELECTRICITY BOARD LONG TERM GENERATION EXPANSION PLAN 2013-2032 Transmission and Generation Planning Branch Transmission Division Ceylon Electricity Board Sri Lanka October 2013
Transcript of LTGEP 2013-2032.pdf
CEYLON ELECTRICITY BOARD
LONG TERM GENERATION EXPANSION PLAN
2013-2032
Transmission and Generation Planning Branch
Transmission Division Ceylon Electricity Board
Sri Lanka
October 2013
Long Term Generation Expansion Planning Studies 2013- 2032
Compiled and prepared by The Generation Planning Unit Transmission and Generation Planning Branch Ceylon Electricity Board, Sri Lanka
Long-term generation expansion planning studies are carried out every two years by the Transmission & Generation Planning Branch of the Ceylon Electricity Board, Sri Lanka and this report is a bi-annual publication based on the results of the latest expansion planning studies. The data used in this study and the results of the study, which are published in this report, are intended purely for this purpose. Price Rs. 3000.00
© Ceylon Electricity Board, Sri Lanka, 2013
Note: Extracts from this book should not be reproduced without the approval of General Manager – CEB
Foreword The ‘Report on Long Term Generation Expansion Planning Studies 2013-2032’, presents the results of the latest expansion planning studies conducted by the Transmission and Generation Planning Branch of the Ceylon Electricity Board for the planning period 2013-2032, and replaces the last of these reports prepared in April 2011. This report, gives a comprehensive view of the existing generating system, future electricity demand and future power generation options in addition to the expansion study results. The latest available data were used in the study. The Planning Team wishes to express their gratitude to all those who have assisted in preparing the report. We would welcome suggestions, comments and criticism for the improvement of this publication. October 2013. Transmission and Generation Planning Branch Letters: 5th Floor, Head Office Bldg. Tr. and Generation Planning Branch Ceylon Electricity Board 5th Floor, Ceylon Electricity Board Sir Chittampalam A. Gardinar Mw. P.O. Box 540 Colombo 02 Colombo, Sri Lanka e-mail : [email protected] Tel : +94-11-2329812 Fax : +94-11-2434866 Prepared by: Reviewed by: M.B.S Samarasekara Y.M Samarasinghe Chief Engineer (Gen. Plan. and Design) Additional General Manager (Transmission) S.H Midigaspe T.A.K Jayasekera Former Chief Engineer (Gen. Plan. and Design) Deputy General Manager (Trans. & Gen. Planning) Electrical Engineers A.D Tillekeratne Former Deputy General Manager (Trans. & Gen. Planning) M.T.K De Silva T.L.B Attanayaka D.C Hapuarachchi R.B Wijekoon B.G.D.L Sumudith Any clarifications sought or request for copies of the report should be sent to the Deputy General Manager (Transmission and Generation Planning) at the address above.
Page i
CONTENTS Page Contents i Annexes iv List of Tables v List of Figures vi Acronyms vii Executive Summary E - 1 1. Introduction 1 - 1 1.1 Background 1 - 1 1.2 The Economy 1 - 1 1.2.1 Electricity and Economy 1 - 2 1.2.2 Economic Projections 1 - 2 1.3 Energy Supply and Demand 1 - 3 1.3.1 Energy Supply 1 - 3 1.3.2 Energy Demand 1 - 4 1.4 Electricity Sector 1 - 4 1.4.1 Access to electricity 1 - 4 1.4.2 Electricity Consumption 1 - 5 1.4.3 Capacity and Demand 1 - 6 1.4.4 Generation 1 - 8 1.5 Planning Process 1 - 9 1.6 Objectives 1 - 9 1.7 Organization of the Report 1 - 10 1.8 Codes / Guidelines in Generation Expansion Planning 1 - 10 2. The Existing Committed Generating System 2 - 1 2.1 Hydro and Other Renewable Power Generation 2 - 1 2.1.1 CEB Owned Hydro and Other Renewable Power Plants 2 - 1 2.1.2 Hydro and Other Renewable Power Plants Owned by IPPs 2 - 5 2.1.3 Capability of Existing Hydropower Plants 2 - 5 2.2 Thermal Generation 2 - 8 2.2.1 CEB Thermal Plants 2 - 8 2.2.2 Independent Power Producers (IPPs) 2-10 3. Electricity Demand: Past and the Forecast 3 - 1 3.1 Past Demand 3 - 1 3.2 Demand Forecasting Methodology 3 - 3 3.3 Demand Forecast 3 - 5 3.4 Sensitivities to the Demand Forecast 3 - 6 3.5 Comparison with Past Forecasts 3 - 7 4 Conventional Generation Options for Future Expansions 4 - 1 4.1 Hydro Options with a Projected Committed Development 4 - 1 4.1.1 Candidate Hydro Projects 4 - 1 4.1.2 Available Studies on Hydro Projects 4 - 2 4.1.3 Details of the Candidate hydro Projects 4 - 2
Page ii
4.1.4 Current status of non Committed Hydro Projects 4 - 4 4.2 Hydro - Capacity Extensions 4 - 4 4.2.1 Samanalawewa 4 - 4 4.2.2 Laxapana Complex 4 - 4 4.2.3 Mahaweli Complex 4 - 4 4.2.4 Pump Storage Option 4 - 5 4.3 Thermal Options 4 - 5 4.3.1 Available Studies for Thermal Plants 4 - 5 4.3.2 Thermal Power Candidates 4 - 6 4.3.3 Candidate Thermal Plant Details 4 - 6 4.3.4 Fuel 4 - 8 4.3.5 Screening of Generation Options 4 - 9 4.3.6 Thermal Plant Specific Cost Comparison 4 -10 4.3.7 Current status of non Committed Thermal Projects 4 -10 4.4 India-Sri Lanka Transmission Interconnection 4 -11 5. Non Conventional Renewable Generation Options for Future Expansions 5 - 1 5.1 Mini / Micro Hydro 5 - 3 5.2 Wind 5 - 4 5.3 Wood Fuel / Dendro Power 5 - 5 5.4 Solar 5 - 5 5.5 Municipal Solid Waste 5 - 6 5.6 Other 5 - 6 5.7 Net Metering 5 - 6 5.8 Inclusion of NCRE in the LTGEP 5 - 7 5.9 Development of NCRE 5 - 7 6. Generation Expansion Planning Methodology and Parameters 6 - 1 6.1 Grid Code Generation Planning 6 - 1 6.2 National Energy Policy 6 - 1 6.3 Preliminary Screening of Generation Options 6 - 2 6.4 Detailed Planning Exercise 6 - 2 6.4.1 SYSIM Simulation Module 6 - 3
6.4.2 WASP Package 6 - 3 6.4.3 Hydro Power Development 6 - 3 6.4.4 Assessment of Environmental Implications and Financial Scheduling 6 - 3 6.4.5 Modeling of NCRE 6 - 4
6.5 Study Parameters 6 - 4 6.5.1 Study Period 6 - 4 6.5.2 Economic Ground Rules 6 - 4 6.5.3 Plant Commissioning and retirements 6 - 4 6.5.4 Cost of Energy Not Served (ENS) 6 - 5 6.5.5 Loss of Load Probability (LOLP) 6 - 5 6.4.6 Reserve Margin 6 - 5 6.4.7 Discount Rate 6 - 5 6.4.8 Assumptions and Constraints Applied 6 - 5
Page iii
7. Results of Generation Expansion Planning Study 7 - 1 7.1 Results of the Preliminary Screening of Generation Options 7 - 1 7.2 Base Case Plan 7 - 1 7.2.1 System Capacity Distribution 7 - 3 7.2.2 System Energy Share 7 - 5 7.2.3 Fuel, Operation and Maintenance 7 - 7 7.2.4 Reserve Margin and LOLP 7 - 8 7.2.5 Investment, Pricing and Environmental Implications 7 - 9 7.3 Demand Effect on Base Plan 7 - 9
7.3.1 Capacity Distribution 7 - 9 7.3.2 Fuel requirement 7 - 10
7.4 Effects of Discount rate on Base Case Plan 7 - 11 7.4.1 Capacity Distribution 7 - 11 7.4.2 Fuel requirement 7 - 11
7.5 Effects of Cost of Energy Not Served over Base Case 7 - 11 7.6 Fuel Price Effect on Base Case Plan 7 - 11
7.7 High NCRE Scenario 7 –12 7.8 Restricted Coal Development to achieve Energy Security 7 - 12
7.9 Determination of LNG Fuel Breakeven price and CDM Benefits 7 - 14 7.10 Effect on Demand Side Management on Base Case 7 - 15 7.11 Social and Environmental Damage Cost Scenario 7 - 15 7.12 Pump Storage Plant and HVDC Interconnection Scenarios 7 –15 7.13 Summary 7 - 16 8. Implementation and Financing of Generation Projects 8 - 1 8.1 Committed Power Plants in the Base Case 8 - 1
8.1.1 Committed Plants 8 - 1 8.1.2 Present Status of the Committed Power Plants 8 - 1 8.2 Proposed Power Plants in the Base Case 8 - 2 8.3 Implementation Schedule 8 - 2
8.4 Required Investment for Base Case 2013 - 2032 8 - 4 8.5 Recommendations for Base Case 8 - 4 8.6 Investment requirement variation for scenarios 8 - 5 9. Environmental Implications 9 - 1 9.1 Greenhouse Gases 9 - 1 9.2 Country Context 9 - 1 9.3 Emission Control Technologies 9 - 3 9.4 Emission Factors Used 9 - 4 9.5 Environmental Implications –Base Case 9 - 5 9.6 Environmental Implications – Other Scenarios 9 - 6 9.7 Climate Change 9 -10 10. Revision to Previous Plan 10.1 Introduction 10 - 1 10.2 Demand Forecast 10 - 1 10.3 Fuel Prices 10 - 4 10.4 Status of Last year Base Case Plan 10 - 5 10.5 Overall Comparison 10 - 6
Page iv
References R - 1 Annexes Annex 2.1 Reservoir System in Mahaweli, Kelani and Walawe River Basins A2 - 1
Annex 3.1 Sensitivities of Demand Forecast A3 - 1
Annex 4.1 Candidate Hydro Plant Data Sheets A4 - 1
Annex 4.2 Cost Calculations of Candidate Hydro Plants A4 - 3
Annex 4.3 Candidate Thermal Plant Data Sheets A4 - 4
Annex 5.1 2011 NCRE Tariff Announced by the PUCSL A5 - 1
Annex 5.2 Renewable Generation Addition in High NCRE Scenario A5 - 2
Annex 6.1 Methodology of the Screening of Curve A6 - 1
Annex 7.1 Screening of Generation Options A7 - 1
Annex 7.2 Capacity Balance for the Base Case – 2012 A7 - 4
Annex 7.3 Energy Balance for the Base Case – 2012 A7 - 5
Annex 7.4 Annual Generation and Plant Factors - Base Case 2012 A7 - 6
Annex 7.4.1 Annual Generation Dispatch with NCRE Reconciliation for the Base Case-2012 A7 - 14
Annex 7.5 Fuel Requirements and Expenditure on Fuel 2012 A7 - 15
Annex 7.6 PUCSL Reference Case A7 - 16
Annex 7.7 High Demand Case A7 - 17
Annex 7.8 Low Demand Case A7 - 18
Annex 7.9 High Discounts (15%) Case A7 - 19
Annex 7.10 Low Discounts (3%) Case A7 - 20
Annex 7.11 50% High ENS cost Case A7 - 21
Annex 7.12 Coal, Oil 50% Price High, and LNG Base Price Case A7 - 22
Annex 7.13 Coal 50% Price High and Oil, LNG Base Price Case A7 - 23
Annex 7.14 High NCRE 20% at 2020 Case A7 - 24
Annex 7.15 No Coal Plants permitted after Trinco Coal A7 - 25
Annex 7.16 Coal Limited around 60% from total Generation Case A7 - 26
Annex 7.17 Dendro Candidate with Local Fuel Concession Case A7 - 27
Annex 7.18 Pump Storage Forced Operation and Forced Construction in 2020 Case A7 - 28
Annex 7.19 No Coal plants permitted after 2025 A7 - 29
Annex 7.20 Social and Environment Damage Cost Case A7 - 30
Annex 7.21 Trincomalee two coal units permitted only in 2018 Case A7 - 31
Annex 7.22 HVDC Candidate Case A7 - 32
Annex 7.23 Base case with CDM benefit A7 - 33
Annex 7.24 Intermediate high demand A7 - 34
Annex 10.1 Actual Generation Expansion and previous plans from 1994-2013 A10 -1
Annex 11 Addendum Revised Base Case A11 -1
Page v
LIST OF TABLES Page
E.1 Base Load Forecast 2012 E - 3 E.2 Base Case Plan (2013-2032) E - 4 E.3 Summary of Case Study analyses E - 6 1.1 Demographic and Economic Indicators of Sri Lanka 1 - 2
1.2 Forecast of GDP Growth Rate in Real Terms 1 - 2 1.3 Installed Capacity and Peak Demand 1 - 7 1.4 Electricity Generation 1992 – 2011 1 - 8
2.1 Existing and Committed Hydro and Other Renewable Power Plants 2 - 2 2.2 Projected Committed Development of NCRE 2 - 5 2.3 Expected Monthly Hydro Power and Energy Variation of the existing hydro plants for the Selected Hydro Conditions 2 - 6
2.4 Expected Monthly Hydro Power and Energy Variation of the Upper Kothmale Hydro Power Plant for the Selected Hydro Conditions 2 - 7
2.5 Details of Existing and Committed Thermal Plants 2 - 9 2.6 Characteristics of Existing and Committed CEB Owned Thermal Plants 2-10 2.7 Details of Existing and Committed IPP Plants 2-11
3.1 Electricity Demand in Sri Lanka, 1996 - 2011 3 - 1 3.2 Variables Used for Econometric Modeling 3 - 3 3.3 Base Load Forecast 2012 3 - 6 3.4 Comparison of Past Forecasts with this year’s forecast in GWh 3 - 8 4.1 Characteristics of Candidate Hydro Plants 4 - 2 4.2 Capital Cost Details of Hydro Expansion Candidates 4 - 3 4.3 Specific Cost of Candidate Hydro Plants 4 - 3 4.4 Capital Cost Details of Thermal Expansion Candidates 4 - 7 4.5 Characteristics of Candidate Thermal Plants 4 - 7 4.6 Characteristics of Fuel Used in the Study 4 - 8 4.7 Specific Cost of Candidate Thermal Plants in USCts/kWh (LKR/kWh) 4-10
5.1 Energy and demand contribution from non-conventional renewable sources 5 - 2 5.2 Projected future development of NCRE 5 - 3
7.1 Generation Expansion Planning Study - Base Case (2013-2032) 7 - 2 7.2 Generation Expansion Plan 2013-2032 Base Case Capacity Additions 7 - 3 7.3 Capacity Additions by Plant Type 7 - 4 7.4 Cost of Fuel, Operation and Maintenance in Base case 7 - 8 7.5 Energy share and percentage for coal restricting around 60% case 7- 12 7.6 Comparison of the results of Expansion Scenarios Studied 7- 16 8.1 Investment Program for Expansion Projects (Base Case), 2013-2032 8 - 6 9.1 Comparison of CO2 Emissions from fuel combustion 9 - 1 9.2 Ambient Air Quality Standards and Proposed Stack Emission Standards of Sri Lanka 9 - 2
9.3 Comparison of Ambient Air Quality Standards of Different Countries and Organizations 9 - 2 9.4 Comparison of Emission Standards of Different Countries and Organizations 9 - 3
9.5 Abatement Factors of Typical Control Devices 9 - 4 9.6 Uncontrolled Emission Factors (by plant technology) 9 - 4
Page vi
9.7 Air Emissions - Base Case Scenario 9 - 5 10.1 Comparison with LTGEP 2010 – Base Case 10 - 5 Ad.1 Revised Base Case Plan 11- 1 Ad.2 System Capacity Distribution for the Revised Base Case and Cumulative Capacity by Plant type 11 - 2 Ad.3 Capacity Balance for the Revised Base Case 11 - 3 Ad.4 Energy Balance for the Revised Base Case 11 - 4 Ad.5 Annual Energy Generation and Plant Factors for the Revised Base Case 11 - 4
LIST OF FIGURES Page 1.1 Growth Rates of GDP and Electricity Sales 1 - 2 1.2 Share of Gross Primary Energy Supply by Source 1 - 3 1.3 Gross Energy Consumption by Sectors including Non-Commercial Sources 1 - 4 1.4 Level of Electrification 1 - 5 1.5 Sectorial Consumption of Electricity (2005 - 2015) 1 - 5 1.6 Sectorial- Consumption of Electricity (2011) 1 - 6 1.7 Per Capita Electricity Consumption (2001-2011) 1 - 6 1.8 Installed Capacity and Peak Demand 1 - 7 1.9 Hydro-Thermal Share in the Recent Past 1 - 8 2.1 Location of Existing, Committed and Candidate Power Stations 2 - 3 2.2 Potential of Hydro power system from past 50 years hydrological data 2 - 6 2.3 Monthly average hydro energy and capacity variation 2 - 7 3.1 Past Losses and Forecast loss (Net) 3 - 2
3.2 Linear trend in the Load factor 3 - 2
3.3 Change in Daily Load Curve Over the Years 3 - 2 3.4 Consumption Share Among Different Consumer Categories 3 - 3 3.5 Generation and Peak Load Forecasts of demand forecast scenarios 3 - 7 4.1 Specific cost at different capacities of the hydro projects 4 - 3 7.1 Cumulative Capacity by Plant type in Base Case 7 - 4 7.2 Capacity Mix over next 20 years in Base Case 7 - 5 7.3 Capacity Wise Renewable Contribution over next 20 years 7 - 5 7.4 Energy Mix over next 20 years in Base Case 7 - 6 7.5 Percentage Share of Energy Mix over next 20 years in Base Case 7 - 6 7.6 Renewable Contribution over next 20 years in based on energy resources 7 - 7 7.7 Percentage Share of Renewables over next 20 years in Base Case 7 - 7 7.8 Fuel Requirement in Base Case 7 - 8 7.9 Variation of Reserve Margin and LOLP in Base Case 7 - 9 7.10 The Capacity Additions in Low, Intermediate High and Base Demand Cases 7- 10 7.11 Fuel Requirements in Low, Intermediate High and Base demand cases 7- 10 7.12 Capacity Mix of High NCRE, Coal Restricted, Coal limited (60%) & Base case 7- 13 7.13 Fuel requirement of High NCRE, Coal Restricted, Coal limited (60%) & Base case 7- 14 8.1 Implementation Plan 2013 - 2032 8 - 3
Page vii
8.2 Investment Plan for Base Case 2013 - 2032 8 - 4 8.3 Investment Requirement in Scenarios 8 - 5 9.1 Comparison of Ambient Air Quality Standards 9 - 2
9.2 SOx, NOx, Particulate and CO2 Emissions 9 - 6 9.3 CO2, SOx and NOx Emissions per kWh Generated 9 - 6 9.4 SOx Emissions 9 - 7
9.5 NOx Emissions 9 - 8 9.6 CO2 Emissions 9 - 9
9.7 Particulate Emissions 9 - 9 9.8 Comparison of System cost with CO2 Emissions 9- 10
10.1(a) Comparison of 2010 and 2012 Energy Demand Forecasts 10 - 1 10.1(b ) Comparison of 2010 and 2012 Peak Demand Forecast 10 - 2 10.2 Comparison of Installed Capacity addition between LTGEP (2010) and Current Plan 10 - 2 10.3 Capacity Mix 10 - 3 10.4 Energy Mix 10 - 3 10.5 SOx and NOx emissions 10 - 3
10.6 CO2 and Particulate Emissions 10 - 4 10.7 Review of Fuel Prices 10 - 4 10.8 Review of Fuel Quantities 10 - 4
ACRONYMS
ADB - Asian Development Bank BOO - Build, Own and Operate CCY - Combined Cycle Power Plant CEA - Central Environmental Authority CEB - Ceylon Electricity Board CECB - Central Engineering Consultancy Bureau CIDA - Canadian International Development Agency CIF - Cost, Insurance and Freight CPC - Ceylon Petroleum Corporation DSM - Demand Side Management EIA - Environmental Impact Assessment ENPEP - Energy and Power Evaluation Package ENS - Energy Not Served EOI - Expression Of Interest EWE - Electrowatt Engineering FGD - Flue Gas Desulphurization FOR - Forced Outage Rate GDP - Gross Domestic Product GHG - Green House Gases GIS - Geographic Information System GT - Gas Turbine
Page viii
HHV - Higher Heating Value IAEA - International Atomic Energy Agency IDC - Interest During Construction IEA - International Energy Agency IPCC - Inter-Governmental Panel on Climate Change IPP - Independent Power Producer ITDG - Intermediate Technology Development Group JBIC - Japan Bank for International Cooperation JICA - Japan International Cooperation Agency LKR - Sri Lanka Rupees
KPS - Kelanatissa Power Station LDC - Load Duration Curve LF - Load Factor LNG - Liquefied Natural Gas LOLP - Loss Of Load Probability LTGEP - Long Term Generation Expansion Plan OECF - Overseas Economic Co-operation Fund O&M - Operation and Maintenance OTEC - Ocean Thermal Energy Conversion NCRE - Non Conventional Renewable Energy PF - Plant Factor PPA - Power Purchase Agreement PV - Present Value RFP - Request For Proposals SYSIM - SYstem SImulation Model USAID - United States Agency for International Development US$ - American Dollars
WASP - Wien Automatic System Planning Package
WB - World Bank
WHO - World Health Organization
CDM - Clean Development Mechanism
CER - Certified Emission Reduction
Generation Expansion Plan – 2012 E-1
EXECUTIVE SUMMARY
The Ceylon Electricity Board (CEB) is under a statutory duty to develop and maintain an
efficient, coordinated and economical system of Electricity Supply for the whole of Sri Lanka.
Therefore, CEB is required to generate or acquire sufficient amount of electricity to satisfy the
demand. CEB methodically plans its development activities in order to provide reliable, quality
electricity to the entire nation at affordable prices.
This report presents the Generation Expansion Planning Studies carried out by the Transmission
and Generation Planning Branch of the Ceylon Electricity Board for the period 2013-2032. The
Report also includes information on the existing generation system, generation planning
methodology, system demand forecast and investment and implementation plans for the
proposed projects and recommends the adoption of the least cost plant sequence derived for the
base case and also emphasizes the need to implement the plan to avoid energy shortfalls. The
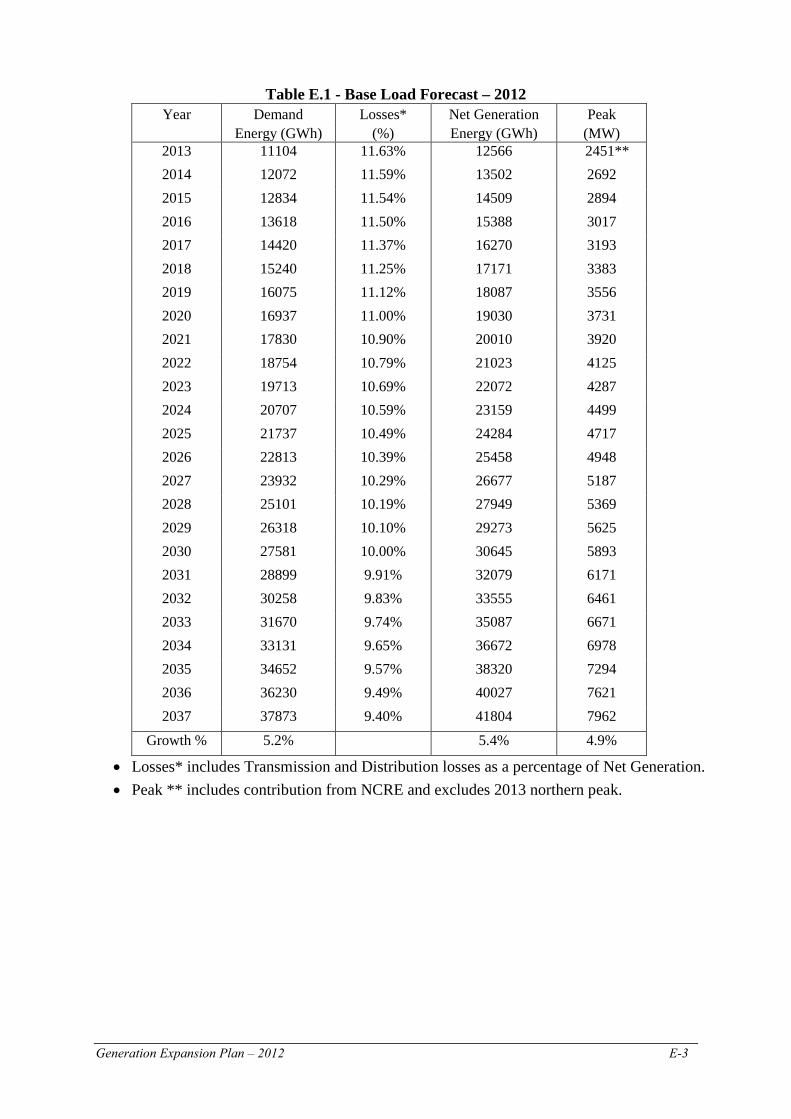
Load Forecast used is given in Table E-1.
The methodology adopted in the studies optimally selects plant additions from given thermal as
well as hydropower generation expansion candidates, which will, together with existing and
committed power plants meet the forecast electricity demand with a given level of reliability
complying with Mahinda Chinthana - Future Vision and National Energy Policy (2006).
Possible electricity demand growth variations, the impact on variation in discount rate and fuel
price have been considered in the sensitivity studies. Each plant sequence presented in this report
is the least cost plant sequence for the given scenario. The candidate thermal power options
considered in the study were coal-fired and fuel oil-fired conventional steam plants, LNG fired
combined cycle plants, Nuclear power plants, diesel-fired gas turbines and combined cycle
plants. The proposed hydroelectric plants at Gin Ganga (49MW) and Moragolla (27MW) were
also considered as candidate plants. Committed thermal power plants are 20MW Northern
Power in 2014, 24MW Chunnakam Power Plant (Extension) in 2014, 1x300MW of Puttalam
Coal fired Power Plant (Stage - II) in 2014 and 1x 300MW of Puttalam Coal fired Power Plant
(Stage - III) in 2015. 35MW Broadlands Hydro Power Plant and 120MW Uma Oya Hydro
Power Plant were considered as committed in 2016.
The earliest possible date for commissioning of candidate coal-fired power plants was taken as
2018 considering the present progress of the Trincomalee Coal Power Project. The other
candidate coal-fired power plants were considered only after Trincomalee site was developed to
E-2 Generation Expansion Plan - 2012
500MW.The earliest possible dates for commissioning of gas turbine and combined cycle plant
were taken as 2015 and 2017 respectively.
In the Base Case Plan, the contribution from NCRE too was considered and the different NCRE
technologies were modeled appropriately.
The viability of introducing LNG fired power plants was also studied. The LNG fuel option was
considered with terminal cost and without terminal cost for the present LNG fuel prices to
determine the breakeven price for LNG. LNG fuel prices are not economically competitive with
the current coal prices. However, it will have to be addressed in the Energy Policy of the
Government of Sri Lanka.
In the Base Case Plan, contracts of the IPP plants expired in 2012 have been considered for
renewal for 5 years until January 2018. The economic viability of renewing these IPP
contracts were studied based on the proposals submitted by the respective power plant
operators. It was found that renewing these IPP contracts for another 5 years is economical.
However, such option could be considered only if a decision is made by the Government to
renew these IPP contracts. In which case, the purchasing price has to be negotiated.
Base Case Plan was revised considering following:
(i) IPP plants; ACE Matara, ACE Horana and Lakdhanavi were not considered for renewal
after retirement.
(ii) 49MW Gin Ganga Hydro Power Plant was advanced to year 2022 from year 2029.
(iii) Coal plant development at Sampoor was limited to 2 x250MW.
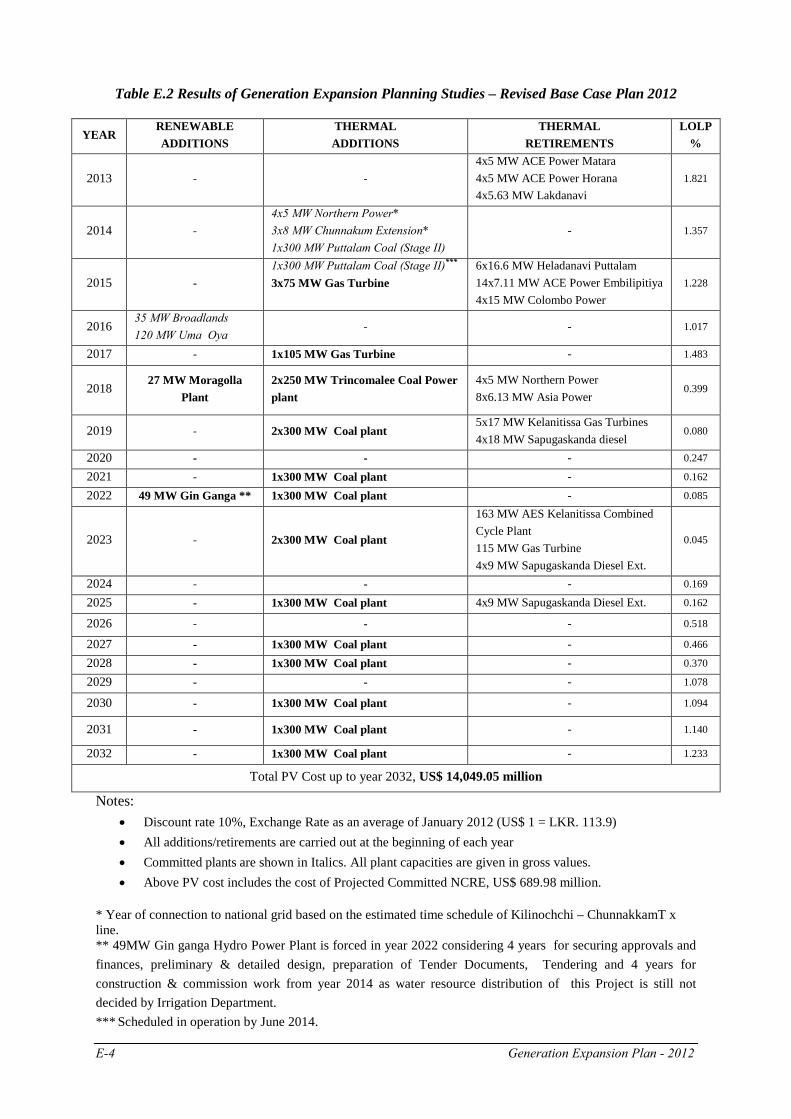
Revised Base Case Plan is given in the Table E.2 and also in the Table Ad.1 of Annex: 11 -
Addendum to the Long Term Generation Expansion Plan. Revised Capacity Balance, Revised
Energy Balance and Revised Dispatch Schedule are given in Addendum Table No: Ad.2,
Addendum Table No: Ad.3 and Addendum Table No: Ad.4 respectively.
Generation Expansion Plan – 2012 E-3
Table E.1 - Base Load Forecast – 2012 Year Demand Losses* Net Generation Peak
Energy (GWh) (%) Energy (GWh) (MW)
2013 11104 11.63% 12566 2451** 2014 12072 11.59% 13502 2692 2015 12834 11.54% 14509 2894 2016 13618 11.50% 15388 3017 2017 14420 11.37% 16270 3193 2018 15240 11.25% 17171 3383 2019 16075 11.12% 18087 3556 2020 16937 11.00% 19030 3731 2021 17830 10.90% 20010 3920 2022 18754 10.79% 21023 4125 2023 19713 10.69% 22072 4287 2024 20707 10.59% 23159 4499 2025 21737 10.49% 24284 4717 2026 22813 10.39% 25458 4948 2027 23932 10.29% 26677 5187 2028 25101 10.19% 27949 5369 2029 26318 10.10% 29273 5625 2030 27581 10.00% 30645 5893 2031 28899 9.91% 32079 6171 2032 30258 9.83% 33555 6461 2033 31670 9.74% 35087 6671 2034 33131 9.65% 36672 6978 2035 34652 9.57% 38320 7294 2036 36230 9.49% 40027 7621 2037 37873 9.40% 41804 7962
Growth % 5.2%
5.4% 4.9%
• Losses* includes Transmission and Distribution losses as a percentage of Net Generation. • Peak ** includes contribution from NCRE and excludes 2013 northern peak.
E-4 Generation Expansion Plan - 2012
Table E.2 Results of Generation Expansion Planning Studies – Revised Base Case Plan 2012
YEAR RENEWABLE ADDITIONS
THERMAL ADDITIONS
THERMAL RETIREMENTS
LOLP %
2013 - - 4x5 MW ACE Power Matara 4x5 MW ACE Power Horana 4x5.63 MW Lakdanavi
1.821
2014 - 4x5 MW Northern Power* 3x8 MW Chunnakum Extension* 1x300 MW Puttalam Coal (Stage II)
- 1.357
2015 - 1x300 MW Puttalam Coal (Stage II)***
3x75 MW Gas Turbine
6x16.6 MW Heladanavi Puttalam 14x7.11 MW ACE Power Embilipitiya 4x15 MW Colombo Power
1.228
2016 35 MW Broadlands 120 MW Uma Oya
- - 1.017
2017 - 1x10⁵ MW Gas Turbine - 1.483
2018 27 MW Moragolla
Plant 2x250 MW Trincomalee Coal Power plant
4x5 MW Northern Power 8x6.13 MW Asia Power
0.399
2019 - 2x300 MW Coal plant 5x17 MW Kelanitissa Gas Turbines 4x18 MW Sapugaskanda diesel
0.080
2020 - - - 0.247
2021 - 1x300 MW Coal plant - 0.162
2022 49 MW Gin Ganga ** 1x300 MW Coal plant - 0.085
2023 - 2x300 MW Coal plant
163 MW AES Kelanitissa Combined Cycle Plant 115 MW Gas Turbine 4x9 MW Sapugaskanda Diesel Ext.
0.045
2024 - - - 0.169
2025 - 1x300 MW Coal plant 4x9 MW Sapugaskanda Diesel Ext. 0.162
2026 - - - 0.518
2027 - 1x300 MW Coal plant - 0.466
2028 - 1x300 MW Coal plant - 0.370
2029 - - - 1.078
2030 - 1x300 MW Coal plant - 1.094
2031 - 1x300 MW Coal plant - 1.140
2032 - 1x300 MW Coal plant - 1.233
Total PV Cost up to year 2032, US$ 14,049.05 million
Notes: • Discount rate 10%, Exchange Rate as an average of January 2012 (US$ 1 = LKR. 113.9) • All additions/retirements are carried out at the beginning of each year • Committed plants are shown in Italics. All plant capacities are given in gross values. • Above PV cost includes the cost of Projected Committed NCRE, US$ 689.98 million.
* Year of connection to national grid based on the estimated time schedule of Kilinochchi – ChunnakkamT x line. ** 49MW Gin ganga Hydro Power Plant is forced in year 2022 considering 4 years for securing approvals and finances, preliminary & detailed design, preparation of Tender Documents, Tendering and 4 years for construction & commission work from year 2014 as water resource distribution of this Project is still not decided by Irrigation Department. *** Scheduled in operation by June 2014.
Generation Expansion Plan – 2012 E-5
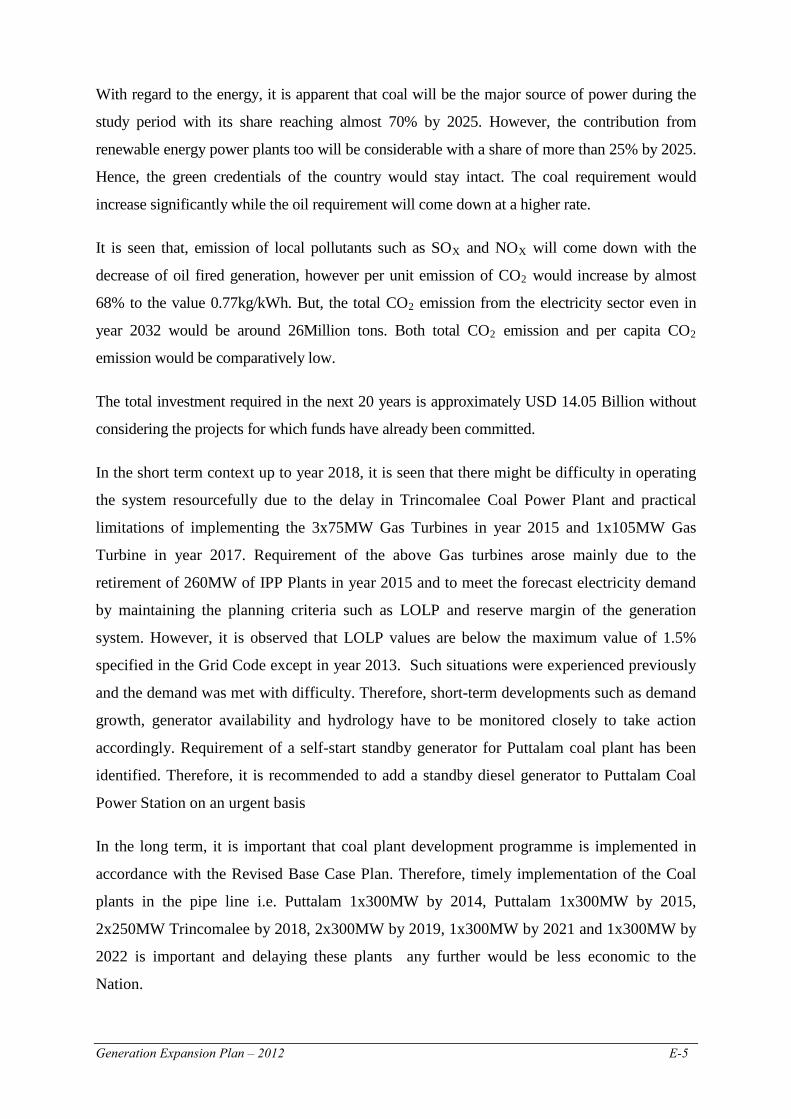
With regard to the energy, it is apparent that coal will be the major source of power during the
study period with its share reaching almost 70% by 2025. However, the contribution from
renewable energy power plants too will be considerable with a share of more than 25% by 2025.
Hence, the green credentials of the country would stay intact. The coal requirement would
increase significantly while the oil requirement will come down at a higher rate.
It is seen that, emission of local pollutants such as SOX and NOX will come down with the
decrease of oil fired generation, however per unit emission of CO2 would increase by almost
68% to the value 0.77kg/kWh. But, the total CO2 emission from the electricity sector even in
year 2032 would be around 26Million tons. Both total CO2 emission and per capita CO2
emission would be comparatively low.
The total investment required in the next 20 years is approximately USD 14.05 Billion without
considering the projects for which funds have already been committed.
In the short term context up to year 2018, it is seen that there might be difficulty in operating
the system resourcefully due to the delay in Trincomalee Coal Power Plant and practical
limitations of implementing the 3x75MW Gas Turbines in year 2015 and 1x10⁵MW Gas
Turbine in year 2017. Requirement of the above Gas turbines arose mainly due to the
retirement of 260MW of IPP Plants in year 2015 and to meet the forecast electricity demand
by maintaining the planning criteria such as LOLP and reserve margin of the generation
system. However, it is observed that LOLP values are below the maximum value of 1.5%
specified in the Grid Code except in year 2013. Such situations were experienced previously
and the demand was met with difficulty. Therefore, short-term developments such as demand
growth, generator availability and hydrology have to be monitored closely to take action
accordingly. Requirement of a self-start standby generator for Puttalam coal plant has been
identified. Therefore, it is recommended to add a standby diesel generator to Puttalam Coal
Power Station on an urgent basis
In the long term, it is important that coal plant development programme is implemented in
accordance with the Revised Base Case Plan. Therefore, timely implementation of the Coal
plants in the pipe line i.e. Puttalam 1x300MW by 2014, Puttalam 1x300MW by 2015,
2x250MW Trincomalee by 2018, 2x300MW by 2019, 1x300MW by 2021 and 1x300MW by
2022 is important and delaying these plants any further would be less economic to the
Nation.
E-6 Generation Expansion Plan - 2012
49MW Gin Ganga was forced in year 2022. However, development option of this Project has
still not been finalized by the Irrigation Department.
Three scenarios were carried out restricting the implementation of coal power plants. In one
scenario, coal plants were not allowed after year 2025. In the second scenario, coal plants were
not allowed after 1000MW development at Trincomalee in 2019. In the third scenario, coal
power development was restricted to 60% of the total generation throughout the study period. In
all three scenarios, LNG power plants were selected and required to bridge the gap since
development of coal power plants were restricted.
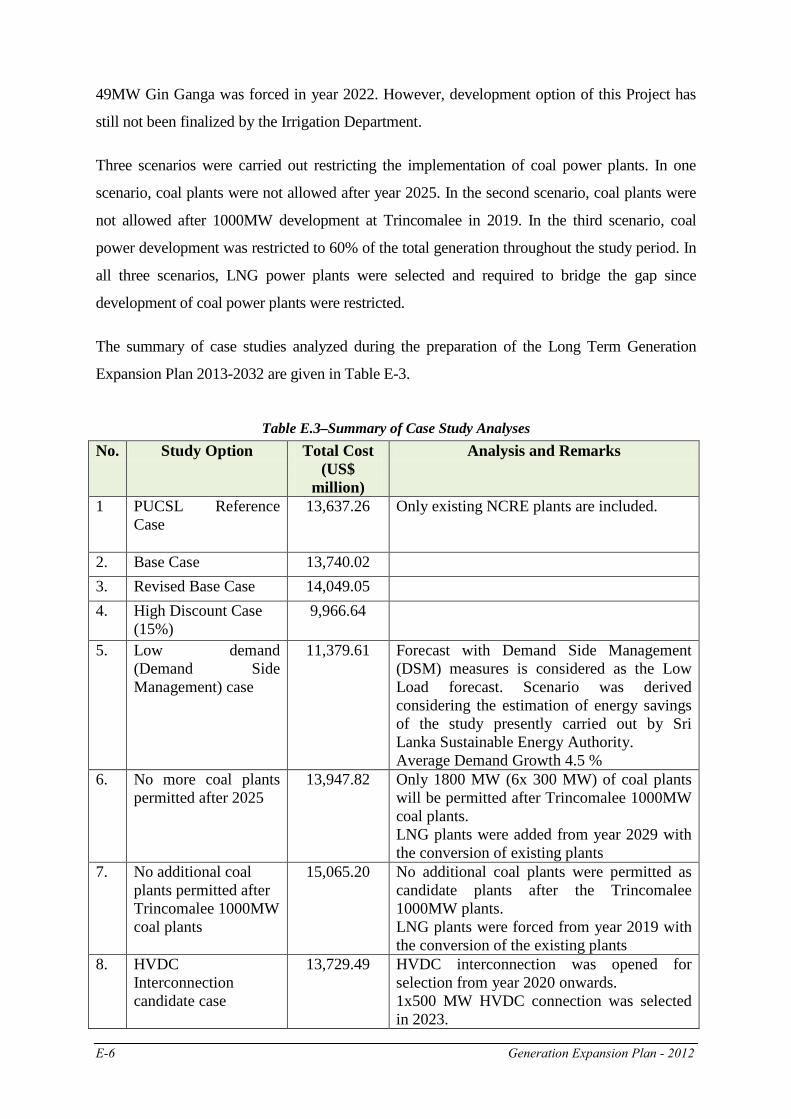
The summary of case studies analyzed during the preparation of the Long Term Generation
Expansion Plan 2013-2032 are given in Table E-3.
Table E.3–Summary of Case Study Analyses No. Study Option Total Cost
(US$ million)
Analysis and Remarks
1 PUCSL Reference Case
13,637.26 Only existing NCRE plants are included.
2. Base Case 13,740.02 3. Revised Base Case 14,049.05 4. High Discount Case
(15%) 9,966.64
5. Low demand (Demand Side Management) case
11,379.61 Forecast with Demand Side Management (DSM) measures is considered as the Low Load forecast. Scenario was derived considering the estimation of energy savings of the study presently carried out by Sri Lanka Sustainable Energy Authority. Average Demand Growth 4.5 %
6. No more coal plants permitted after 2025
13,947.82 Only 1800 MW (6x 300 MW) of coal plants will be permitted after Trincomalee 1000MW coal plants. LNG plants were added from year 2029 with the conversion of existing plants
7. No additional coal plants permitted after Trincomalee 1000MW coal plants
15,065.20 No additional coal plants were permitted as candidate plants after the Trincomalee 1000MW plants. LNG plants were forced from year 2019 with the conversion of the existing plants
8. HVDC Interconnection candidate case
13,729.49 HVDC interconnection was opened for selection from year 2020 onwards. 1x500 MW HVDC connection was selected in 2023.
Generation Expansion Plan – 2012 E-7
No. Study Option Total Cost (US$
million)
Analysis and Remarks
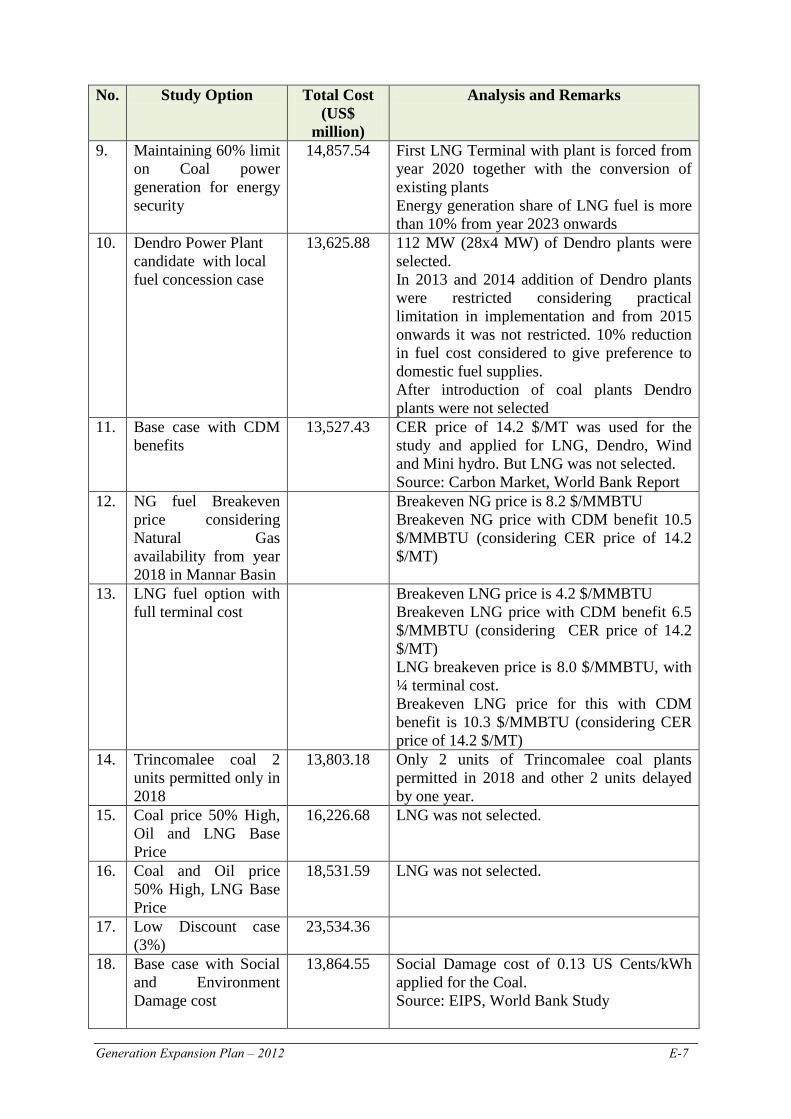
9. Maintaining 60% limit on Coal power generation for energy security
14,857.54 First LNG Terminal with plant is forced from year 2020 together with the conversion of existing plants Energy generation share of LNG fuel is more than 10% from year 2023 onwards
10. Dendro Power Plant candidate with local fuel concession case
13,625.88 112 MW (28x4 MW) of Dendro plants were selected. In 2013 and 2014 addition of Dendro plants were restricted considering practical limitation in implementation and from 2015 onwards it was not restricted. 10% reduction in fuel cost considered to give preference to domestic fuel supplies. After introduction of coal plants Dendro plants were not selected
11. Base case with CDM benefits
13,527.43 CER price of 14.2 $/MT was used for the study and applied for LNG, Dendro, Wind and Mini hydro. But LNG was not selected. Source: Carbon Market, World Bank Report
12. NG fuel Breakeven price considering Natural Gas availability from year 2018 in Mannar Basin
Breakeven NG price is 8.2 $/MMBTU Breakeven NG price with CDM benefit 10.5 $/MMBTU (considering CER price of 14.2 $/MT)
13. LNG fuel option with full terminal cost
Breakeven LNG price is 4.2 $/MMBTU Breakeven LNG price with CDM benefit 6.5 $/MMBTU (considering CER price of 14.2 $/MT) LNG breakeven price is 8.0 $/MMBTU, with ¼ terminal cost. Breakeven LNG price for this with CDM benefit is 10.3 $/MMBTU (considering CER price of 14.2 $/MT)
14. Trincomalee coal 2 units permitted only in 2018
13,803.18 Only 2 units of Trincomalee coal plants permitted in 2018 and other 2 units delayed by one year.
15. Coal price 50% High, Oil and LNG Base Price
16,226.68 LNG was not selected.
16. Coal and Oil price 50% High, LNG Base Price
18,531.59 LNG was not selected.
17. Low Discount case (3%)
23,534.36
18. Base case with Social and Environment Damage cost
13,864.55 Social Damage cost of 0.13 US Cents/kWh applied for the Coal. Source: EIPS, World Bank Study
E-8 Generation Expansion Plan - 2012
No. Study Option Total Cost (US$
million)
Analysis and Remarks
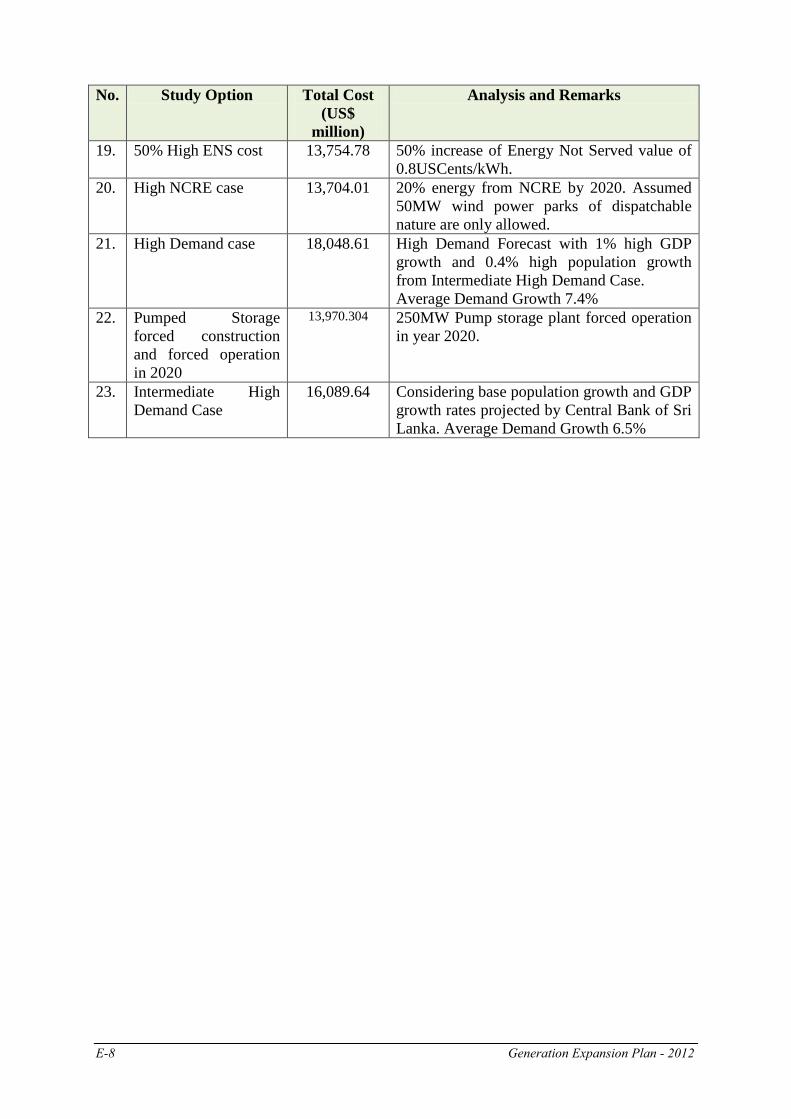
19. 50% High ENS cost 13,754.78 50% increase of Energy Not Served value of 0.8USCents/kWh.
20. High NCRE case 13,704.01 20% energy from NCRE by 2020. Assumed 50MW wind power parks of dispatchable nature are only allowed.
21. High Demand case 18,048.61 High Demand Forecast with 1% high GDP growth and 0.4% high population growth from Intermediate High Demand Case. Average Demand Growth 7.4%
22. Pumped Storage forced construction and forced operation in 2020
13,970.304 250MW Pump storage plant forced operation in year 2020.
23. Intermediate High Demand Case
16,089.64 Considering base population growth and GDP growth rates projected by Central Bank of Sri Lanka. Average Demand Growth 6.5%
Generation Expansion Plan – 2012 Page 1-1
CHAPTER 1
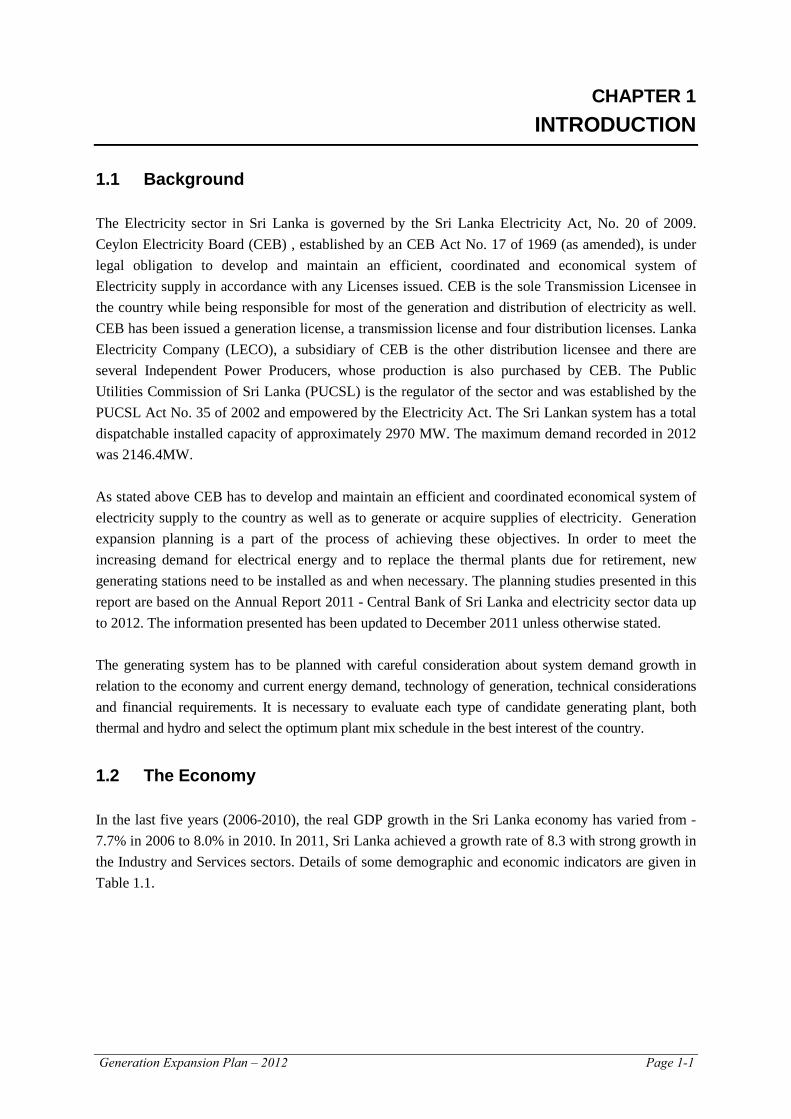
INTRODUCTION 1.1 Background The Electricity sector in Sri Lanka is governed by the Sri Lanka Electricity Act, No. 20 of 2009. Ceylon Electricity Board (CEB) , established by an CEB Act No. 17 of 1969 (as amended), is under legal obligation to develop and maintain an efficient, coordinated and economical system of Electricity supply in accordance with any Licenses issued. CEB is the sole Transmission Licensee in the country while being responsible for most of the generation and distribution of electricity as well. CEB has been issued a generation license, a transmission license and four distribution licenses. Lanka Electricity Company (LECO), a subsidiary of CEB is the other distribution licensee and there are several Independent Power Producers, whose production is also purchased by CEB. The Public Utilities Commission of Sri Lanka (PUCSL) is the regulator of the sector and was established by the PUCSL Act No. 35 of 2002 and empowered by the Electricity Act. The Sri Lankan system has a total dispatchable installed capacity of approximately 2970 MW. The maximum demand recorded in 2012 was 2146.4MW. As stated above CEB has to develop and maintain an efficient and coordinated economical system of electricity supply to the country as well as to generate or acquire supplies of electricity. Generation expansion planning is a part of the process of achieving these objectives. In order to meet the increasing demand for electrical energy and to replace the thermal plants due for retirement, new generating stations need to be installed as and when necessary. The planning studies presented in this report are based on the Annual Report 2011 - Central Bank of Sri Lanka and electricity sector data up to 2012. The information presented has been updated to December 2011 unless otherwise stated. The generating system has to be planned with careful consideration about system demand growth in relation to the economy and current energy demand, technology of generation, technical considerations and financial requirements. It is necessary to evaluate each type of candidate generating plant, both thermal and hydro and select the optimum plant mix schedule in the best interest of the country. 1.2 The Economy In the last five years (2006-2010), the real GDP growth in the Sri Lanka economy has varied from -7.7% in 2006 to 8.0% in 2010. In 2011, Sri Lanka achieved a growth rate of 8.3 with strong growth in the Industry and Services sectors. Details of some demographic and economic indicators are given in Table 1.1.
Page 1-2 Generation Expansion Plan – 2012
Table 1.1- Demographic and Economic Indicators of Sri Lanka
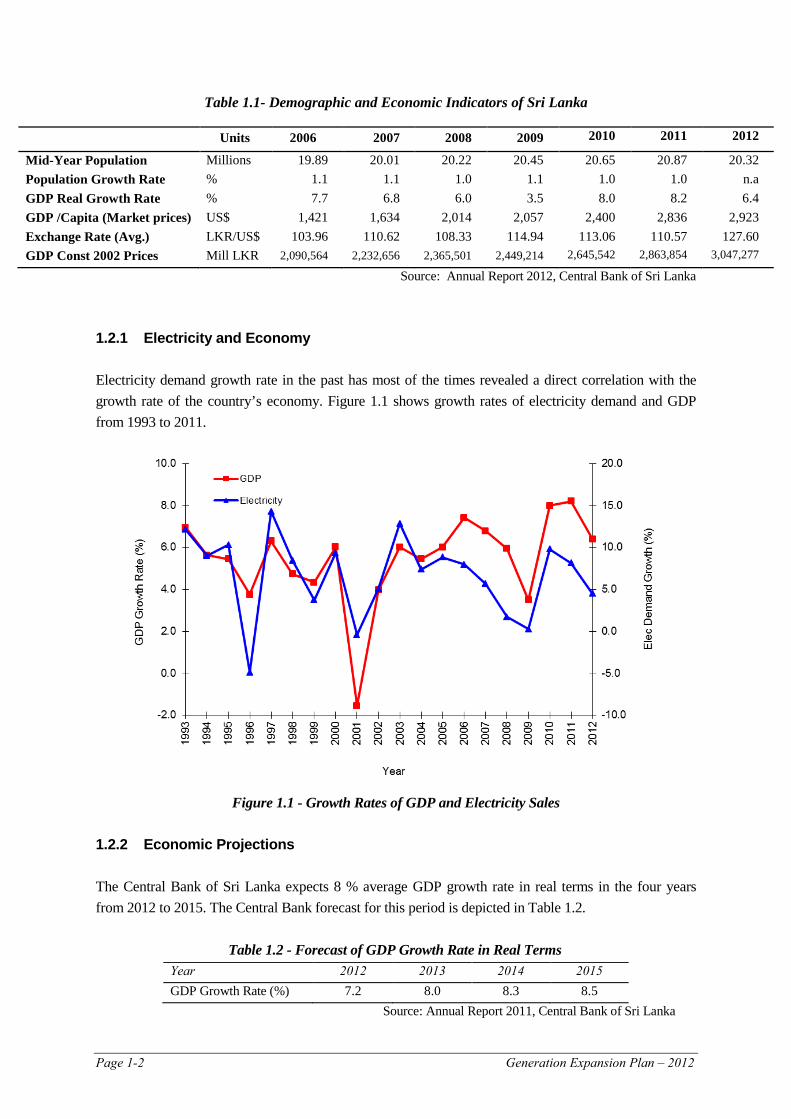
Source: Annual Report 2012, Central Bank of Sri Lanka 1.2.1 Electricity and Economy Electricity demand growth rate in the past has most of the times revealed a direct correlation with the growth rate of the country’s economy. Figure 1.1 shows growth rates of electricity demand and GDP from 1993 to 2011.
Figure 1.1 - Growth Rates of GDP and Electricity Sales
1.2.2 Economic Projections The Central Bank of Sri Lanka expects 8 % average GDP growth rate in real terms in the four years from 2012 to 2015. The Central Bank forecast for this period is depicted in Table 1.2.
Table 1.2 - Forecast of GDP Growth Rate in Real Terms
Year 2012 2013 2014 2015 GDP Growth Rate (%) 7.2 8.0 8.3 8.5
Source: Annual Report 2011, Central Bank of Sri Lanka
Units 2006 2007 2008 2009 2010 2011 2012
Mid-Year Population Millions 19.89 20.01 20.22 20.45 20.65 20.87 20.32 Population Growth Rate % 1.1 1.1 1.0 1.1 1.0 1.0 n.a GDP Real Growth Rate % 7.7 6.8 6.0 3.5 8.0 8.2 6.4 GDP /Capita (Market prices) US$ 1,421 1,634 2,014 2,057 2,400 2,836 2,923 Exchange Rate (Avg.) LKR/US$ 103.96 110.62 108.33 114.94 113.06 110.57 127.60 GDP Const 2002 Prices Mill LKR 2,090,564 2,232,656 2,365,501 2,449,214 2,645,542 2,863,854 3,047,277
Generation Expansion Plan – 2012 Page 1-3
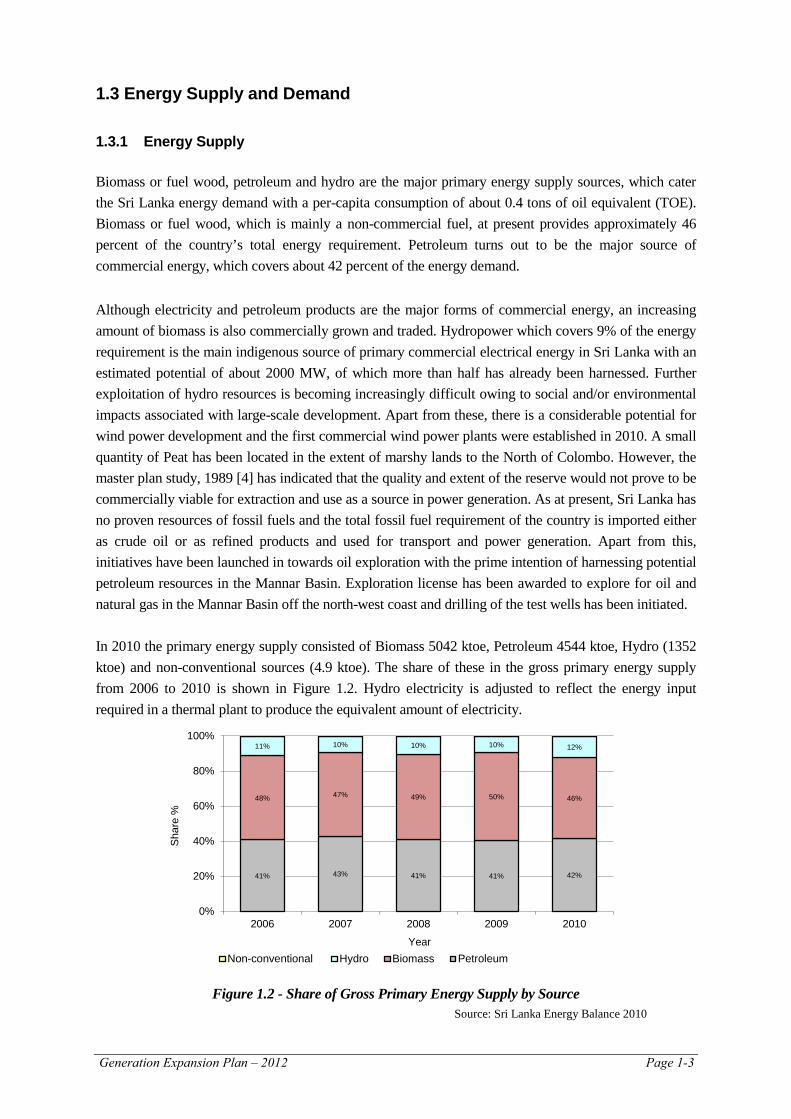
1.3 Energy Supply and Demand 1.3.1 Energy Supply Biomass or fuel wood, petroleum and hydro are the major primary energy supply sources, which cater the Sri Lanka energy demand with a per-capita consumption of about 0.4 tons of oil equivalent (TOE). Biomass or fuel wood, which is mainly a non-commercial fuel, at present provides approximately 46 percent of the country’s total energy requirement. Petroleum turns out to be the major source of commercial energy, which covers about 42 percent of the energy demand. Although electricity and petroleum products are the major forms of commercial energy, an increasing amount of biomass is also commercially grown and traded. Hydropower which covers 9% of the energy requirement is the main indigenous source of primary commercial electrical energy in Sri Lanka with an estimated potential of about 2000 MW, of which more than half has already been harnessed. Further exploitation of hydro resources is becoming increasingly difficult owing to social and/or environmental impacts associated with large-scale development. Apart from these, there is a considerable potential for wind power development and the first commercial wind power plants were established in 2010. A small quantity of Peat has been located in the extent of marshy lands to the North of Colombo. However, the master plan study, 1989 [4] has indicated that the quality and extent of the reserve would not prove to be commercially viable for extraction and use as a source in power generation. As at present, Sri Lanka has no proven resources of fossil fuels and the total fossil fuel requirement of the country is imported either as crude oil or as refined products and used for transport and power generation. Apart from this, initiatives have been launched in towards oil exploration with the prime intention of harnessing potential petroleum resources in the Mannar Basin. Exploration license has been awarded to explore for oil and natural gas in the Mannar Basin off the north-west coast and drilling of the test wells has been initiated. In 2010 the primary energy supply consisted of Biomass 5042 ktoe, Petroleum 4544 ktoe, Hydro (1352 ktoe) and non-conventional sources (4.9 ktoe). The share of these in the gross primary energy supply from 2006 to 2010 is shown in Figure 1.2. Hydro electricity is adjusted to reflect the energy input required in a thermal plant to produce the equivalent amount of electricity.
Figure 1.2 - Share of Gross Primary Energy Supply by Source
41% 43% 41% 41% 42%
48% 47% 49% 50% 46%
11% 10% 10% 10% 12%
0%
20%
40%
60%
80%
100%
2006 2007 2008 2009 2010
Sha
re %
Year Non-conventional Hydro Biomass Petroleum
Source: Sri Lanka Energy Balance 2010
Page 1-4 Generation Expansion Plan – 2012
1.3.2 Energy Demand
Figure 1.3 - Gross Energy Consumption by Sectors including Non-Commercial Sources
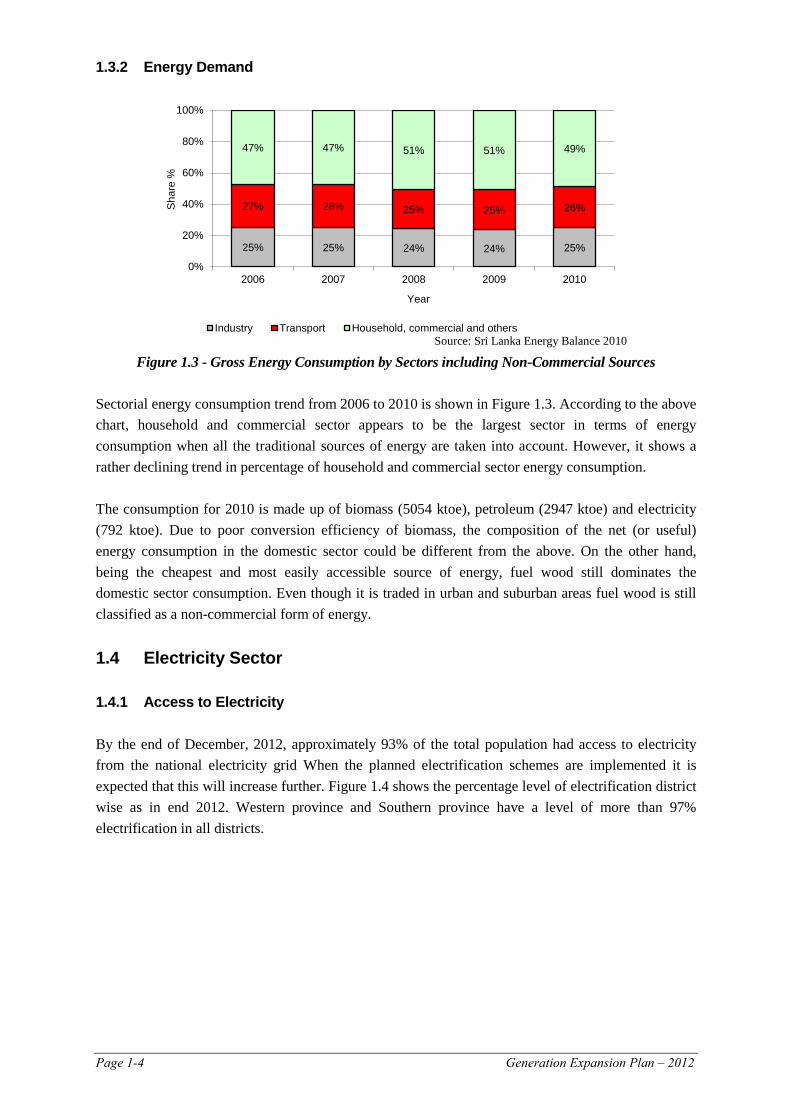
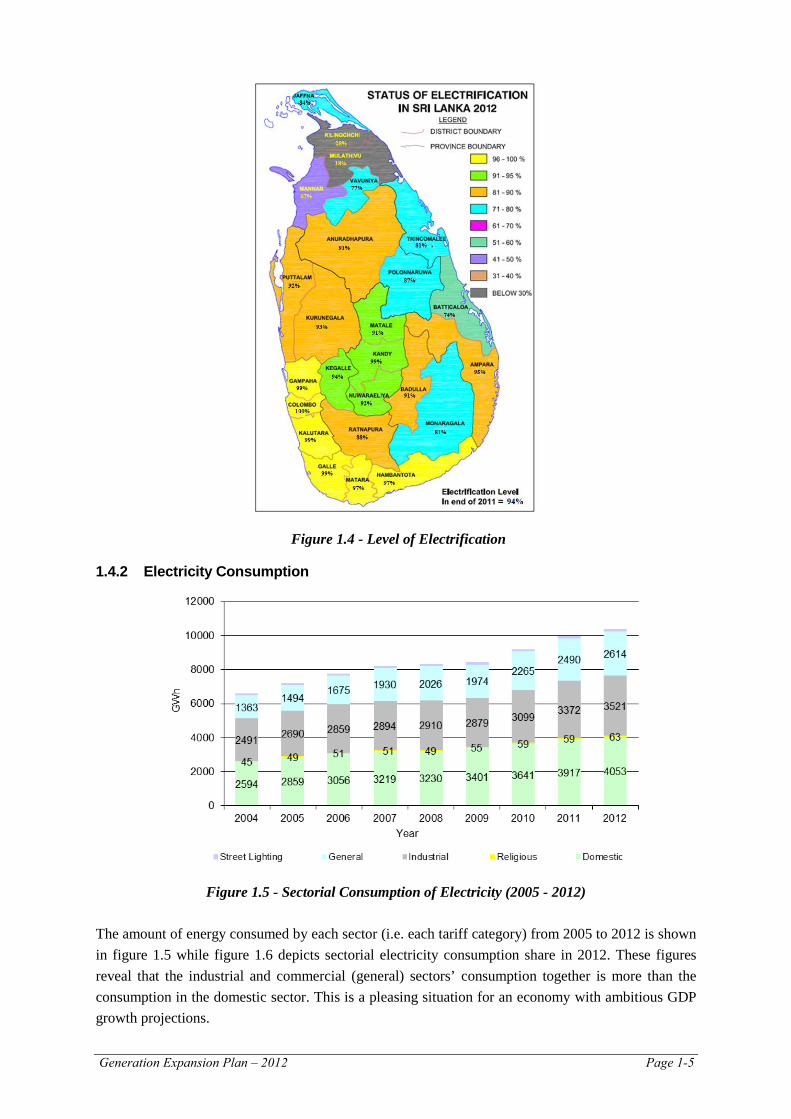
Sectorial energy consumption trend from 2006 to 2010 is shown in Figure 1.3. According to the above chart, household and commercial sector appears to be the largest sector in terms of energy consumption when all the traditional sources of energy are taken into account. However, it shows a rather declining trend in percentage of household and commercial sector energy consumption. The consumption for 2010 is made up of biomass (5054 ktoe), petroleum (2947 ktoe) and electricity (792 ktoe). Due to poor conversion efficiency of biomass, the composition of the net (or useful) energy consumption in the domestic sector could be different from the above. On the other hand, being the cheapest and most easily accessible source of energy, fuel wood still dominates the domestic sector consumption. Even though it is traded in urban and suburban areas fuel wood is still classified as a non-commercial form of energy. 1.4 Electricity Sector 1.4.1 Access to Electricity By the end of December, 2012, approximately 93% of the total population had access to electricity from the national electricity grid When the planned electrification schemes are implemented it is expected that this will increase further. Figure 1.4 shows the percentage level of electrification district wise as in end 2012. Western province and Southern province have a level of more than 97% electrification in all districts.
25% 25% 24% 24% 25%
27% 28% 25% 25% 26%
47% 47% 51% 51% 49%
0%
20%
40%
60%
80%
100%
2006 2007 2008 2009 2010
Sha
re %
Year
Industry Transport Household, commercial and othersSource: Sri Lanka Energy Balance 2010
Generation Expansion Plan – 2012 Page 1-5
1.4.2 Electricity Consumption
Figure 1.5 - Sectorial Consumption of Electricity (2005 - 2012)
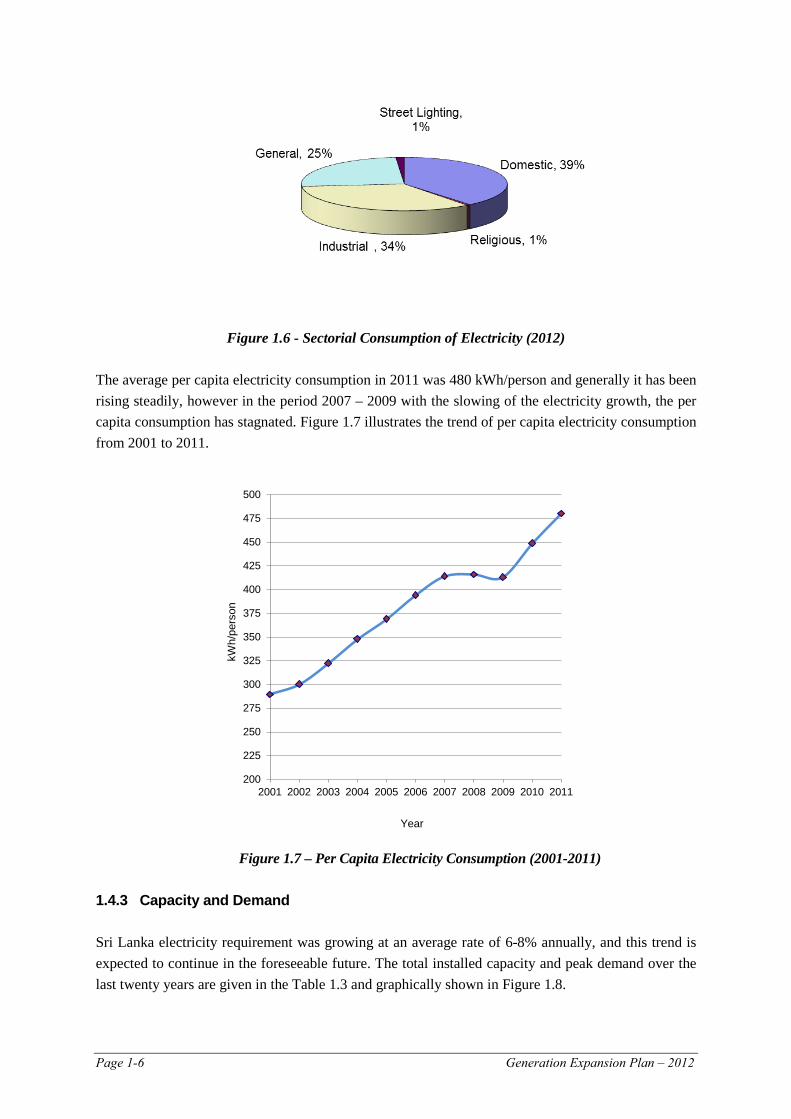
The amount of energy consumed by each sector (i.e. each tariff category) from 2005 to 2012 is shown in figure 1.5 while figure 1.6 depicts sectorial electricity consumption share in 2012. These figures reveal that the industrial and commercial (general) sectors’ consumption together is more than the consumption in the domestic sector. This is a pleasing situation for an economy with ambitious GDP growth projections.
Figure 1.4 - Level of Electrification
Page 1-6 Generation Expansion Plan – 2012
Figure 1.6 - Sectorial Consumption of Electricity (2012)
The average per capita electricity consumption in 2011 was 480 kWh/person and generally it has been rising steadily, however in the period 2007 – 2009 with the slowing of the electricity growth, the per capita consumption has stagnated. Figure 1.7 illustrates the trend of per capita electricity consumption from 2001 to 2011.
Figure 1.7 – Per Capita Electricity Consumption (2001-2011)
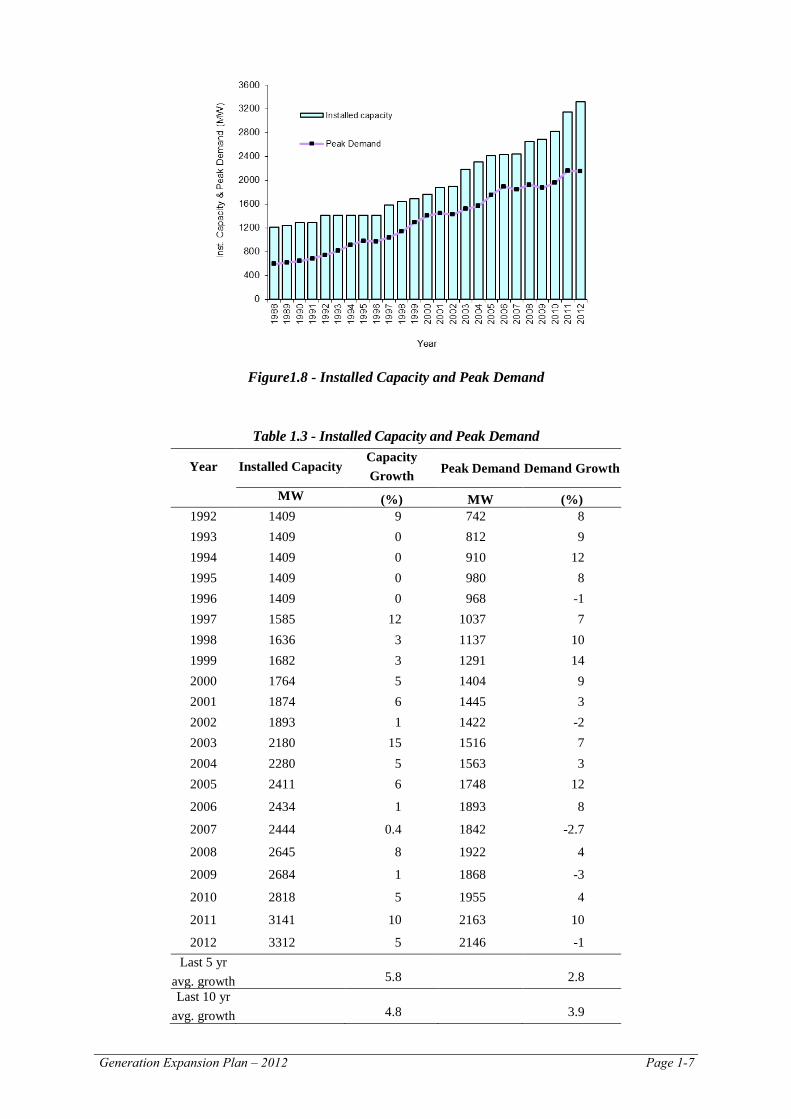
1.4.3 Capacity and Demand Sri Lanka electricity requirement was growing at an average rate of 6-8% annually, and this trend is expected to continue in the foreseeable future. The total installed capacity and peak demand over the last twenty years are given in the Table 1.3 and graphically shown in Figure 1.8.
200
225
250
275
300
325
350
375
400
425
450
475
500
2001 2002 2003 2004 2005 2006 2007 2008 2009 2010 2011
kWh/
pers
on
Year
Generation Expansion Plan – 2012 Page 1-7
Figure1.8 - Installed Capacity and Peak Demand
Table 1.3 - Installed Capacity and Peak Demand
Year Installed Capacity Capacity Growth Peak Demand Demand Growth
MW (%) MW (%) 1992 1409 9 742 8 1993 1409 0 812 9 1994 1409 0 910 12 1995 1409 0 980 8 1996 1409 0 968 -1 1997 1585 12 1037 7 1998 1636 3 1137 10 1999 1682 3 1291 14 2000 1764 5 1404 9 2001 1874 6 1445 3 2002 1893 1 1422 -2 2003 2180 15 1516 7 2004 2280 5 1563 3 2005 2411 6 1748 12
2006 2434 1 1893 8
2007 2444 0.4 1842 -2.7
2008 2645 8 1922 4
2009 2684 1 1868 -3
2010 2818 5 1955 4
2011 3141 10 2163 10
2012 3312 5 2146 -1 Last 5 yr
avg. growth 5.8 2.8 Last 10 yr
avg. growth 4.8 3.9
Page 1-8 Generation Expansion Plan – 2012
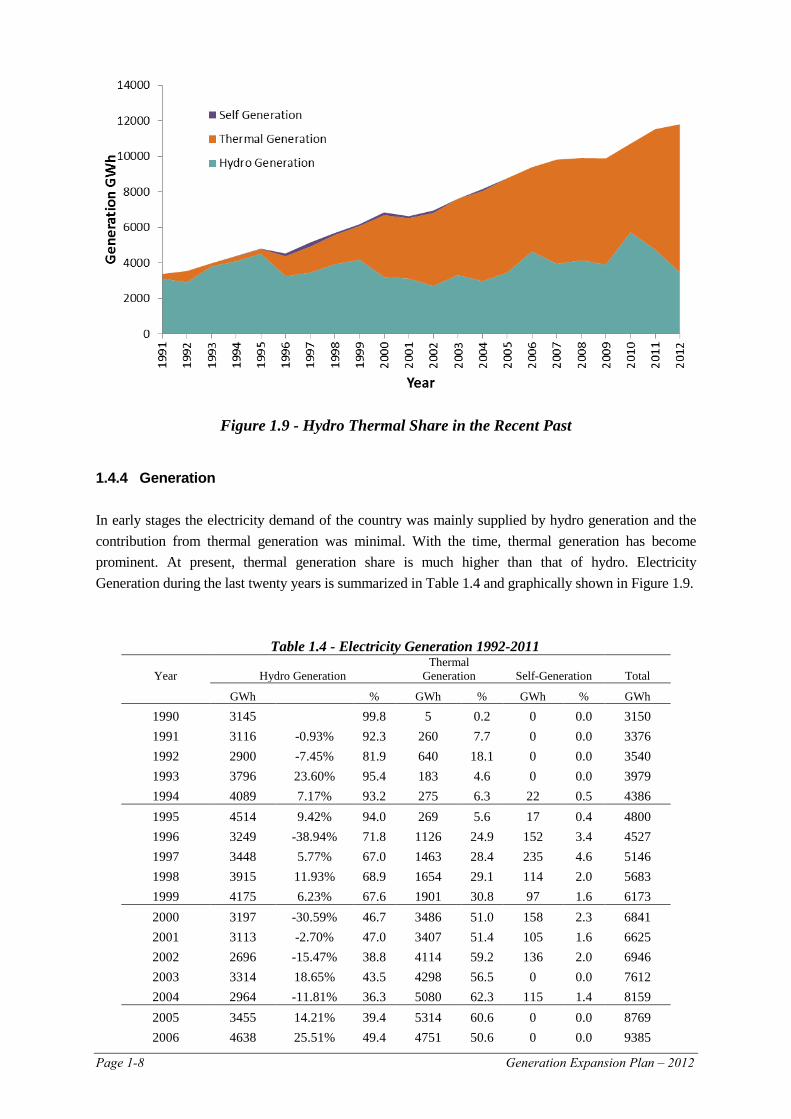
Figure 1.9 - Hydro Thermal Share in the Recent Past
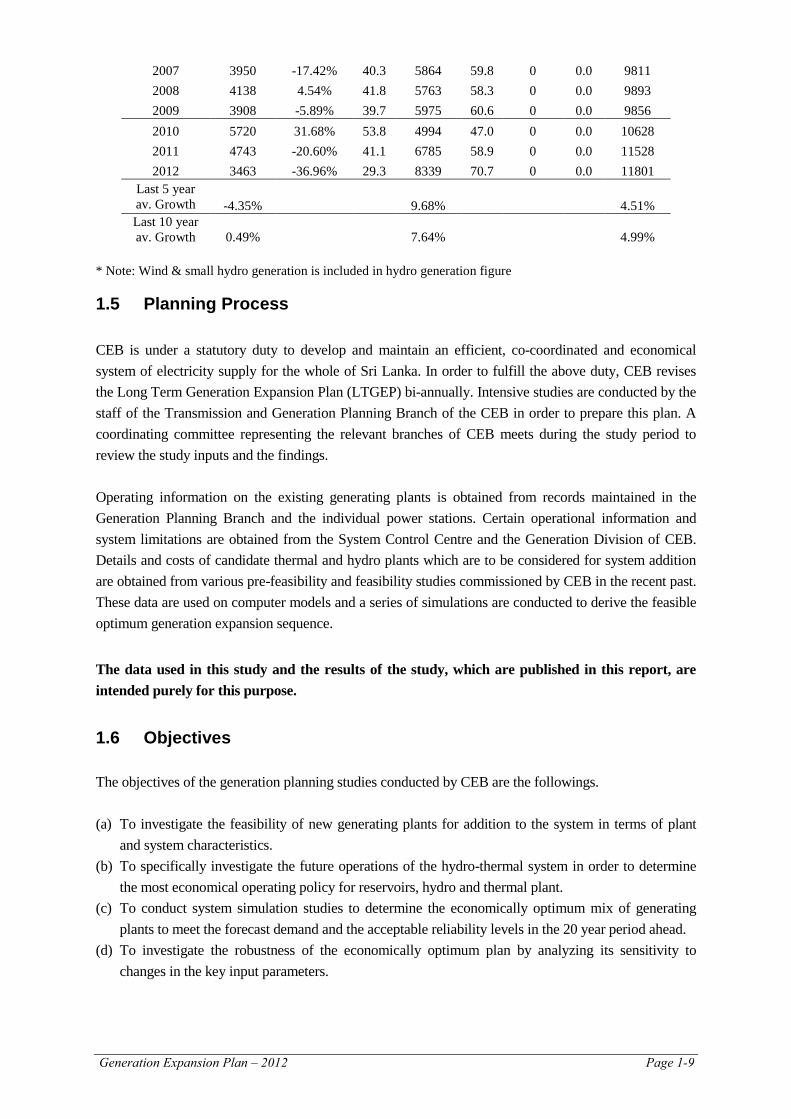
1.4.4 Generation In early stages the electricity demand of the country was mainly supplied by hydro generation and the contribution from thermal generation was minimal. With the time, thermal generation has become prominent. At present, thermal generation share is much higher than that of hydro. Electricity Generation during the last twenty years is summarized in Table 1.4 and graphically shown in Figure 1.9.
Table 1.4 - Electricity Generation 1992-2011
Year Hydro Generation Thermal
Generation Self-Generation Total
GWh % GWh % GWh % GWh
1990 3145 99.8 5 0.2 0 0.0 3150 1991 3116 -0.93% 92.3 260 7.7 0 0.0 3376 1992 2900 -7.45% 81.9 640 18.1 0 0.0 3540 1993 3796 23.60% 95.4 183 4.6 0 0.0 3979 1994 4089 7.17% 93.2 275 6.3 22 0.5 4386 1995 4514 9.42% 94.0 269 5.6 17 0.4 4800 1996 3249 -38.94% 71.8 1126 24.9 152 3.4 4527 1997 3448 5.77% 67.0 1463 28.4 235 4.6 5146 1998 3915 11.93% 68.9 1654 29.1 114 2.0 5683 1999 4175 6.23% 67.6 1901 30.8 97 1.6 6173 2000 3197 -30.59% 46.7 3486 51.0 158 2.3 6841 2001 3113 -2.70% 47.0 3407 51.4 105 1.6 6625 2002 2696 -15.47% 38.8 4114 59.2 136 2.0 6946 2003 3314 18.65% 43.5 4298 56.5 0 0.0 7612 2004 2964 -11.81% 36.3 5080 62.3 115 1.4 8159 2005 3455 14.21% 39.4 5314 60.6 0 0.0 8769 2006 4638 25.51% 49.4 4751 50.6 0 0.0 9385
Generation Expansion Plan – 2012 Page 1-9
2007 3950 -17.42% 40.3 5864 59.8 0 0.0 9811 2008 4138 4.54% 41.8 5763 58.3 0 0.0 9893 2009 3908 -5.89% 39.7 5975 60.6 0 0.0 9856 2010 5720 31.68% 53.8 4994 47.0 0 0.0 10628 2011 4743 -20.60% 41.1 6785 58.9 0 0.0 11528 2012 3463 -36.96% 29.3 8339 70.7 0 0.0 11801
Last 5 year av. Growth -4.35%
9.68%
4.51%
Last 10 year av. Growth 0.49% 7.64% 4.99%
* Note: Wind & small hydro generation is included in hydro generation figure
1.5 Planning Process CEB is under a statutory duty to develop and maintain an efficient, co-coordinated and economical system of electricity supply for the whole of Sri Lanka. In order to fulfill the above duty, CEB revises the Long Term Generation Expansion Plan (LTGEP) bi-annually. Intensive studies are conducted by the staff of the Transmission and Generation Planning Branch of the CEB in order to prepare this plan. A coordinating committee representing the relevant branches of CEB meets during the study period to review the study inputs and the findings. Operating information on the existing generating plants is obtained from records maintained in the Generation Planning Branch and the individual power stations. Certain operational information and system limitations are obtained from the System Control Centre and the Generation Division of CEB. Details and costs of candidate thermal and hydro plants which are to be considered for system addition are obtained from various pre-feasibility and feasibility studies commissioned by CEB in the recent past. These data are used on computer models and a series of simulations are conducted to derive the feasible optimum generation expansion sequence. The data used in this study and the results of the study, which are published in this report, are intended purely for this purpose. 1.6 Objectives The objectives of the generation planning studies conducted by CEB are the followings. (a) To investigate the feasibility of new generating plants for addition to the system in terms of plant
and system characteristics. (b) To specifically investigate the future operations of the hydro-thermal system in order to determine
the most economical operating policy for reservoirs, hydro and thermal plant. (c) To conduct system simulation studies to determine the economically optimum mix of generating
plants to meet the forecast demand and the acceptable reliability levels in the 20 year period ahead. (d) To investigate the robustness of the economically optimum plan by analyzing its sensitivity to
changes in the key input parameters.
Page 1-10 Generation Expansion Plan – 2012
1.7 Organization of the Report The next Chapter, Chapter 2 of the report, presents the existing and committed generation system of Sri Lanka. The past and forecast electricity demand with the forecasting methodology is explained in Chapter 3. Conventional and renewable generation options for the future system expansions are discussed in Chapters 4 and 5 respectively. Chapter 6 explains the Generation expansion planning methodology and the parameters while the expansion planning results are given in Chapter 7. Chapter 8 describes required implementation schedule and financing for the generation projects. Environmental implications of the expansion plan are discussed in Chapter 9 and finally, Chapter 10 provides a comparison of this year plan with the previous plan. 1.8 Codes / Guidelines in Generation Expansion Planning PUCSL in April 2011 issued the Least Cost Generation Expansion Planning Code to CEB and it is part of the Grid Code issued in May 2012 and transmission licensee feedback. Further, the Ministry of Power and Energy issued a set of “Guidelines on Long Term Generation Expansion Planning” in October 2011. Both PUCSL planning code and the Ministry guidelines were considered in preparing the Long Term Generation Expansion Plan 2013-2032.
Generation Expansion Plan-2012 Page 2-1
CHAPTER 2 THE EXISTING AND COMMITTED GENERATING SYSTEM
The existing generating system in the country is mainly owned by CEB with a considerable share owned by the private sector. Until 1996 the total electricity system was owned by CEB. Since 1996, private sector has also participated in power generation. The existing generating system in the country has approximately 2970 MW of installed capacity by end 2012 and additionally non-dispatchable plants of capacity 290MW. The majority of dispatchable capacity is owned by CEB (i.e. about 75% of the total dispatchable capacity), which includes 1355 MW of hydro and 863 MW of thermal generation capacity. Balance dispatchable capacity, which is totally thermal plants, is owned by Independent Power Producers (IPPs). 2.1 Hydro and Other Renewable Power Generation Hydropower is the main renewable source of generation in the Sri Lanka power system and it is mainly owned by CEB. However, other renewable sources such as wind, solar, dendro, and biomass are also connected to the system. These plants including mini hydro are owned by the private sector. 2.1.1 CEB Owned Hydro and Other Renewable Power Plants Most of the comparatively large scale hydro resources in Sri Lanka have been developed by the CEB. At present, hydro projects having capacities below 10 MW (termed mini hydro), are allowed to be developed by private sector as run-of river plants and larger hydro plants are to be developed by the CEB. Since these run-of river type mini hydro plants are non-dispatchable, they are modeled differently from CEB owned hydro plants in the generation expansion planning simulations. The operation and maintenance cost of these CEB hydro power plants was taken as 5.56 US$/kW per annum.
(a) Existing System
The existing CEB generating system is predominantly based on hydropower (i.e., 1355 MW hydro out of 2218 MW of total CEB installed capacity). Approximately 61% of the total existing CEB system capacity is installed in 17 hydro power stations. In 2011, only 35 % of the total energy demand was met by the hydro plants, compared to 47% in 2010. Details of the existing and committed hydro system are given in Table 2.1 and the geographical locations of the Power Stations are shown in the Figure 2.1. The major hydropower schemes already developed are associated with Kelani and Mahaweli river basins. Five hydro power stations with a total installed capacity of 335 MW (25% of the total hydropower capacity) have been built in two cascaded systems associated with the two main tributaries of Kelani River; Kehelgamu Oya and Maskeliya Oya (Laxapana Complex). The five stations in this complex are generally not required to operate for irrigation or other water requirements; hence they are primarily designed to meet the power requirements of the country. Castlereigh and Moussakelle are the major storage reservoirs in the Laxapana hydropower complex located at main tributaries Kehelgamu Oya and Maskeliya Oya respectively. Castlereigh reservoir with a storage of 44.8 MCM feeds the
Page 2-2 Generation Expansion Plan-2012
Wimalasurendra Power Station of capacity 2 x 25 MW at Norton-bridge, while Canyon 2 x 30 MW is fed from the Moussakelle reservoir of storage 123.4 MCM. Similarly in the downstream of these two tributaries, Canyon, Norton and Laxapana ponds having smaller storage capacity feed to New Laxapana, Old Laxapana and Polpitiya power stations respectively.
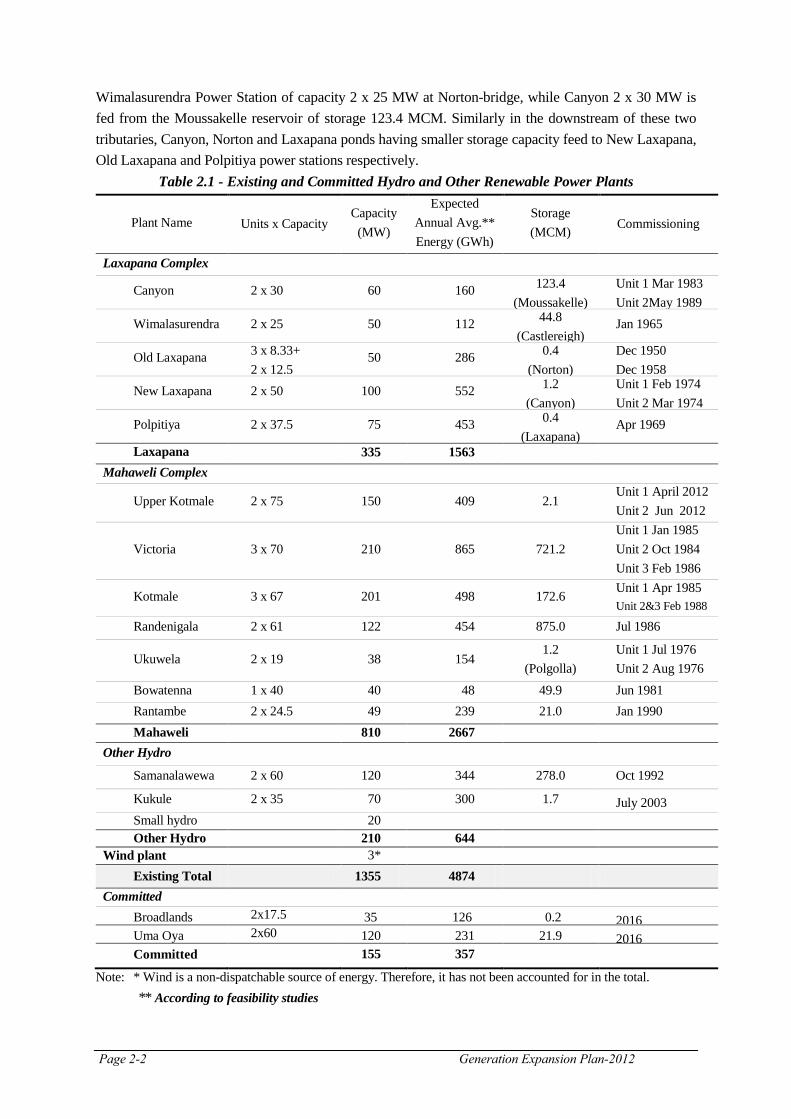
Table 2.1 - Existing and Committed Hydro and Other Renewable Power Plants
Plant Name Units x Capacity Capacity
(MW)
Expected Annual Avg.** Energy (GWh)
Storage (MCM) Commissioning
Laxapana Complex
Canyon 2 x 30 60 160 123.4 (Moussakelle)
Unit 1 Mar 1983 Unit 2May 1989
Wimalasurendra 2 x 25 50 112 44.8 (Castlereigh)
Jan 1965
Old Laxapana 3 x 8.33+ 2 x 12.5
50 286 0.4 (Norton)
Dec 1950 Dec 1958
New Laxapana 2 x 50 100 552 1.2 (Canyon)
Unit 1 Feb 1974 Unit 2 Mar 1974
Polpitiya 2 x 37.5 75 453 0.4 (Laxapana)
Apr 1969
Laxapana
335 1563 Mahaweli Complex
Upper Kotmale 2 x 75 150 409 2.1 Unit 1 April 2012 Unit 2 Jun 2012
Victoria 3 x 70 210 865 721.2 Unit 1 Jan 1985 Unit 2 Oct 1984 Unit 3 Feb 1986
Kotmale 3 x 67 201 498 172.6 Unit 1 Apr 1985 Unit 2&3 Feb 1988
Randenigala 2 x 61 122 454 875.0 Jul 1986
Ukuwela 2 x 19 38 154 1.2
(Polgolla) Unit 1 Jul 1976 Unit 2 Aug 1976
Bowatenna 1 x 40 40 48 49.9 Jun 1981 Rantambe 2 x 24.5 49 239 21.0 Jan 1990 Mahaweli
810 2667
Other Hydro
Samanalawewa 2 x 60 120 344 278.0 Oct 1992
Kukule 2 x 35 70 300 1.7 July 2003 Small hydro 20 Other Hydro
210 644
Wind plant 3* Existing Total 1355 4874
Committed Broadlands 2x17.5 35 126 0.2 2016 Uma Oya 2x60 120 231 21.9 2016 Committed
155 357
Note: * Wind is a non-dispatchable source of energy. Therefore, it has not been accounted for in the total. ** According to feasibility studies
Generation Expansion Plan-2012 Page 2-3
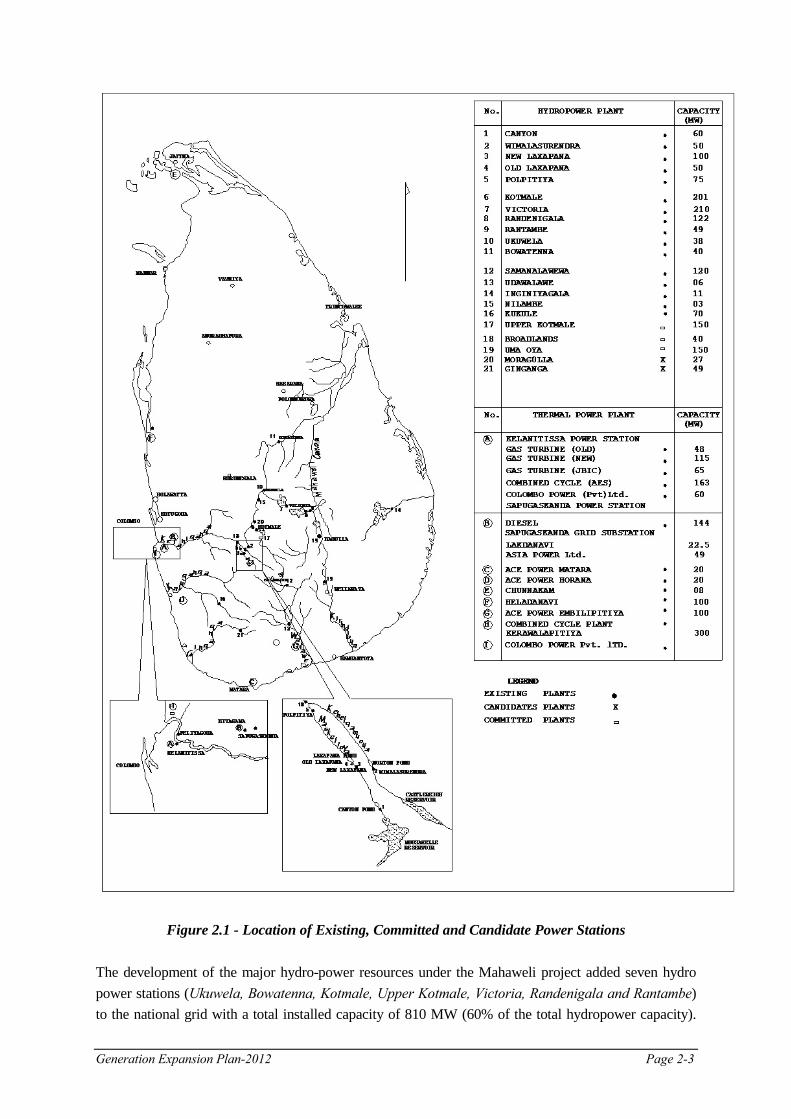
Figure 2.1 - Location of Existing, Committed and Candidate Power Stations The development of the major hydro-power resources under the Mahaweli project added seven hydro power stations (Ukuwela, Bowatenna, Kotmale, Upper Kotmale, Victoria, Randenigala and Rantambe) to the national grid with a total installed capacity of 810 MW (60% of the total hydropower capacity).
Page 2-4 Generation Expansion Plan-2012
Three major reservoirs, Kotmale, Victoria and Randenigala, which were built under the accelerated Mahaweli development program, feed the power stations installed with these reservoirs. In addition, Upper Kotmale hydropower project was conceived with the preparation of a master plan for hydroelectric development in Mahaweli basin in 1968. Further studying the concept in the master plan in 1985-1987, technically and economically feasible two sites were identified. The two sites were a reservoir type development at Caledonia and a run off river type development at Talawakelle. Considering the various social and environmental impacts and by further studying on the original run off river type development at Talawakelle was implemented, Pond which feeds Upper Kotmale hydropower plant (150 MW) is located near Talawakelle on the Kotmale Oya, a tributary of Mahaweli. After generating electricity at Upper Kothmale Power Stationwater is discharged to Kotmale oya. Polgolla - diversion weir (across Mahaweli Ganga), downstream of Kotmale and upstream of Victoria, diverts Mahaweli waters to irrigation systems via Ukuwela power station (38 MW). After generating electricity at Ukuwela power station the water is discharged to Sudu Ganga, upstream of Amban Ganga, which carries water to Bowatenna reservoir. It then feeds both Bowatenna power station (40 MW) and mainly Mahaweli System-H by means of separate waterways. Water discharged through Bowatenna power station goes to Elahera Ela and is available for diversion to Mahaweli systems D and G. The schematic diagrams of the hydro reservoir networks are shown in Annex 2.1. Unlike the Laxapana cascade, the Mahaweli system is operated as a multi-purpose system. Hence power generation from the associated power stations is governed by the down-stream irrigation requirements as well. These requirements being highly seasonal constrain the operation of power stations during certain periods of the year. Samanalawewa hydro power plant of capacity 120 MW was commissioned in 1992. Samanalawewa reservoir, which is on Walawe River and with storage of 278 MCM, feeds this power plant. Kukule power project which was commissioned in 2003, is run-of river type plant located on Kukule Ganga, a tributary of Kalu Ganga. Kukule power plant is 70 MW in capacity and which provides an average of 300 GWh of energy per year. The contribution of the three small hydro plants (Inginiyagala - 11MW, UdaWalawe - 6MW and Nilambe – 3MW) to the National Grid is comparatively small (20MW) and is dependent on irrigation water releases from the respective reservoirs. In addition to the above hydro plants, CEB has a 3 MW wind plant at Hambantota. This project was implemented as a pilot project in order to see the feasibility of wind development in Sri Lanka.
(b) Committed Plants The 35MW Broadlands hydropower project located near Kithulagala on the Maskeliyaoya was considered as a committed plant. The dam site of the project is to be located near Polpitiya power house and in addition to the main dam, there will be a diversion weir across Kehelgamuoya. The project has a 0.2 MCM storage reservoir and it is expected to generate126GWh energy per annum. It will be added to the system in 2016.In addition, 120 MW Uma Oya multipurpose hydro power project was considered as
Generation Expansion Plan-2012 Page 2-5
a committed plant. Under Uma Oya multipurpose hydro power project, two small reservoirs will be built close to Welimada. Where the water from these two reservoirs will be diverted through a tunnel to the underground power house located at Randeniya near Wellawaya. It is expected to generate 231 GWh annual energy and will be added to the system in 2016. This project is implemented by the Ministry of Irrigation and Water Resources. 2.1.2 Hydro and Other Renewable Power Plants Owned by IPPs Government of Sri Lanka has taken a policy decision to develop hydropower plants below 10 MW capacities by the private sector. Many small hydro plants and a few other renewable power plants have been connected to the system since 1996. Total capacity of these plants is approximately 303 MW as at 31st October 2012. These plants are mainly connected to 33 kV distribution lines. CEB has signed standard power purchase agreements for another 249 MW. In this study, a certain capacity and energy from these mini hydro and other non-conventional renewable energy plants were considered in the base case as committed and modeled accordingly. The figures were projected based on expected development according to current project pipeline records. The projected committed development used in this study is given in Table 2.2.
Table 2.2 –Projected Committed Development of NCRE
2.1.3 Capability of Existing Hydropower Plants
The Sri Lankan power system is still highly dependent on hydropower. Hence, it is necessary to assess the energy generating potential of the hydropower system to a high degree of accuracy. However, this assessment is difficult owing to the multipurpose nature of some reservoirs, which have to satisfy the downstream irrigation requirements as well. Further, the climatic conditions of Sri Lanka is characterized by the monsoons, causing inflows to the reservoirs as well as the irrigation demands to fluctuate over the year exhibiting a strong seasonal pattern.
Projected Year
Committed NCRE Capacity Projection
(MW)
2023 798
2024 826
2025 855
2026 884
2027 912
2028 941
2029 960
2030 989
2031 1018
2032 1047
Projected Year
Committed NCRE Capacity Projection
(MW)
2013 327
2014 364
2015 390
2016 556
2017 614
2018 653
2019 684
2020 713
2021 742
2022 772
Page 2-6 Generation Expansion Plan-2012
Figure 2.2 - Potential of Hydro power system from past 50 years hydrological data
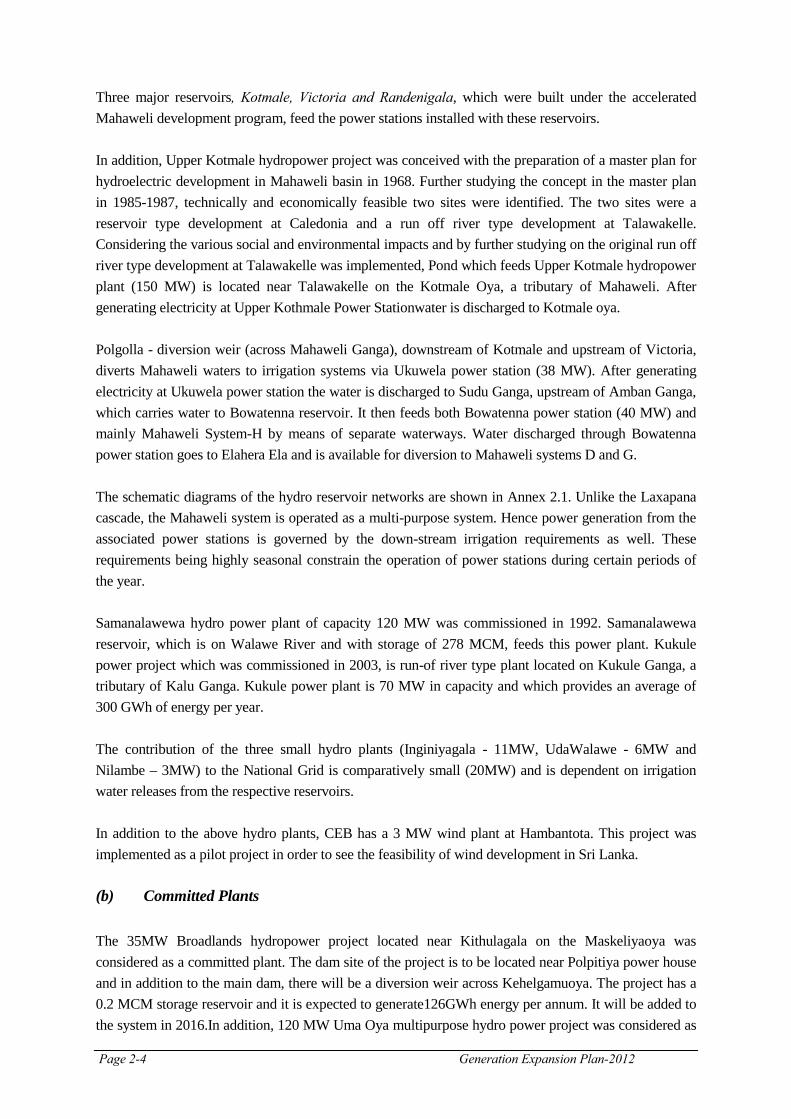
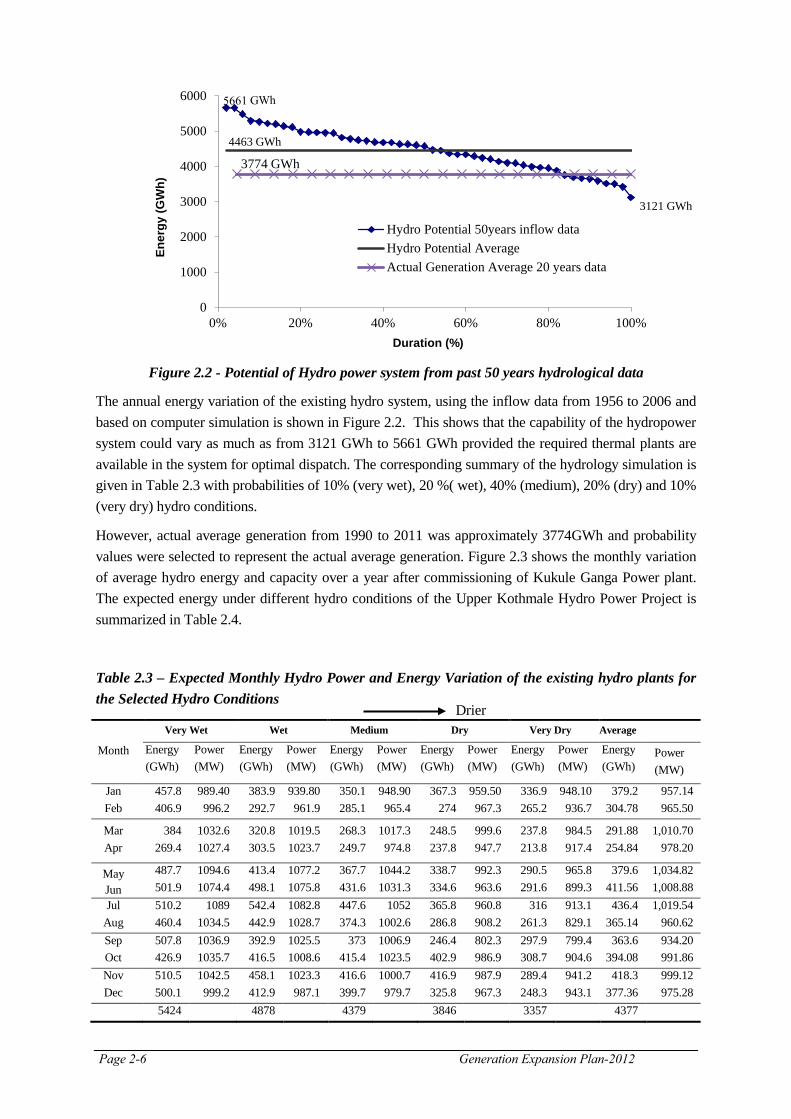
The annual energy variation of the existing hydro system, using the inflow data from 1956 to 2006 and based on computer simulation is shown in Figure 2.2. This shows that the capability of the hydropower system could vary as much as from 3121 GWh to 5661 GWh provided the required thermal plants are available in the system for optimal dispatch. The corresponding summary of the hydrology simulation is given in Table 2.3 with probabilities of 10% (very wet), 20 %( wet), 40% (medium), 20% (dry) and 10% (very dry) hydro conditions.
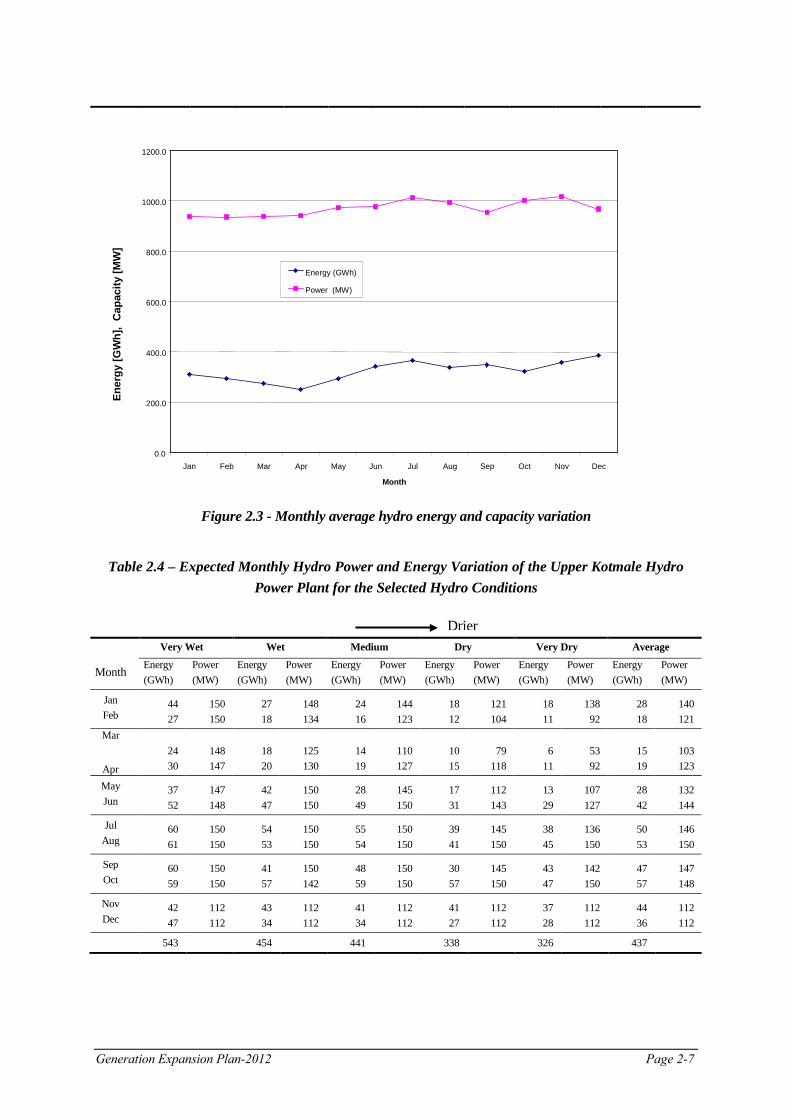
However, actual average generation from 1990 to 2011 was approximately 3774GWh and probability values were selected to represent the actual average generation. Figure 2.3 shows the monthly variation of average hydro energy and capacity over a year after commissioning of Kukule Ganga Power plant. The expected energy under different hydro conditions of the Upper Kothmale Hydro Power Project is summarized in Table 2.4.
Table 2.3 – Expected Monthly Hydro Power and Energy Variation of the existing hydro plants for the Selected Hydro Conditions
Month
Very Wet Wet Medium Dry Very Dry Average
Energy (GWh)
Power (MW)
Energy (GWh)
Power (MW)
Energy (GWh)
Power (MW)
Energy (GWh)
Power (MW)
Energy (GWh)
Power (MW)
Energy (GWh)
Power (MW)
Jan Feb
457.8 406.9
989.40 996.2
383.9 292.7
939.80 961.9
350.1 285.1
948.90 965.4
367.3 274
959.50 967.3
336.9 265.2
948.10 936.7
379.2 304.78
957.14 965.50
Mar Apr
384 269.4
1032.6 1027.4
320.8 303.5
1019.5 1023.7
268.3 249.7
1017.3 974.8
248.5 237.8
999.6 947.7
237.8 213.8
984.5 917.4
291.88 254.84
1,010.70 978.20
May Jun
487.7 501.9
1094.6 1074.4
413.4 498.1
1077.2 1075.8
367.7 431.6
1044.2 1031.3
338.7 334.6
992.3 963.6
290.5 291.6
965.8 899.3
379.6 411.56
1,034.82 1,008.88
Jul Aug
510.2 460.4
1089 1034.5
542.4 442.9
1082.8 1028.7
447.6 374.3
1052 1002.6
365.8 286.8
960.8 908.2
316 261.3
913.1 829.1
436.4 365.14
1,019.54 960.62
Sep Oct
507.8 426.9
1036.9 1035.7
392.9 416.5
1025.5 1008.6
373 415.4
1006.9 1023.5
246.4 402.9
802.3 986.9
297.9 308.7
799.4 904.6
363.6 394.08
934.20 991.86
Nov Dec
510.5 500.1
1042.5 999.2
458.1 412.9
1023.3 987.1
416.6 399.7
1000.7 979.7
416.9 325.8
987.9 967.3
289.4 248.3
941.2 943.1
418.3 377.36
999.12 975.28
5424 4878 4379 3846 3357 4377
3121 GWh
4463 GWh
3774 GWh
0
1000
2000
3000
4000
5000
6000
0% 20% 40% 60% 80% 100%
Ener
gy (G
Wh)
Duration (%)
Hydro Potential 50years inflow dataHydro Potential AverageActual Generation Average 20 years data
Drier
Generation Expansion Plan-2012 Page 2-7
Drier
Figure 2.3 - Monthly average hydro energy and capacity variation
Table 2.4 – Expected Monthly Hydro Power and Energy Variation of the Upper Kotmale Hydro Power Plant for the Selected Hydro Conditions
Very Wet Wet Medium Dry Very Dry Average
Month Energy (GWh)
Power (MW)
Energy (GWh)
Power (MW)
Energy (GWh)
Power (MW)
Energy (GWh)
Power (MW)
Energy (GWh)
Power (MW)
Energy (GWh)
Power (MW)
Jan Feb
44 27
150 150
27 18
148 134
24 16
144 123
18 12
121 104
18 11
138 92
28 18
140 121
Mar
Apr
24 30
148 147
18 20
125 130
14 19
110 127
10 15
79 118
6 11
53 92
15 19
103 123
May Jun
37 52
147 148
42 47
150 150
28 49
145 150
17 31
112 143
13 29
107 127
28 42
132 144
Jul Aug
60 61
150 150
54 53
150 150
55 54
150 150
39 41
145 150
38 45
136 150
50 53
146 150
Sep Oct
60 59
150 150
41 57
150 142
48 59
150 150
30 57
145 150
43 47
142 150
47 57
147 148
Nov Dec
42 47
112 112
43 34
112 112
41 34
112 112
41 27
112 112
37 28
112 112
44 36
112 112
543 454 441 338 326 437
0.0
200.0
400.0
600.0
800.0
1000.0
1200.0
Jan Feb Mar Apr May Jun Jul Aug Sep Oct Nov Dec Month
Ener
gy [G
Wh]
, C
apac
ity [M
W]
Energy (GWh) Power (MW)
Page 2-8 Generation Expansion Plan-2012
2.2 Thermal Generation 2.2.1 CEB Thermal Plants (a) Existing
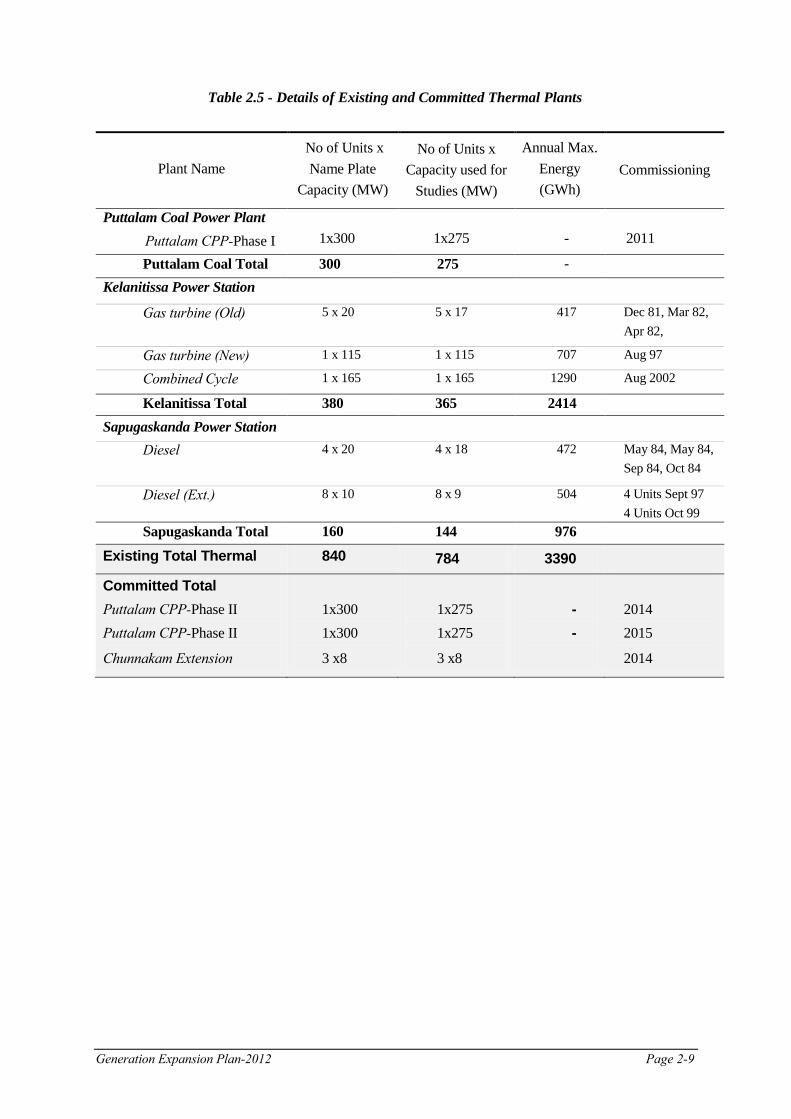
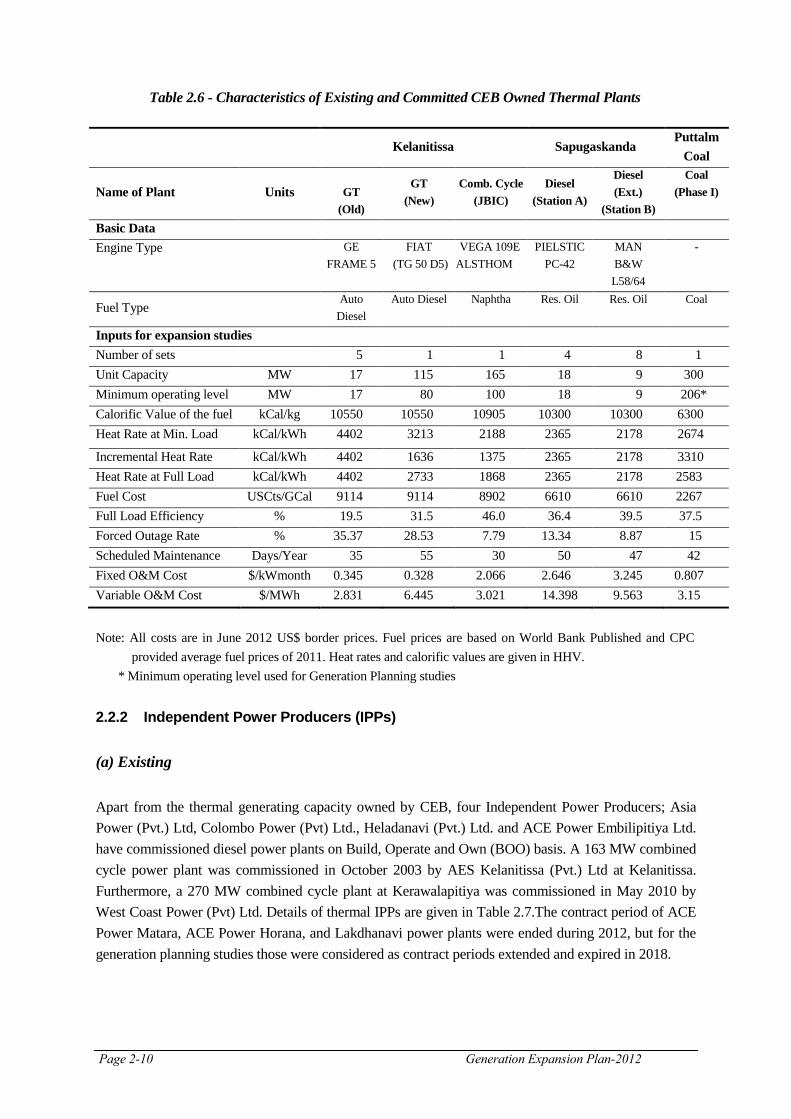
Majority of the present thermal power generating capacity in the country is owned by CEB with a total capacity of 863 MW. It is made up of Puttalam Coal plant 300MW, Kelanitissa Gas Turbines 215 MW, Kelanitissa Combined Cycle plant 165 MW, Sapugaskande Diesel plants 160 MW and 8 MW diesel plant at Chunnakam. The Puttalam Coal plant 300MW funded by EXIM Bank China commissioned in 2011 was the latest thermal power plant addition to the CEB system. (b) Plant Retirements For planning purposes, it was considered that 5x17 MW Gas Turbines at Kelanitissa and 4x18 MW diesel plants at Sapugaskanda are due for retirement in 2019. 115 MW Kelanitissa Gas Turbine and 4x9 MW Sapugaskanda were considered for retirement in 2023 and another 4x9 MW Sapugaskanda Diesel extension is due in 2025. Capacity and energy details of the existing and committed thermal plants are shown in Table 2.5. Cost and technical details of the existing thermal generation plant as input to the 2012 Expansion Planning Studies is summarized in Table 2.6. (c) Committed It was considered for the planning studies that the Puttalam Coal Power Project Stage II (Net 2x275MW) is committed. The two units will be in operation in 2014 and 2015. The Exim Bank of china finance finances the stage II of the project as well. In addition, 3x8MW Extension to Chunnakam Extension power plant and 4x5MW Northern Power plant in Jaffna peninsula were also considered as committed power plants in 2014.
Generation Expansion Plan-2012 Page 2-9
Table 2.5 - Details of Existing and Committed Thermal Plants
Plant Name No of Units x
Name Plate Capacity (MW)
No of Units x Capacity used for
Studies (MW)
Annual Max. Energy (GWh)
Commissioning
Puttalam Coal Power Plant Puttalam CPP-Phase I
1x300
1x275
-
2011
Puttalam Coal Total 300 275 - Kelanitissa Power Station
Gas turbine (Old) 5 x 20 5 x 17 417 Dec 81, Mar 82, Apr 82,
Gas turbine (New) 1 x 115 1 x 115 707 Aug 97
Combined Cycle
1 x 165 1 x 165 1290 Aug 2002
Kelanitissa Total 380 365 2414 Sapugaskanda Power Station
Diesel 4 x 20 4 x 18 472 May 84, May 84, Sep 84, Oct 84
Diesel (Ext.) 8 x 10 8 x 9 504 4 Units Sept 97 4 Units Oct 99
Sapugaskanda Total 160 144 976
Existing Total Thermal
840 784 3390
Committed Total Puttalam CPP-Phase II Puttalam CPP-Phase II
1x300 1x300
1x275 1x275
- -
2014 2015
Chunnakam Extension 3 x8 3 x8 2014
Page 2-10 Generation Expansion Plan-2012
Table 2.6 - Characteristics of Existing and Committed CEB Owned Thermal Plants
Note: All costs are in June 2012 US$ border prices. Fuel prices are based on World Bank Published and CPC
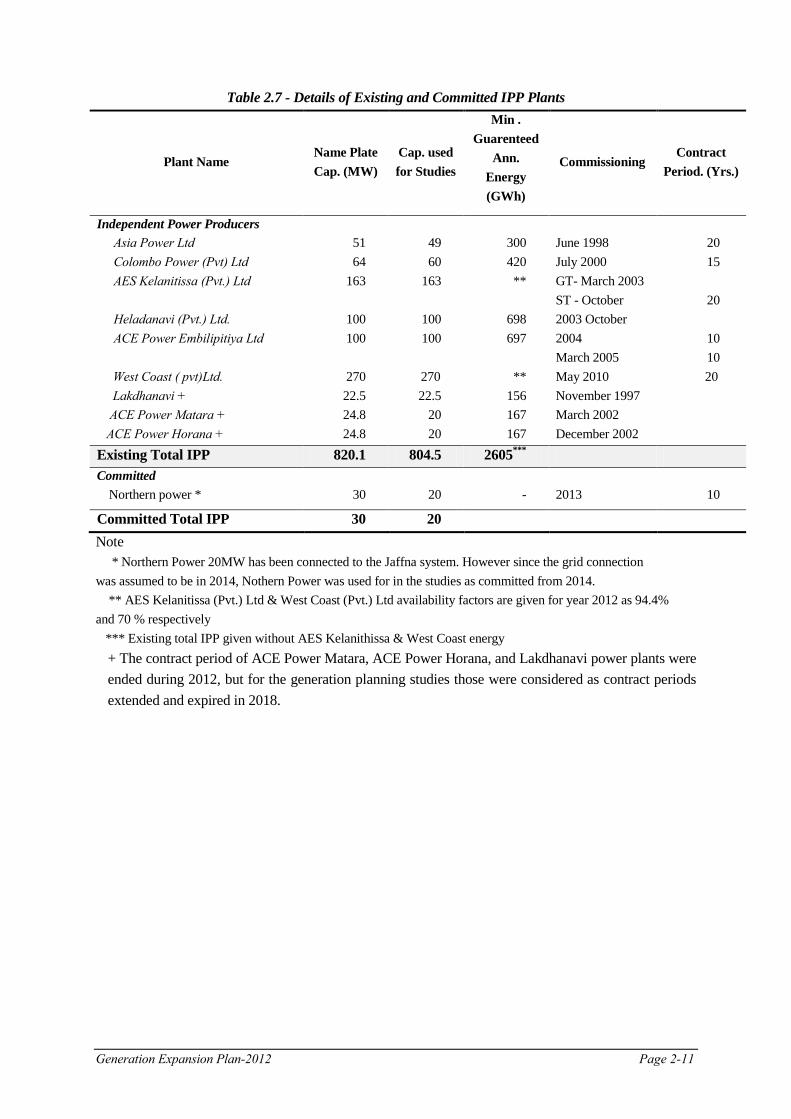
provided average fuel prices of 2011. Heat rates and calorific values are given in HHV. * Minimum operating level used for Generation Planning studies 2.2.2 Independent Power Producers (IPPs) (a) Existing Apart from the thermal generating capacity owned by CEB, four Independent Power Producers; Asia Power (Pvt.) Ltd, Colombo Power (Pvt) Ltd., Heladanavi (Pvt.) Ltd. and ACE Power Embilipitiya Ltd. have commissioned diesel power plants on Build, Operate and Own (BOO) basis. A 163 MW combined cycle power plant was commissioned in October 2003 by AES Kelanitissa (Pvt.) Ltd at Kelanitissa. Furthermore, a 270 MW combined cycle plant at Kerawalapitiya was commissioned in May 2010 by West Coast Power (Pvt) Ltd. Details of thermal IPPs are given in Table 2.7.The contract period of ACE Power Matara, ACE Power Horana, and Lakdhanavi power plants were ended during 2012, but for the generation planning studies those were considered as contract periods extended and expired in 2018.
Kelanitissa Sapugaskanda Puttalm
Coal
Name of Plant Units GT (Old)
GT (New)
Comb. Cycle (JBIC)
Diesel (Station A)
Diesel (Ext.)
(Station B)
Coal (Phase I)
Basic Data Engine Type GE
FRAME 5 FIAT
(TG 50 D5) VEGA 109E
ALSTHOM PIELSTIC
PC-42 MAN B&W L58/64
-
Fuel Type Auto
Diesel Auto Diesel Naphtha Res. Oil Res. Oil Coal
Inputs for expansion studies Number of sets 5 1 1 4 8 1 Unit Capacity MW 17 115 165 18 9 300 Minimum operating level MW 17 80 100 18 9 206* Calorific Value of the fuel kCal/kg 10550 10550 10905 10300 10300 6300 Heat Rate at Min. Load kCal/kWh 4402 3213 2188 2365 2178 2674
Incremental Heat Rate kCal/kWh 4402 1636 1375 2365 2178 3310 Heat Rate at Full Load kCal/kWh 4402 2733 1868 2365 2178 2583 Fuel Cost USCts/GCal 9114 9114 8902 6610 6610 2267 Full Load Efficiency % 19.5 31.5 46.0 36.4 39.5 37.5 Forced Outage Rate % 35.37 28.53 7.79 13.34 8.87 15 Scheduled Maintenance Days/Year 35 55 30 50 47 42 Fixed O&M Cost $/kWmonth 0.345 0.328 2.066 2.646 3.245 0.807 Variable O&M Cost $/MWh 2.831 6.445 3.021 14.398 9.563 3.15
Generation Expansion Plan-2012 Page 2-11
Table 2.7 - Details of Existing and Committed IPP Plants
Plant Name Name Plate Cap. (MW)
Cap. used for Studies
Min . Guarenteed
Ann. Energy (GWh)
Commissioning Contract
Period. (Yrs.)
Independent Power Producers Asia Power Ltd Colombo Power (Pvt) Ltd AES Kelanitissa (Pvt.) Ltd Heladanavi (Pvt.) Ltd. ACE Power Embilipitiya Ltd
West Coast ( pvt)Ltd. Lakdhanavi + ACE Power Matara + ACE Power Horana +
51 64
163
100 100
270 22.5 24.8 24.8
49 60
163
100 100
270
22.5 20 20
300 420 **
698 697
**
156 167 167
June 1998 July 2000 GT- March 2003 ST - October 2003 October 2004 March 2005 May 2010 November 1997 March 2002 December 2002
20 15
20
10 10
20
Existing Total IPP 820.1 804.5 2605*** Committed
Northern power *
30 20
-
2013
10
Committed Total IPP 30 20 Note * Northern Power 20MW has been connected to the Jaffna system. However since the grid connection was assumed to be in 2014, Nothern Power was used for in the studies as committed from 2014. ** AES Kelanitissa (Pvt.) Ltd & West Coast (Pvt.) Ltd availability factors are given for year 2012 as 94.4% and 70 % respectively *** Existing total IPP given without AES Kelanithissa & West Coast energy
+ The contract period of ACE Power Matara, ACE Power Horana, and Lakdhanavi power plants were ended during 2012, but for the generation planning studies those were considered as contract periods extended and expired in 2018.
Generation Expansion Plan-2012 Page 3-1
CHAPTER 3 ELECTRICITY DEMAND: PAST AND THE FORECAST
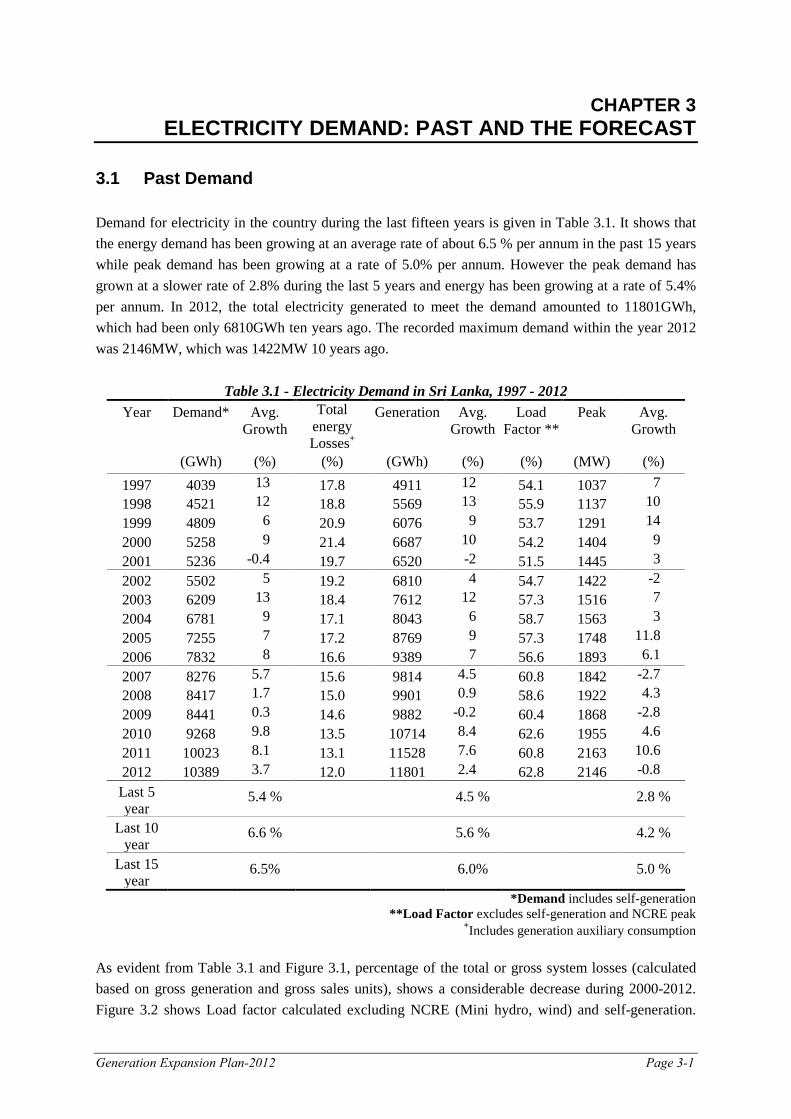
3.1 Past Demand Demand for electricity in the country during the last fifteen years is given in Table 3.1. It shows that the energy demand has been growing at an average rate of about 6.5 % per annum in the past 15 years while peak demand has been growing at a rate of 5.0% per annum. However the peak demand has grown at a slower rate of 2.8% during the last 5 years and energy has been growing at a rate of 5.4% per annum. In 2012, the total electricity generated to meet the demand amounted to 11801GWh, which had been only 6810GWh ten years ago. The recorded maximum demand within the year 2012 was 2146MW, which was 1422MW 10 years ago.
Table 3.1 - Electricity Demand in Sri Lanka, 1997 - 2012 Year Demand* Avg.
Growth Total
energy Losses+
Generation Avg. Growth
Load Factor **
Peak Avg. Growth
(GWh) (%) (%) (GWh) (%) (%) (MW) (%) 1997 4039 13 17.8 4911 12 54.1 1037 7 1998 4521 12 18.8 5569 13 55.9 1137 10 1999 4809 6 20.9 6076 9 53.7 1291 14 2000 5258 9 21.4 6687 10 54.2 1404 9 2001 5236 -0.4 19.7 6520 -2 51.5 1445 3 2002 5502 5 19.2 6810 4 54.7 1422 -2 2003 6209 13 18.4 7612 12 57.3 1516 7 2004 6781 9 17.1 8043 6 58.7 1563 3 2005 7255 7 17.2 8769 9 57.3 1748 11.8 2006 7832 8 16.6 9389 7 56.6 1893 6.1 2007 8276 5.7 15.6 9814 4.5 60.8 1842 -2.7 2008 8417 1.7 15.0 9901 0.9
58.6 1922 4.3
2009 8441 0.3 14.6 9882 -0.2 60.4 1868 -2.8 2010 9268 9.8 13.5 10714 8.4 62.6 1955 4.6 2011 10023 8.1 13.1 11528 7.6 60.8 2163 10.6 2012 10389 3.7 12.0 11801 2.4 62.8 2146 -0.8 Last 5 year
5.4 % 4.5 % 2.8 %
Last 10 year
6.6 % 5.6 % 4.2 %
Last 15 year
6.5% 6.0% 5.0 %
*Demand includes self-generation **Load Factor excludes self-generation and NCRE peak
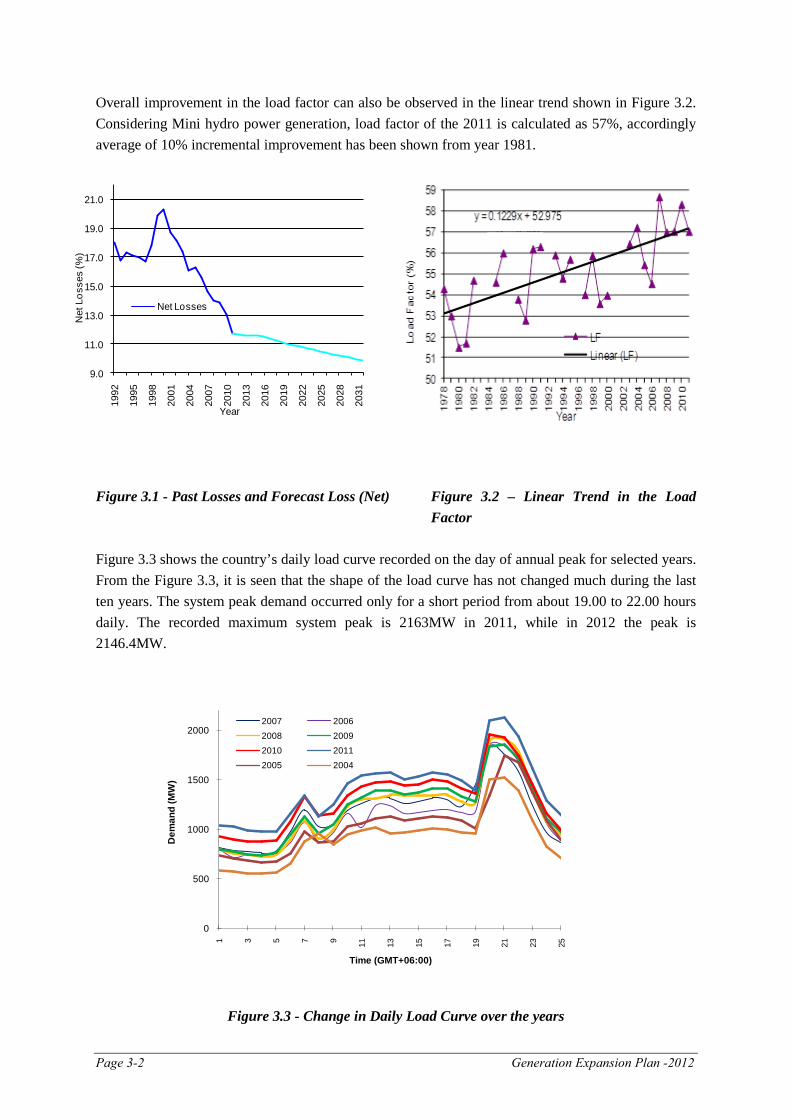
+Includes generation auxiliary consumption As evident from Table 3.1 and Figure 3.1, percentage of the total or gross system losses (calculated based on gross generation and gross sales units), shows a considerable decrease during 2000-2012. Figure 3.2 shows Load factor calculated excluding NCRE (Mini hydro, wind) and self-generation.
Page 3-2 Generation Expansion Plan -2012
Overall improvement in the load factor can also be observed in the linear trend shown in Figure 3.2. Considering Mini hydro power generation, load factor of the 2011 is calculated as 57%, accordingly average of 10% incremental improvement has been shown from year 1981.
Figure 3.1 - Past Losses and Forecast Loss (Net) Figure 3.2 – Linear Trend in the Load
Factor Figure 3.3 shows the country’s daily load curve recorded on the day of annual peak for selected years. From the Figure 3.3, it is seen that the shape of the load curve has not changed much during the last ten years. The system peak demand occurred only for a short period from about 19.00 to 22.00 hours daily. The recorded maximum system peak is 2163MW in 2011, while in 2012 the peak is 2146.4MW.
0
500
1000
1500
2000
1 3 5 7 9 11 13 15 17 19 21 23 25
Dem
and
(MW
)
Time (GMT+06:00)
2007 20062008 20092010 20112005 2004
Figure 3.3 - Change in Daily Load Curve over the years
9.0
11.0
13.0
15.0
17.0
19.0
21.0
1992
1995
1998
2001
2004
2007
2010
2013
2016
2019
2022
2025
2028
2031
Net
Los
ses
(%)
Year
Net Losses
Generation Expansion Plan-2012 Page 3-3
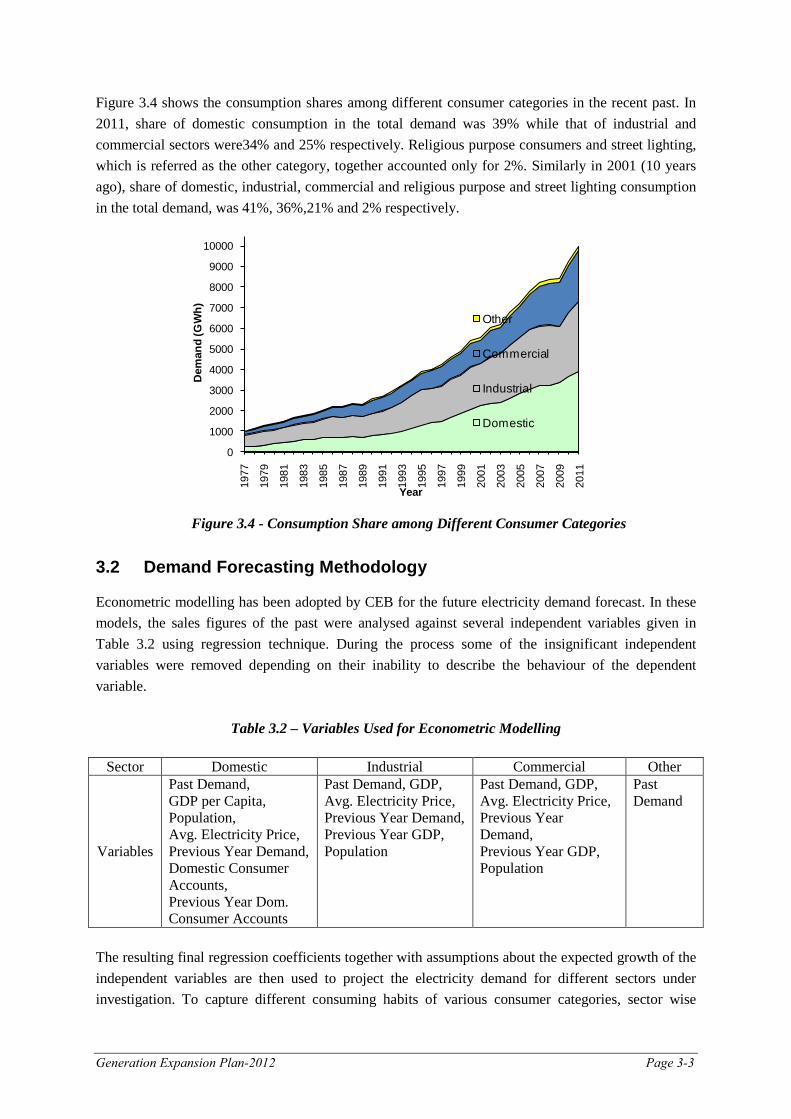
Figure 3.4 shows the consumption shares among different consumer categories in the recent past. In 2011, share of domestic consumption in the total demand was 39% while that of industrial and commercial sectors were34% and 25% respectively. Religious purpose consumers and street lighting, which is referred as the other category, together accounted only for 2%. Similarly in 2001 (10 years ago), share of domestic, industrial, commercial and religious purpose and street lighting consumption in the total demand, was 41%, 36%,21% and 2% respectively.
Figure 3.4 - Consumption Share among Different Consumer Categories
3.2 Demand Forecasting Methodology Econometric modelling has been adopted by CEB for the future electricity demand forecast. In these models, the sales figures of the past were analysed against several independent variables given in Table 3.2 using regression technique. During the process some of the insignificant independent variables were removed depending on their inability to describe the behaviour of the dependent variable.
Table 3.2 – Variables Used for Econometric Modelling
Sector Domestic Industrial Commercial Other
Variables
Past Demand, GDP per Capita, Population, Avg. Electricity Price, Previous Year Demand, Domestic Consumer Accounts, Previous Year Dom. Consumer Accounts
Past Demand, GDP, Avg. Electricity Price, Previous Year Demand, Previous Year GDP, Population
Past Demand, GDP, Avg. Electricity Price, Previous Year Demand, Previous Year GDP, Population
Past Demand
The resulting final regression coefficients together with assumptions about the expected growth of the independent variables are then used to project the electricity demand for different sectors under investigation. To capture different consuming habits of various consumer categories, sector wise
0
1000
2000
3000
4000
5000
6000
7000
8000
9000
1000019
77
1979
1981
1983
1985
1987
1989
1991
1993
1995
1997
1999
2001
2003
2005
2007
2009
2011
Dem
and
(GW
h)
Year
Other
Commercial
Industrial
Domestic
Page 3-4 Generation Expansion Plan -2012
forecasts were prepared separately. Therefore, ‘Domestic’, ‘Industrial, Commercial’ (including Hotels) and ‘Other’ categories (religious purpose and street lighting) were analysed separately to capture the different consuming habits within categories. The following are the derived multiple linear regression models used in econometric analysis. Domestic Sector In regression analysis, it was found that three variables: Number of domestic consumer accounts, Gross domestic product per capita and previous year sector electricity demand were significant independent variables for the domestic sector demand growth. Ddom(t)= -51.01+0.0037GDPPC(t)+0.00016CAdom(t)+ 0.74Ddom(t-1) Where, Ddom(t) - Demand for electricity in domestic consumer category (GWh)
GDPPC(t) - Gross Domestic Product Per Capita in year t (MLKR) CAdom(t) - Number of Domestic Consumer Accounts Ddom(t-1) - Previous year’s demand for electricity in domestic consumer category (GWh)
Industrial Sector Industrial differs from domestic sector in terms of significant variables. The significant variables for electricity demand growth in this sector are GDP and previous year sector electricity demand. D i (t) = -16.58 + 0.00036GDP(t) + 0.75Di(t-1) Where, Di(t) - Electricity Demand for electricity in Industrial consumer categories (GWh) GDP(t) - Gross Domestic Product in year t(MLKR)
Di(t-1) - Previous year’s Electricity Demand for electricity in Industrial consumer categories (GWh)
Commercial (General Purpose) Sector Commercial sector significant variables for electricity demand growth are GDP and previous year sector electricity demand, same as the industrial sector. D i (t) = -228.07 + 0.0006GDP(t) + 0.48Di(t-1) Where, Di(t) - Demand for electricity in Commercial consumer categories (GWh) GDP(t) - Gross Domestic Product in year t(MLKR) Di(t-1) - Previous year’s Demand for electricity in Commercial consumer categories (GWh)
Generation Expansion Plan-2012 Page 3-5
Other Sector The two consumer categories: religious purpose and street lighting are considered in the ‘other sector’. Because of the diverse nature of the consumers included in this category, this category was analysed without any links to other social or demographic variables. Hence, a time-trend analysis was performed to predict the demand in this sector. Ln(Dos(t)) = -108.4 + 0.057 t Where, t - Year Cumulative Demand Once the energy forecasts were derived for the three sectors separately, they were added together to derive the final forecast of energy demand. Then estimated total net (transmission and distribution loss exclusive generation auxiliary) energy loss estimates were added to the forecast demand in order to derive the net energy generation forecast. A target of net Transmission and Distribution loss of 11.5% in 2016, 11% in 2020, 10% in 2030 was used in the studies. Total net energy loss forecast to be achieved with time as shown in table 3.3. In Figure 3.1, the light blue line shows the reductions of expected system losses from 2012 to 2032 with the expected improvements to the network, while rest of the graph shows the estimated net energy losses in the past. In this exercise future load factors were derived by fitting a linear curve to the past load factors. Power cut years were disregarded in curve fitting. Since contribution of mini hydro& other such plants affects the peak demand, load factors were adjusted reducing mini hydro generation from total energy generation. Peak demand forecast was derived using the forecasted load factor and energy generation. (It was also assumed that the contribution of the wind power plants to the peak demand is insignificant while the contribution to energy was considered). Figure 3.2 shows the trend of load factor in the past 28 years excluding years when power cuts occurred. 3.3 Demand Forecast Using the forecasted system losses and load factors as well as the GDP growth forecasted by the Central Bank of Sri Lanka (CBSL) (Table 1.2) and population forecast from Department of Census & Statistics, the expected system energy generation and peak demand are forecasted for the planning horizon. The low GDP growth from the GDP forecast given in CBSL 2011 annual report was used for 2012 to 2015 GDP forecast for the base case plan. In addition to that a number of forecasts are prepared in order to visualize the sensitivity of the factors considered for the forecast. Table 3.3 shows the ‘Base Load Forecast’.
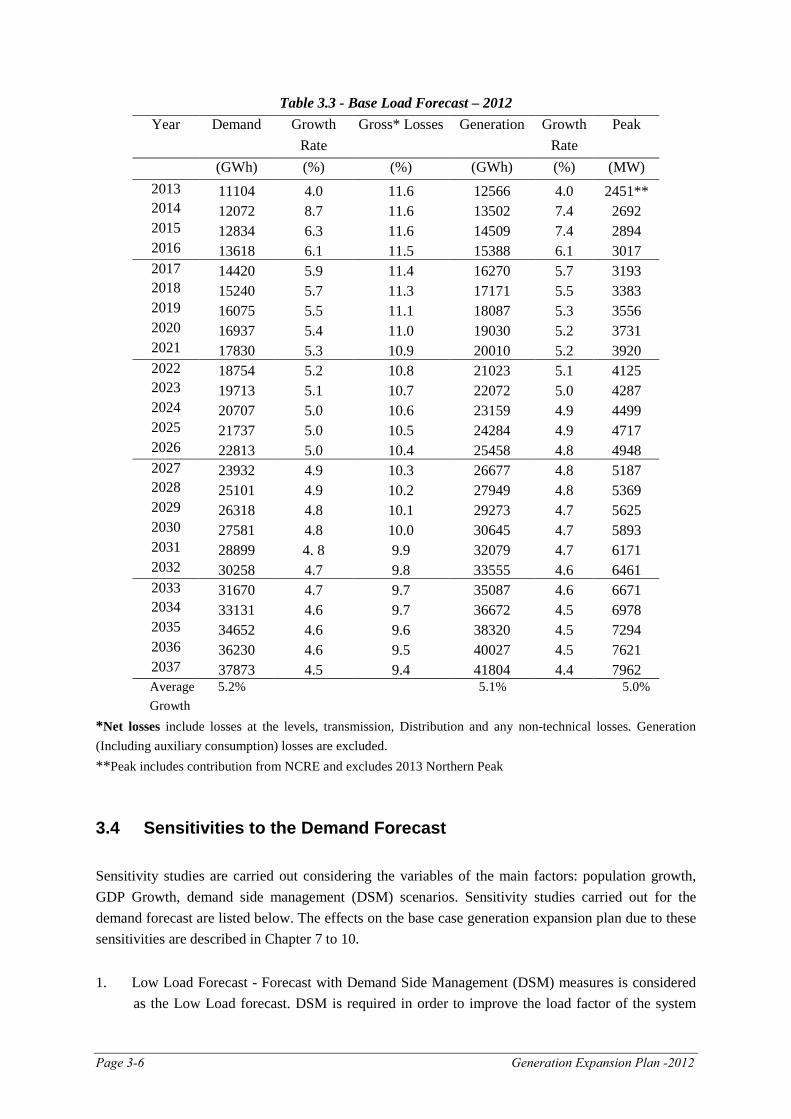
Page 3-6 Generation Expansion Plan -2012
Table 3.3 - Base Load Forecast – 2012 Year Demand Growth
Rate Gross* Losses Generation Growth
Rate Peak
(GWh) (%) (%) (GWh) (%) (MW) 2013 11104 4.0 11.6 12566 4.0 2451** 2014 12072 8.7 11.6 13502 7.4 2692 2015 12834 6.3 11.6 14509 7.4 2894 2016 13618 6.1 11.5 15388 6.1 3017 2017 14420 5.9 11.4 16270 5.7 3193 2018 15240 5.7 11.3 17171 5.5 3383 2019 16075 5.5 11.1 18087 5.3 3556 2020 16937 5.4 11.0 19030 5.2 3731 2021 17830 5.3 10.9 20010 5.2 3920 2022 18754 5.2 10.8 21023 5.1 4125 2023 19713 5.1 10.7 22072 5.0 4287 2024 20707 5.0 10.6 23159 4.9 4499 2025 21737 5.0 10.5 24284 4.9 4717 2026 22813 5.0 10.4 25458 4.8 4948 2027 23932 4.9 10.3 26677 4.8 5187 2028 25101 4.9 10.2 27949 4.8 5369 2029 26318 4.8 10.1 29273 4.7 5625 2030 27581 4.8 10.0 30645 4.7 5893 2031 28899 4. 8 9.9 32079 4.7 6171 2032 30258 4.7 9.8 33555 4.6 6461 2033 31670 4.7 9.7 35087 4.6 6671 2034 33131 4.6 9.7 36672 4.5 6978 2035 34652 4.6 9.6 38320 4.5 7294 2036 36230 4.6 9.5 40027 4.5 7621 2037 37873 4.5 9.4 41804 4.4 7962 Average 5.2% 5.1% 5.0% Growth
*Net losses include losses at the levels, transmission, Distribution and any non-technical losses. Generation (Including auxiliary consumption) losses are excluded. **Peak includes contribution from NCRE and excludes 2013 Northern Peak
3.4 Sensitivities to the Demand Forecast Sensitivity studies are carried out considering the variables of the main factors: population growth, GDP Growth, demand side management (DSM) scenarios. Sensitivity studies carried out for the demand forecast are listed below. The effects on the base case generation expansion plan due to these sensitivities are described in Chapter 7 to 10. 1. Low Load Forecast - Forecast with Demand Side Management (DSM) measures is considered
as the Low Load forecast. DSM is required in order to improve the load factor of the system
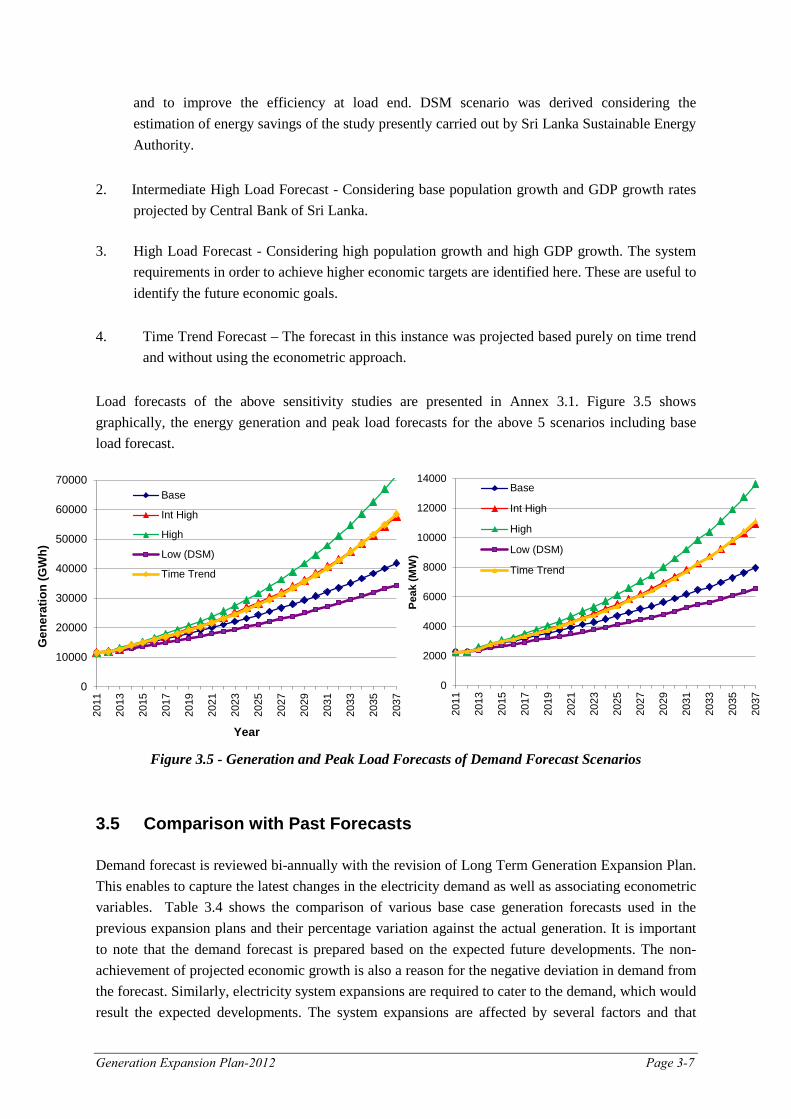
Generation Expansion Plan-2012 Page 3-7
and to improve the efficiency at load end. DSM scenario was derived considering the estimation of energy savings of the study presently carried out by Sri Lanka Sustainable Energy Authority.
2. Intermediate High Load Forecast - Considering base population growth and GDP growth rates
projected by Central Bank of Sri Lanka.
3. High Load Forecast - Considering high population growth and high GDP growth. The system requirements in order to achieve higher economic targets are identified here. These are useful to identify the future economic goals.
4. Time Trend Forecast – The forecast in this instance was projected based purely on time trend
and without using the econometric approach. Load forecasts of the above sensitivity studies are presented in Annex 3.1. Figure 3.5 shows graphically, the energy generation and peak load forecasts for the above 5 scenarios including base load forecast.
Figure 3.5 - Generation and Peak Load Forecasts of Demand Forecast Scenarios
3.5 Comparison with Past Forecasts
Demand forecast is reviewed bi-annually with the revision of Long Term Generation Expansion Plan. This enables to capture the latest changes in the electricity demand as well as associating econometric variables. Table 3.4 shows the comparison of various base case generation forecasts used in the previous expansion plans and their percentage variation against the actual generation. It is important to note that the demand forecast is prepared based on the expected future developments. The non-achievement of projected economic growth is also a reason for the negative deviation in demand from the forecast. Similarly, electricity system expansions are required to cater to the demand, which would result the expected developments. The system expansions are affected by several factors and that
0
10000
20000
30000
40000
50000
60000
70000
2011
2013
2015
2017
2019
2021
2023
2025
2027
2029
2031
2033
2035
2037
Gen
erat
ion
(GW
h)
Year
Base
Int High
High
Low (DSM)
Time Trend
0
2000
4000
6000
8000
10000
12000
14000
2011
2013
2015
2017
2019
2021
2023
2025
2027
2029
2031
2033
2035
2037
Peak
(MW
)
Base
Int High
High
Low (DSM)
Time Trend
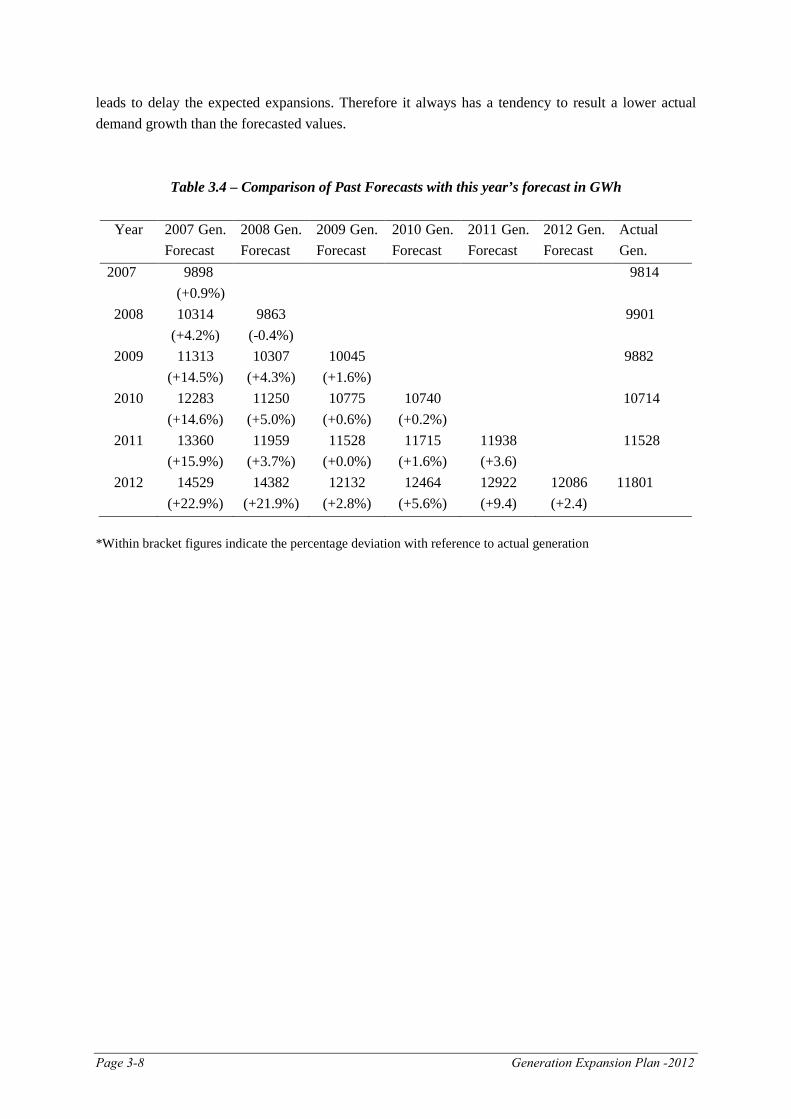
Page 3-8 Generation Expansion Plan -2012
leads to delay the expected expansions. Therefore it always has a tendency to result a lower actual demand growth than the forecasted values.
Table 3.4 – Comparison of Past Forecasts with this year’s forecast in GWh
Year 2007 Gen. Forecast
2008 Gen. Forecast
2009 Gen. Forecast
2010 Gen. Forecast
2011 Gen. Forecast
2012 Gen. Forecast
Actual Gen.
2007 9898 9814 (+0.9%) 2008 10314
(+4.2%) 9863
(-0.4%) 9901
2009 11313 (+14.5%)
10307 (+4.3%)
10045 (+1.6%)
9882
2010 12283 (+14.6%)
11250 (+5.0%)
10775 (+0.6%)
10740 (+0.2%)
10714
2011 13360 (+15.9%)
11959 (+3.7%)
11528 (+0.0%)
11715 (+1.6%)
11938 (+3.6)
11528
2012 14529 (+22.9%)
14382 (+21.9%)
12132 (+2.8%)
12464 (+5.6%)
12922 (+9.4)
12086 11801 (+2.4)
*Within bracket figures indicate the percentage deviation with reference to actual generation
Generation Expansion Plan – 2012 Page 4-1
CHAPTER 4 CONVENTIONAL GENERATION OPTIONS FOR FUTURE EXPANSION
Hydro power, fossil fuel based thermal power, nuclear-based thermal power are the primary energy options to be considered in meeting the future electricity demand. A large number of factors including cost of development, operation and maintenance costs and environmental effects have to be evaluated in order to consider the suitability of these primary options. All costs incurred in environmental mitigation measures are included in the cost figures given in this report. In addition to these conventional generation options, non-conventional generation options are also considered in order to serve the future electricity demand. Non conventional generation options are discussed in detail in Chapter 5 and the interconnection option is briefly described in latter part of this chapter. 4.1 Hydro Options with a Projected committed development 4.1.1 Candidate Hydro Projects The hydro potential in the country has already been developed to a great extent. However some major hydro potential remains to be developed, especially Gin Ganga and Moragolla. Several prospective candidate hydro projects were identified in the Master Plan Study [4], 1989, These include 27 sites capable of generating electricity at a long-term average cost of less than 15 USCts/kWh (in 1988 prices) and having a total capacity of approximately 870 MW. The potential energy estimated was 3680 GWh/year under average hydrological conditions. A part of the above hydro potential already been exploited under the Upper Kotmale Hydro Power Project, which is in operation. Broadlands and Uma Oya hydro projects were considered as committed in this study. Expansion planning studies presented in this report have considered two prospective hydro projects as candidates: 49 MW Gin Ganga and 27 MW Moragolla projects. Locations of these candidate projects are given in Figure 2.1. The criteria given below were generally adopted in generation planning exercises in selecting the hydro projects from the large number of hydro sites identified in the master plan study. a) Projects less than 15 MW were not considered as candidates in order to give priority for the large projects. b) Whenever, feasibility study results were available for any prospective project, such results were used in preference to those of the Master Plan Study. (Studies conducted under the Master Plan study were considered to be at pre-feasibility level). c) Estimated specific cost as well as physical and technical constraints are considered as the priority order for the selection of candidates. However, with the implementation of many identified projects within these criteria by CEB, as well as by the private sector some times with reduced energy/capacity benefits, only Moragaolla and Gin Ganga were considered as candidate hydro in this study. Further, private sector is allowed to develop hydro power projects below 10MW under a Standard Power Purchase Agreement.
Page 4-2 Generation Expansion Plan – 2012
4.1.2 Available Studies on Hydro Projects In addition to 1989 Master Plan study, following studies of selected prospective hydro sites have been completed. (a) Feasibility of the Broadlands Hydropower Project was studied under the “Study of Hydropower Optimization in Sri Lanka” in February 2004 by the J- Power and the Nippon Koei Co., Ltd., Japan [5]. This study was funded by the Japan International Cooperation Agency (JICA). Under this study, several alternative schemes studied previously by Central Engineering Consultancy Bureau (CECB) in 1986 and 1991 [6 and 7] were reviewed. (b) A Pre-feasibility study on Uma Oya Multi-purpose Project (a trans-basin option) was completed by the CECB in July 1991 [8] where the diversion of Uma Oya, a tributary of Mahaweli Ganga was studied. The development proposed in this study was used as a candidate in the present expansion studies. In 2001, SNC Lavalin Inc. of Canada was engaged to conduct the feasibility study on Uma Oya with the assistance of Canadian International Development Agency (CIDA). However only Phase I of the study was completed by the consultants. (c) A Pre-feasibility study for GING 074 project identified on the Mater Plan in Gin Ganga was carried out in 2008 by CECB. (d) A feasibility study for Moragolla hydro power project was carried out in 2010/11 with Kuwait Fund For Arab Economic Development (KFAED. Nippon Koei Co Ltd is now engaged in to feasibility to carry out, detail designs and preparation of tender document with the assistance of Asian Development Bank. 4.1.3 Details of the Candidate hydro Projects The basic technical data of the selected projects are summarized in Table 4.1 [see Annex 4.1 for further details]. A summary of the capital cost is given in Table 4.2 whereas Annex 4.2 provides information about the cost calculations of candidate hydro plants including adjustments made to their cost bases.
Table 4.1 - Characteristics of Candidate Hydro Plants
Project River Basin Ins. Capacity (MW) Annu. Energy (GWh) Storage (MCM) Gin Ganga Gin 49 143(@ 33.3%PF)
22.2
Moragolla Mahaweli 27 81.5(@34.5%PF)
4.2
Based on expected energy and estimated project and maintenance cost; specific cost of the hydro plants were calculated (Table 4.3). These calculations were made for 10% discount rate, which is the rate used for planning studies. Furthermore, as an indicative comparison, specific cost at different capacities of the hydro projects are shown in the Figure 4.1 with the screening curves of some selected set of candidate thermal plants. In this specific cost calculation, capital costs of the projects are adjusted according to the plant capacity assuming water storage facilities and expected energy remains same.
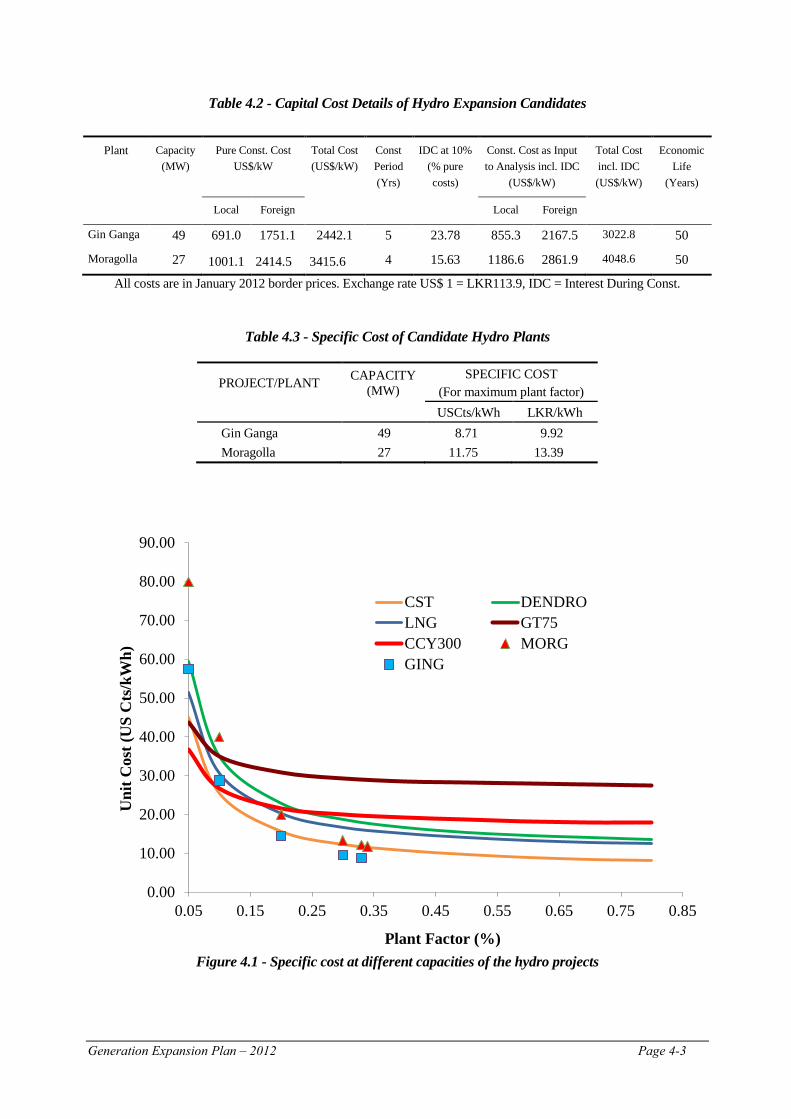
Generation Expansion Plan – 2012 Page 4-3
0.00
10.00
20.00
30.00
40.00
50.00
60.00
70.00
80.00
90.00
0.05 0.15 0.25 0.35 0.45 0.55 0.65 0.75 0.85
Uni
t Cos
t (U
S C
ts/k
Wh)
Plant Factor (%)
CST DENDROLNG GT75CCY300 MORGGING
Table 4.2 - Capital Cost Details of Hydro Expansion Candidates
Plant Capacity (MW)
Pure Const. Cost US$/kW
Total Cost (US$/kW)
Const Period (Yrs)
IDC at 10% (% pure costs)
Const. Cost as Input to Analysis incl. IDC
(US$/kW)
Total Cost incl. IDC (US$/kW)
Economic Life
(Years)
Local Foreign Local Foreign
Gin Ganga 49 691.0 1751.1 2442.1 5 23.78 855.3 2167.5 3022.8 50
Moragolla 27 1001.1 2414.5 3415.6 4 15.63 1186.6 2861.9 4048.6 50
All costs are in January 2012 border prices. Exchange rate US$ 1 = LKR113.9, IDC = Interest During Const.
Table 4.3 - Specific Cost of Candidate Hydro Plants
PROJECT/PLANT CAPACITY (MW)
SPECIFIC COST (For maximum plant factor)
USCts/kWh LKR/kWh Gin Ganga 49 8.71 9.92 Moragolla 27 11.75 13.39
Figure 4.1 - Specific cost at different capacities of the hydro projects
Page 4-4 Generation Expansion Plan – 2012
4.1.4 Current status of non-Committed Hydro Projects (a) Gin Ganga: A policy decision has been taken to develop Gin Ganga with trans-basin diversion for multi sector development mainly with irrigation benefits. Thus, the pre-feasibility study done by CECB for in-basin option in 2008 is to be reviewed in the context of trans-basin diversion. (b) Moragolla: Kuwait Fund for Arab Economic Development (KFAED) funded the feasibility study completed in 2010. The Environmental Impact Assessment (EIA) process is still ongoing. The review of feasibility study, preparation of detail design and tender documents commenced with ADB funds in Octomber 2012. 4.2 Hydro Capacity Extensions The Sri Lankan power system is gradually transforming into a thermal based system. In view of this, it would be pertinent to prepare the hydropower system for peaking duty. This aspect was further studied under the JICA funded “Hydro Power Optimization Study of 2004”. Given below is a brief summary of possible expansions of existing hydro stations studied under the “Hydro Power Optimization Study”[5]. 4.2.1 Samanalawewa Samanalawewa project has a potential for additional peaking capacity. The existing Samanalawewa power station has two generators rated at 60 MW each. In addition to these, studies have indicated that further two units of 60 MW can be added for peaking duty. The facilities such as a bifurcation with bulk head gate and a space for an addition of two 60 MW units have been provided during the design and construction stage of the existing power station. However, the diversion of the Diyawini Oya water, studied prior to “Hydro Power Optimization Study” was not considered since it is infeasible. 4.2.2 Laxapana Complex During the Phase E of the Master Plan for the Electricity Supply in Sri Lanka, 1990 [9], some upgrading measures at Laxapana Complex have been studied. Also, under the Hydro Power Optimization Study further studies were carried out to upgrade Wimalasurendra Power Station, New Laxapana power station & Old Laxapana Power Station. And also for upgrading of the Samanalawewa and Polpitiya Power Stations, studies were carried out during the period of February to June 2010 by POYRY Energt AG, Switzerland. (a) Wimalasurendra and New Laxapana Project: Under the upgrading of Wimalasurendra and New Laxapana Power Stations, it is planned to replace generator, turbine governor excitation & controls and transformer protection. The upgrading of both power stations is scheduled to finish in 2013. (b) Old Laxapana Project: It is planned to replace generator, turbine governor excitation & controls by 2013. 4.2.3 Mahaweli Complex (a) Victoria Project: Victoria Hydro Power Extension (Stage II) was envisaged under feasibility study of existing Victoria Power Station in 1978. As studied under the “Hydro Power Optimization Study”, the Stage II expansion consists of a headrace tunnel, a surge chamber, a high pressure tunnel, penstock and the
Generation Expansion Plan – 2012 Page 4-5
power plant. (In this expansion, two options were identified as 2 x 70 MW and 3x70 MW in addition to the present capacity of the station 3 x 70 MW). A JICA funded feasibility study on Expansion of Victoria Hydro Power Station was carried out in 2008. According to the selected option, 228MW( 2 x 114MW) capacity is to be added to the system by connecting this project in to the existing intake and locating the new power house adjacent to the existing powerhouse with a waterway (tunnel) parallel to the existing waterway. This expansion could double the capacity of Victoria while the energy benefit will be minimal (11 GWh). The EIA approval process is still on going and also CEB is waiting to complete a study on “ The Project for the Development Planning on Optimal Power Generation for Peak Power Demand” in order to prioritize the options for implementation for peak capacity requirements. Therefore Victoria expansion Project was not considered as a candidate for the present study. (b) Kotmale Project: Provision for capacity expansion has been identified in the existing Kotmale Power Station. At present 3 x 67 MW generators are installed in the Kotmale Power Station with an annual average energy output of 455 GWh. The amount of energy could be increased by about 20% by raising the dam crest from elevation 706.5m to 735.0 masl. 4.2.4 Pump Storage Option In the context of committed and planned Coal power plants and the characteristics of the load curve (eg. prominent evening peak and low off peak) of the country, CEB has identified the need to study the requirement of and the potential for pumped storage hydro power plants. Initial desk studies have revealed that the potential sites may be available. Therefore CEB has sought funding and technical assistance from JICA through the Government of Sri Lanka to carry out a detailed feasibility study in this regard under “ The Project for the Development Planning on Optimal Power Generation for Peak Power Demand” . 4.3 Thermal Options 4.3.1 Available Studies for Thermal Plants Several studies had been conducted to assess the future thermal options for electricity generation in Sri Lanka. These studies include: a) Feasibility Study for Trincomalee Coal-Fired Power Station conducted in 1988 [10]: The feasibility
study on Trincomalee coal-fired power station considered a site capacity of 900 MW when fully developed ( 3x300 MW in a phased development). Site location is marked in Figure 2.1. The investment cost and other relevant parameters were reviewed during the 1995 Thermal Generation Options Study[12].
b) Thermal Generation Options, 1988 [11] and Thermal Generation Options, 1996 [12] c) Special Assistance for Project Formulation (SAPROF) for Kelanitissa Combined Cycle Power Plant
(1996) [13] d) Review of Least Cost Generation Expansion Studies (1997) [14]
Page 4-6 Generation Expansion Plan – 2012
e) Coal Fired Thermal Development Project – West Coast (1998) [15]: Feasibility study and the preparation
of contract documents (engineering services) for construction of the first 300 MW coal power plant on the West Coast in Kalpitiya in the Puttalam District with the assistance of Japan Bank for International Cooperation . The selected site with an area of 103 ha is suitable to accommodate the entire power plant in its final capacity of 900 MW with all auxiliary and ancillary buildings, the coal stockyard, ash disposal area, switchyard etc. and including a 43 ha buffer zone.
f) Feasibility Study for Combined Cycle Power Development Project at Kerawalapitiya -1999 [16] g) Sri Lanka Electric Power Technology Assessment. Draft Report (Final), (July 2002) [17] h) Master Plan Study for the Development of Power Generation and Transmission System in Sri Lanka,
2006 [27]. i) A note on stability of Diesel units on the Sri Lanka Power system, 2004 [25].
j) Study for Energy Diversification Enhancement by Introducing LNG Operated Power generation Option
in Sri Lanka [29]. 4.3.2 Thermal Power Candidates Several power generation technologies were considered in the initial screening of generation options based on the studies listed above. The reciprocating diesel plants are not included for the planning studies considering the possible contribution from such plants to the system instability [25] and the recommendation made by the Committee on Policy on Addition of Diesel Engines. Following are the power generation technologies considered for the screening process.
(i) Coal Fired Steam Plants (ii) Oil Fired Steam Plants (iii) Oil fired Combined Cycle Power Plants (iv) Natural Gas fired Combined Cycle Power Plant (v) Oil fired Gas Turbine Plants (vi) Nuclear Power Plant
However, several generation technologies with different capacities are not practical to be used for detailed studies. Therefore preliminary screening has to be done in order to reduce the number of alternatives. The screening curve method described in Chapter 6 was used for initial screening. After the initial screening seven alternative expansion options, which are described in Section 4.3.3, were chosen for the detailed planning studies. The results of the screening curve analysis are given in Annex 7.1.
4.3.3 Candidate Thermal Plant Details Capital costs of projects are shown in two components: The foreign cost and the local cost. During the pre-feasibility and feasibility studies, capital costs have been estimated inclusive of insurance and freight for delivery to site (CIF basis). Local costs, both material and labour, have been converted to their border price equivalents, using standard conversion factors. The standard conversion factor applied to all local
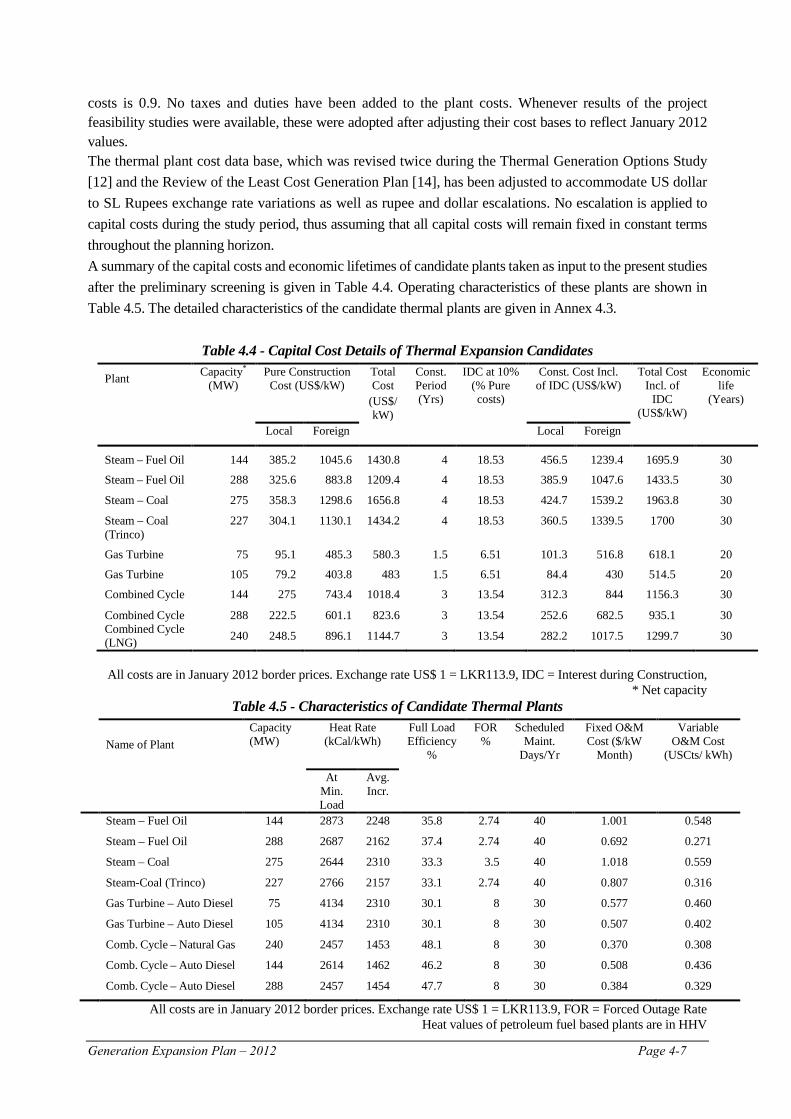
Generation Expansion Plan – 2012 Page 4-7
costs is 0.9. No taxes and duties have been added to the plant costs. Whenever results of the project feasibility studies were available, these were adopted after adjusting their cost bases to reflect January 2012 values. The thermal plant cost data base, which was revised twice during the Thermal Generation Options Study [12] and the Review of the Least Cost Generation Plan [14], has been adjusted to accommodate US dollar to SL Rupees exchange rate variations as well as rupee and dollar escalations. No escalation is applied to capital costs during the study period, thus assuming that all capital costs will remain fixed in constant terms throughout the planning horizon. A summary of the capital costs and economic lifetimes of candidate plants taken as input to the present studies after the preliminary screening is given in Table 4.4. Operating characteristics of these plants are shown in Table 4.5. The detailed characteristics of the candidate thermal plants are given in Annex 4.3.
Table 4.4 - Capital Cost Details of Thermal Expansion Candidates
Plant Capacity*
(MW) Pure Construction
Cost (US$/kW) Total Cost
Const. Period (Yrs)
IDC at 10% (% Pure costs)
Const. Cost Incl. of IDC (US$/kW)
Total Cost Incl. of
IDC (US$/kW)
Economic life
(Years)
(US$/ kW)
Local Foreign Local Foreign
Steam – Fuel Oil 144 385.2 1045.6 1430.8 4 18.53 456.5 1239.4 1695.9 30
Steam – Fuel Oil 288 325.6 883.8 1209.4 4 18.53 385.9 1047.6 1433.5 30
Steam – Coal 275 358.3 1298.6 1656.8 4 18.53 424.7 1539.2 1963.8 30
Steam – Coal (Trinco)
227 304.1 1130.1 1434.2 4 18.53 360.5 1339.5 1700 30
Gas Turbine 75 95.1 485.3 580.3 1.5 6.51 101.3 516.8 618.1 20
Gas Turbine 105 79.2 403.8 483 1.5 6.51 84.4 430 514.5 20
Combined Cycle 144 275 743.4 1018.4 3 13.54 312.3 844 1156.3 30
Combined Cycle 288 222.5 601.1 823.6 3 13.54 252.6 682.5 935.1 30
Combined Cycle (LNG) 240 248.5 896.1 1144.7 3 13.54 282.2 1017.5 1299.7 30
All costs are in January 2012 border prices. Exchange rate US$ 1 = LKR113.9, IDC = Interest during Construction,
* Net capacity Table 4.5 - Characteristics of Candidate Thermal Plants
Name of Plant
Capacity (MW)
Heat Rate (kCal/kWh)
Full Load Efficiency
%
FOR %
Scheduled Maint.
Days/Yr
Fixed O&M Cost ($/kW
Month)
Variable O&M Cost
(USCts/ kWh)
At Min. Load
Avg. Incr.
Steam – Fuel Oil 144 2873 2248 35.8 2.74 40 1.001 0.548
Steam – Fuel Oil 288 2687 2162 37.4 2.74 40 0.692 0.271
Steam – Coal 275 2644 2310 33.3 3.5 40 1.018 0.559
Steam-Coal (Trinco) 227 2766 2157 33.1 2.74 40 0.807 0.316
Gas Turbine – Auto Diesel 75 4134 2310 30.1 8 30 0.577 0.460
Gas Turbine – Auto Diesel 105 4134 2310 30.1 8 30 0.507 0.402
Comb. Cycle – Natural Gas 240 2457 1453 48.1 8 30 0.370 0.308
Comb. Cycle – Auto Diesel 144 2614 1462 46.2 8 30 0.508 0.436
Comb. Cycle – Auto Diesel 288 2457 1454 47.7 8 30 0.384 0.329
All costs are in January 2012 border prices. Exchange rate US$ 1 = LKR113.9, FOR = Forced Outage Rate Heat values of petroleum fuel based plants are in HHV
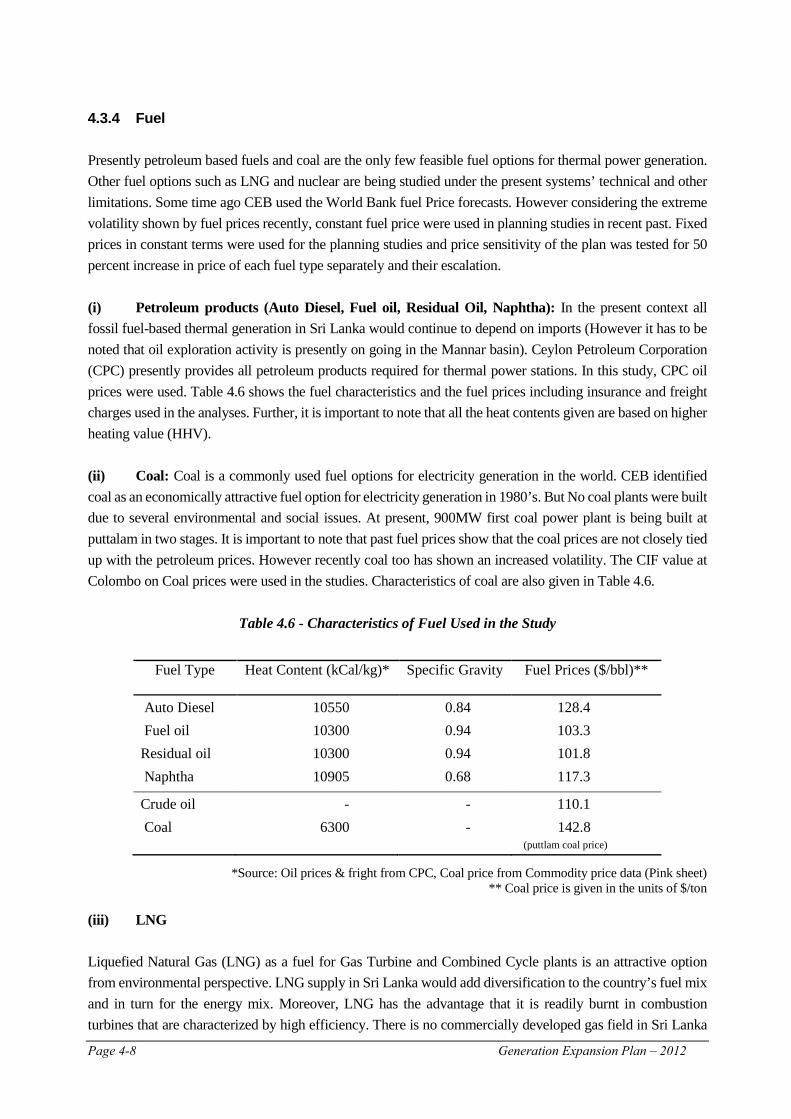
Page 4-8 Generation Expansion Plan – 2012
4.3.4 Fuel Presently petroleum based fuels and coal are the only few feasible fuel options for thermal power generation. Other fuel options such as LNG and nuclear are being studied under the present systems’ technical and other limitations. Some time ago CEB used the World Bank fuel Price forecasts. However considering the extreme volatility shown by fuel prices recently, constant fuel price were used in planning studies in recent past. Fixed prices in constant terms were used for the planning studies and price sensitivity of the plan was tested for 50 percent increase in price of each fuel type separately and their escalation. (i) Petroleum products (Auto Diesel, Fuel oil, Residual Oil, Naphtha): In the present context all fossil fuel-based thermal generation in Sri Lanka would continue to depend on imports (However it has to be noted that oil exploration activity is presently on going in the Mannar basin). Ceylon Petroleum Corporation (CPC) presently provides all petroleum products required for thermal power stations. In this study, CPC oil prices were used. Table 4.6 shows the fuel characteristics and the fuel prices including insurance and freight charges used in the analyses. Further, it is important to note that all the heat contents given are based on higher heating value (HHV). (ii) Coal: Coal is a commonly used fuel options for electricity generation in the world. CEB identified coal as an economically attractive fuel option for electricity generation in 1980’s. But No coal plants were built due to several environmental and social issues. At present, 900MW first coal power plant is being built at puttalam in two stages. It is important to note that past fuel prices show that the coal prices are not closely tied up with the petroleum prices. However recently coal too has shown an increased volatility. The CIF value at Colombo on Coal prices were used in the studies. Characteristics of coal are also given in Table 4.6.
Table 4.6 - Characteristics of Fuel Used in the Study
*Source: Oil prices & fright from CPC, Coal price from Commodity price data (Pink sheet) ** Coal price is given in the units of $/ton
(iii) LNG Liquefied Natural Gas (LNG) as a fuel for Gas Turbine and Combined Cycle plants is an attractive option from environmental perspective. LNG supply in Sri Lanka would add diversification to the country’s fuel mix and in turn for the energy mix. Moreover, LNG has the advantage that it is readily burnt in combustion turbines that are characterized by high efficiency. There is no commercially developed gas field in Sri Lanka
Fuel Type Heat Content (kCal/kg)* Specific Gravity Fuel Prices ($/bbl)**
Auto Diesel 10550 0.84 128.4 Fuel oil 10300 0.94 103.3 Residual oil 10300 0.94 101.8 Naphtha 10905 0.68 117.3
Crude oil - - 110.1 Coal 6300 - 142.8
(puttlam coal price)
Generation Expansion Plan – 2012 Page 4-9
though exploration is ongoing. The closest Gas fields to Sri Lanka are in Bangladesh and India. The reserves in India are insufficient for their use. Bangladesh and other Gas sources are located far from Sri Lanka, which makes pipeline projects uneconomical. Hence natural gas transport by means of shipping as LNG is a better option for Sri Lanka. Following three recent studies have reviewed and evaluated LNG as a fuel option for Sri Lanka: 1. Sri Lanka Electric Power Technology Assessment Draft Report (Final), (July 2002) [17] 2. Sri Lanka Natural Gas Options Study, USAID-SARI/Energy Program (Revised June 2003) [18] 3.Study for Energy Diversification Enhancement by Introducing LNG Operated Power generation Option in
Sri Lanka – 2010 (JICA funded),phase I [29] The first two studies have concluded that the potential demand for gas in the country is very small since the demand for LNG is mainly from the power sector. However the above JICA funded study (phase I ) conducted in 2010 concluded that under certain conditions, such as low LNG prices (similar to the price obtained by India in 2008/09) and obtaining of CDM benefits , LNG too could be competitive with coal and would be a viable fuel. However, the price assumptions made JICA Study seemed too optimistic in the global context. The second phase of the above study is expected to further study the aspects of the viability of LNG introduction to Sri Lanka. A suitable LNG setup for Sri Lanka would consist of an LNG import facility (via tanker ships), domestic storage, regasification unit and a power plant. However, a recent development is the FSRU (Floating Storage and Regasification Unit) which can be moored in the sea and has a faster implementation possibility. Natural gas prices in recent years and technological advances have lowered costs of regasifying, shipping, and storing LNG in the global market. In addition, other sectors, such as vehicular fuel and industry can use LNG as a substitute. (iv) Nuclear Nuclear plants are inherently large compared to other technologies for power generation. Capacity of the present system is too small to accommodate a Nuclear power plant. However cabinet approval has been given to consider nuclear as an option to meet the future energy demand and also to consider Nuclear Power in the generation planning exercise and to carry out a pre feasibility study on the Nuclear Option. Nuclear option was included in this study as a candidate plant from year 2030 onwards. In addition, a project proposal too has been forwarded to IAEA for technical assistance in this regard. 4.3.5 Screening of Generation Options A preliminary screen of generation options is carried out in order to identify most appropriate expansion options. In fact it is quite difficult to handle large number of generation options in detailed analysis. The screening curve analysis, which is based on specific generation cost described in Chapter 6, is employed in the initial screening. Thermal plant database, which was updated by Electrowatt Engineering (EWE) during the Thermal Generation Options Study in 1996 [12] and again reviewed during the Review of Least Cost Generation Expansion Study in 1997 [14] and confirmed during the Master Plan study 2006 [27] was extensively used
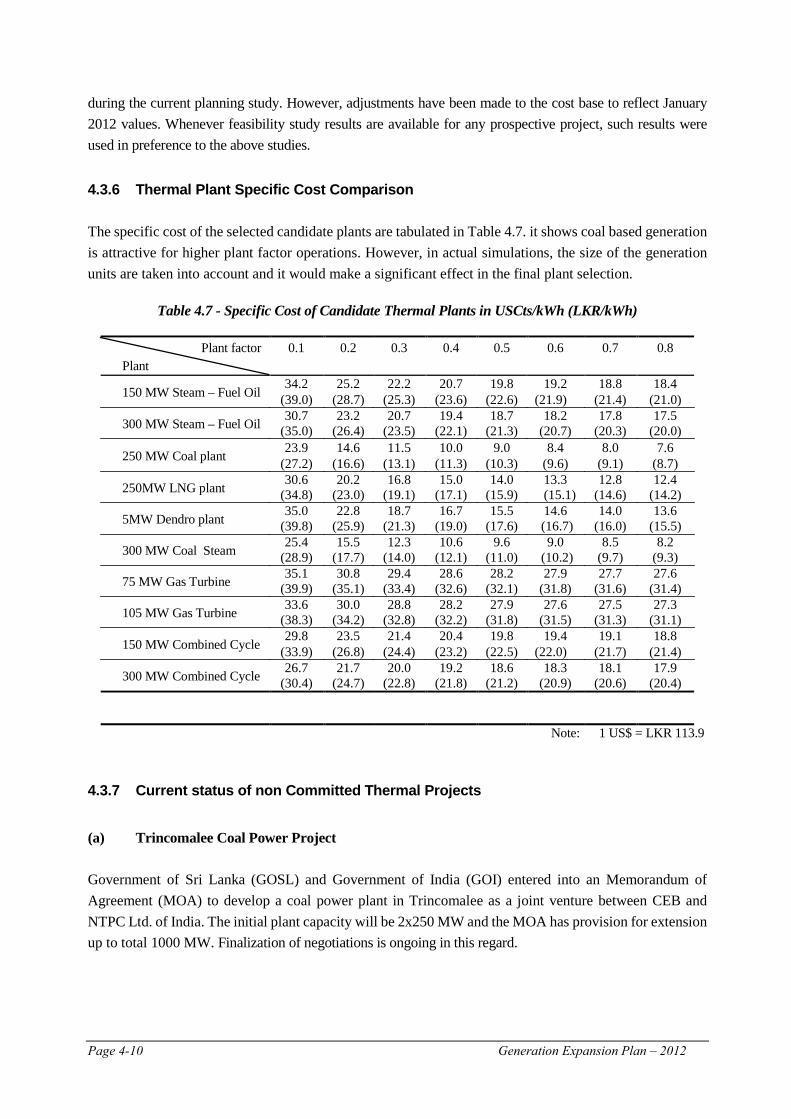
Page 4-10 Generation Expansion Plan – 2012
during the current planning study. However, adjustments have been made to the cost base to reflect January 2012 values. Whenever feasibility study results are available for any prospective project, such results were used in preference to the above studies. 4.3.6 Thermal Plant Specific Cost Comparison The specific cost of the selected candidate plants are tabulated in Table 4.7. it shows coal based generation is attractive for higher plant factor operations. However, in actual simulations, the size of the generation units are taken into account and it would make a significant effect in the final plant selection.
Table 4.7 - Specific Cost of Candidate Thermal Plants in USCts/kWh (LKR/kWh)
Plant factor Plant
0.1 0.2 0.3 0.4 0.5 0.6 0.7 0.8
150 MW Steam – Fuel Oil 34.2 25.2 22.2 20.7 19.8 19.2 18.8 18.4 (39.0) (28.7) (25.3) (23.6) (22.6) (21.9) (21.4) (21.0)
300 MW Steam – Fuel Oil 30.7 23.2 20.7 19.4 18.7 18.2 17.8 17.5 (35.0) (26.4) (23.5) (22.1) (21.3) (20.7) (20.3) (20.0)
250 MW Coal plant 23.9 14.6 11.5 10.0 9.0 8.4 8.0 7.6 (27.2) (16.6) (13.1) (11.3) (10.3) (9.6) (9.1) (8.7)
250MW LNG plant 30.6 20.2 16.8 15.0 14.0 13.3 12.8 12.4 (34.8) (23.0) (19.1) (17.1) (15.9) (15.1) (14.6) (14.2)
5MW Dendro plant 35.0 22.8 18.7 16.7 15.5 14.6 14.0 13.6 (39.8) (25.9) (21.3) (19.0) (17.6) (16.7) (16.0) (15.5)
300 MW Coal Steam 25.4 15.5 12.3 10.6 9.6 9.0 8.5 8.2 (28.9) (17.7) (14.0) (12.1) (11.0) (10.2) (9.7) (9.3)
75 MW Gas Turbine 35.1 30.8 29.4 28.6 28.2 27.9 27.7 27.6 (39.9) (35.1) (33.4) (32.6) (32.1) (31.8) (31.6) (31.4)
105 MW Gas Turbine 33.6 30.0 28.8 28.2 27.9 27.6 27.5 27.3 (38.3) (34.2) (32.8) (32.2) (31.8) (31.5) (31.3) (31.1)
150 MW Combined Cycle 29.8 23.5 21.4 20.4 19.8 19.4 19.1 18.8 (33.9) (26.8) (24.4) (23.2) (22.5) (22.0) (21.7) (21.4)
300 MW Combined Cycle 26.7 21.7 20.0 19.2 18.6 18.3 18.1 17.9 (30.4) (24.7) (22.8) (21.8) (21.2) (20.9) (20.6) (20.4)
Note: 1 US$ = LKR 113.9
4.3.7 Current status of non Committed Thermal Projects (a) Trincomalee Coal Power Project Government of Sri Lanka (GOSL) and Government of India (GOI) entered into an Memorandum of Agreement (MOA) to develop a coal power plant in Trincomalee as a joint venture between CEB and NTPC Ltd. of India. The initial plant capacity will be 2x250 MW and the MOA has provision for extension up to total 1000 MW. Finalization of negotiations is ongoing in this regard.
Generation Expansion Plan – 2012 Page 4-11
(b) Coal power plants in the Southern Coast
Southern Coal Power Project: The Government of Sri Lanka (GOSL) / Ceylon Electricity Board (CEB) invited Expressions of Interest from reputed firms for developing, building and operating of four coal fired generating units of 300 MW capacity on BOO basis. However, this process did not continue. CEB has identified locations near KaraganLewaya, Mirijjawila, Mirissaand, Mawellaas prospective sites in southern coast and Athuruwella in the Western Coast.
Mawella Coal Power Development Project: The Mawella site was studied to a pre-feasibility level as a candidate site for coal power development together with the other thermal options in 1988. The study proposed 600 MW coal power plant at the site. This site was reviewed during the 1996 under Thermal Generation Options Study and remains as a potential site for future coal power development.
4.4 India-Sri Lanka Transmission Interconnection The present discussion on the interconnection was initiated in 2006 and a primary level study was conducted by Power Grid Corporation, India and Nexant in 2006. According to the primary level studies, 500 MW transmission connection is considered as the first stage and is to be expanded up to 1000 MW later. A Memorandum of Understanding was signed for feasibility study in 2010.According to the MOU, a feasibility study is to be carried by CEB and Power Grid Corporation Indian Limited jointly. The feasibility work is in progress as at present.
Generation Expansion Plan - 2012 Page 5-1
CHAPTER 5 NON CONVENTIONAL RENEWABLE GENERATION
OPTIONS FOR FUTURE EXPANSION Renewable energy sources are continuously replenished by natural processes. A renewable energy system converts the energy found in sunlight, wind, falling water, sea-waves, geothermal heat, or biomass into a form we can use such as heat or electricity without exhausting the source. Most of the renewable energy comes either directly or indirectly from sun and wind and can never be exhausted, and therefore they are called renewable. The large or regulated hydro plants are considered as conventional generation options. Therefore only other renewable options – non conventional renewable options are considered in this chapter. Most of the non conventional renewable energy sources available for system expansion described in this chapter are mainly non-dispatchable due to their intermittent nature and are developed in small capacities. Therefore, presently system penetration is allowed considering the system limitations. However, with system expansion and development a higher penetration would be possible. This has been continued in parallel with the conventional generation expansion options. Sri Lanka has exploited large conventional renewable resources (hydro) to almost its maximum economical potential. Non Conventional Renewable Energy (NCRE) has become a prime potential source of energy for the future due to the low impact on environment compared with conventional sources of energy. Sri Lanka has a history of enabling local development of renewable energy resources in the electricity systems. This includes:
• Hydropower • Wind Energy • Biomass • Solar Power • Power from Municipal Solid Waste
As of 31st December 2012, approximately 314MW of embedded NCRE plants are connected to the National Grid. Out of this, contribution from mini hydro is 227 MW while biomass-agricultural & industrial waste penetration is 11.5 MW. Contribution to the system from solar power and wind power is 1.4MW and 74MW respectively. Though, the Ceylon Electricity Board initiated renewable energy development, it is presently the private sector, which is mainly involved in the NCRE development process. The renewable energy industry is rapidly growing in the country with both local and foreign investment. In comparison with the conventional large power plants, the total contribution from the NCRE sector to the National Grid still remains small but continues to increase and in 2011 the energy share of NCRE was 6.3%. Table 5.1 shows the system development and renewable energy development during the last 10 years in the Sri Lanka system. Recently a ‘Cost based technology specific three tiered tariff’ has been introduced as an incentive for NCRE development. Annex 5.1 gives the NCRE tariff announced in 2011 by the Public Utilities Commission of Sri Lanka.
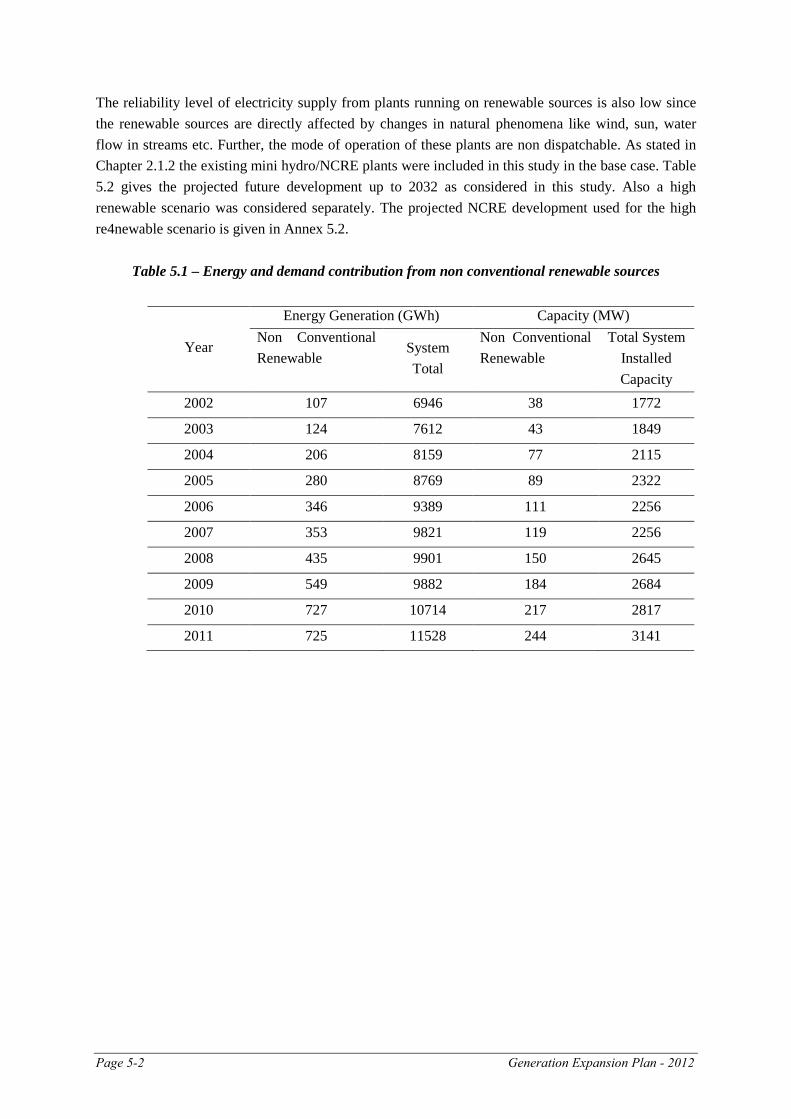
Page 5-2 Generation Expansion Plan - 2012
The reliability level of electricity supply from plants running on renewable sources is also low since the renewable sources are directly affected by changes in natural phenomena like wind, sun, water flow in streams etc. Further, the mode of operation of these plants are non dispatchable. As stated in Chapter 2.1.2 the existing mini hydro/NCRE plants were included in this study in the base case. Table 5.2 gives the projected future development up to 2032 as considered in this study. Also a high renewable scenario was considered separately. The projected NCRE development used for the high re4newable scenario is given in Annex 5.2.
Table 5.1 – Energy and demand contribution from non conventional renewable sources
Year
Energy Generation (GWh) Capacity (MW) Non Conventional Renewable
System Total
Non Conventional Renewable
Total System Installed Capacity
2002 107 6946 38 1772
2003 124 7612 43 1849
2004 206 8159 77 2115
2005 280 8769 89 2322
2006 346 9389 111 2256
2007 353 9821 119 2256
2008 435 9901 150 2645
2009 549 9882 184 2684
2010 727 10714 217 2817
2011 725 11528 244 3141
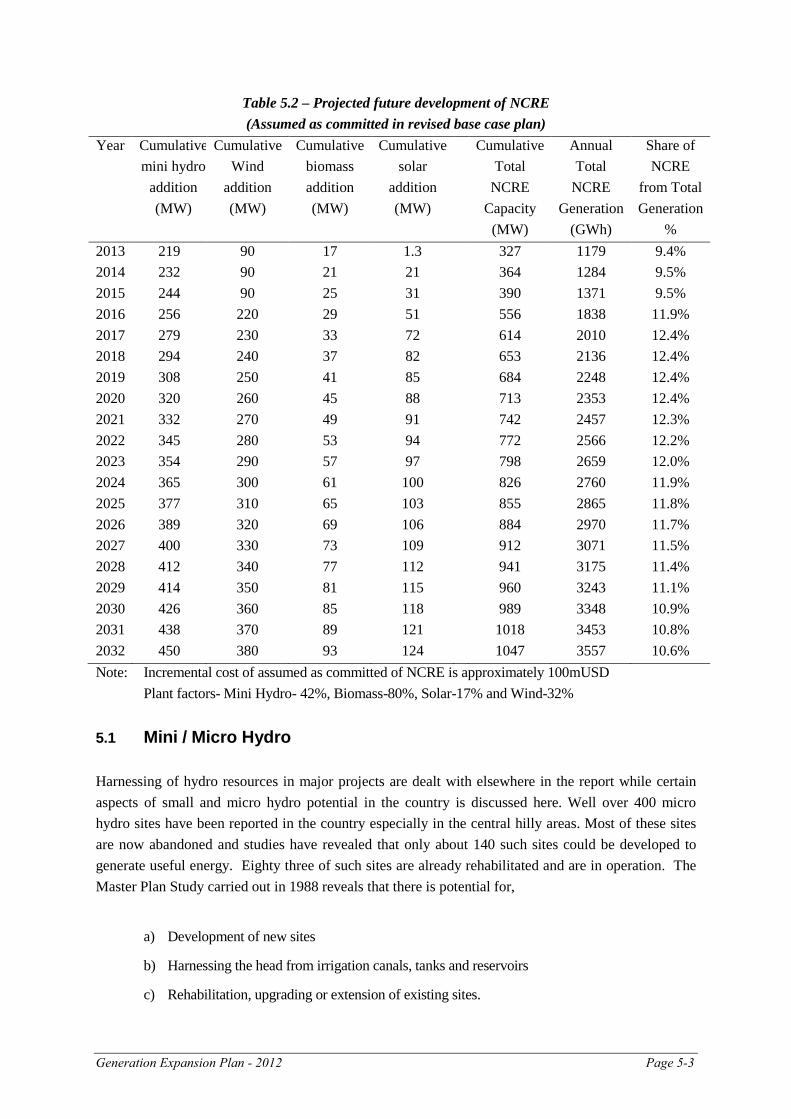
Generation Expansion Plan - 2012 Page 5-3
Table 5.2 – Projected future development of NCRE (Assumed as committed in revised base case plan)
Year Cumulative mini hydro
addition (MW)
Cumulative Wind
addition (MW)
Cumulative biomass addition (MW)
Cumulative solar
addition (MW)
Cumulative Total
NCRE Capacity
(MW)
Annual Total
NCRE Generation
(GWh)
Share of NCRE
from Total Generation
% 2013 2014 2015 2016 2017 2018 2019 2020 2021 2022 2023 2024 2025 2026 2027 2028 2029 2030 2031 2032
219 232 244 256 279 294 308 320 332 345 354 365 377 389 400 412 414 426 438 450
90 90 90 220 230 240 250 260 270 280 290 300 310 320 330 340 350 360 370 380
17 21 25 29 33 37 41 45 49 53 57 61 65 69 73 77 81 85 89 93
1.3 21 31 51 72 82 85 88 91 94 97
100 103 106 109 112 115 118 121 124
327 364 390 556 614 653 684 713 742 772 798 826 855 884 912 941 960 989
1018 1047
1179 1284 1371 1838 2010 2136 2248 2353 2457 2566 2659 2760 2865 2970 3071 3175 3243 3348 3453 3557
9.4% 9.5% 9.5%
11.9% 12.4% 12.4% 12.4% 12.4% 12.3% 12.2% 12.0% 11.9% 11.8% 11.7% 11.5% 11.4% 11.1% 10.9% 10.8% 10.6%
Note: Incremental cost of assumed as committed of NCRE is approximately 100mUSD Plant factors- Mini Hydro- 42%, Biomass-80%, Solar-17% and Wind-32% 5.1 Mini / Micro Hydro Harnessing of hydro resources in major projects are dealt with elsewhere in the report while certain aspects of small and micro hydro potential in the country is discussed here. Well over 400 micro hydro sites have been reported in the country especially in the central hilly areas. Most of these sites are now abandoned and studies have revealed that only about 140 such sites could be developed to generate useful energy. Eighty three of such sites are already rehabilitated and are in operation. The Master Plan Study carried out in 1988 reveals that there is potential for,
a) Development of new sites
b) Harnessing the head from irrigation canals, tanks and reservoirs
c) Rehabilitation, upgrading or extension of existing sites.
Page 5-4 Generation Expansion Plan - 2012
According to the Master Plan, it was estimated that 30 MW of small hydro potential exists in about 60 undeveloped sites while further 8 MW exist in about 290 irrigation tanks and reservoir sites. Another 50 MW of small hydro potential can be tapped in about 140 sites, which can either be rehabilitated or re-developed. According to a study carried out by the ITDG in 1999 [19], in addition to the 50 MW potential identified by the Master Plan as mentioned above, the exploitable small hydro potential in Sri Lanka has been estimated to be around 100 MW from about 250 identified sites. However, the present development of mini hydro (less than 10MW) has surpassed the above estimates. As of 31st October 2012, 217MW of mini hydro plants are connected to the grid while another 153MW have signed the Standard Power Purchase Agreement (SPPA) with CEB. More projects are at the initial provisional approval state with the Sri Lanka Sustainable Energy Authority (SEA). This development was mainly due to the very attractive tariff offered to developers, first based on the avoided cost principle and presently on the cost reflective principle. 5.2 Wind Studies have revealed that wind is the most promising option of the available renewable sources, for power generation in Sri Lanka. The Pre-Electrification Unit of CEB carried out a resource assessment study of solar and wind potential in 1992 [20]. This study revealed an overall wind potential of 8 MW/sqkm in open land area or an overall potential of approximately 200 MW in the South-eastern quarter of the island. In March 1999, CEB commissioned a pilot scale 3 MW wind power plant in Hambantota, which is in the Southeast of the country. In year 2011, the Wind plant operated at a plant factor of 10.1% while in 2010 the plant factor was 11.4%. A study of wind energy resource assessment of Puttalam and Central regions carried out by the CEB in 2002, [21] too has produced encouraging results on wind energy potential in both Puttalam and Central regions. The wind mapping study conducted by the US National Renewable Energy Laboratory (NREL) in 2004 [23] has also confirmed that Sri Lanka has many areas estimated to have good wind resources. These resources tend to be located in the North-western coastal region from Kalpitiya Peninsular to Mannar Island, Jaffna Peninsular and the Central highlands. NREL estimates suggest that nearly 5000 sq. km of wind resource potential exists in Sri Lanka where they recommend additional studies to assess the practical resources by accounting for the transmission grid accessibility. Renewable Energy Resource Development Plan 1/2012 prepared by Sri Lanka Sustainable Energy Authority identified the district wise distribution of gross availability of renewable energy resources of different type of renewable energy sources.
Generation Expansion Plan - 2012 Page 5-5
By end October 2012, the private sector has developed wind power plants around Puttalam, Kalpitiya and Ambewela areas adding 74MW to the National Grid. Further, Power Purchase agreements have been signed for another 31MW. The next step in the wind power development in the country is expected to be the wind park concept to be implemented in the Mannar area. CEB is currently pursuing a novel concept to develop a 100MW Wind Farm at Mannar Island on Semi Dispatchable basis to overcome absorption constraints in Wind Technology. 5.3 Wood Fuel / Dendro Power Use of biomass mainly wood fuel in thermal plants have attracted widespread interest as a primary energy source for electricity generation, due to its potential as an indigenous source of energy for the country. In addition to this, there are other benefits mainly resulting from reduced soil erosion, restoration of degraded lands, creation of local employment and various potential environmental benefits. Maintaining a regular supply of biomass to fuel the plant is foreseen as a major hindrance for effective implementation of commercial scale dendro plants. The perceived spectrum of benefits from dendro power is based on the presumption that the fuel for power generation is from dedicated plantations and that forests or existing vegetation would not be affected. By 31st October 2012 , 0.5MW dendro plant in operation and SPPA had been signed for 62MW. The use of agricultural or industrial waste for Electricity Generation is similar to wood fuel use. As at the above date, there were 11MW of such plants in operations and contracts have been signed for 4MW. 5.4 Solar There are two distinct approaches to generating electricity from solar energy:
• Solar Thermal engines • Photovoltaic (PV) cells
Solar thermal engines use a solar collector to create temperatures sufficient to raise steam and drive a turbine generator. This technology is normally used in the areas that are hot, dry and sunny. A PV cell converts sunlight directly into electricity and is a well-established technology particularly for sites that are far from the distribution network. Electricity generated directly from solar energy is still a quite costly option for grid connection. However, solar electricity is a viable option by itself, or as a component of hybrid systems for off grid power systems, which cater to electricity demand in far remote areas. Grid connected capacity of solar power projects was 1.4MW by end October 2012.
Page 5-6 Generation Expansion Plan - 2012
5.5 Municipal Solid Waste Power generation using solid waste is being considered by the most of Local Authorities in the country. This could be a satisfactory solution for proper disposal of solid wastes generated by the human activities. Disposal of solid waste is the primary function of such facility and the power generation is a secondary function. Since this is directly linked with solid waste disposal of urban areas, CEB considers these plants separately taking into account the importance of solid waste disposal. However, so far waste to power project has been implemented even though several Letters of Intent (LOI) had been issued by Ceylon Electricity Board and Sri Lanka Sustainable Energy Authority to many developers. 5.6 Other Other forms of renewable energy such as Wave, OTEC, Solar Chimney, and other solar thermal applications are still at the demonstration stage. However they have been given the opportunity to implement these technologies by offering the other tariff category in the NCRE tariff as “other”, Solar too comes under this category. 5.7 Net Metering
The “Energy Banking Facility” for such micro-scale generating facilities, commonly known as the “Net Energy Metering Facility” by the electricity utilities for their electricity consumers has been introduced in Sri Lanka. This scheme allows any electricity consumer to install a renewable energy based electricity generating facility and connect it to the CEB’s electricity network. The electricity network connection scheme shall be approved by CEB.
The utility energy meter is replaced with an Import/Export meter. The electrical energy consumed from the grid is considered as import energy and electrical energy generated and supplied to the grid is considered as export energy.
At the end of each billing period, CEB reads the consumer’s export energy meter reading and the import meter reading. The electricity bill will be prepared giving credit to the export, and charging the consumer for the difference between the import and the export. If the export is more than the import in any billing period, the consumer receives an export credit, and is credited towards his next month’s consumption. Such credits may be carried-over to subsequent months, as long as there is no change in the legal consumer for the premises.
The key factor in this process is that there will be no financial compensation for the excess energy exported by the consumer. All exports are set-off against the consumer’s own consumption, either in the current billing period or future billing periods. Accordingly, consumers are compelled to select the capacity of the renewable energy equipment to reasonably match his requirements. Facilities with maximum demand less than 42kVA (Upper capacity limit has been increased from 42 kVA to 10 MW at present) are allowed to install “net” metering equipment and generally it is installed on the low voltage side.
Generation Expansion Plan - 2012 Page 5-7
5.8 Inclusion of NCRE in the LTGEP
Renewable sources of energy will play a supplementary role in the national context while playing a very important role in decentralised applications, in meeting electrical energy needs of rural and remote communities. NCRE has not been considered as a candidate in this study due to its intermittent nature. However, an expected development in NCRE has been assumed as committed (Table 5.2) and modelled accordingly. The four major types of NCRE technologies were modelled in different ways and described in detail in section 6.4.8.
5.9 Development of NCRE According to the National Energy Policy and the “Mahinda Chinthana 10 year development framework”, a 10% share is targeted from NCRE source by 2015 in electricity generation. Government of Sri Lanka established the Sustainable Energy Authority (SEA) on 01 October 2007, enacting the Sri Lanka Sustainable Energy Authority Act No. 35 of 2007 of the Parliament of the Democratic Socialist Republic of Sri Lanka. SEA is expected to develop indigenous renewable energy resources and drive Sri Lanka towards a new level of sustainability in energy generation and usage; to declare energy development areas; to implement energy efficiency measures and conservation programmes; to promote energy security, reliability and cost effectiveness in energy delivery and information management. The objective of the SEA is to identify, promote, facilitate, implement and manage energy efficiency improvements and energy conservation programmes in domestic, commercial, agricultural, transport, industrial and any other relevant sector. SEA will guide the nation in all its efforts to conserve energy resources through exploration, facilitation, research & development and knowledge management in the journey of national development. Also SEA will promote energy security, reliability and cost-effectiveness of energy delivery to the country by policy development and analysis and related information management. Further the authority will ensure that adequate funds are available to implement its objects, consistence with minimum economic cost of energy and energy security for the nation, thereby protecting natural, human and economic wealth by embracing best sustainability practices. Relating to power development, SEA will hold two key sensitive parts namely declaration of energy development area and on-grid & off-grid renewable energy resources. CEB and SEA will have to play a complementary role to each other in the future in order to optimise the power generation from NCRE. Further, Government of Sri Lanka established the Sri Lanka Energies (Pvt) Ltd, a 100% Ceylon Electricity Board owned company on 12th July 2012 to accelerate the electricity generation through renewable energy resources and to provide facilities.
Generation Expansion Plan - 2012 Page 6-1
CHAPTER 6 GENERATION EXPANSION PLANNING METHODOLOGY AND
PARAMETERS CEB considers the project concepts from all possible sources including CEB owned generation developments, large thermal plants from the independent power producers and supply of non-conventional energy sources in order to meet the system demands. Several factors are taken in to account in this process of selecting the appropriate power development project. Commercially exploitable potential, technical feasibility studies, environment impact assessment and economic feasibility are the main factors of this selection process. In parallel with these factors, the Grid Code of Public Utilities Commission of Sri Lanka, planning guidelines of Ministry of Power and Energy and National Energy Policy are also accounted in the planning process. Long-term generation expansion plan is the outcome of the selection process. The methodology adopted in the process is described in this chapter. 6.1. Grid Code Generation Planning
Both following Grid codes and the Ministry guidelines are considered in preparing the Long Term Generation Expansion Plan 2013-2032. • Draft Generation Planning Code under the Grid Code issued by the Transmission Licensee based on the
PUCSL Grid Code issued in April and in May 2012. • The Ministry of Power and Energy issued a set of “Guidelines on Long Term Generation Expansion
Planning” in October 2011.
6.2. National Energy Policy Ministry of Power and Energy published the National Energy Policy of Sri Lanka in July 2006 for the public comments. This document spells out the implementing strategies, specific targets and milestones through which the Government of Sri Lanka and its people would endeavor to develop and manage the energy sector in the coming years. Specific new initiatives are included in this policy to expand the delivery of affordable energy services to a larger share of the population, to improve energy sector planning, management and regulation. Institutional responsibilities to implement each policy element and associated strategies to reach the specified targets are also stated in this document. The “National Energy Policy and Strategies of Sri Lanka” is elaborated in three sections in this policy document as follows. • “Energy Policy Elements” consists of the fundamental principles that guide the development and future
direction of Sri Lanka’s Energy Sector. • “Implementing Strategies” states the implementation framework to achieve each policy element. • “Specific Targets, Milestones and Institutional Responsibilities” state the national targets, and the
planning and institutional responsibilities to implement the strategies.
Page 6-2 Generation Expansion Plan - 2012
Some policy elements, specific targets and milestones related to electricity sector are to be addressed in the plan in order to identify financial and other institutional requirement related to the policy. These policy elements include: • Providing electricity at the lowest possible cost to enhance the living standard of the people, • Ensuring energy security by diversified energy mix, • Consideration of efficiency improvements and indigenous resources for the future developments, • Consideration of system reliability, proven technologies, appropriate unit sizes etc. to improve quality of
supply, • Consideration of environmental impacts. National Energy Policy and Strategies of Sri Lanka shall be reviewed and revised after a period of three years. Since the revised document has not been published 2006 guidelines were used in the preparation of the Long-Term Generation Expansion Plan 2013-2032. At present, committee has been appointed for development of a ‘Road Map to Achieve Energy Security’, considering the other alternative options of fuels giving due consideration for other aspects such as CO2 emission, renewable integration, fuel diversity etc. In the Long-Term Generation Expansion Plan 2013-2032, case studies were carried out to facilitate the information required for reviewing of the National Energy Policy to include the fuel diversity on the basis of achieving Energy Security. 6.3 Preliminary Screening of Generation Options There are many technologies from many prime sources of energy in various stages of development. However, it is difficult to analyze in detail all these options together. Therefore, several power generation technologies are considered in the initial screen of generation options to select the technologies and prime source of energy to be included in the LTGEP. When alternative plants with varying capital investments, operation costs, maintenance and repair costs and lifetimes etc. are to be analyzed, it is necessary to employ an indicator common to all plants. Therefore, screening curve method, in which specific generation costs expressed in US Cents/kWh are calculated at different plant factors for all available thermal plants, is employed primarily in order to select the appropriate options among all the available thermal options. Details of the screening curve methodology are given in Annex 6.1. Then the detailed planning methodology described in section 6.4is used to finalize the Least Cost Generation Expansion Plan. Several conventional thermal generation technologies at different capacities and a number of selected hydro options are to be studied together in order to identify the Long term Generation Expansion Plan. 6.4 Detailed Planning Exercise State of the art optimization and simulation models are used in the detailed generation planning exercise. Internationally accepted planning methodologies, wherever possible, are adopted during the formulation of the Long term Generation Expansion Plan. The SYstem SIMulation package (SYSIM), developed during the Master Plan Study in 1989 and updated in 2006 and Wien Automatic System Planning (WASP)package -WASP IV developed by International Atomic
Generation Expansion Plan - 2012 Page 6-3
Energy Agency (IAEA)tools were extensively used in conducting the system expansion planning studies to determine optimal Long Term Generation Expansion Plan.
6.4.1 SYSIM Simulation Model System Simulation package is used to simulate the operating performance of integrated water resources provided that adequate thermal capacity is available for optimal generation dispatch. It is also used to evaluate the potential contribution that candidate hydro power plants could be expected to make in meeting future demands for electricity. Rainfall data of past 50 years in the catchment areas of the existing and candidate hydro plants are taken into account to derive the energy and capacity availabilities associated with plants. The potential of hydro power projects/systems evaluated using SYSIM is used as input information to the WASP IV package. Since WASP package could accommodate only a maximum of five hydro conditions, five representative hydrological conditions were selected with different probability levels depicting very wet, wet, average, dry and very dry hydro conditions. 6.4.2 WASP Package
Generation Planning section uses the latest version of the WASP package (WASP IV) for its expansion planning studies. WASP is used to find the economically optimal expansion policy for a power generating system within user-specified constraints. WASP IV has seven modules. It utilizes probabilistic estimation of system production costs, expected cost of unserved energy and reliability to produce the optimal generation expansion sequence for the system for the stipulated study period. Also, it can be used to carry out power generation expansion planning taking into consideration fuel availability and environment constraints. Probabilistic Simulation, Linear Programming and Dynamic Programming are the simulation and optimization methods used in WASP-IV tool. 6.4.3 Hydro Power Development Hydro resource is one of the main indigenous sources of energy and lifetime of a hydro plant is quite high compared to the other alternative sources. Therefore, these hydro plants are considered separately outside the LTGEP in addition to the hydrothermal simulation. In this alternate process, economic analysis is carried out for each project with the consideration of avoided thermal plant of the LTGEP. Then technical feasibility studies and environmental impact assessments are processed for economically feasible projects. Next step is sourcing funds. Once all these requirements are fulfilled, the project is incorporated to the LTGEP as a committed plant. 6.4.4 Assessment of Environmental Implications and Financial Scheduling Though the environmental effects of each thermal and hydro option are considered in the initial selection, overall assessment of environmental implications is carried out for the proposed LTGEP. That assessment is for the plant emission after the possible environmental mitigation measures are taken.
Page 6-4 Generation Expansion Plan - 2012
Other two aspects of the planning process are the implementation and financing. In fact, the total period of implementation of a project including feasibility studies varies from 4 years for a gas turbine and 8 years for a coal-fired plant. Similarly implementation period of a hydro plant is in the range of 7 to 8 years. Therefore, implementation scheduling is an important event of the planning process. Furthermore, generation system expansion is highly capital cost intensive. Therefore, during the planning period financial schedule is prepared in order to identify the financial requirement which is essential for negotiation and sourcing of funds from various sources and for projecting tariffs. 6.4.5 Modeling of NCRE As stated in Chapter 5, NCRE was not included as candidates. According to the Grid code published by PUCSL existing NCRE plants are considered as committed for the Reference Case. But a projected development was considered as committed and incorporated to the Base case of the LTGEP. The main technologies of NCRE; mini-hydro, wind, solar and dendro were modeled differently in the WASP. Dendro which was modeled as a thermal plant, which is a thermal plant having a non-fossil fuel. The energy contribution from the projected wind and solar development were considered as available and reduced from the generation forecast. But a capacity contributions from wind and solar were not considered. Mini hydro was included in the WASP as lumped ‘run of the river’ hydro plants. The probabilistic monthly energy was calculated based on past performance of mini hydro plants. In the high NCRE development of scenario, wind power plants were modeled as considering capacity contribution to the dispatch. 6.5 Study Parameters The preparation of the plan is based on several parameters and constraints. These include technical and economical parameters and constraints which are to be used as input to WASP IV. Parameters and constraints given in Grid Code of PUCSL were used for in the studies and those are described in detail. 6.5.1 Study Period
The results of base case and all sensitivity studies are presented in the report for a period of 20 years (2013-2032). In this regard, the studies were conducted for a period of 25 years (2013-2037). 6.5.2 Economic Ground Rules All analyses were performed based on economic (border) prices for investments and operations. The exchange rate used in the present study is 113.89 LKR/USD. This is the average value of January 2012 exchange rates. All costs are based on 1st of January 2012. 6.5.3 Plant Commissioning and Retirements
It is assumed that the power plants are commissioned or retired at the beginning of each year. Such limitations are common in the long term planning tools.
Generation Expansion Plan - 2012 Page 6-5
6.5.4 Cost of Energy Not Served (ENS) The average loss to the economy due to electrical energy not supplied has been estimated as0.5335USD/kWh (in 2012 prices). This value has been derived by escalating the ENS figure given by PUCSL as 0.5USD/kWh in 2011. 6.5.5 Loss of Load Probability (LOLP) According to the Draft Grid Code LOLP maximum value is given as 1.5%. This corresponds to cumulative failure duration of 5.5 days/year for the generating system. However, this is not used as a constraint in the development of optimal expansion plans in the initial 2 years of the planning horizon. 6.5.6 Reserve Margin Reserve margin is the other available reliability criteria of the WASP-IV module. Minimum value of 2.5% and Maximum value of 20% have been applied for the studies. However, minimum 2.5% of reserve margin is not being used as a constrain in the development of optimal expansion plan up to year 2015 due to the limitations in the construction of new plants. 6.5.7 Discount Rate The discount rate is used in order to analyze the economic costs and benefits at different times. The discount rate accounts several factors such as time value of money, earning power, budget constraints, purchasing power, borrowing limitations and utility of the money. Considering these facts, 10% discount rate was used for planning studies. Sensitivity to the discount rate is analyzed by applying two discount rates. 6.5.8 Assumptions and Constraints Applied The following were the assumptions and constraints that were applied to all cases studied.
a) All costs are based on economic prices for investment on generating plants. Furthermore, thermal plants will be dispatched in strict merit order, resulting in the lowest operating cost.
b) All plant additions and retirements are carried out at the beginning of the year.
c) Gas Turbine plants can be available only by January 2015. For Gas Turbines, the construction period
is about 1.5 years, but in the absence of any detailed designs for a power station, it may require 2 years for the pre-construction and construction activities.
d) 20MW Northern Power Diesel Plant is considered as a committed plant in 2014.This plant is already
supplying power to the isolated Northern Power System. However, the Northern Grid is expected to be interconnected to the National Grid in late 2013 with the reconstruction of Killinochchi-Chunnakam132kV transmission line. Additionally 24MW Diesel engines running on furnace oil has
Page 6-6 Generation Expansion Plan - 2012
been added as an extension to Chunnakam Power Station, Jaffna in 2013. This is also considered as a committed plant in 2014.
e) Puttalam coal power plant Stage II and Stage III(2x300MW) are considered as committed plants in 2014 and 2015 respectively.
f) Trincomalee Coal Development consisting of four 250MW units(4x250MW) is considered as a candidate from 2018 onwards. The total capacity of the plant is limited to 1000MW.
g) 35MW Broadlands and 120MW UmaOya Hydro Power Plants are considered as committed plants in
2016.
h) LNG operated combined cycle power plant is considered as a candidate from 2018 onwards for all the scenarios.
i) 4MW Dendro Power Plant is modeled from the data received from Sustainable Energy Authority. Where the number of Dendro power plants allowable for a particular year of base case study was predefined. In scenario studies, total Dendro power plant capacity is limited to108MW.
j) 5x17 MW and 115MW Gas turbine plants at Kelanitissa will be retired in January 2019 and January 2023 respectively.
k) 4x18 MW power plants at Sapugaskanda will be retired in 2019. 8x9MW Sapugaskanda extensions will be retired in two stages in January 2023 and January 2025.
l) Term of contracts of IPP Plants; 22.5MW Lakdhanavi, 20MW ACE Power Matara and 20MW ACE Power Horana , expired in 2012 will be extended by 5 years until January 2018 by following the policy framework developed for the extension of IPPs. - Refurbishment and operational cost data were obtained from the proposals received by the Energy
Purchases Branch of CEB. - Following studies were carried out to check the economic viability of the extension of IPP plants
expired in 2012: . - With No IPP extensions. - ACE Matara, Horana and Lakdhanavi with 5 year extension. - ACE Matara, Horana 5 year and Lakdhnavi 2 year extension. - ACE Matara and Horana 5 Year extension. It was found that extension of all three plants by 5 years would be beneficial.
m) The contracts of 60 MW Colombo Power, 100MW Heladanavi and 100MW ACE Embilipitiya will expire in 2015.Contracts of 20MW Northern Power and 49 MW Asia Power Plant will expire in 2018. In addition, the contract of 163 MW AES Power Plant at Kelanitissa will expire in 2023.
n) 27MW Moragolla and 49MW Gin Ganga Hydro Power Plants are considered as candidates from 2018 and 2024 onwards respectively.
o) 600MW Nuclear Power Plant considered as a candidate from year 2030 onwards.
p) Net generation values were used in planning studies instead of gross values.
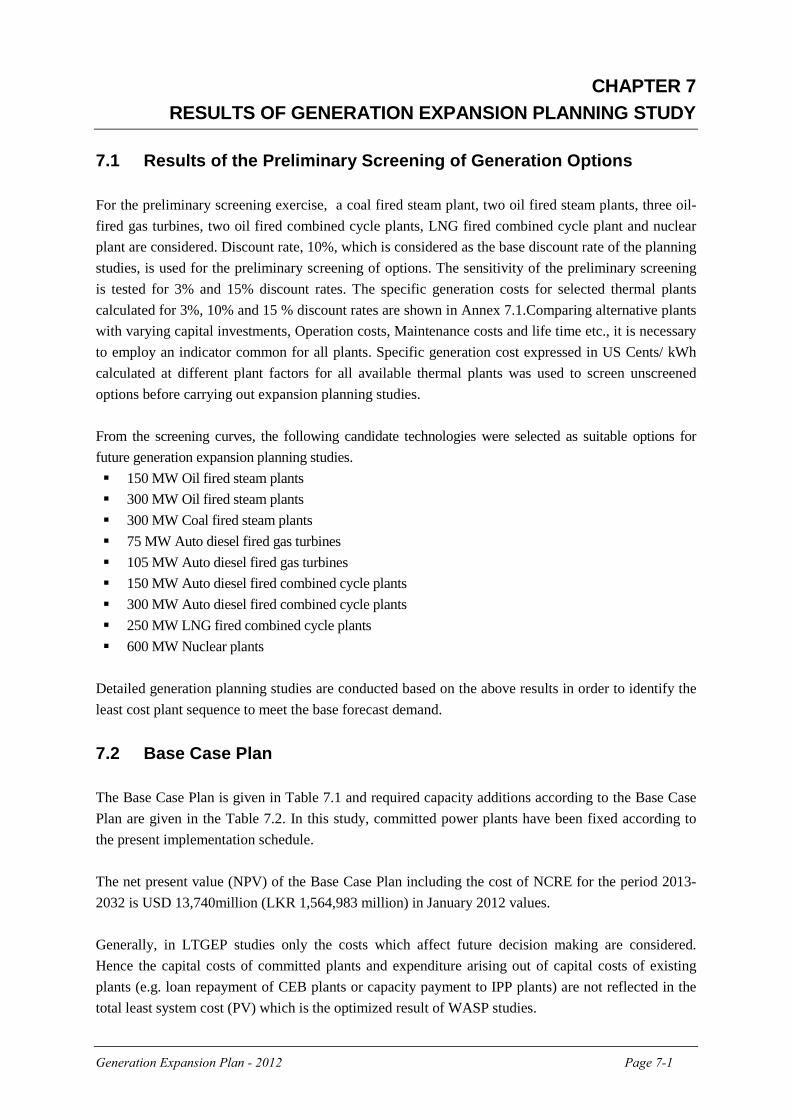
Generation Expansion Plan - 2012 Page 7-1
CHAPTER 7 RESULTS OF GENERATION EXPANSION PLANNING STUDY
7.1 Results of the Preliminary Screening of Generation Options For the preliminary screening exercise, a coal fired steam plant, two oil fired steam plants, three oil-fired gas turbines, two oil fired combined cycle plants, LNG fired combined cycle plant and nuclear plant are considered. Discount rate, 10%, which is considered as the base discount rate of the planning studies, is used for the preliminary screening of options. The sensitivity of the preliminary screening is tested for 3% and 15% discount rates. The specific generation costs for selected thermal plants calculated for 3%, 10% and 15 % discount rates are shown in Annex 7.1.Comparing alternative plants with varying capital investments, Operation costs, Maintenance costs and life time etc., it is necessary to employ an indicator common for all plants. Specific generation cost expressed in US Cents/ kWh calculated at different plant factors for all available thermal plants was used to screen unscreened options before carrying out expansion planning studies. From the screening curves, the following candidate technologies were selected as suitable options for future generation expansion planning studies. 150 MW Oil fired steam plants 300 MW Oil fired steam plants 300 MW Coal fired steam plants 75 MW Auto diesel fired gas turbines 105 MW Auto diesel fired gas turbines 150 MW Auto diesel fired combined cycle plants 300 MW Auto diesel fired combined cycle plants 250 MW LNG fired combined cycle plants 600 MW Nuclear plants
Detailed generation planning studies are conducted based on the above results in order to identify the least cost plant sequence to meet the base forecast demand. 7.2 Base Case Plan The Base Case Plan is given in Table 7.1 and required capacity additions according to the Base Case Plan are given in the Table 7.2. In this study, committed power plants have been fixed according to the present implementation schedule. The net present value (NPV) of the Base Case Plan including the cost of NCRE for the period 2013-2032 is USD 13,740million (LKR 1,564,983 million) in January 2012 values. Generally, in LTGEP studies only the costs which affect future decision making are considered. Hence the capital costs of committed plants and expenditure arising out of capital costs of existing plants (e.g. loan repayment of CEB plants or capacity payment to IPP plants) are not reflected in the total least system cost (PV) which is the optimized result of WASP studies.
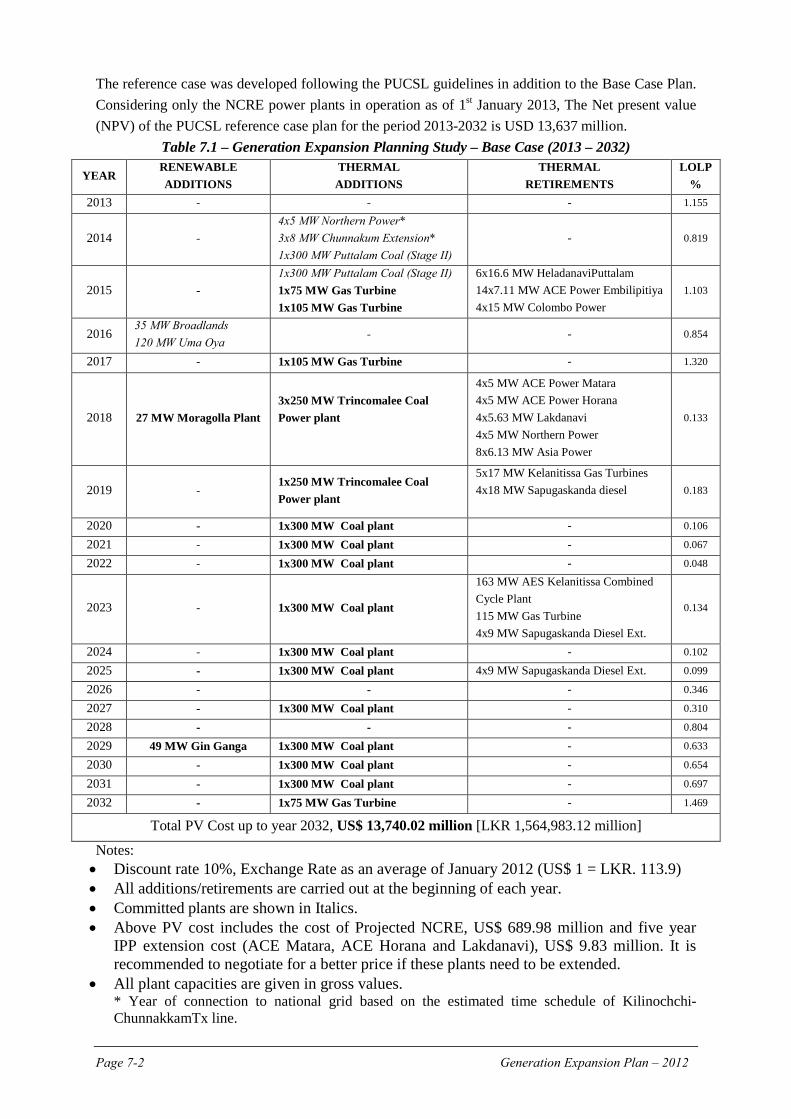
Page 7-2 Generation Expansion Plan – 2012
The reference case was developed following the PUCSL guidelines in addition to the Base Case Plan. Considering only the NCRE power plants in operation as of 1st January 2013, The Net present value (NPV) of the PUCSL reference case plan for the period 2013-2032 is USD 13,637 million.
Table 7.1 – Generation Expansion Planning Study – Base Case (2013 – 2032)
YEAR RENEWABLE ADDITIONS
THERMAL ADDITIONS
THERMAL RETIREMENTS
LOLP %
2013 - - - 1.155
2014 - 4x5 MW Northern Power* 3x8 MW Chunnakum Extension* 1x300 MW Puttalam Coal (Stage II)
- 0.819
2015 - 1x300 MW Puttalam Coal (Stage II) 1x75 MW Gas Turbine 1x10⁵ MW Gas Turbine
6x16.6 MW HeladanaviPuttalam 14x7.11 MW ACE Power Embilipitiya 4x15 MW Colombo Power
1.103
2016 35 MW Broadlands 120 MW Uma Oya
- - 0.854
2017 - 1x10⁵ MW Gas Turbine - 1.320
2018 27 MW Moragolla Plant 3x250 MW Trincomalee Coal Power plant
4x5 MW ACE Power Matara 4x5 MW ACE Power Horana 4x5.63 MW Lakdanavi 4x5 MW Northern Power 8x6.13 MW Asia Power
0.133
2019 - 1x250 MW Trincomalee Coal Power plant
5x17 MW Kelanitissa Gas Turbines 4x18 MW Sapugaskanda diesel
0.183
2020 - 1x300 MW Coal plant - 0.106
2021 - 1x300 MW Coal plant - 0.067
2022 - 1x300 MW Coal plant - 0.048
2023 - 1x300 MW Coal plant
163 MW AES Kelanitissa Combined Cycle Plant 115 MW Gas Turbine 4x9 MW Sapugaskanda Diesel Ext.
0.134
2024 - 1x300 MW Coal plant - 0.102
2025 - 1x300 MW Coal plant 4x9 MW Sapugaskanda Diesel Ext. 0.099
2026 - - - 0.346
2027 - 1x300 MW Coal plant - 0.310
2028 - - - 0.804
2029 49 MW Gin Ganga 1x300 MW Coal plant - 0.633
2030 - 1x300 MW Coal plant - 0.654
2031 - 1x300 MW Coal plant - 0.697
2032 - 1x75 MW Gas Turbine - 1.469
Total PV Cost up to year 2032, US$ 13,740.02 million [LKR 1,564,983.12 million]
Notes: • Discount rate 10%, Exchange Rate as an average of January 2012 (US$ 1 = LKR. 113.9) • All additions/retirements are carried out at the beginning of each year. • Committed plants are shown in Italics. • Above PV cost includes the cost of Projected NCRE, US$ 689.98 million and five year
IPP extension cost (ACE Matara, ACE Horana and Lakdanavi), US$ 9.83 million. It is recommended to negotiate for a better price if these plants need to be extended.
• All plant capacities are given in gross values. * Year of connection to national grid based on the estimated time schedule of Kilinochchi-ChunnakkamTx line.
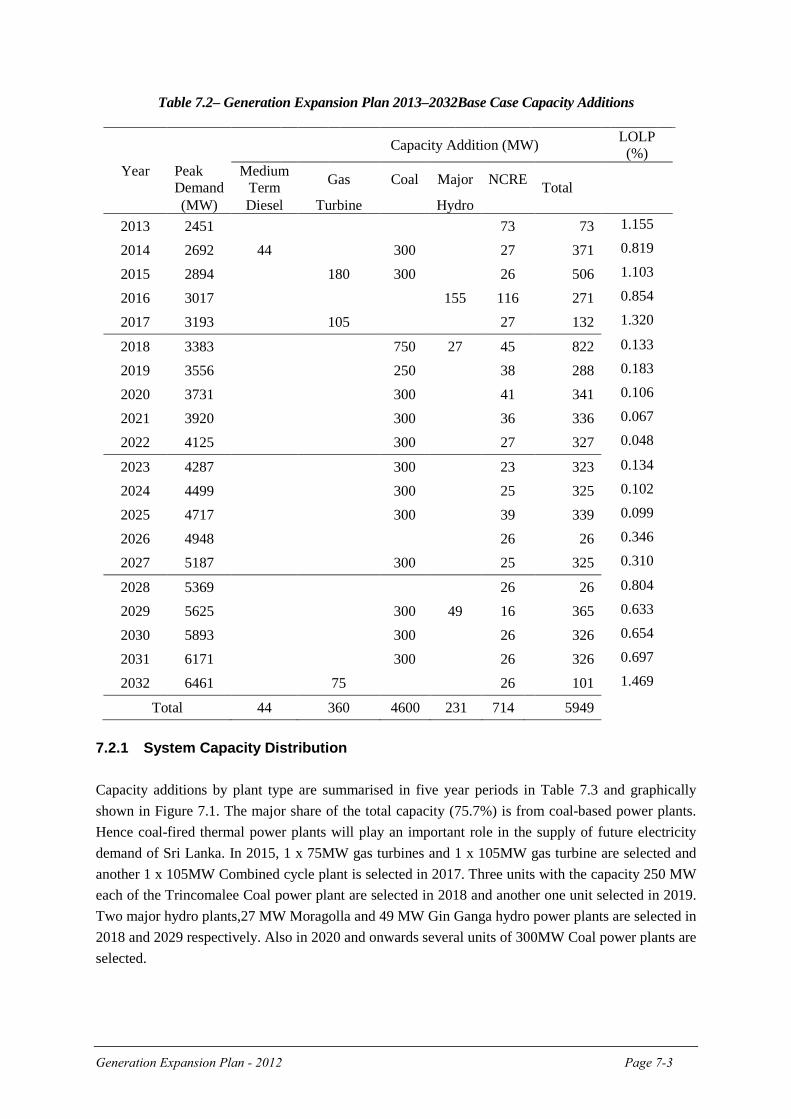
Generation Expansion Plan - 2012 Page 7-3
Table 7.2– Generation Expansion Plan 2013–2032Base Case Capacity Additions
Year
Capacity Addition (MW) LOLP (%)
Peak Demand
Medium Term Gas Coal Major NCRE Total
(MW) Diesel Turbine Hydro 2013 2451 73 73 1.155
2014 2692 44 300 27 371 0.819
2015 2894 180 300 26 506 1.103
2016 3017 155 116 271 0.854
2017 3193 105 27 132 1.320
2018 3383 750 27 45 822 0.133
2019 3556 250 38 288 0.183
2020 3731 300 41 341 0.106
2021 3920 300 36 336 0.067
2022 4125 300 27 327 0.048
2023 4287 300 23 323 0.134
2024 4499 300 25 325 0.102
2025 4717 300 39 339 0.099
2026 4948 26 26 0.346
2027 5187 300 25 325 0.310
2028 5369 26 26 0.804
2029 5625 300 49 16 365 0.633
2030 5893 300 26 326 0.654
2031 6171 300 26 326 0.697
2032 6461 75 26 101 1.469
Total 44 360 4600 231 714 5949 7.2.1 System Capacity Distribution
Capacity additions by plant type are summarised in five year periods in Table 7.3 and graphically shown in Figure 7.1. The major share of the total capacity (75.7%) is from coal-based power plants. Hence coal-fired thermal power plants will play an important role in the supply of future electricity demand of Sri Lanka. In 2015, 1 x 75MW gas turbines and 1 x 10⁵MW gas turbine are selected and another 1 x 10⁵MW Combined cycle plant is selected in 2017. Three units with the capacity 250 MW each of the Trincomalee Coal power plant are selected in 2018 and another one unit selected in 2019. Two major hydro plants,27 MW Moragolla and 49 MW Gin Ganga hydro power plants are selected in 2018 and 2029 respectively. Also in 2020 and onwards several units of 300MW Coal power plants are selected.
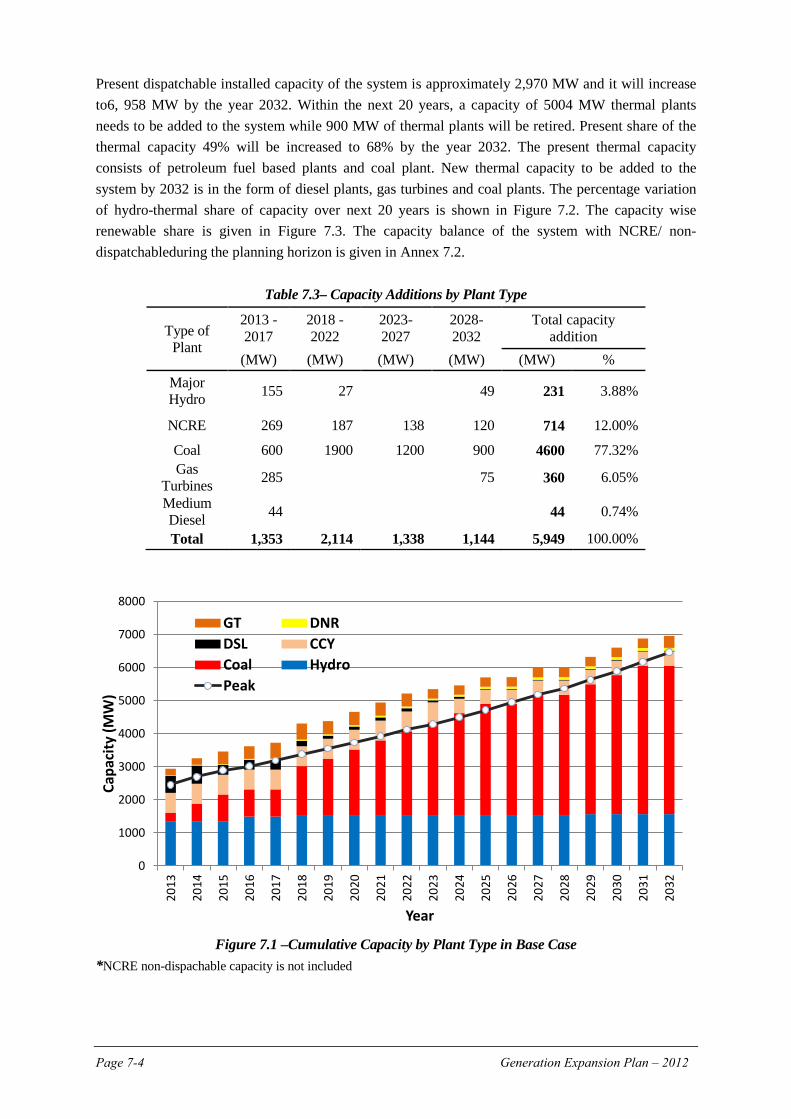
Page 7-4 Generation Expansion Plan – 2012
Present dispatchable installed capacity of the system is approximately 2,970 MW and it will increase to6, 958 MW by the year 2032. Within the next 20 years, a capacity of 5004 MW thermal plants needs to be added to the system while 900 MW of thermal plants will be retired. Present share of the thermal capacity 49% will be increased to 68% by the year 2032. The present thermal capacity consists of petroleum fuel based plants and coal plant. New thermal capacity to be added to the system by 2032 is in the form of diesel plants, gas turbines and coal plants. The percentage variation of hydro-thermal share of capacity over next 20 years is shown in Figure 7.2. The capacity wise renewable share is given in Figure 7.3. The capacity balance of the system with NCRE/ non-dispatchableduring the planning horizon is given in Annex 7.2.
Table 7.3– Capacity Additions by Plant Type
Type of Plant
2013 - 2017
2018 - 2022
2023- 2027
2028- 2032
Total capacity addition
(MW) (MW) (MW) (MW) (MW) % Major Hydro 155 27
49 231 3.88%
NCRE 269 187 138 120 714 12.00%
Coal 600 1900 1200 900 4600 77.32% Gas
Turbines 285 75 360 6.05%
Medium Diesel 44 44 0.74%
Total 1,353 2,114 1,338 1,144 5,949 100.00%
Figure 7.1 –Cumulative Capacity by Plant Type in Base Case
*NCRE non-dispachable capacity is not included
0
1000
2000
3000
4000
5000
6000
7000
8000
2013
2014
2015
2016
2017
2018
2019
2020
2021
2022
2023
2024
2025
2026
2027
2028
2029
2030
2031
2032
Capa
city
(MW
)
Year
GT DNRDSL CCYCoal HydroPeak
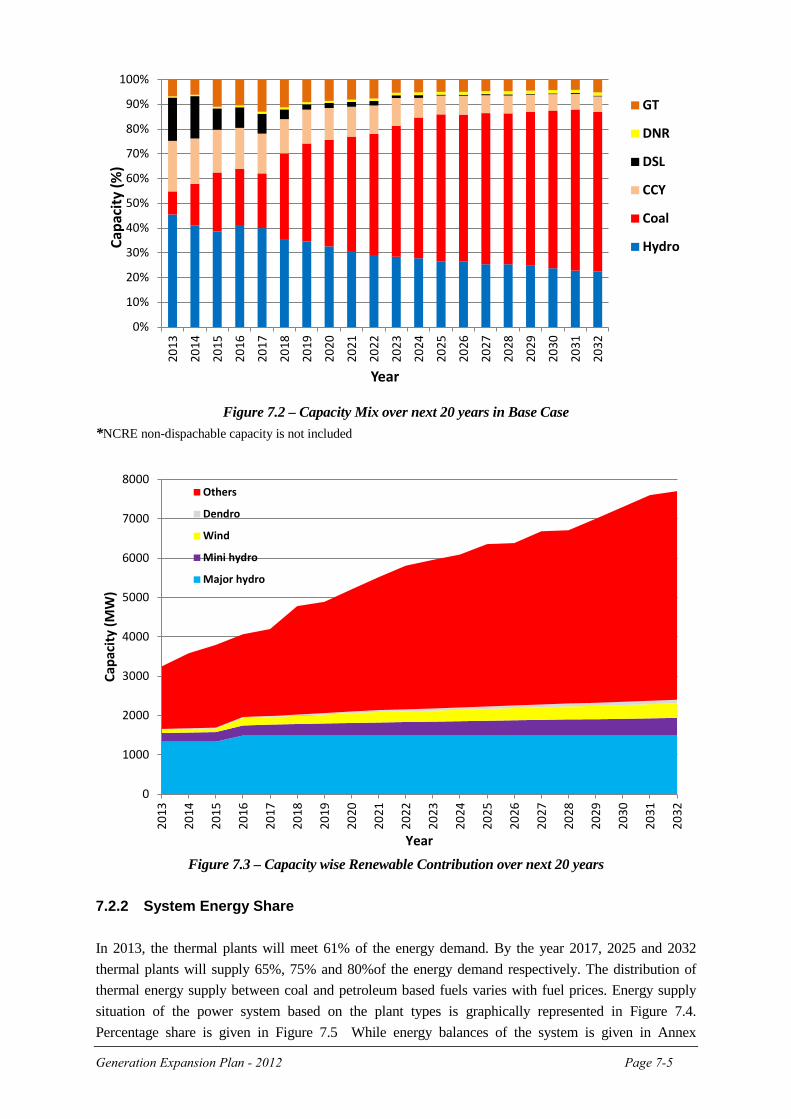
Generation Expansion Plan - 2012 Page 7-5
0%
10%
20%
30%
40%
50%
60%
70%
80%
90%
100%
2013
2014
2015
2016
2017
2018
2019
2020
2021
2022
2023
2024
2025
2026
2027
2028
2029
2030
2031
2032
Capa
city
(%)
Year
GT
DNR
DSL
CCY
Coal
Hydro
Figure 7.2 – Capacity Mix over next 20 years in Base Case
*NCRE non-dispachable capacity is not included
Figure 7.3 – Capacity wise Renewable Contribution over next 20 years
7.2.2 System Energy Share In 2013, the thermal plants will meet 61% of the energy demand. By the year 2017, 2025 and 2032 thermal plants will supply 65%, 75% and 80%of the energy demand respectively. The distribution of thermal energy supply between coal and petroleum based fuels varies with fuel prices. Energy supply situation of the power system based on the plant types is graphically represented in Figure 7.4. Percentage share is given in Figure 7.5 While energy balances of the system is given in Annex
0
1000
2000
3000
4000
5000
6000
7000
8000
2013
2014
2015
2016
2017
2018
2019
2020
2021
2022
2023
2024
2025
2026
2027
2028
2029
2030
2031
2032
Capa
city
(MW
)
Year
Others
Dendro
Wind
Mini hydro
Major hydro
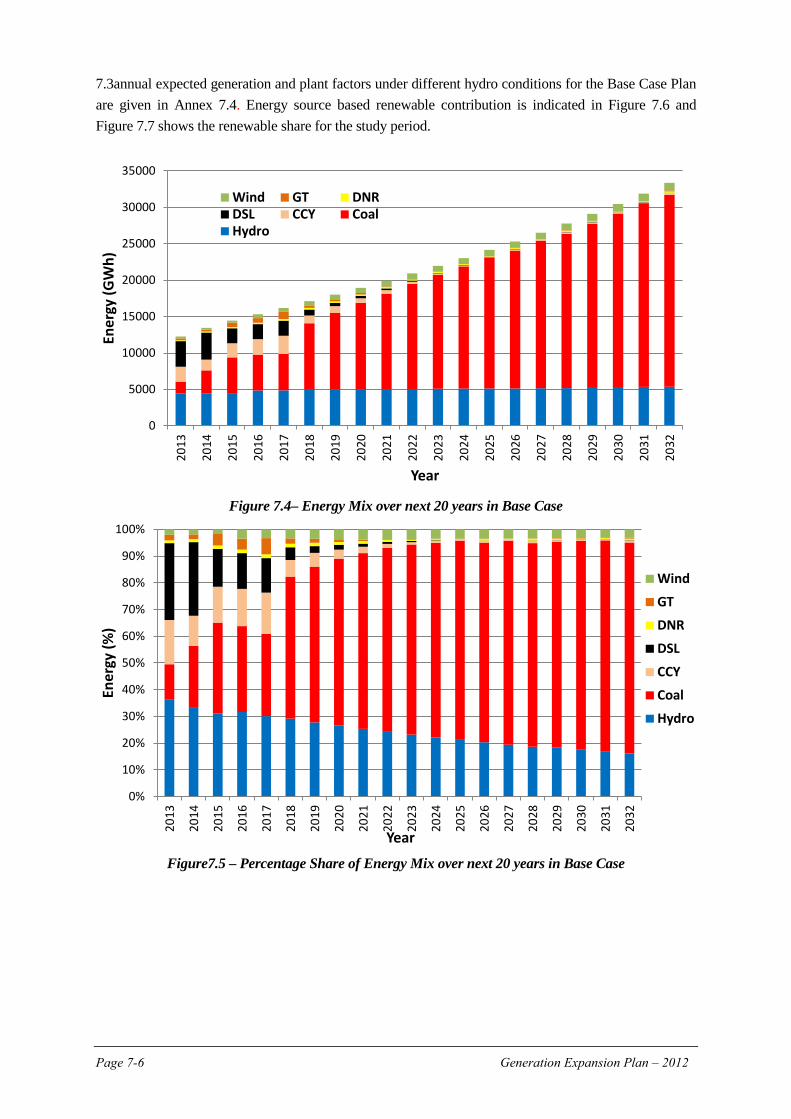
Page 7-6 Generation Expansion Plan – 2012
0%
10%
20%
30%
40%
50%
60%
70%
80%
90%
100%
2013
2014
2015
2016
2017
2018
2019
2020
2021
2022
2023
2024
2025
2026
2027
2028
2029
2030
2031
2032
Ener
gy (%
)
Year
Wind
GT
DNR
DSL
CCY
Coal
Hydro
7.3annual expected generation and plant factors under different hydro conditions for the Base Case Plan are given in Annex 7.4. Energy source based renewable contribution is indicated in Figure 7.6 and Figure 7.7 shows the renewable share for the study period.
Figure 7.4– Energy Mix over next 20 years in Base Case
Figure7.5 – Percentage Share of Energy Mix over next 20 years in Base Case
0
5000
10000
15000
20000
25000
30000
3500020
13
2014
2015
2016
2017
2018
2019
2020
2021
2022
2023
2024
2025
2026
2027
2028
2029
2030
2031
2032
Ener
gy (G
Wh)
Year
Wind GT DNRDSL CCY CoalHydro
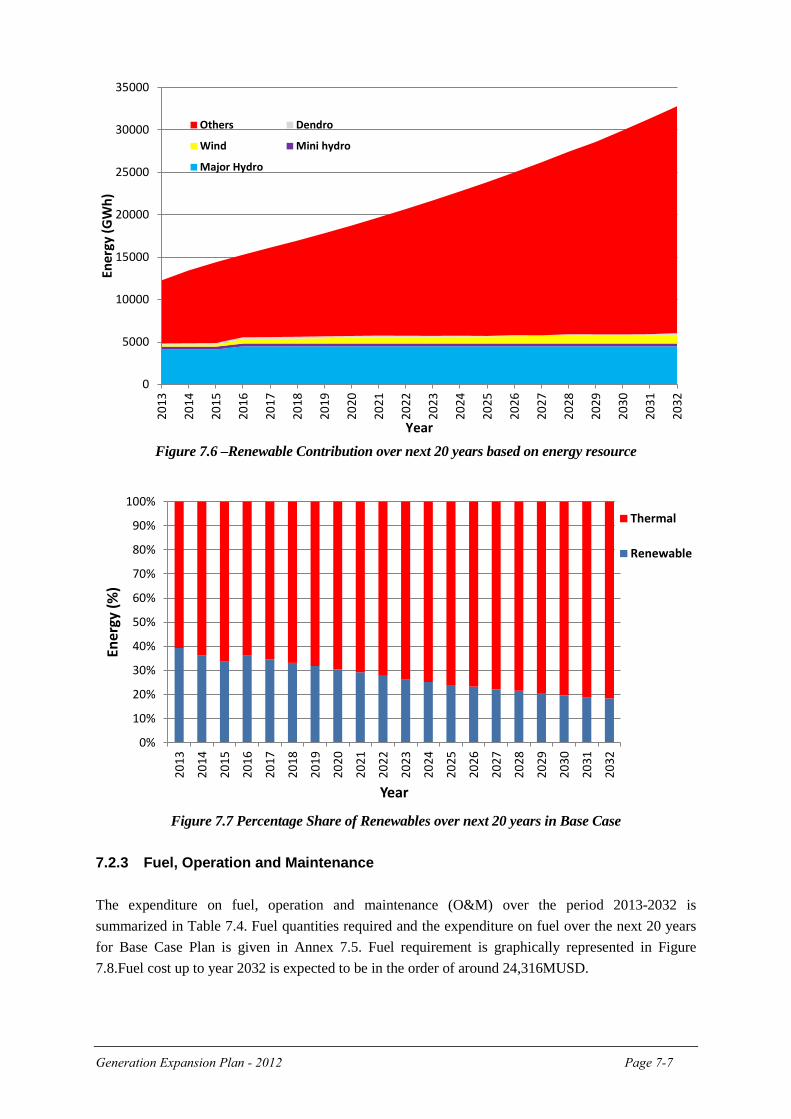
Generation Expansion Plan - 2012 Page 7-7
Figure 7.6 –Renewable Contribution over next 20 years based on energy resource
Figure 7.7 Percentage Share of Renewables over next 20 years in Base Case
7.2.3 Fuel, Operation and Maintenance The expenditure on fuel, operation and maintenance (O&M) over the period 2013-2032 is summarized in Table 7.4. Fuel quantities required and the expenditure on fuel over the next 20 years for Base Case Plan is given in Annex 7.5. Fuel requirement is graphically represented in Figure 7.8.Fuel cost up to year 2032 is expected to be in the order of around 24,316MUSD.
0
5000
10000
15000
20000
25000
30000
35000
2013
2014
2015
2016
2017
2018
2019
2020
2021
2022
2023
2024
2025
2026
2027
2028
2029
2030
2031
2032
Ener
gy (G
Wh)
Year
Others Dendro
Wind Mini hydro
Major Hydro
0%
10%
20%
30%
40%
50%
60%
70%
80%
90%
100%
2013
2014
2015
2016
2017
2018
2019
2020
2021
2022
2023
2024
2025
2026
2027
2028
2029
2030
2031
2032
Ener
gy (%
)
Year
Thermal
Renewable
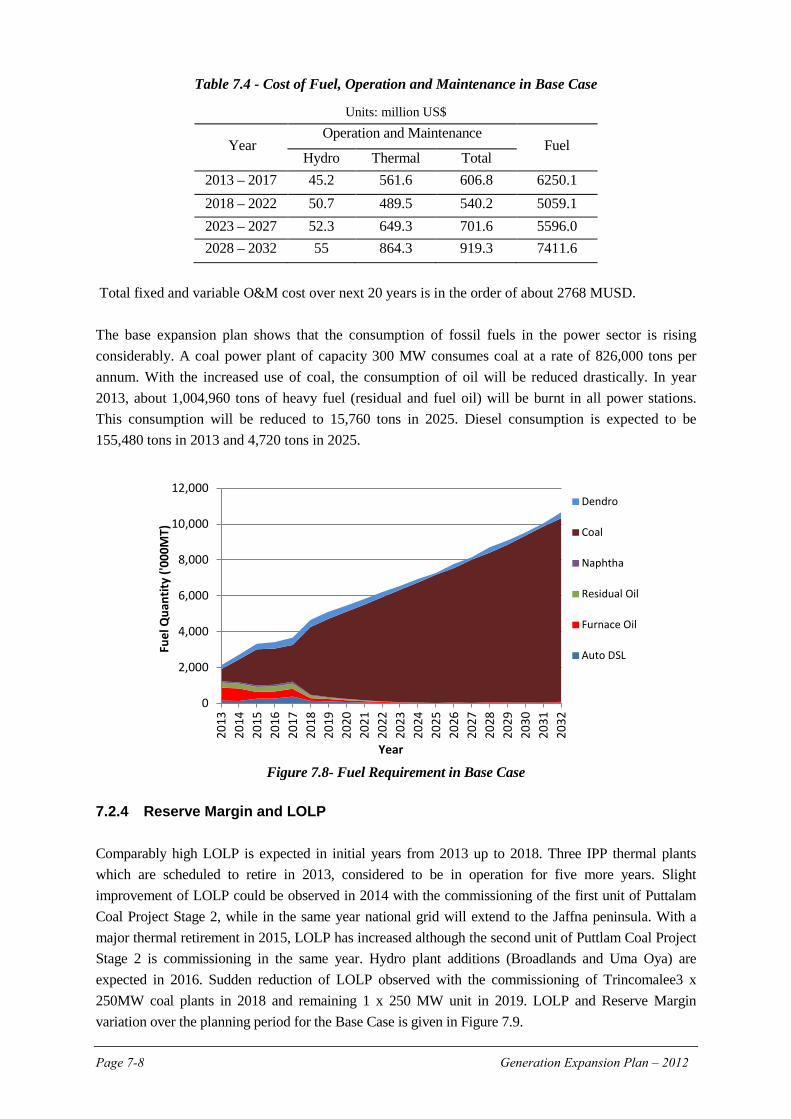
Page 7-8 Generation Expansion Plan – 2012
Table 7.4 - Cost of Fuel, Operation and Maintenance in Base Case
Units: million US$
Year Operation and Maintenance
Fuel Hydro Thermal Total
2013 – 2017 45.2 561.6 606.8 6250.1 2018 – 2022 50.7 489.5 540.2 5059.1 2023 – 2027 52.3 649.3 701.6 5596.0 2028 – 2032 55 864.3 919.3 7411.6
Total fixed and variable O&M cost over next 20 years is in the order of about 2768 MUSD. The base expansion plan shows that the consumption of fossil fuels in the power sector is rising considerably. A coal power plant of capacity 300 MW consumes coal at a rate of 826,000 tons per annum. With the increased use of coal, the consumption of oil will be reduced drastically. In year 2013, about 1,004,960 tons of heavy fuel (residual and fuel oil) will be burnt in all power stations. This consumption will be reduced to 15,760 tons in 2025. Diesel consumption is expected to be 155,480 tons in 2013 and 4,720 tons in 2025.
Figure 7.8- Fuel Requirement in Base Case
7.2.4 Reserve Margin and LOLP Comparably high LOLP is expected in initial years from 2013 up to 2018. Three IPP thermal plants which are scheduled to retire in 2013, considered to be in operation for five more years. Slight improvement of LOLP could be observed in 2014 with the commissioning of the first unit of Puttalam Coal Project Stage 2, while in the same year national grid will extend to the Jaffna peninsula. With a major thermal retirement in 2015, LOLP has increased although the second unit of Puttlam Coal Project Stage 2 is commissioning in the same year. Hydro plant additions (Broadlands and Uma Oya) are expected in 2016. Sudden reduction of LOLP observed with the commissioning of Trincomalee3 x 250MW coal plants in 2018 and remaining 1 x 250 MW unit in 2019. LOLP and Reserve Margin variation over the planning period for the Base Case is given in Figure 7.9.
0
2,000
4,000
6,000
8,000
10,000
12,000
2013
2014
2015
2016
2017
2018
2019
2020
2021
2022
2023
2024
2025
2026
2027
2028
2029
2030
2031
2032
Fuel
Qua
ntity
('00
0MT)
Year
Dendro
Coal
Naphtha
Residual Oil
Furnace Oil
Auto DSL
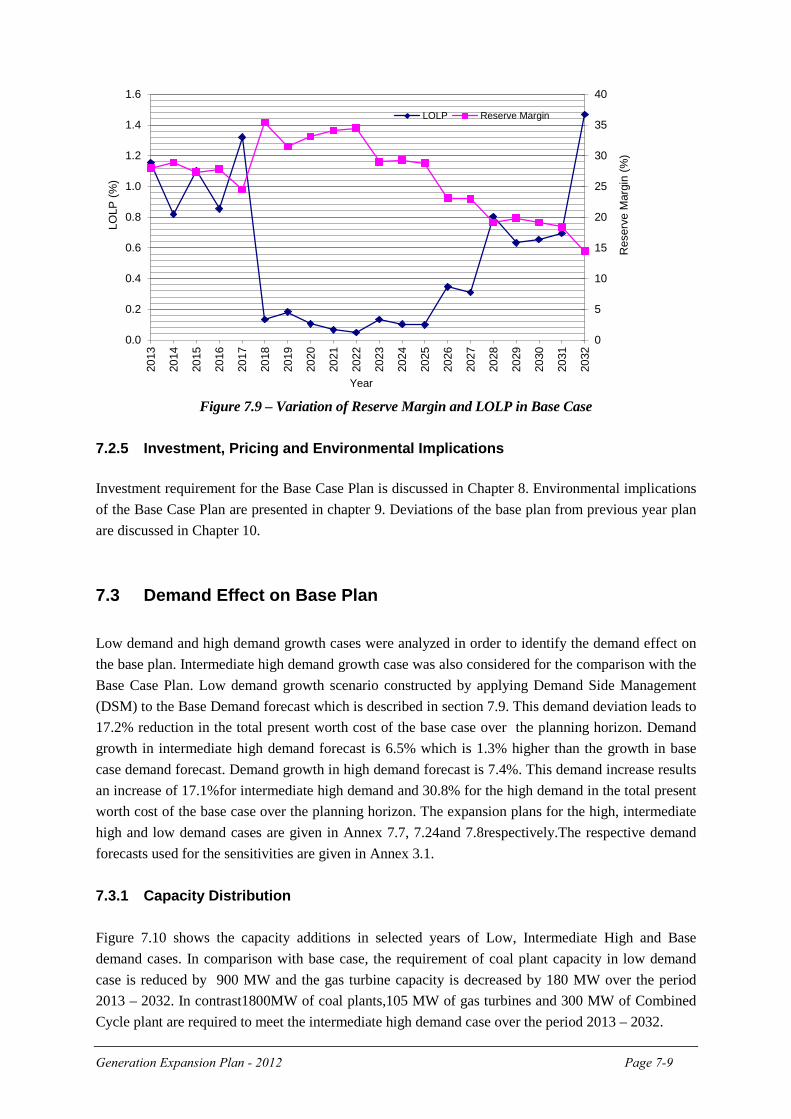
Generation Expansion Plan - 2012 Page 7-9
Figure 7.9 – Variation of Reserve Margin and LOLP in Base Case
7.2.5 Investment, Pricing and Environmental Implications Investment requirement for the Base Case Plan is discussed in Chapter 8. Environmental implications of the Base Case Plan are presented in chapter 9. Deviations of the base plan from previous year plan are discussed in Chapter 10. 7.3 Demand Effect on Base Plan Low demand and high demand growth cases were analyzed in order to identify the demand effect on the base plan. Intermediate high demand growth case was also considered for the comparison with the Base Case Plan. Low demand growth scenario constructed by applying Demand Side Management (DSM) to the Base Demand forecast which is described in section 7.9. This demand deviation leads to 17.2% reduction in the total present worth cost of the base case over the planning horizon. Demand growth in intermediate high demand forecast is 6.5% which is 1.3% higher than the growth in base case demand forecast. Demand growth in high demand forecast is 7.4%. This demand increase results an increase of 17.1%for intermediate high demand and 30.8% for the high demand in the total present worth cost of the base case over the planning horizon. The expansion plans for the high, intermediate high and low demand cases are given in Annex 7.7, 7.24and 7.8respectively.The respective demand forecasts used for the sensitivities are given in Annex 3.1. 7.3.1 Capacity Distribution Figure 7.10 shows the capacity additions in selected years of Low, Intermediate High and Base demand cases. In comparison with base case, the requirement of coal plant capacity in low demand case is reduced by 900 MW and the gas turbine capacity is decreased by 180 MW over the period 2013 – 2032. In contrast1800MW of coal plants,105 MW of gas turbines and 300 MW of Combined Cycle plant are required to meet the intermediate high demand case over the period 2013 – 2032.
0
5
10
15
20
25
30
35
40
0.0
0.2
0.4
0.6
0.8
1.0
1.2
1.4
1.6
2013
2014
2015
2016
2017
2018
2019
2020
2021
2022
2023
2024
2025
2026
2027
2028
2029
2030
2031
2032
Res
erve
Mar
gin
(%)
LOLP
(%)
Year
LOLP Reserve Margin
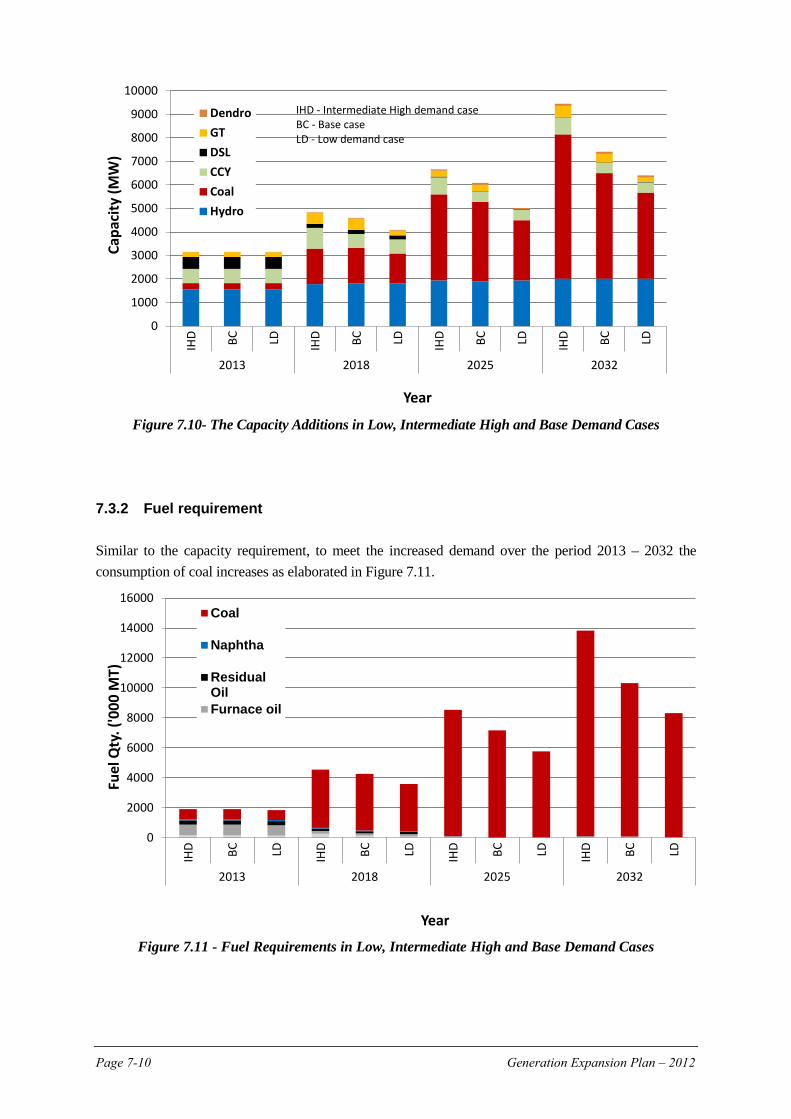
Page 7-10 Generation Expansion Plan – 2012
Figure 7.10- The Capacity Additions in Low, Intermediate High and Base Demand Cases
7.3.2 Fuel requirement Similar to the capacity requirement, to meet the increased demand over the period 2013 – 2032 the consumption of coal increases as elaborated in Figure 7.11.
Figure 7.11 - Fuel Requirements in Low, Intermediate High and Base Demand Cases
0
1000
2000
3000
4000
5000
6000
7000
8000
9000
10000
IHD BC LD IHD BC LD IHD BC LD IHD BC LD
2013 2018 2025 2032
Capa
city
(MW
)
Year
DendroGTDSLCCYCoalHydro
0
2000
4000
6000
8000
10000
12000
14000
16000
IHD BC LD IHD BC LD IHD BC LD IHD BC LD
2013 2018 2025 2032
Fuel
Qty
. ('0
00 M
T)
Year
Coal
Naphtha
ResidualOilFurnace oil
IHD - Intermediate High demand case BC - Base case LD - Low demand case
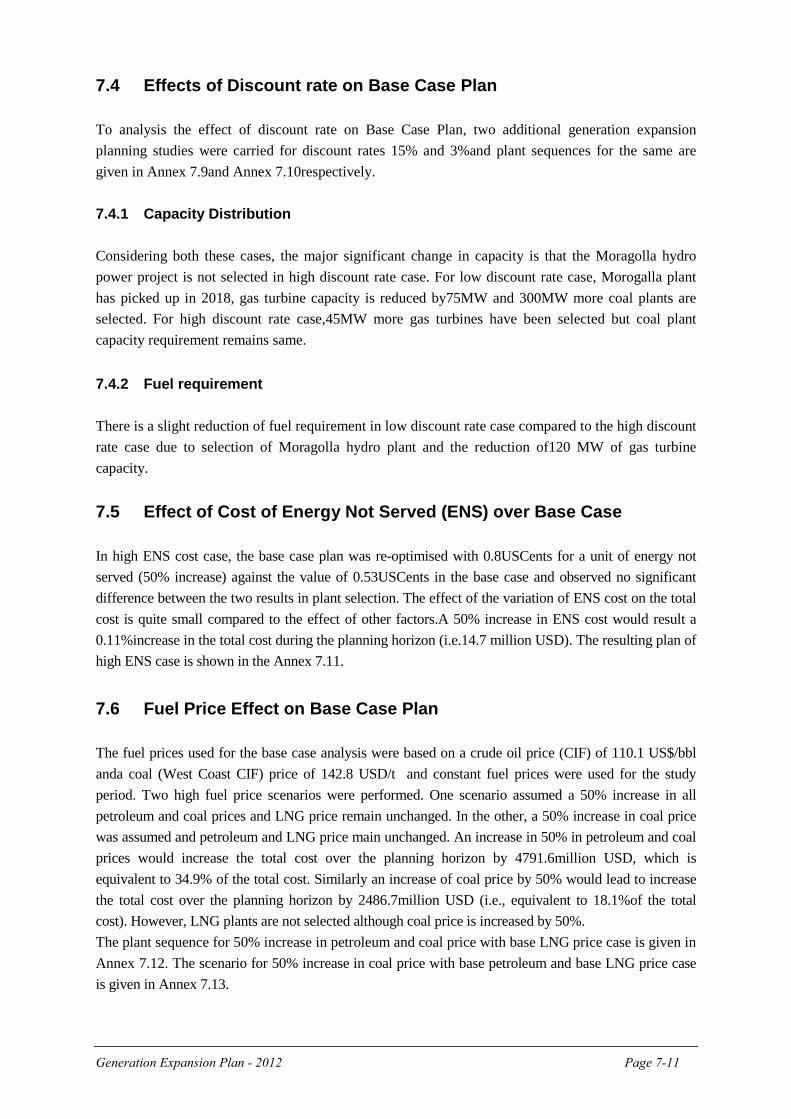
Generation Expansion Plan - 2012 Page 7-11
7.4 Effects of Discount rate on Base Case Plan To analysis the effect of discount rate on Base Case Plan, two additional generation expansion planning studies were carried for discount rates 15% and 3%and plant sequences for the same are given in Annex 7.9and Annex 7.10respectively. 7.4.1 Capacity Distribution Considering both these cases, the major significant change in capacity is that the Moragolla hydro power project is not selected in high discount rate case. For low discount rate case, Morogalla plant has picked up in 2018, gas turbine capacity is reduced by75MW and 300MW more coal plants are selected. For high discount rate case,45MW more gas turbines have been selected but coal plant capacity requirement remains same. 7.4.2 Fuel requirement There is a slight reduction of fuel requirement in low discount rate case compared to the high discount rate case due to selection of Moragolla hydro plant and the reduction of120 MW of gas turbine capacity. 7.5 Effect of Cost of Energy Not Served (ENS) over Base Case In high ENS cost case, the base case plan was re-optimised with 0.8USCents for a unit of energy not served (50% increase) against the value of 0.53USCents in the base case and observed no significant difference between the two results in plant selection. The effect of the variation of ENS cost on the total cost is quite small compared to the effect of other factors.A 50% increase in ENS cost would result a 0.11%increase in the total cost during the planning horizon (i.e.14.7 million USD). The resulting plan of high ENS case is shown in the Annex 7.11. 7.6 Fuel Price Effect on Base Case Plan The fuel prices used for the base case analysis were based on a crude oil price (CIF) of 110.1 US$/bbl anda coal (West Coast CIF) price of 142.8 USD/t and constant fuel prices were used for the study period. Two high fuel price scenarios were performed. One scenario assumed a 50% increase in all petroleum and coal prices and LNG price remain unchanged. In the other, a 50% increase in coal price was assumed and petroleum and LNG price main unchanged. An increase in 50% in petroleum and coal prices would increase the total cost over the planning horizon by 4791.6million USD, which is equivalent to 34.9% of the total cost. Similarly an increase of coal price by 50% would lead to increase the total cost over the planning horizon by 2486.7million USD (i.e., equivalent to 18.1%of the total cost). However, LNG plants are not selected although coal price is increased by 50%. The plant sequence for 50% increase in petroleum and coal price with base LNG price case is given in Annex 7.12. The scenario for 50% increase in coal price with base petroleum and base LNG price case is given in Annex 7.13.
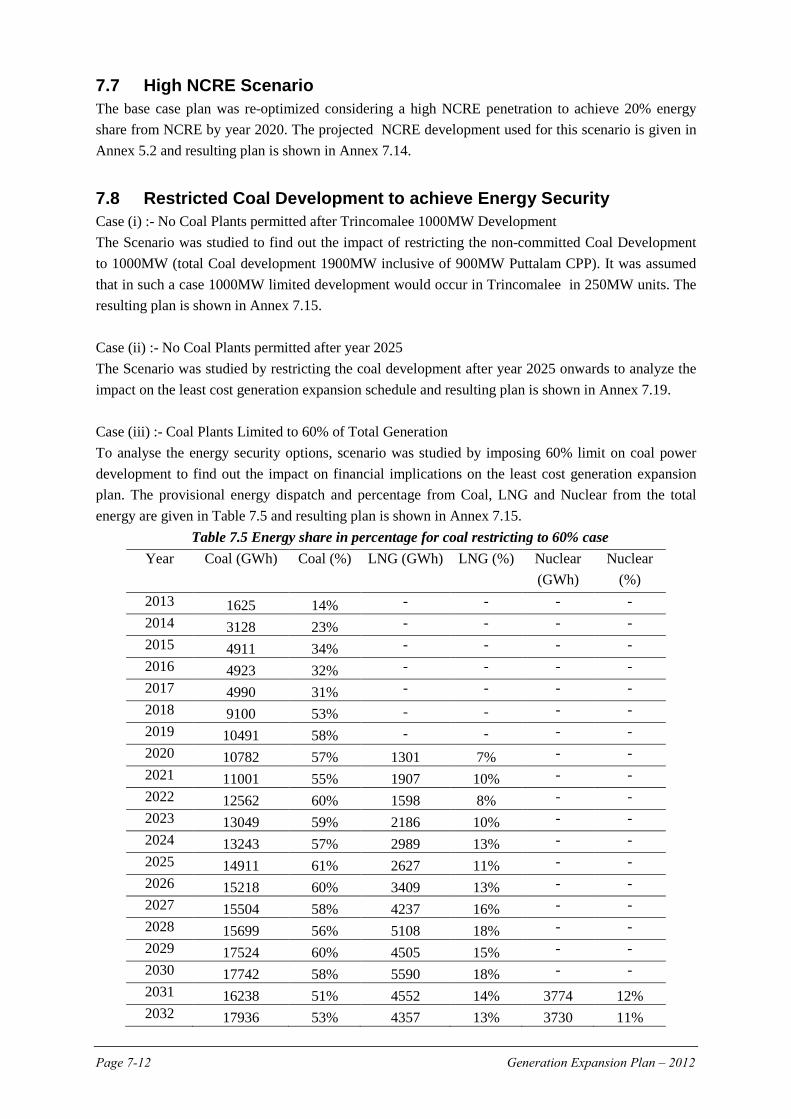
Page 7-12 Generation Expansion Plan – 2012
7.7 High NCRE Scenario The base case plan was re-optimized considering a high NCRE penetration to achieve 20% energy share from NCRE by year 2020. The projected NCRE development used for this scenario is given in Annex 5.2 and resulting plan is shown in Annex 7.14. 7.8 Restricted Coal Development to achieve Energy Security Case (i) :- No Coal Plants permitted after Trincomalee 1000MW Development The Scenario was studied to find out the impact of restricting the non-committed Coal Development to 1000MW (total Coal development 1900MW inclusive of 900MW Puttalam CPP). It was assumed that in such a case 1000MW limited development would occur in Trincomalee in 250MW units. The resulting plan is shown in Annex 7.15. Case (ii) :- No Coal Plants permitted after year 2025 The Scenario was studied by restricting the coal development after year 2025 onwards to analyze the impact on the least cost generation expansion schedule and resulting plan is shown in Annex 7.19. Case (iii) :- Coal Plants Limited to 60% of Total Generation To analyse the energy security options, scenario was studied by imposing 60% limit on coal power development to find out the impact on financial implications on the least cost generation expansion plan. The provisional energy dispatch and percentage from Coal, LNG and Nuclear from the total energy are given in Table 7.5 and resulting plan is shown in Annex 7.15.
Table 7.5 Energy share in percentage for coal restricting to 60% case Year Coal (GWh) Coal (%) LNG (GWh) LNG (%) Nuclear
(GWh) Nuclear
(%) 2013 1625 14% - - - - 2014 3128 23% - - - - 2015 4911 34% - - - - 2016 4923 32% - - - - 2017 4990 31% - - - - 2018 9100 53% - - - - 2019 10491 58% - - - - 2020 10782 57% 1301 7% - - 2021 11001 55% 1907 10% - - 2022 12562 60% 1598 8% - - 2023 13049 59% 2186 10% - - 2024 13243 57% 2989 13% - - 2025 14911 61% 2627 11% - - 2026 15218 60% 3409 13% - - 2027 15504 58% 4237 16% - - 2028 15699 56% 5108 18% - - 2029 17524 60% 4505 15% - - 2030 17742 58% 5590 18% - - 2031 16238 51% 4552 14% 3774 12% 2032 17936 53% 4357 13% 3730 11%
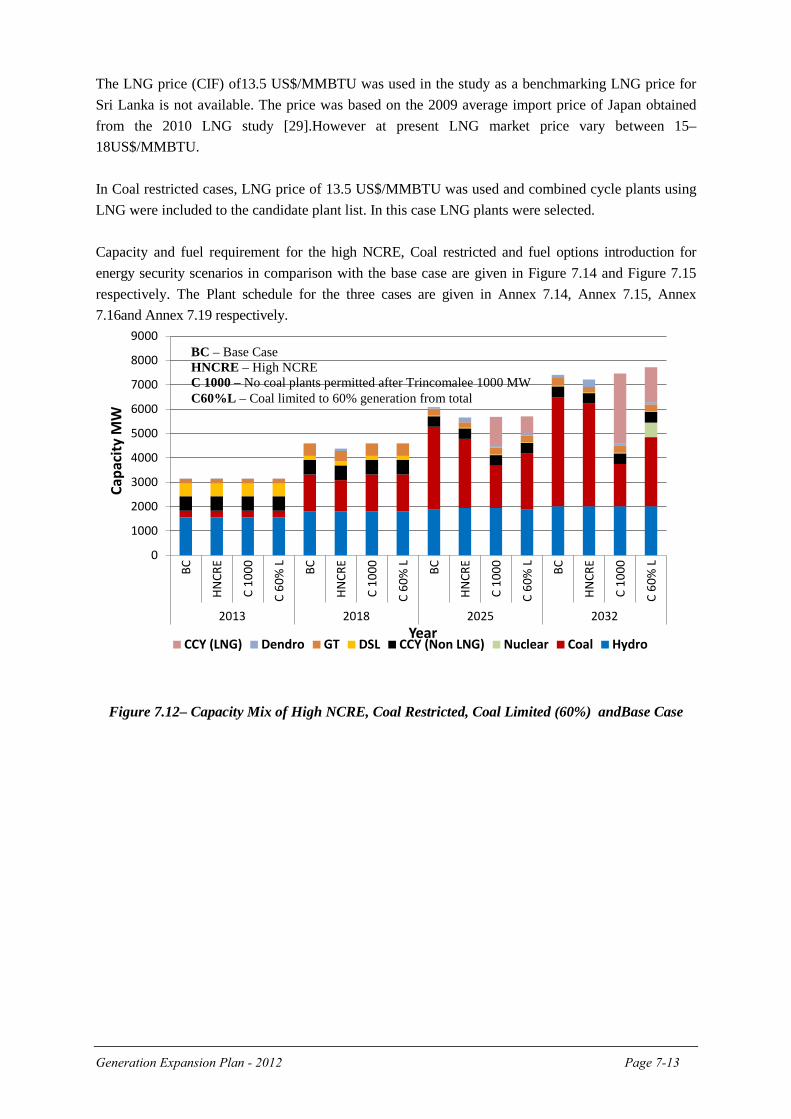
Generation Expansion Plan - 2012 Page 7-13
The LNG price (CIF) of13.5 US$/MMBTU was used in the study as a benchmarking LNG price for Sri Lanka is not available. The price was based on the 2009 average import price of Japan obtained from the 2010 LNG study [29].However at present LNG market price vary between 15–18US$/MMBTU. In Coal restricted cases, LNG price of 13.5 US$/MMBTU was used and combined cycle plants using LNG were included to the candidate plant list. In this case LNG plants were selected. Capacity and fuel requirement for the high NCRE, Coal restricted and fuel options introduction for energy security scenarios in comparison with the base case are given in Figure 7.14 and Figure 7.15 respectively. The Plant schedule for the three cases are given in Annex 7.14, Annex 7.15, Annex 7.16and Annex 7.19 respectively.
Figure 7.12– Capacity Mix of High NCRE, Coal Restricted, Coal Limited (60%) andBase Case
0
1000
2000
3000
4000
5000
6000
7000
8000
9000
BC
HNCR
E
C 10
00
C 60
% L BC
HNCR
E
C 10
00
C 60
% L BC
HNCR
E
C 10
00
C 60
% L BC
HNCR
E
C 10
00
C 60
% L
2013 2018 2025 2032
Capa
city
MW
Year CCY (LNG) Dendro GT DSL CCY (Non LNG) Nuclear Coal Hydro
BC – Base Case HNCRE – High NCRE C 1000 – No coal plants permitted after Trincomalee 1000 MW C60%L – Coal limited to 60% generation from total
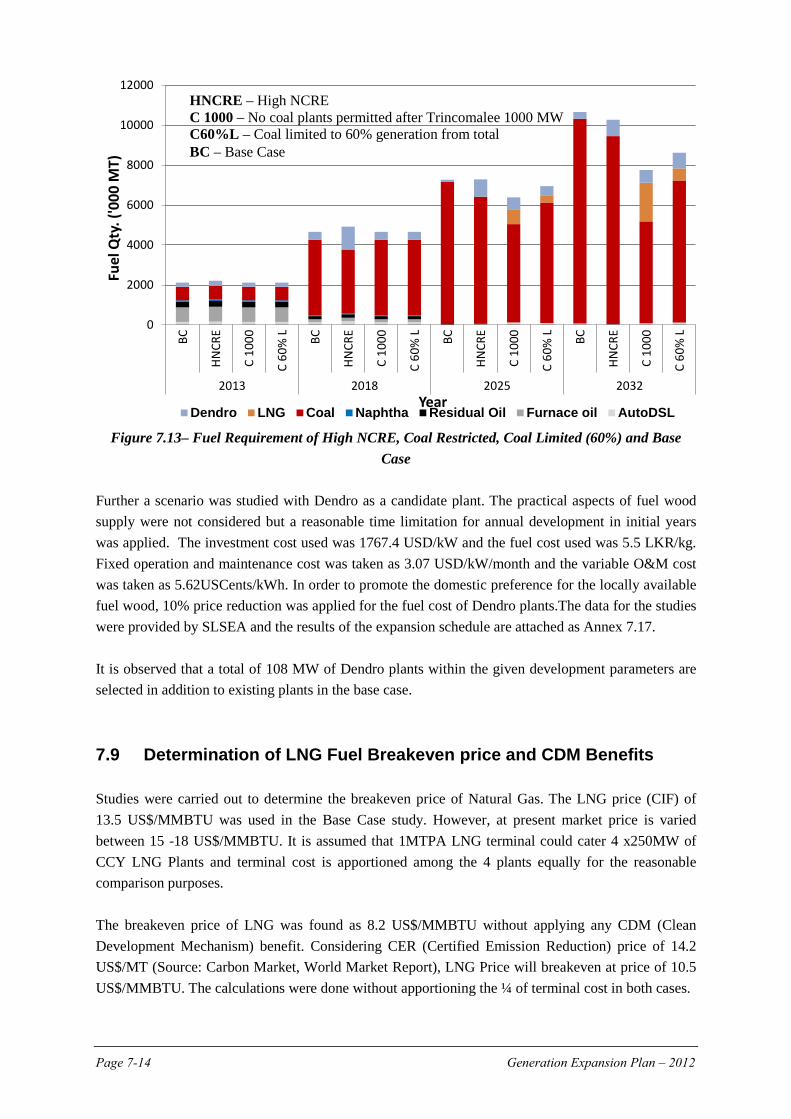
Page 7-14 Generation Expansion Plan – 2012
Figure 7.13– Fuel Requirement of High NCRE, Coal Restricted, Coal Limited (60%) and Base
Case Further a scenario was studied with Dendro as a candidate plant. The practical aspects of fuel wood supply were not considered but a reasonable time limitation for annual development in initial years was applied. The investment cost used was 1767.4 USD/kW and the fuel cost used was 5.5 LKR/kg. Fixed operation and maintenance cost was taken as 3.07 USD/kW/month and the variable O&M cost was taken as 5.62USCents/kWh. In order to promote the domestic preference for the locally available fuel wood, 10% price reduction was applied for the fuel cost of Dendro plants.The data for the studies were provided by SLSEA and the results of the expansion schedule are attached as Annex 7.17. It is observed that a total of 108 MW of Dendro plants within the given development parameters are selected in addition to existing plants in the base case. 7.9 Determination of LNG Fuel Breakeven price and CDM Benefits Studies were carried out to determine the breakeven price of Natural Gas. The LNG price (CIF) of 13.5 US$/MMBTU was used in the Base Case study. However, at present market price is varied between 15 -18 US$/MMBTU. It is assumed that 1MTPA LNG terminal could cater 4 x250MW of CCY LNG Plants and terminal cost is apportioned among the 4 plants equally for the reasonable comparison purposes. The breakeven price of LNG was found as 8.2 US$/MMBTU without applying any CDM (Clean Development Mechanism) benefit. Considering CER (Certified Emission Reduction) price of 14.2 US$/MT (Source: Carbon Market, World Market Report), LNG Price will breakeven at price of 10.5 US$/MMBTU. The calculations were done without apportioning the ¼ of terminal cost in both cases.
0
2000
4000
6000
8000
10000
12000
BC
HNCR
E
C 10
00
C 60
% L BC
HNCR
E
C 10
00
C 60
% L BC
HNCR
E
C 10
00
C 60
% L BC
HNCR
E
C 10
00
C 60
% L
2013 2018 2025 2032
Fuel
Qty
. ('0
00 M
T)
Year Dendro LNG Coal Naphtha Residual Oil Furnace oil AutoDSL
HNCRE – High NCRE C 1000 – No coal plants permitted after Trincomalee 1000 MW C60%L – Coal limited to 60% generation from total BC – Base Case
Generation Expansion Plan - 2012 Page 7-15
Same breakeven prices were calculated with apportioning the ¼ of terminal cost and found that 8.0 US$/MMBTU without CDM benefit and 10.3 US$/MMBTU with CDM benefit for CER price of 14.2 US$/MT. The same CER price of 14.2 US$/MT applied for the LNG plants, Dendro, wind and mini hydro plants in the Base case with CDM scenario and found that LNG plants are not selected in the Base case. The result of the expansion schedule is attached in Annex: 7.23. 7.10 Effect on Demand Side Management on Base Case The DSM values given by SLSEA as energy saving targets were used in the studies without cost implication of implementation of such DSM action. The main objective of the SLSEA was to achieve energy saving target of 20% of year 2010 energy demand by year 2020. The same concept was applied throughout the planning horizon and the result of the expansion schedule is attached in Annex: 7.8. This DSM applied case to Base Case is considered as the low demand case which is discussed in section 7.3. However, due consideration must be given to save energy through DSM activities in long term in order to obtain the maximum economic benefit to the Country. 7.11Social and Environmental Damage Cost Scenario A scenario was studied to investigate the effect of coal power plants in the Base Case by giving a monetary value to the social and environmental damage. The damage cost 0.1 €-cent/kWh was taken from the report “Environmental Issues in the Power Sector: Sri Lanka”. The resulting expansion schedule is attached in Annex 7.20.No plants selection is observed in this scenario. 7.12 Pump Storage Plant and HVDC Interconnection Scenarios The base case plan was re-optimized considering a pump storage forced construction and operation in year 2020 to analyze the impact of introducing Pump storage plant in to the system. The expansion schedule is attached in Annex7.18. The base case plan was re-optimized considering a 500MW HVDC Interconnection between Sri Lanka and India and the expansion schedule is attached in Annex 7.22. The HVDC interconnection was opened for selection from 2020.Cost data for this study was taken from the report “India-Sri Lanka Grid Interconnection Study”.
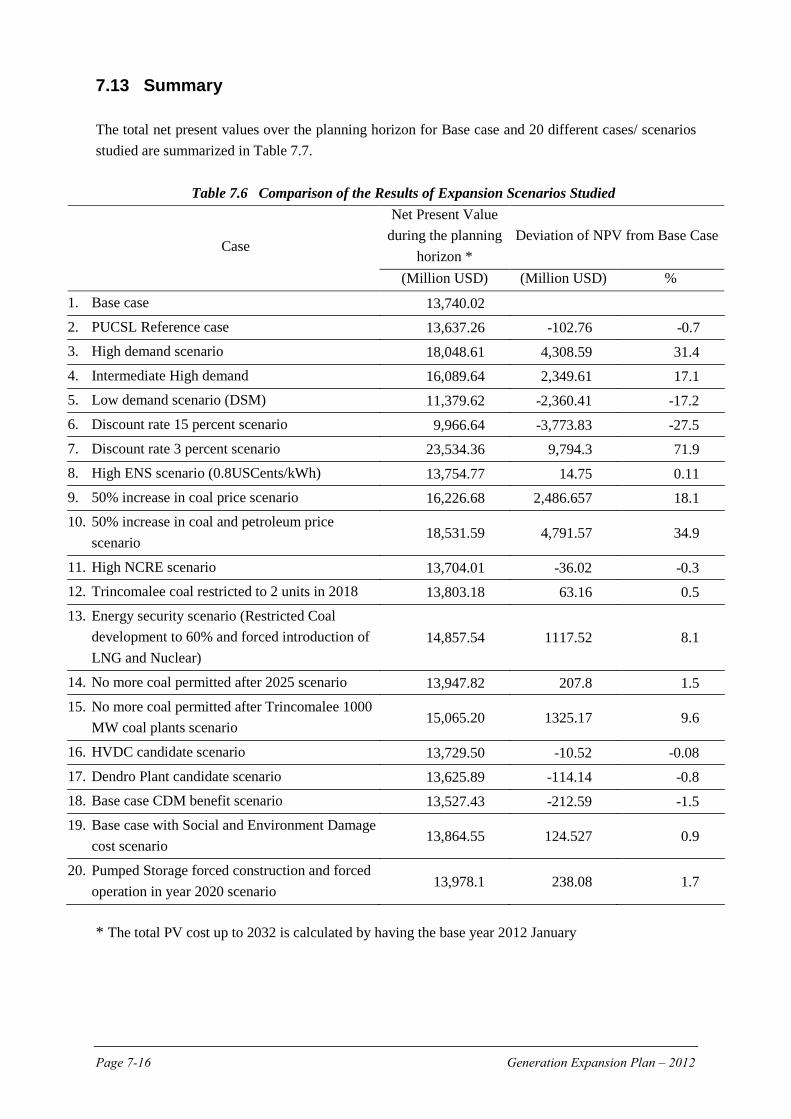
Page 7-16 Generation Expansion Plan – 2012
7.13 Summary The total net present values over the planning horizon for Base case and 20 different cases/ scenarios studied are summarized in Table 7.7.
Table 7.6 Comparison of the Results of Expansion Scenarios Studied
Case
Net Present Value during the planning
horizon * Deviation of NPV from Base Case
(Million USD) (Million USD) %
1. Base case 13,740.02
2. PUCSL Reference case 13,637.26 -102.76 -0.7 3. High demand scenario 18,048.61 4,308.59 31.4 4. Intermediate High demand 16,089.64 2,349.61 17.1 5. Low demand scenario (DSM) 11,379.62 -2,360.41 -17.2 6. Discount rate 15 percent scenario 9,966.64 -3,773.83 -27.5 7. Discount rate 3 percent scenario 23,534.36 9,794.3 71.9 8. High ENS scenario (0.8USCents/kWh) 13,754.77 14.75 0.11 9. 50% increase in coal price scenario 16,226.68 2,486.657 18.1 10. 50% increase in coal and petroleum price
scenario 18,531.59 4,791.57 34.9
11. High NCRE scenario 13,704.01 -36.02 -0.3 12. Trincomalee coal restricted to 2 units in 2018 13,803.18 63.16 0.5 13. Energy security scenario (Restricted Coal
development to 60% and forced introduction of LNG and Nuclear)
14,857.54 1117.52 8.1
14. No more coal permitted after 2025 scenario 13,947.82 207.8 1.5 15. No more coal permitted after Trincomalee 1000
MW coal plants scenario 15,065.20 1325.17 9.6
16. HVDC candidate scenario 13,729.50 -10.52 -0.08 17. Dendro Plant candidate scenario 13,625.89 -114.14 -0.8 18. Base case CDM benefit scenario 13,527.43 -212.59 -1.5 19. Base case with Social and Environment Damage
cost scenario 13,864.55 124.527 0.9
20. Pumped Storage forced construction and forced operation in year 2020 scenario
13,978.1 238.08 1.7
* The total PV cost up to 2032 is calculated by having the base year 2012 January
Generation Expansion Plan - 2012 Page 8-1
CHAPTER 8
IMPLEMENTATION AND FINANCING OF GENERATION PROJECTS
This Chapter elaborates on the required investment and the implementation plan for the generation projects in the base case and the issues related to that.
8.1 Committed Power Plants in the Base Case 8.1.1 Committed Plants Puttalam Coal Fired Steam Plant stage – II (2x 300 MW), Broadlands Hydro Power Project (35 MW), Uma Oya Hydro Power Project (120 MW), CEB Chunnakam Power Extension (24 MW) and Northern Power (20 MW) (after the system integration of northern part of the island by 2014) have been considered as firmly committed in the present study. 8.1.2 Present Status of the Committed Power Plants A brief description of the current status (as of end 2012) of the committed projects and proposed projects on which commitments should be made are given below.
1. Feasibility of the Broadlands hydro power project was investigated under the “Study of Hydro power Optimization in Sri Lanka” in February 2004 by the JICA consultants ,J-Power and the Nippon Koei Co. Ltd., Japan [5]. Under this study several alternative schemes are studied by Central Engineering Consultancy Bureau (CECB) in 1989 and 1991 [6 and 7] were reviewed. Tenders have been called for construction of the project under Design & Build basis. The contractual agreement has been signed between CEB and the selected contractor.
2. Puttlam Coal Power plant: The government signed the agreement to construct the Puttlam Coal Power plant in Norochcholai in March 2006. Stage 1 of the project with the capacity 300 MW was commissioned in mid 2011. Construction of the stage 2 with the capacity 2x 300 MW is under way and the two units are expected to be commissioned in October 2013 and July 2014.
3. A Pre-feasibility study on Uma Oya Multi-purpose Project (a trans-basin option) was completed by the CECB in July 1991 [8] where the diversion of Uma Oya, a tributary of Mahaweli Ganga was studied. In 2001, SNC Lavalin Inc. of Canada was engaged to conduct the feasibility study on Uma Oya with the assistance of Canadian International Development Agency (CIDA). Financial agreement has been signed with the Government of Iran to commence the construction along with feasibility study. The contract affects from April 2010 and the plant is scheduled to be commissioned by end of 2015. Civil technical specifications have been already finalized and 90% Electrical technical specifications have been finalized with respect to the project progress in addition to the completion of access tunnels.
Page 8-2 Generation Expansion Plan - 2012
4. After the expected re-linking of national grid to the northern part of the island especially Jaffna peninsula an isolated generation system prevailed during the past at Chunnakam, will be added to the total generation option pool of Sri Lanka by 2014.
5. National Thermal Power Corporation (NTPC) of India and CEB had entered into a MOA on 29th December 2006 for the development of 2 x250MW Coal based thermal power project in Trincomalee forming a Joint Venture agreement. The detail technical negotiations are going on between NTPC and CEB to finalize the project development.
6. CEB has submitted a request to External Recourses Department of Sri Lanka to seek financial resources to construct next 2 x 250MW Coal power development identified in the least cost generation expansion plan in Trincomalee.
8.2 Proposed Power Plants in the Base Case The proposed plants up to 2025 according to the base case are given below.
• (1x75) MW Gas Turbine in 2015 • (1x10⁵) MW Gas Turbine in 2015 • (1x10⁵) MW Gas Turbine in 2017 • (3x250) MW Trinco Coal in 2018 • (1x27) MW Moragolla HPP in 2018 • (1x250) MW Trinco Coal in 2019
• (1x300) MW Coal Plant in 2020 • (1x300) MW Coal Plant in 2021 • (1x300) MW Coal Plant in 2022 • (1x300) MW Coal Plant in 2023 • (1x300) MW Coal Plant in 2024 • (1x300) MW Coal Plant in 2025
In the present study, 2019 was considered as the earliest possible year of commissioning of the first candidate coal plant except Trincomalee 4 x 250MW coal power development. 8.3 Implementation Schedule The implementation schedule for both committed and proposed power plants in the base case is shown in Figure 8.1.
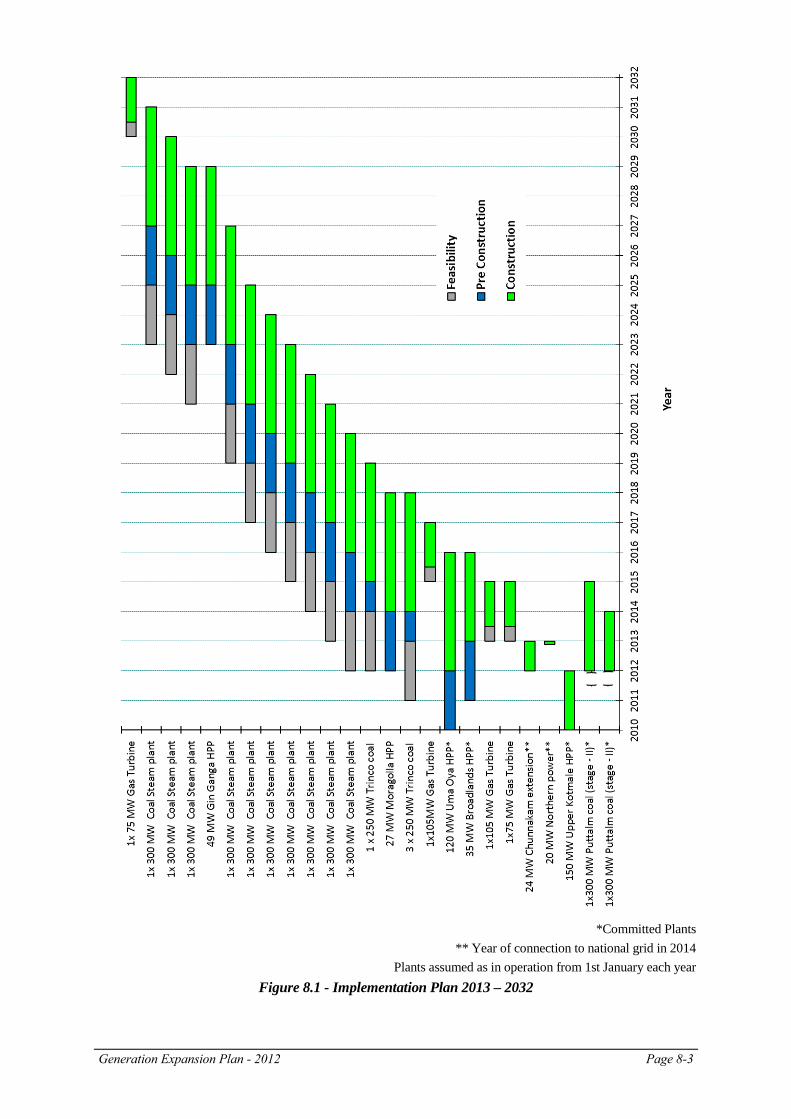
Generation Expansion Plan - 2012 Page 8-3
*Committed Plants
** Year of connection to national grid in 2014 Plants assumed as in operation from 1st January each year
Figure 8.1 - Implementation Plan 2013 – 2032
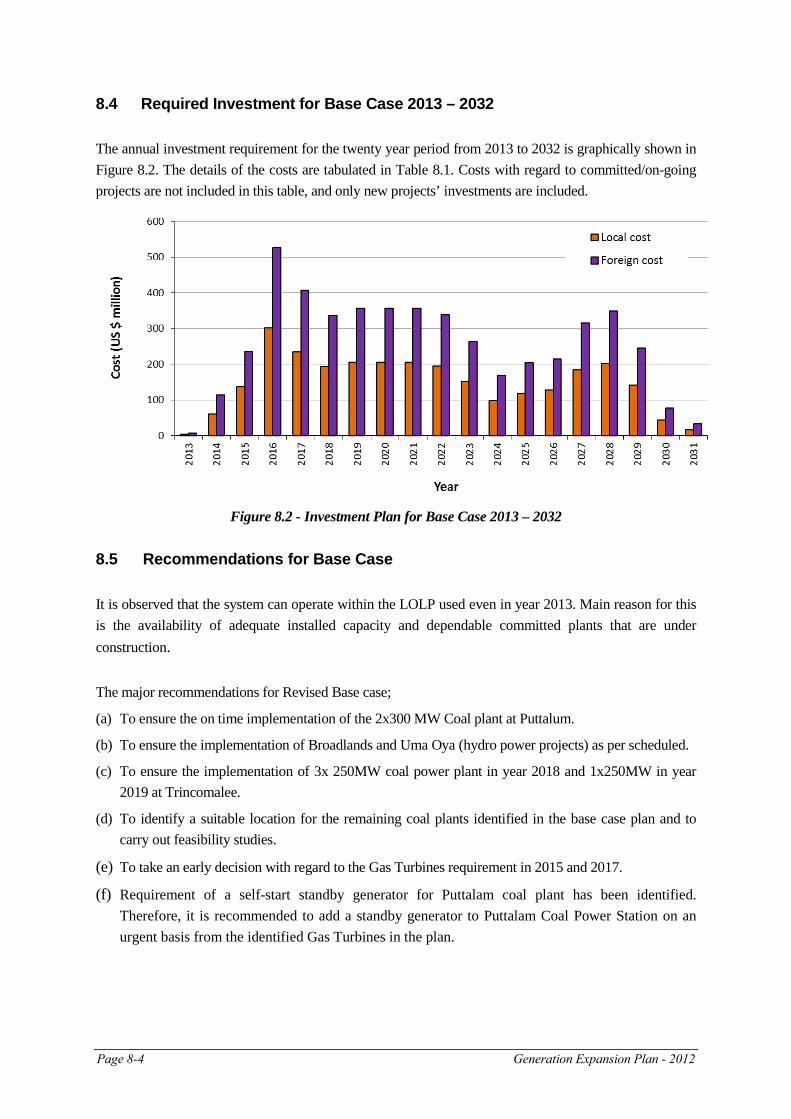
Page 8-4 Generation Expansion Plan - 2012
8.4 Required Investment for Base Case 2013 – 2032
The annual investment requirement for the twenty year period from 2013 to 2032 is graphically shown in Figure 8.2. The details of the costs are tabulated in Table 8.1. Costs with regard to committed/on-going projects are not included in this table, and only new projects’ investments are included.
Figure 8.2 - Investment Plan for Base Case 2013 – 2032 8.5 Recommendations for Base Case It is observed that the system can operate within the LOLP used even in year 2013. Main reason for this is the availability of adequate installed capacity and dependable committed plants that are under construction. The major recommendations for Revised Base case;
(a) To ensure the on time implementation of the 2x300 MW Coal plant at Puttalum.
(b) To ensure the implementation of Broadlands and Uma Oya (hydro power projects) as per scheduled.
(c) To ensure the implementation of 3x 250MW coal power plant in year 2018 and 1x250MW in year 2019 at Trincomalee.
(d) To identify a suitable location for the remaining coal plants identified in the base case plan and to carry out feasibility studies.
(e) To take an early decision with regard to the Gas Turbines requirement in 2015 and 2017.
(f) Requirement of a self-start standby generator for Puttalam coal plant has been identified. Therefore, it is recommended to add a standby generator to Puttalam Coal Power Station on an urgent basis from the identified Gas Turbines in the plan.
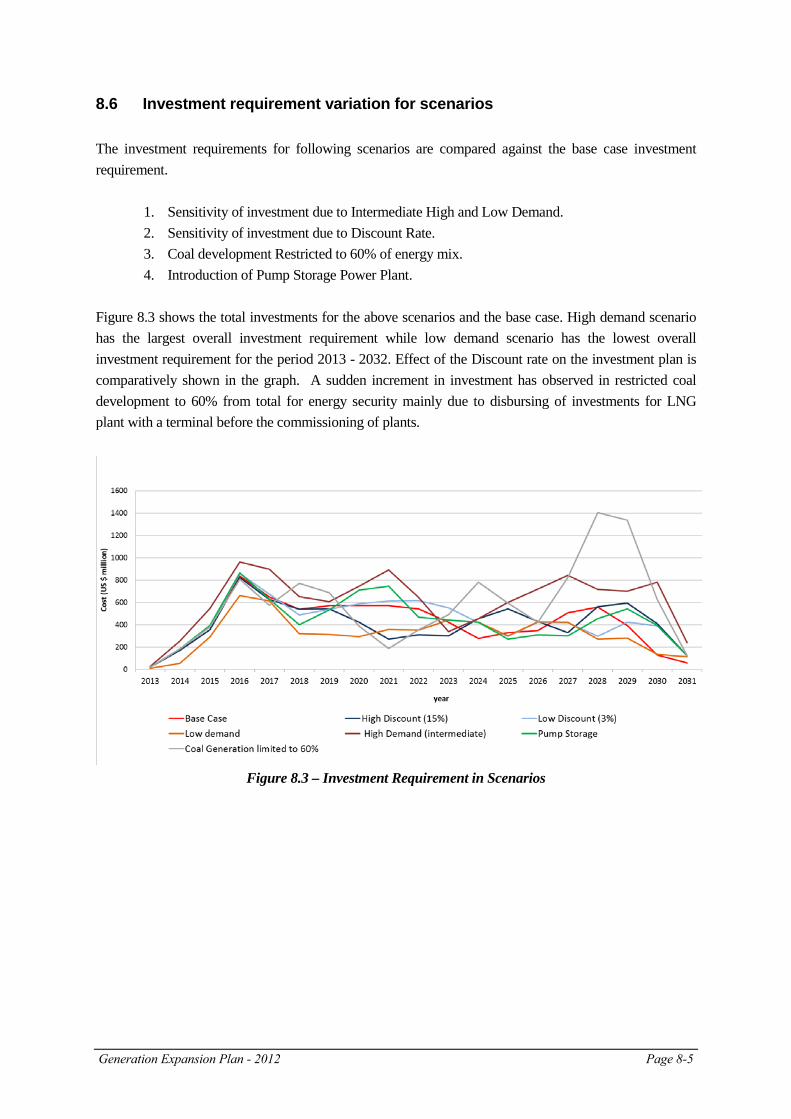
Generation Expansion Plan - 2012 Page 8-5
8.6 Investment requirement variation for scenarios The investment requirements for following scenarios are compared against the base case investment requirement.
1. Sensitivity of investment due to Intermediate High and Low Demand. 2. Sensitivity of investment due to Discount Rate. 3. Coal development Restricted to 60% of energy mix. 4. Introduction of Pump Storage Power Plant.
Figure 8.3 shows the total investments for the above scenarios and the base case. High demand scenario has the largest overall investment requirement while low demand scenario has the lowest overall investment requirement for the period 2013 - 2032. Effect of the Discount rate on the investment plan is comparatively shown in the graph. A sudden increment in investment has observed in restricted coal development to 60% from total for energy security mainly due to disbursing of investments for LNG plant with a terminal before the commissioning of plants.
Figure 8.3 – Investment Requirement in Scenarios
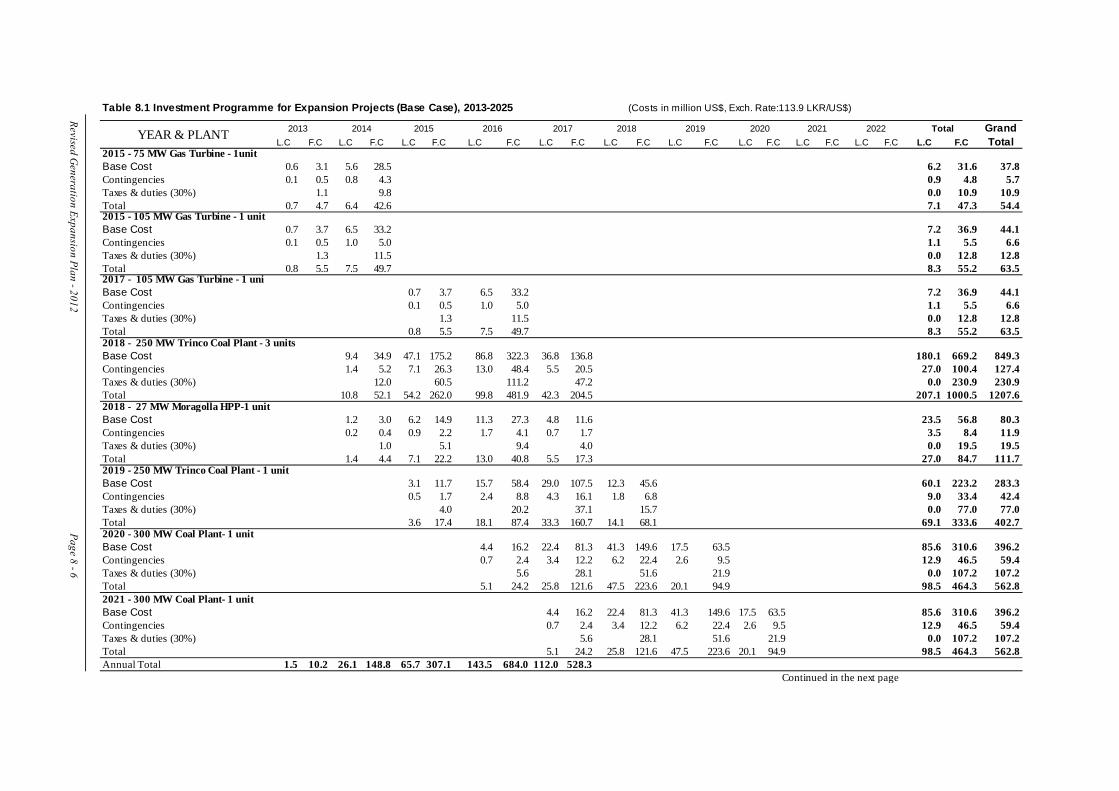
Table 8.1 Investment Programme for Expansion Projects (Base Case), 2013-2025 (Costs in million US$, Exch. Rate:113.9 LKR/US$)
L.C F.C L.C F.C L.C F.C L.C F.C L.C F.C L.C F.C L.C F.C L.C F.C L.C F.C L.C F.C L.C F.C2015 - 75 MW Gas Turbine - 1unitBase Cost 0.6 3.1 5.6 28.5 6.2 31.6 37.8Contingencies 0.1 0.5 0.8 4.3 0.9 4.8 5.7Taxes & duties (30%) 1.1 9.8 0.0 10.9 10.9Total 0.7 4.7 6.4 42.6 7.1 47.3 54.42015 - 105 MW Gas Turbine - 1 unitBase Cost 0.7 3.7 6.5 33.2 7.2 36.9 44.1Contingencies 0.1 0.5 1.0 5.0 1.1 5.5 6.6Taxes & duties (30%) 1.3 11.5 0.0 12.8 12.8Total 0.8 5.5 7.5 49.7 8.3 55.2 63.52017 - 105 MW Gas Turbine - 1 uniBase Cost 0.7 3.7 6.5 33.2 7.2 36.9 44.1Contingencies 0.1 0.5 1.0 5.0 1.1 5.5 6.6Taxes & duties (30%) 1.3 11.5 0.0 12.8 12.8Total 0.8 5.5 7.5 49.7 8.3 55.2 63.52018 - 250 MW Trinco Coal Plant - 3 unitsBase Cost 9.4 34.9 47.1 175.2 86.8 322.3 36.8 136.8 180.1 669.2 849.3Contingencies 1.4 5.2 7.1 26.3 13.0 48.4 5.5 20.5 27.0 100.4 127.4Taxes & duties (30%) 12.0 60.5 111.2 47.2 0.0 230.9 230.9Total 10.8 52.1 54.2 262.0 99.8 481.9 42.3 204.5 207.1 1000.5 1207.62018 - 27 MW Moragolla HPP-1 unitBase Cost 1.2 3.0 6.2 14.9 11.3 27.3 4.8 11.6 23.5 56.8 80.3Contingencies 0.2 0.4 0.9 2.2 1.7 4.1 0.7 1.7 3.5 8.4 11.9Taxes & duties (30%) 1.0 5.1 9.4 4.0 0.0 19.5 19.5Total 1.4 4.4 7.1 22.2 13.0 40.8 5.5 17.3 27.0 84.7 111.72019 - 250 MW Trinco Coal Plant - 1 unitBase Cost 3.1 11.7 15.7 58.4 29.0 107.5 12.3 45.6 60.1 223.2 283.3Contingencies 0.5 1.7 2.4 8.8 4.3 16.1 1.8 6.8 9.0 33.4 42.4Taxes & duties (30%) 4.0 20.2 37.1 15.7 0.0 77.0 77.0Total 3.6 17.4 18.1 87.4 33.3 160.7 14.1 68.1 69.1 333.6 402.72020 - 300 MW Coal Plant- 1 unitBase Cost 4.4 16.2 22.4 81.3 41.3 149.6 17.5 63.5 85.6 310.6 396.2Contingencies 0.7 2.4 3.4 12.2 6.2 22.4 2.6 9.5 12.9 46.5 59.4Taxes & duties (30%) 5.6 28.1 51.6 21.9 0.0 107.2 107.2Total 5.1 24.2 25.8 121.6 47.5 223.6 20.1 94.9 98.5 464.3 562.82021 - 300 MW Coal Plant- 1 unitBase Cost 4.4 16.2 22.4 81.3 41.3 149.6 17.5 63.5 85.6 310.6 396.2Contingencies 0.7 2.4 3.4 12.2 6.2 22.4 2.6 9.5 12.9 46.5 59.4Taxes & duties (30%) 5.6 28.1 51.6 21.9 0.0 107.2 107.2Total 5.1 24.2 25.8 121.6 47.5 223.6 20.1 94.9 98.5 464.3 562.8Annual Total 1.5 10.2 26.1 148.8 65.7 307.1 143.5 684.0 112.0 528.3
2021 2022 Grand Total
Revised Generation Expansion Plan - 2012 Page 8 - 6
YEAR & PLANT 2013 2014 2015 2016 2017 2018 2019 2020 Total
Continued in the next page
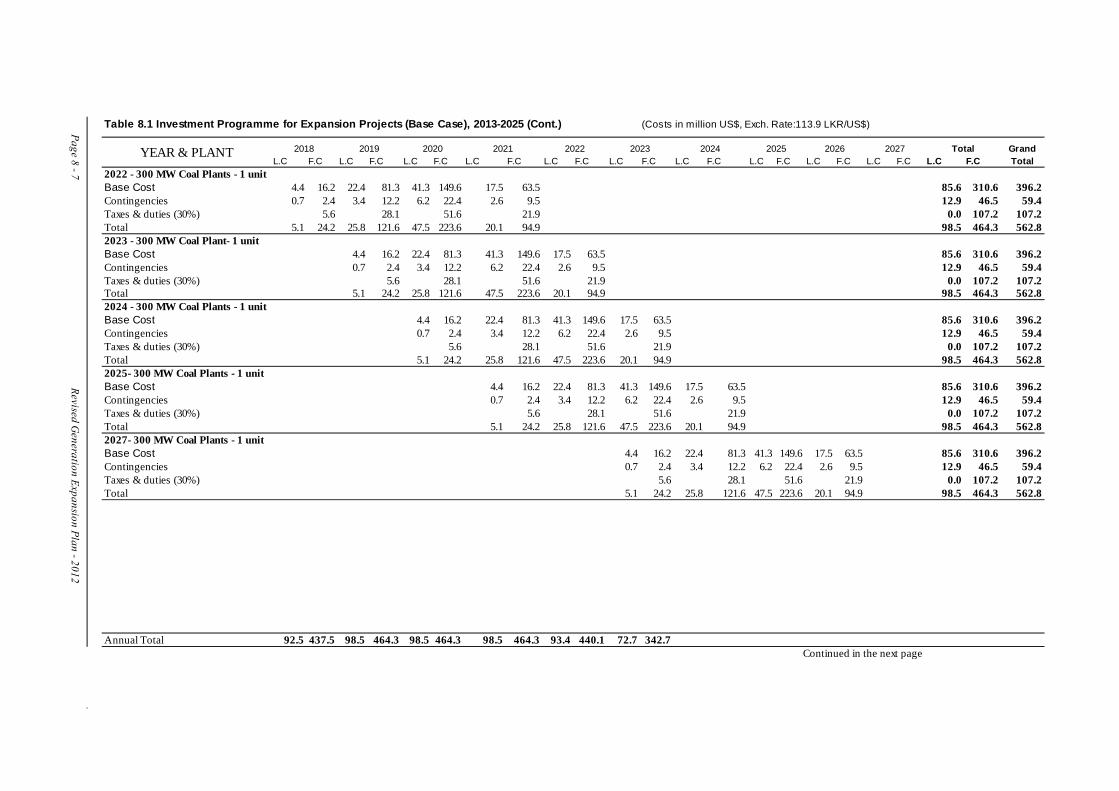
Table 8.1 Investment Programme for Expansion Projects (Base Case), 2013-2025 (Cont.) (Costs in million US$, Exch. Rate:113.9 LKR/US$)
L.C F.C L.C F.C L.C F.C L.C F.C L.C F.C L.C F.C L.C F.C L.C F.C L.C F.C L.C F.C L.C F.C2022 - 300 MW Coal Plants - 1 unitBase Cost 4.4 16.2 22.4 81.3 41.3 149.6 17.5 63.5 85.6 310.6 396.2Contingencies 0.7 2.4 3.4 12.2 6.2 22.4 2.6 9.5 12.9 46.5 59.4Taxes & duties (30%) 5.6 28.1 51.6 21.9 0.0 107.2 107.2Total 5.1 24.2 25.8 121.6 47.5 223.6 20.1 94.9 98.5 464.3 562.82023 - 300 MW Coal Plant- 1 unitBase Cost 4.4 16.2 22.4 81.3 41.3 149.6 17.5 63.5 85.6 310.6 396.2Contingencies 0.7 2.4 3.4 12.2 6.2 22.4 2.6 9.5 12.9 46.5 59.4Taxes & duties (30%) 5.6 28.1 51.6 21.9 0.0 107.2 107.2Total 5.1 24.2 25.8 121.6 47.5 223.6 20.1 94.9 98.5 464.3 562.82024 - 300 MW Coal Plants - 1 unit Base Cost 4.4 16.2 22.4 81.3 41.3 149.6 17.5 63.5 85.6 310.6 396.2Contingencies 0.7 2.4 3.4 12.2 6.2 22.4 2.6 9.5 12.9 46.5 59.4Taxes & duties (30%) 5.6 28.1 51.6 21.9 0.0 107.2 107.2Total 5.1 24.2 25.8 121.6 47.5 223.6 20.1 94.9 98.5 464.3 562.82025- 300 MW Coal Plants - 1 unit Base Cost 4.4 16.2 22.4 81.3 41.3 149.6 17.5 63.5 85.6 310.6 396.2Contingencies 0.7 2.4 3.4 12.2 6.2 22.4 2.6 9.5 12.9 46.5 59.4Taxes & duties (30%) 5.6 28.1 51.6 21.9 0.0 107.2 107.2Total 5.1 24.2 25.8 121.6 47.5 223.6 20.1 94.9 98.5 464.3 562.82027- 300 MW Coal Plants - 1 unit Base Cost 4.4 16.2 22.4 81.3 41.3 149.6 17.5 63.5 85.6 310.6 396.2Contingencies 0.7 2.4 3.4 12.2 6.2 22.4 2.6 9.5 12.9 46.5 59.4Taxes & duties (30%) 5.6 28.1 51.6 21.9 0.0 107.2 107.2Total 5.1 24.2 25.8 121.6 47.5 223.6 20.1 94.9 98.5 464.3 562.8
Annual Total 92.5 437.5 98.5 464.3 98.5 464.3 98.5 464.3 93.4 440.1 72.7 342.7
Page 8 - 7 Revised Generation Expansion Plan - 2012
2026 2027
Continued in the next page
Total Grand Total
YEAR & PLANT 2018 2019 2020 2021 2022 2023 2024 2025
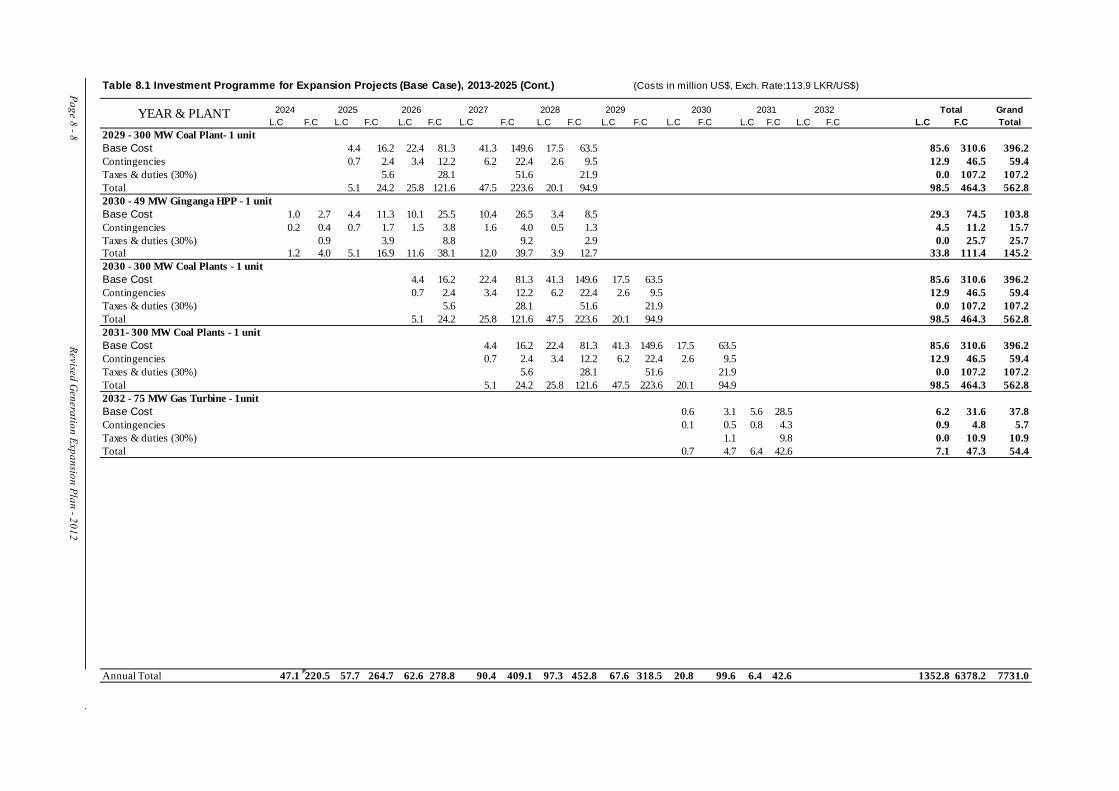
Table 8.1 Investment Programme for Expansion Projects (Base Case), 2013-2025 (Cont.) (Costs in million US$, Exch. Rate:113.9 LKR/US$)
2024 2025 2026 2027 2028 2029L.C F.C L.C F.C L.C F.C L.C F.C L.C F.C L.C F.C L.C F.C L.C F.C L.C F.C L.C F.C
2029 - 300 MW Coal Plant- 1 unitBase Cost 4.4 16.2 22.4 81.3 41.3 149.6 17.5 63.5 85.6 310.6 396.2Contingencies 0.7 2.4 3.4 12.2 6.2 22.4 2.6 9.5 12.9 46.5 59.4Taxes & duties (30%) 5.6 28.1 51.6 21.9 0.0 107.2 107.2Total 5.1 24.2 25.8 121.6 47.5 223.6 20.1 94.9 98.5 464.3 562.82030 - 49 MW Ginganga HPP - 1 unit Base Cost 1.0 2.7 4.4 11.3 10.1 25.5 10.4 26.5 3.4 8.5 29.3 74.5 103.8Contingencies 0.2 0.4 0.7 1.7 1.5 3.8 1.6 4.0 0.5 1.3 4.5 11.2 15.7Taxes & duties (30%) 0.9 3.9 8.8 9.2 2.9 0.0 25.7 25.7Total 1.2 4.0 5.1 16.9 11.6 38.1 12.0 39.7 3.9 12.7 33.8 111.4 145.22030 - 300 MW Coal Plants - 1 unit Base Cost 4.4 16.2 22.4 81.3 41.3 149.6 17.5 63.5 85.6 310.6 396.2Contingencies 0.7 2.4 3.4 12.2 6.2 22.4 2.6 9.5 12.9 46.5 59.4Taxes & duties (30%) 5.6 28.1 51.6 21.9 0.0 107.2 107.2Total 5.1 24.2 25.8 121.6 47.5 223.6 20.1 94.9 98.5 464.3 562.82031- 300 MW Coal Plants - 1 unit Base Cost 4.4 16.2 22.4 81.3 41.3 149.6 17.5 63.5 85.6 310.6 396.2Contingencies 0.7 2.4 3.4 12.2 6.2 22.4 2.6 9.5 12.9 46.5 59.4Taxes & duties (30%) 5.6 28.1 51.6 21.9 0.0 107.2 107.2Total 5.1 24.2 25.8 121.6 47.5 223.6 20.1 94.9 98.5 464.3 562.82032 - 75 MW Gas Turbine - 1unitBase Cost 0.6 3.1 5.6 28.5 6.2 31.6 37.8Contingencies 0.1 0.5 0.8 4.3 0.9 4.8 5.7Taxes & duties (30%) 1.1 9.8 0.0 10.9 10.9Total 0.7 4.7 6.4 42.6 7.1 47.3 54.4
Annual Total 47.1 220.5 57.7 264.7 62.6 278.8 90.4 409.1 97.3 452.8 67.6 318.5 20.8 99.6 6.4 42.6 1352.8 6378.2 7731.0
2032
Page 8 - 8 Revised Generation Expansion Plan - 2012
YEAR & PLANT Total Grand Total
2030 2031
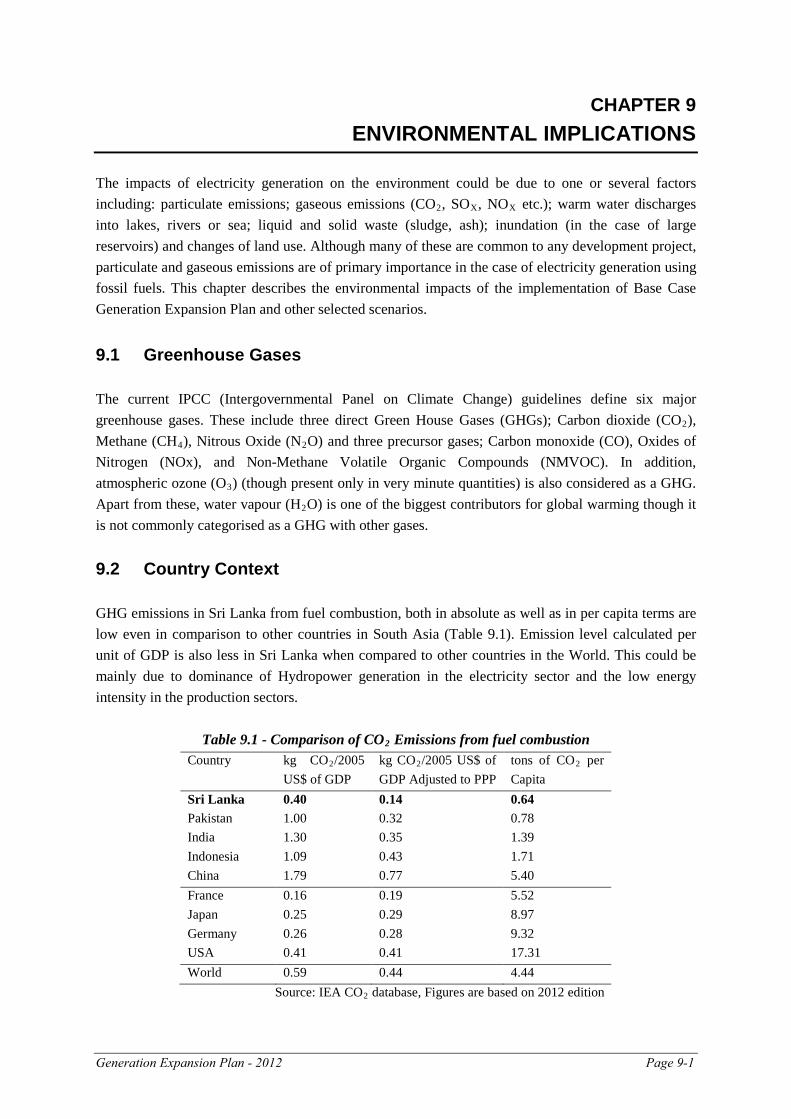
Generation Expansion Plan - 2012 Page 9-1
CHAPTER 9 ENVIRONMENTAL IMPLICATIONS
The impacts of electricity generation on the environment could be due to one or several factors including: particulate emissions; gaseous emissions (CO2, SOX, NOX etc.); warm water discharges into lakes, rivers or sea; liquid and solid waste (sludge, ash); inundation (in the case of large reservoirs) and changes of land use. Although many of these are common to any development project, particulate and gaseous emissions are of primary importance in the case of electricity generation using fossil fuels. This chapter describes the environmental impacts of the implementation of Base Case Generation Expansion Plan and other selected scenarios. 9.1 Greenhouse Gases The current IPCC (Intergovernmental Panel on Climate Change) guidelines define six major greenhouse gases. These include three direct Green House Gases (GHGs); Carbon dioxide (CO2), Methane (CH4), Nitrous Oxide (N2O) and three precursor gases; Carbon monoxide (CO), Oxides of Nitrogen (NOx), and Non-Methane Volatile Organic Compounds (NMVOC). In addition, atmospheric ozone (O3) (though present only in very minute quantities) is also considered as a GHG. Apart from these, water vapour (H2O) is one of the biggest contributors for global warming though it is not commonly categorised as a GHG with other gases. 9.2 Country Context GHG emissions in Sri Lanka from fuel combustion, both in absolute as well as in per capita terms are low even in comparison to other countries in South Asia (Table 9.1). Emission level calculated per unit of GDP is also less in Sri Lanka when compared to other countries in the World. This could be mainly due to dominance of Hydropower generation in the electricity sector and the low energy intensity in the production sectors.
Table 9.1 - Comparison of CO2 Emissions from fuel combustion Country kg CO2/2005
US$ of GDP kg CO2/2005 US$ of GDP Adjusted to PPP
tons of CO2 per Capita
Sri Lanka 0.40 0.14 0.64 Pakistan 1.00 0.32 0.78 India 1.30 0.35 1.39 Indonesia 1.09 0.43 1.71 China 1.79 0.77 5.40 France 0.16 0.19 5.52 Japan 0.25 0.29 8.97 Germany 0.26 0.28 9.32 USA 0.41 0.41 17.31 World 0.59 0.44 4.44
Source: IEA CO2 database, Figures are based on 2012 edition
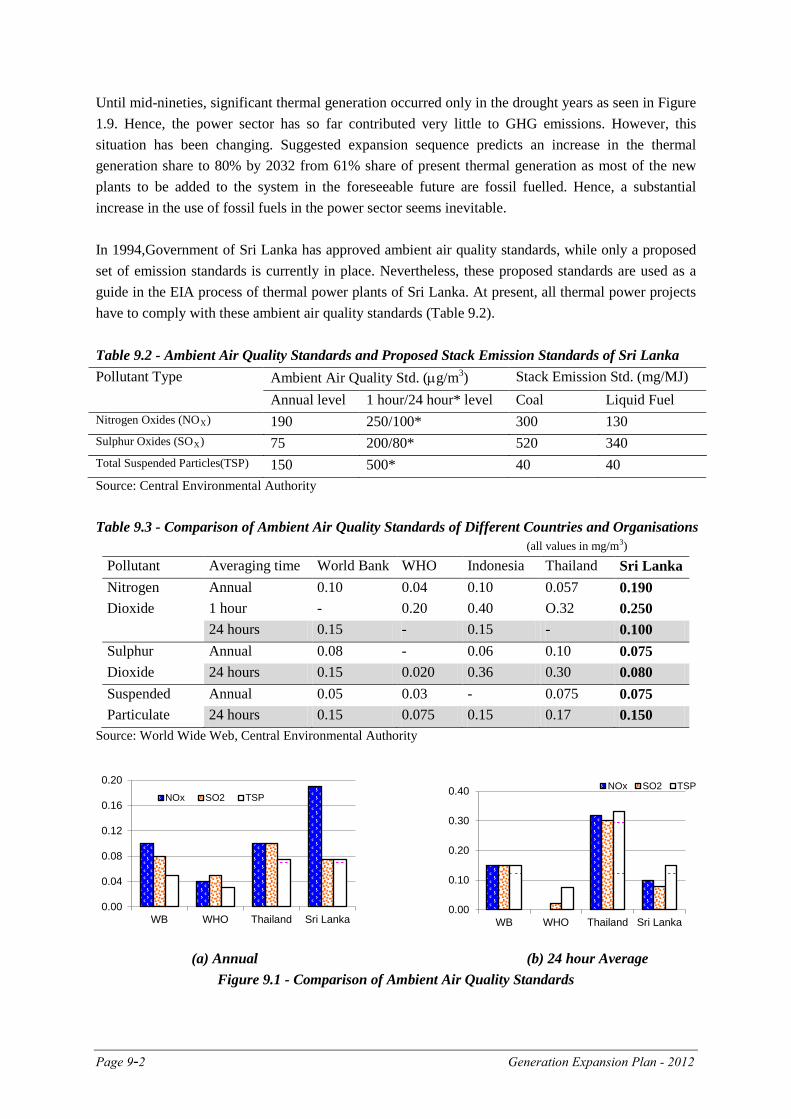
Page 9-2 Generation Expansion Plan - 2012
Until mid-nineties, significant thermal generation occurred only in the drought years as seen in Figure 1.9. Hence, the power sector has so far contributed very little to GHG emissions. However, this situation has been changing. Suggested expansion sequence predicts an increase in the thermal generation share to 80% by 2032 from 61% share of present thermal generation as most of the new plants to be added to the system in the foreseeable future are fossil fuelled. Hence, a substantial increase in the use of fossil fuels in the power sector seems inevitable. In 1994,Government of Sri Lanka has approved ambient air quality standards, while only a proposed set of emission standards is currently in place. Nevertheless, these proposed standards are used as a guide in the EIA process of thermal power plants of Sri Lanka. At present, all thermal power projects have to comply with these ambient air quality standards (Table 9.2). Table 9.2 - Ambient Air Quality Standards and Proposed Stack Emission Standards of Sri Lanka Pollutant Type Ambient Air Quality Std. (µg/m3) Stack Emission Std. (mg/MJ) Annual level 1 hour/24 hour* level Coal Liquid Fuel Nitrogen Oxides (NOX) 190 250/100* 300 130 Sulphur Oxides (SOX) 75 200/80* 520 340 Total Suspended Particles(TSP) 150 500* 40 40 Source: Central Environmental Authority Table 9.3 - Comparison of Ambient Air Quality Standards of Different Countries and Organisations (all values in mg/m3)
Pollutant Averaging time World Bank WHO Indonesia Thailand Sri Lanka Nitrogen Annual 0.10 0.04 0.10 0.057 0.190 Dioxide 1 hour - 0.20 0.40 O.32 0.250 24 hours 0.15 - 0.15 - 0.100 Sulphur Annual 0.08 - 0.06 0.10 0.075 Dioxide 24 hours 0.15 0.020 0.36 0.30 0.080 Suspended Annual 0.05 0.03 - 0.075 0.075 Particulate 24 hours 0.15 0.075 0.15 0.17 0.150
Source: World Wide Web, Central Environmental Authority
(a) Annual (b) 24 hour Average Figure 9.1 - Comparison of Ambient Air Quality Standards
0.00
0.04
0.08
0.12
0.16
0.20
WB WHO Thailand Sri Lanka
NOx SO2 TSP
0.00
0.10
0.20
0.30
0.40
WB WHO Thailand Sri Lanka
NOx SO2 TSP
Generation Expansion Plan - 2012 Page 9-3
When compared with the standard specified by the World Bank (Existing) and WHO (Table 9.3 and Figure 9.1), it is evident that Sri Lanka has very stringent ambient air quality standards for SOx emissions. The standard for particulate matter is also higher than the existing WB standards though not the highest of all. A comparison of proposed emission standards with those of WB and some Asian countries is shown in Table 9.4. It can be seen that proposed Sri Lankan Emission standards are somewhere between the European Commission standards and the standards of some neighbouring Asian countries such as China, Thailand and Vietnam. China does not have restrictions on NOx released by thermal plants. Table 9.4 - Comparison of Emission Standards of Different Countries and Organisations (All values in mg/MJ) Pollutant Sri Lanka World Bank Vietnam China Thailand European (Proposed) (Proposed) (Industry) Commission Nitrogen Oxides 300 365 487 450 500 200 Sulphur Dioxide 520 700 175 400 350 200 Suspended Particulate 40 50 200 50 700 30 Source: Central Environmental Authority, EPDC Database 9.3 Emission Control Technologies According to the expansion sequence of base case mentioned in Chapter 7 (Table 7.1), 4,600 MW of Coal plants, 44MW Diesel plants, and 360 MW of Gas Turbines are to be added to the Sri Lankan system in the next 20 years starting from 2013. The impact on the environment due to particulate and air-emissions from these additions and the effectiveness of using control devices to mitigate those impacts are analysed here. Three types of gaseous emissions were considered in the analysis, viz. SOx, NOx and CO2. When applying control technologies, it is always necessary to have an idea about the availability and capability of different control technologies. Studies have shown that, in many cases, the use of state-of-the-art engineering practices could meet the stipulated air quality standards without specific control devices. However, there are instances where emission control is mandatory. For example in the case of coal plants, the use of high-quality, low-sulphur coal (0.65% S) reduces SOX emissions to levels below the standard, but definitely there has to be some form of control over particulate emissions. The Low-NOx burners are an integrated part of most of the commercially available combined cycle plants, which are capable of reducing NOx emissions to very low levels. Hence, in the present study control technologies considered are as follows; Electrostatic Precipitators (ESPs) for the control of particulate emissions in Coal plants and low NOx burners for the control of NOx in both coal plants and combined cycle plants. Coal power plants in Sri Lanka are generally designed for low sulphur coal (0.65% sulphur) as fuel, while no specific control devices were employed for the control of SOx emissions. However, Puttalam coal power plant has a Flue Gas Desulfurization unit (FGD) installed. Table 9.5 shows the abatement factors of typical control
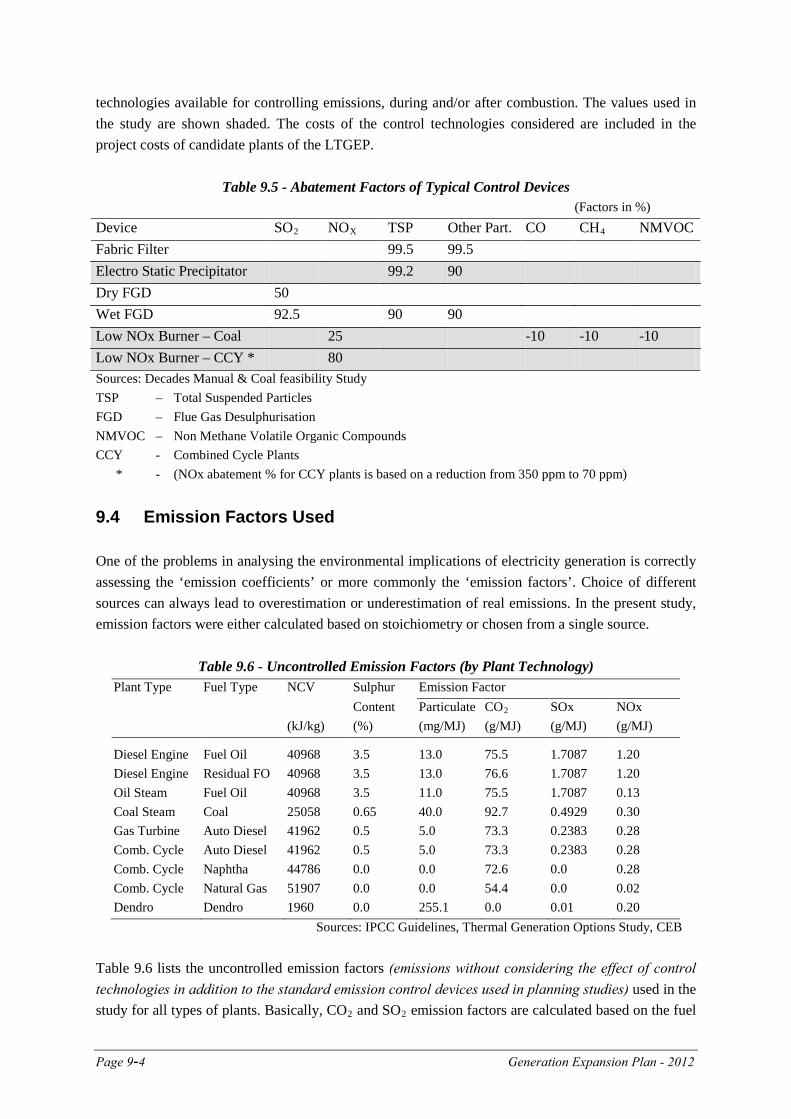
Page 9-4 Generation Expansion Plan - 2012
technologies available for controlling emissions, during and/or after combustion. The values used in the study are shown shaded. The costs of the control technologies considered are included in the project costs of candidate plants of the LTGEP.
Table 9.5 - Abatement Factors of Typical Control Devices (Factors in %)
Device SO2 NOX TSP Other Part. CO CH4 NMVOC Fabric Filter 99.5 99.5 Electro Static Precipitator 99.2 90 Dry FGD 50 Wet FGD 92.5 90 90 Low NOx Burner – Coal 25 -10 -10 -10 Low NOx Burner – CCY * 80 Sources: Decades Manual & Coal feasibility Study TSP – Total Suspended Particles FGD – Flue Gas Desulphurisation NMVOC – Non Methane Volatile Organic Compounds CCY - Combined Cycle Plants * - (NOx abatement % for CCY plants is based on a reduction from 350 ppm to 70 ppm) 9.4 Emission Factors Used One of the problems in analysing the environmental implications of electricity generation is correctly assessing the ‘emission coefficients’ or more commonly the ‘emission factors’. Choice of different sources can always lead to overestimation or underestimation of real emissions. In the present study, emission factors were either calculated based on stoichiometry or chosen from a single source.
Table 9.6 - Uncontrolled Emission Factors (by Plant Technology)
Plant Type Fuel Type NCV Sulphur Emission Factor Content Particulate CO2 SOx NOx (kJ/kg) (%) (mg/MJ) (g/MJ) (g/MJ) (g/MJ) Diesel Engine Fuel Oil 40968 3.5 13.0 75.5 1.7087 1.20 Diesel Engine Residual FO 40968 3.5 13.0 76.6 1.7087 1.20 Oil Steam Fuel Oil 40968 3.5 11.0 75.5 1.7087 0.13 Coal Steam Coal 25058 0.65 40.0 92.7 0.4929 0.30 Gas Turbine Auto Diesel 41962 0.5 5.0 73.3 0.2383 0.28 Comb. Cycle Auto Diesel 41962 0.5 5.0 73.3 0.2383 0.28 Comb. Cycle Comb. Cycle Dendro
Naphtha Natural Gas Dendro
44786 51907 1960
0.0 0.0 0.0
0.0 0.0 255.1
72.6 54.4 0.0
0.0 0.0 0.01
0.28 0.02 0.20
Sources: IPCC Guidelines, Thermal Generation Options Study, CEB Table 9.6 lists the uncontrolled emission factors (emissions without considering the effect of control technologies in addition to the standard emission control devices used in planning studies) used in the study for all types of plants. Basically, CO2 and SO2 emission factors are calculated based on the fuel
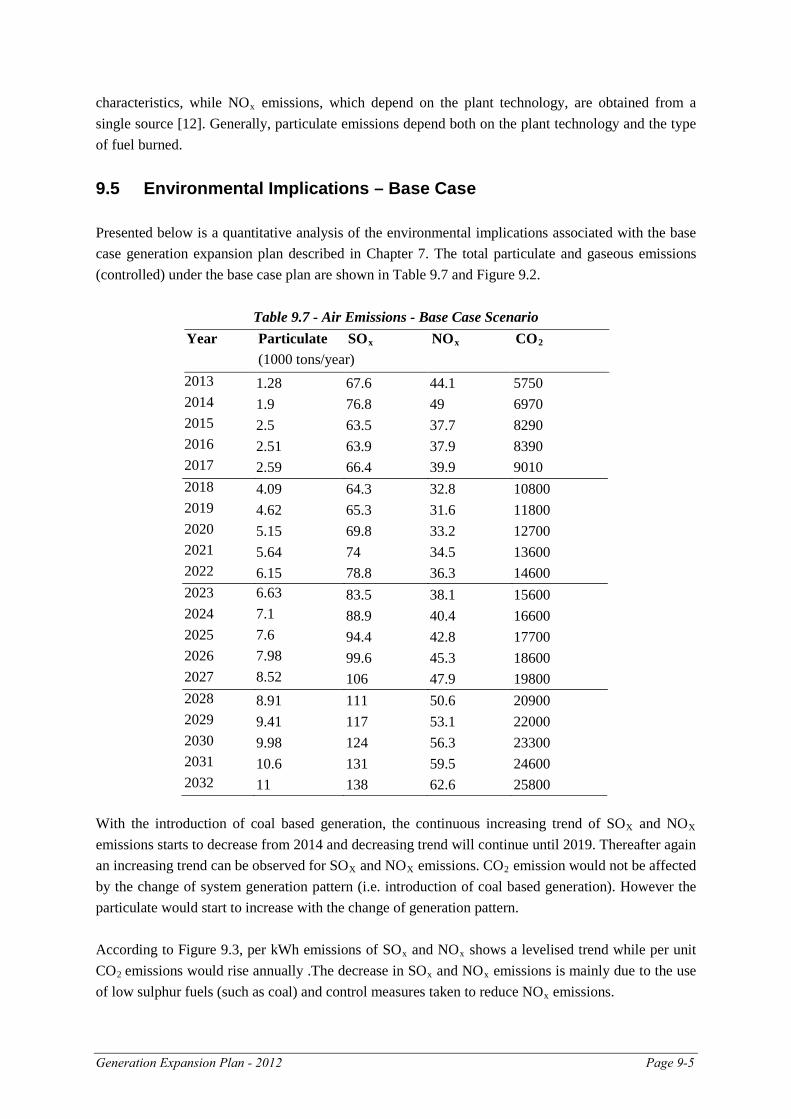
Generation Expansion Plan - 2012 Page 9-5
characteristics, while NOx emissions, which depend on the plant technology, are obtained from a single source [12]. Generally, particulate emissions depend both on the plant technology and the type of fuel burned. 9.5 Environmental Implications – Base Case Presented below is a quantitative analysis of the environmental implications associated with the base case generation expansion plan described in Chapter 7. The total particulate and gaseous emissions (controlled) under the base case plan are shown in Table 9.7 and Figure 9.2.
Table 9.7 - Air Emissions - Base Case Scenario Year Particulate SOx NOx CO2 (1000 tons/year) 2013 1.28 67.6 44.1 5750 2014 1.9 76.8 49 6970 2015 2.5 63.5 37.7 8290 2016 2.51 63.9 37.9 8390 2017 2.59 66.4 39.9 9010 2018 4.09 64.3 32.8 10800 2019 4.62 65.3 31.6 11800 2020 5.15 69.8 33.2 12700 2021 5.64 74 34.5 13600 2022 6.15 78.8 36.3 14600 2023 2024 2025 2026 2027
6.63 7.1 7.6 7.98 8.52
83.5 88.9 94.4 99.6 106
38.1 40.4 42.8 45.3 47.9
15600 16600 17700 18600 19800
2028 8.91 111 50.6 20900 2029 9.41 117 53.1 22000 2030 9.98 124 56.3 23300 2031 10.6 131 59.5 24600 2032 11 138 62.6 25800
With the introduction of coal based generation, the continuous increasing trend of SOX and NOX emissions starts to decrease from 2014 and decreasing trend will continue until 2019. Thereafter again an increasing trend can be observed for SOX and NOX emissions. CO2 emission would not be affected by the change of system generation pattern (i.e. introduction of coal based generation). However the particulate would start to increase with the change of generation pattern. According to Figure 9.3, per kWh emissions of SOx and NOx shows a levelised trend while per unit CO2 emissions would rise annually .The decrease in SOx and NOx emissions is mainly due to the use of low sulphur fuels (such as coal) and control measures taken to reduce NOx emissions.
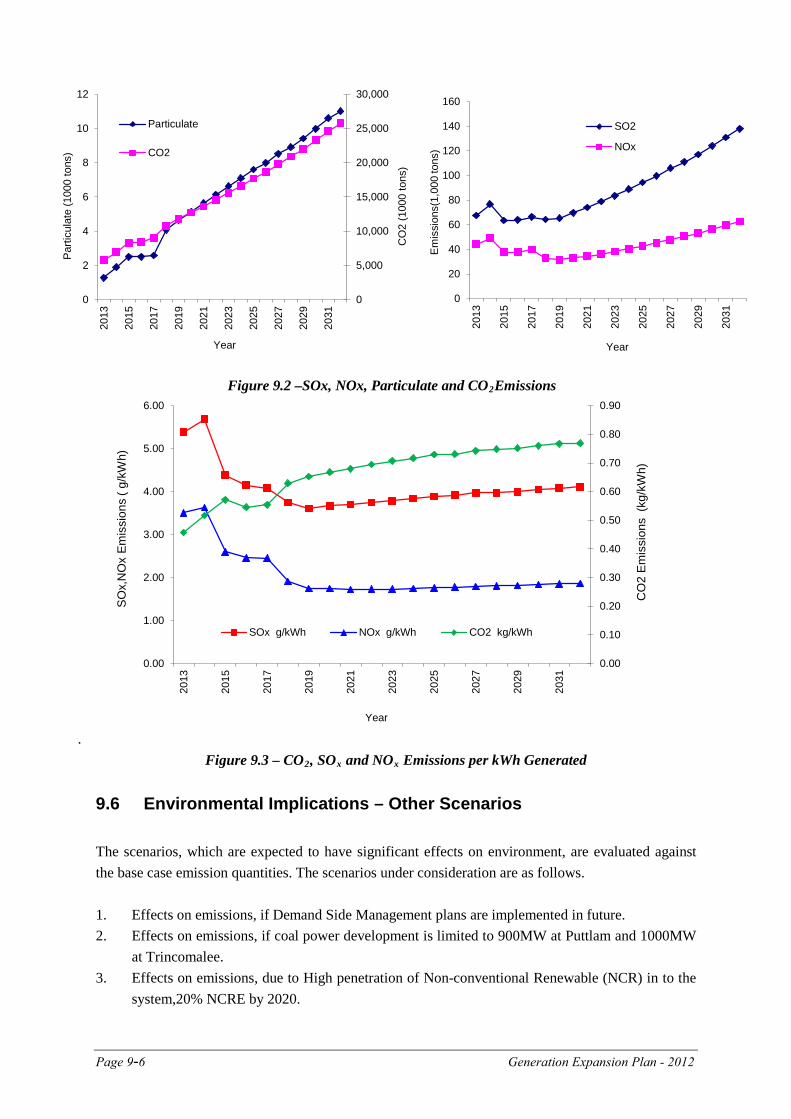
Page 9-6 Generation Expansion Plan - 2012
Figure 9.2 –SOx, NOx, Particulate and CO2Emissions
.
Figure 9.3 – CO2, SOx and NOx Emissions per kWh Generated 9.6 Environmental Implications – Other Scenarios The scenarios, which are expected to have significant effects on environment, are evaluated against the base case emission quantities. The scenarios under consideration are as follows. 1. Effects on emissions, if Demand Side Management plans are implemented in future. 2. Effects on emissions, if coal power development is limited to 900MW at Puttlam and 1000MW
at Trincomalee. 3. Effects on emissions, due to High penetration of Non-conventional Renewable (NCR) in to the
system,20% NCRE by 2020.
0.00
0.10
0.20
0.30
0.40
0.50
0.60
0.70
0.80
0.90
0.00
1.00
2.00
3.00
4.00
5.00
6.00
2013
2015
2017
2019
2021
2023
2025
2027
2029
2031
CO
2 E
mis
sion
s (k
g/kW
h)
SO
x,N
Ox
Em
issi
ons
( g/k
Wh)
Year
SOx g/kWh NOx g/kWh CO2 kg/kWh
0
5,000
10,000
15,000
20,000
25,000
30,000
0
2
4
6
8
10
1220
13
2015
2017
2019
2021
2023
2025
2027
2029
2031
CO
2 (1
000
tons
)
Par
ticul
ate
(100
0 to
ns)
Year
Particulate
CO2
0
20
40
60
80
100
120
140
160
2013
2015
2017
2019
2021
2023
2025
2027
2029
2031
Em
issi
ons(
1,00
0 to
ns)
Year
SO2
NOx
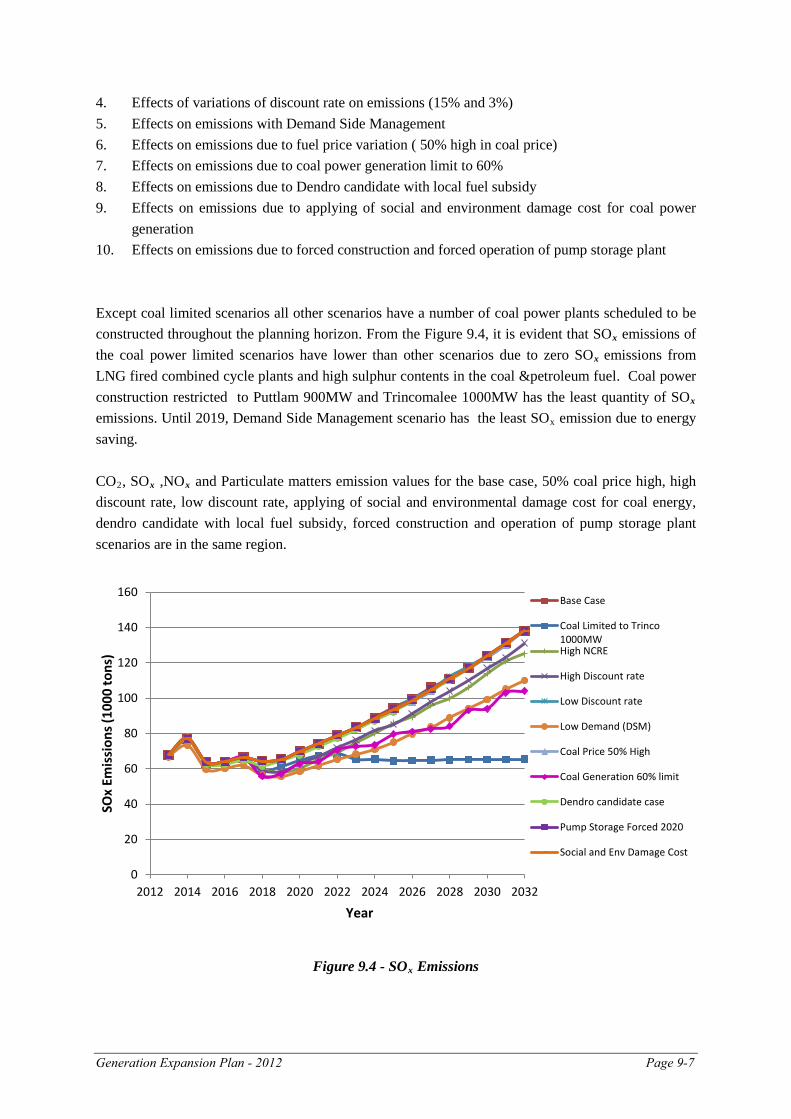
Generation Expansion Plan - 2012 Page 9-7
4. Effects of variations of discount rate on emissions (15% and 3%) 5. Effects on emissions with Demand Side Management 6. Effects on emissions due to fuel price variation ( 50% high in coal price) 7. Effects on emissions due to coal power generation limit to 60% 8. Effects on emissions due to Dendro candidate with local fuel subsidy 9. Effects on emissions due to applying of social and environment damage cost for coal power
generation 10. Effects on emissions due to forced construction and forced operation of pump storage plant
Except coal limited scenarios all other scenarios have a number of coal power plants scheduled to be constructed throughout the planning horizon. From the Figure 9.4, it is evident that SOx emissions of the coal power limited scenarios have lower than other scenarios due to zero SOx emissions from LNG fired combined cycle plants and high sulphur contents in the coal &petroleum fuel. Coal power construction restricted to Puttlam 900MW and Trincomalee 1000MW has the least quantity of SOx emissions. Until 2019, Demand Side Management scenario has the least SOx emission due to energy saving. CO2, SOx ,NOx and Particulate matters emission values for the base case, 50% coal price high, high discount rate, low discount rate, applying of social and environmental damage cost for coal energy, dendro candidate with local fuel subsidy, forced construction and operation of pump storage plant scenarios are in the same region.
Figure 9.4 - SOx Emissions
0
20
40
60
80
100
120
140
160
2012 2014 2016 2018 2020 2022 2024 2026 2028 2030 2032
SOx
Emis
sion
s (10
00 to
ns)
Year
Base Case
Coal Limited to Trinco1000MWHigh NCRE
High Discount rate
Low Discount rate
Low Demand (DSM)
Coal Price 50% High
Coal Generation 60% limit
Dendro candidate case
Pump Storage Forced 2020
Social and Env Damage Cost
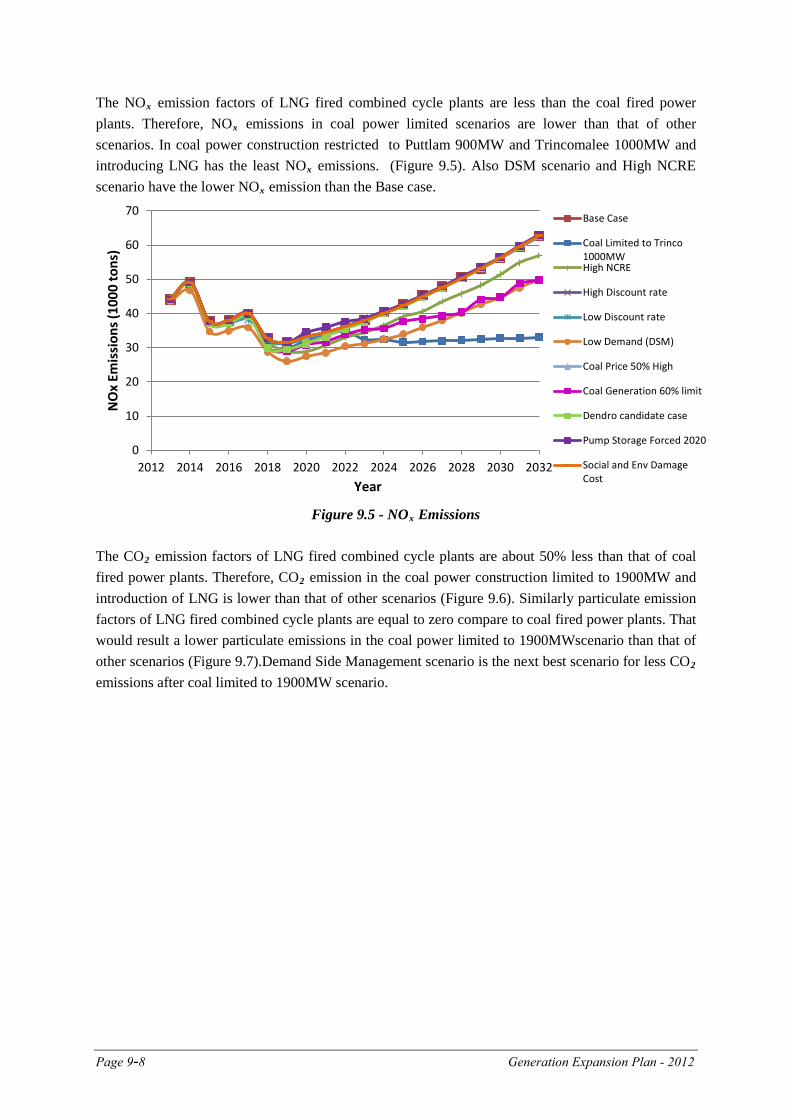
Page 9-8 Generation Expansion Plan - 2012
The NOx emission factors of LNG fired combined cycle plants are less than the coal fired power plants. Therefore, NOx emissions in coal power limited scenarios are lower than that of other scenarios. In coal power construction restricted to Puttlam 900MW and Trincomalee 1000MW and introducing LNG has the least NOx emissions. (Figure 9.5). Also DSM scenario and High NCRE scenario have the lower NOx emission than the Base case.
Figure 9.5 - NOx Emissions
The CO2 emission factors of LNG fired combined cycle plants are about 50% less than that of coal fired power plants. Therefore, CO2 emission in the coal power construction limited to 1900MW and introduction of LNG is lower than that of other scenarios (Figure 9.6). Similarly particulate emission factors of LNG fired combined cycle plants are equal to zero compare to coal fired power plants. That would result a lower particulate emissions in the coal power limited to 1900MWscenario than that of other scenarios (Figure 9.7).Demand Side Management scenario is the next best scenario for less CO2 emissions after coal limited to 1900MW scenario.
0
10
20
30
40
50
60
70
2012 2014 2016 2018 2020 2022 2024 2026 2028 2030 2032
NO
x Em
issi
ons (
1000
tons
)
Year
Base Case
Coal Limited to Trinco1000MWHigh NCRE
High Discount rate
Low Discount rate
Low Demand (DSM)
Coal Price 50% High
Coal Generation 60% limit
Dendro candidate case
Pump Storage Forced 2020
Social and Env DamageCost
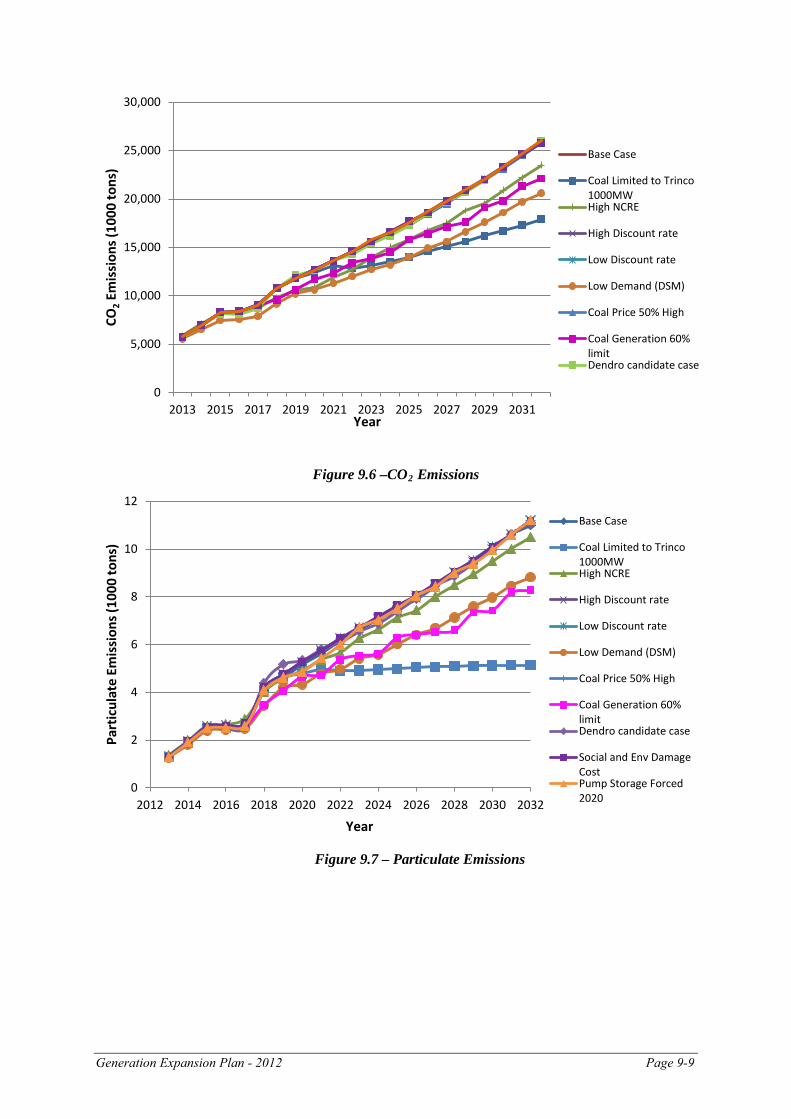
Generation Expansion Plan - 2012 Page 9-9
Figure 9.6 –CO2 Emissions
Figure 9.7 – Particulate Emissions
0
5,000
10,000
15,000
20,000
25,000
30,000
2013 2015 2017 2019 2021 2023 2025 2027 2029 2031
CO2 E
mis
sion
s (10
00 to
ns)
Year
Base Case
Coal Limited to Trinco1000MWHigh NCRE
High Discount rate
Low Discount rate
Low Demand (DSM)
Coal Price 50% High
Coal Generation 60%limitDendro candidate case
0
2
4
6
8
10
12
2012 2014 2016 2018 2020 2022 2024 2026 2028 2030 2032
Part
icul
ate
Emis
sion
s (10
00 to
ns)
Year
Base Case
Coal Limited to Trinco1000MWHigh NCRE
High Discount rate
Low Discount rate
Low Demand (DSM)
Coal Price 50% High
Coal Generation 60%limitDendro candidate case
Social and Env DamageCostPump Storage Forced2020
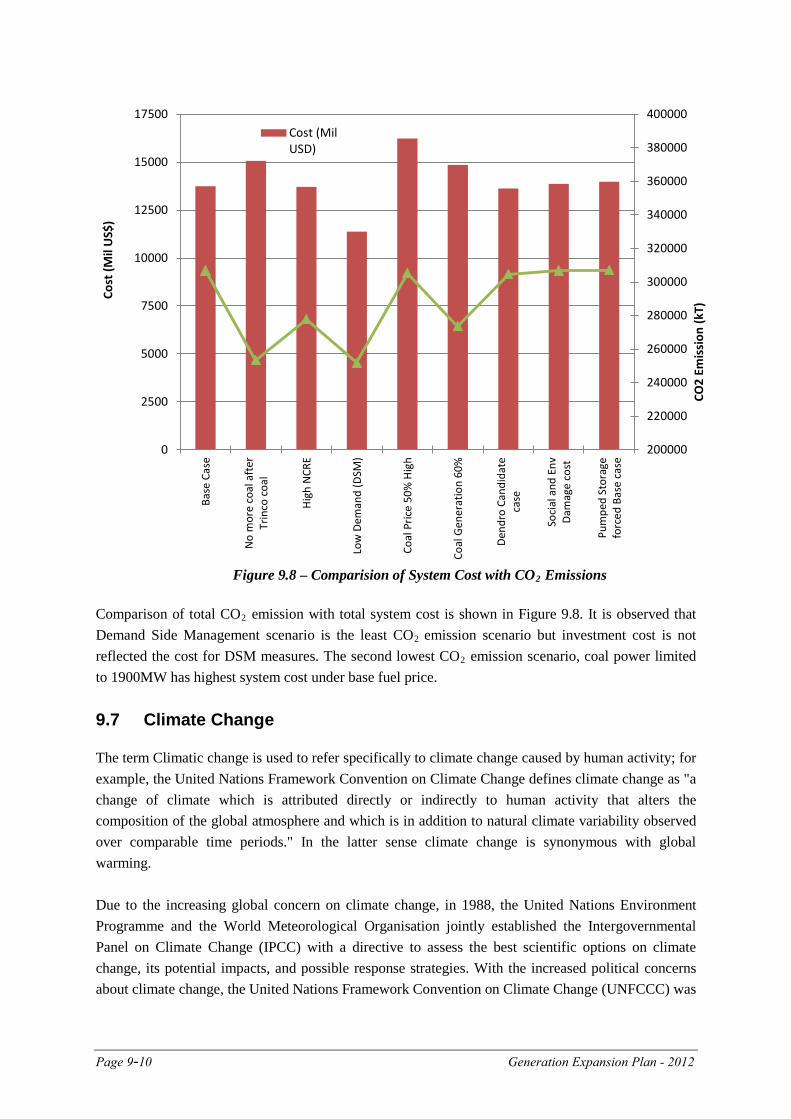
Page 9-10 Generation Expansion Plan - 2012
Figure 9.8 – Comparision of System Cost with CO2 Emissions
Comparison of total CO2 emission with total system cost is shown in Figure 9.8. It is observed that Demand Side Management scenario is the least CO2 emission scenario but investment cost is not reflected the cost for DSM measures. The second lowest CO2 emission scenario, coal power limited to 1900MW has highest system cost under base fuel price. 9.7 Climate Change
The term Climatic change is used to refer specifically to climate change caused by human activity; for example, the United Nations Framework Convention on Climate Change defines climate change as "a change of climate which is attributed directly or indirectly to human activity that alters the composition of the global atmosphere and which is in addition to natural climate variability observed over comparable time periods." In the latter sense climate change is synonymous with global warming. Due to the increasing global concern on climate change, in 1988, the United Nations Environment Programme and the World Meteorological Organisation jointly established the Intergovernmental Panel on Climate Change (IPCC) with a directive to assess the best scientific options on climate change, its potential impacts, and possible response strategies. With the increased political concerns about climate change, the United Nations Framework Convention on Climate Change (UNFCCC) was
200000
220000
240000
260000
280000
300000
320000
340000
360000
380000
400000
0
2500
5000
7500
10000
12500
15000
17500
Base
Cas
e
No
mor
e co
al a
fter
Trin
co c
oal
High
NCR
E
Low
Dem
and
(DSM
)
Coal
Pric
e 50
% H
igh
Coal
Gen
erat
ion
60%
Dend
ro C
andi
date
case
Soci
al a
nd E
nvDa
mag
e co
st
Pum
ped
Stor
age
forc
ed B
ase
case
CO2
Emis
sion
(kT)
Cost
(Mil
US$
)
Cost (MilUSD)
Generation Expansion Plan - 2012 Page 9-11
formulated on the basis of initial IPCC findings. In 1992, the UNFCCC was established and signed by almost all countries at the Rio Summit. The decision making body of UNFCCC is known as Conference of Parties (COP) which meets annually. The Kyoto Protocol was accepted in COP3 in Kyoto, Japan in 1997. The major feature of the Kyoto Protocol is that it sets binding targets for 37 industrialised counties and the European Community for reducing Green House Gas (GHG) emissions. It will amount to an average of 5% against 1990 levels over the five year period 2008-2012 (European Union at United Nations, 2008). Energy related carbon dioxide emission is one of the main GHG courses of climate change. But the goal of Kyoto Protocol is to lower overall emissions of six greenhouse gases - carbon dioxide, methane, nitrous oxide, sulphur hexafluoride, hydro-fluorocarbons and per-fluorocarbons (UNFCCC, 2008). Recognising that industrialised counties (countries in Annex I of the Kyoto Protocol) are principally responsible for the current high levels of GHG emissions in the atmosphere as a result of more than 150 years of industrial activity, the protocol places the heavier burden on developed nations under the principle of “common but differentiated responsibilities”. The Kyoto Protocol was adopted in Kyoto, Japan, on 11 December 1997 and entered in to force on 16th February 2005. Under the Kyoto Protocol, Annex I counties must meet their targets primarily through national measures. However the Kyoto protocol offers them an additional means of meeting their target by the way of three market based mechanisms. Emission trading – known as “the carbon market” The Clean Development Mechanism (CDM) Joint implementation (JI)
Under the Protocol, countries’ actual emissions have to be monitored and precise records have to be kept to the trades carried out. Only the Clean Development Mechanism allows economical emission credit trading among Annex I and non-Annex I countries. Thirteenth Conference of Parties (COP13) was held at Bali in December 2007. This conference resulted in the adoption of Bali Road Map which consisted of several forward looking climate decisions. Launching of Adaptation Fund, A review of Kyoto Protocol, Decisions on Technology transfer and Reducing Deforestation related emissions and Ad-Hoc Working Group (AWG) negotiations on a Long Term Corporative Agreement (LCA) and Kyoto Protocol (KP) were included in this road map. The efforts to take a decision on the extension of the Kyoto Protocol prior to the ending of its 1st commitment period on 31st December 2012, specially at the COP15/CMP5 in Copenhagen, COP 16/CMP6 in Cancun and COP17/CMP7 in Durban failed and only in at the COP18/CMP8 in Doha that an agreement was reached. Accordingly at Doha, parties agreed for a second commitment period up to 31.12.2020, a revised list of greenhouse gases and commitment by parties to reduce GHG emission by at least 18% below 1990 levels. However, the expected reductions are comparatively low and there is a significance difference in the parties to the second commitment compared to the previous with parties such as Japan, Canada, Russia not being included for the second commitment.
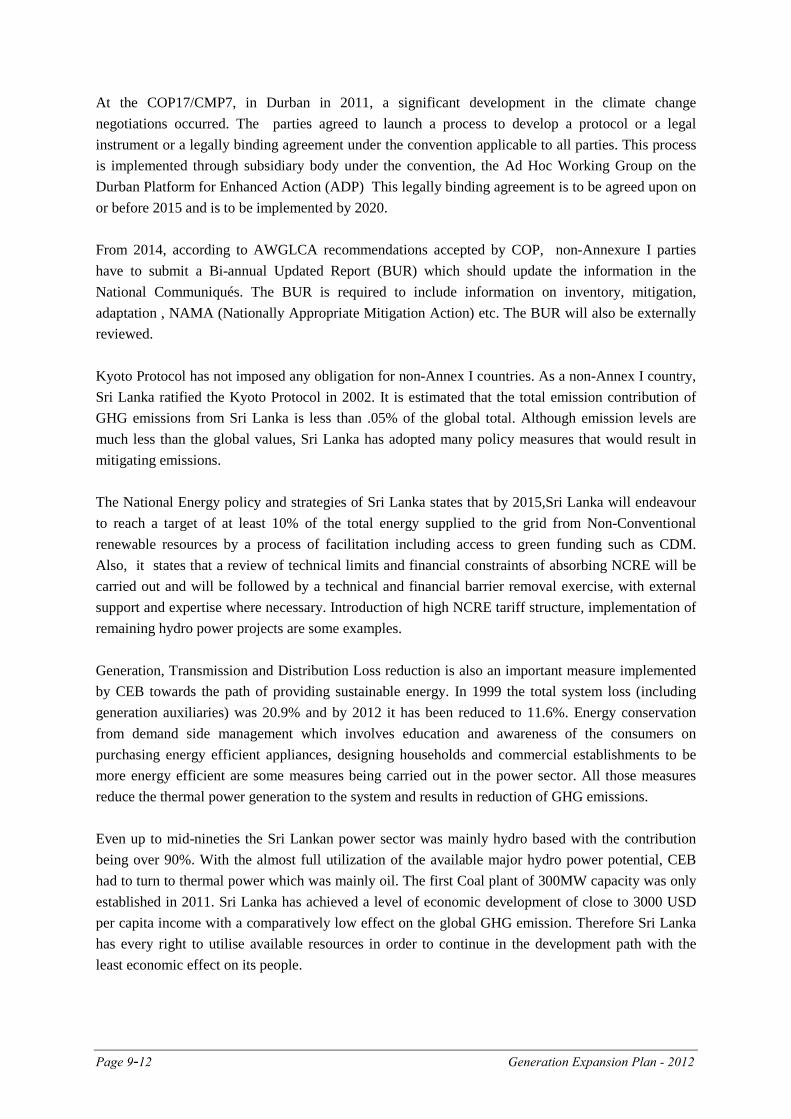
Page 9-12 Generation Expansion Plan - 2012
At the COP17/CMP7, in Durban in 2011, a significant development in the climate change negotiations occurred. The parties agreed to launch a process to develop a protocol or a legal instrument or a legally binding agreement under the convention applicable to all parties. This process is implemented through subsidiary body under the convention, the Ad Hoc Working Group on the Durban Platform for Enhanced Action (ADP) This legally binding agreement is to be agreed upon on or before 2015 and is to be implemented by 2020. From 2014, according to AWGLCA recommendations accepted by COP, non-Annexure I parties have to submit a Bi-annual Updated Report (BUR) which should update the information in the National Communiqués. The BUR is required to include information on inventory, mitigation, adaptation , NAMA (Nationally Appropriate Mitigation Action) etc. The BUR will also be externally reviewed. Kyoto Protocol has not imposed any obligation for non-Annex I countries. As a non-Annex I country, Sri Lanka ratified the Kyoto Protocol in 2002. It is estimated that the total emission contribution of GHG emissions from Sri Lanka is less than .05% of the global total. Although emission levels are much less than the global values, Sri Lanka has adopted many policy measures that would result in mitigating emissions. The National Energy policy and strategies of Sri Lanka states that by 2015,Sri Lanka will endeavour to reach a target of at least 10% of the total energy supplied to the grid from Non-Conventional renewable resources by a process of facilitation including access to green funding such as CDM. Also, it states that a review of technical limits and financial constraints of absorbing NCRE will be carried out and will be followed by a technical and financial barrier removal exercise, with external support and expertise where necessary. Introduction of high NCRE tariff structure, implementation of remaining hydro power projects are some examples. Generation, Transmission and Distribution Loss reduction is also an important measure implemented by CEB towards the path of providing sustainable energy. In 1999 the total system loss (including generation auxiliaries) was 20.9% and by 2012 it has been reduced to 11.6%. Energy conservation from demand side management which involves education and awareness of the consumers on purchasing energy efficient appliances, designing households and commercial establishments to be more energy efficient are some measures being carried out in the power sector. All those measures reduce the thermal power generation to the system and results in reduction of GHG emissions. Even up to mid-nineties the Sri Lankan power sector was mainly hydro based with the contribution being over 90%. With the almost full utilization of the available major hydro power potential, CEB had to turn to thermal power which was mainly oil. The first Coal plant of 300MW capacity was only established in 2011. Sri Lanka has achieved a level of economic development of close to 3000 USD per capita income with a comparatively low effect on the global GHG emission. Therefore Sri Lanka has every right to utilise available resources in order to continue in the development path with the least economic effect on its people.
Generation Expansion Plan - 2012 Page 9-13
LTGEP has been worked out based on the least cost economically optimal plant additions in order to meet the forecast electricity demand. Coal power will be the major share of the optimised energy mix in the near future and will contribute significantly to the GHG emissions in comparison with current level. Any proposal to shift from Coal to higher cost technology / fuel in order to reduce the GHG emissions should include suitable compensation by an international mechanism.
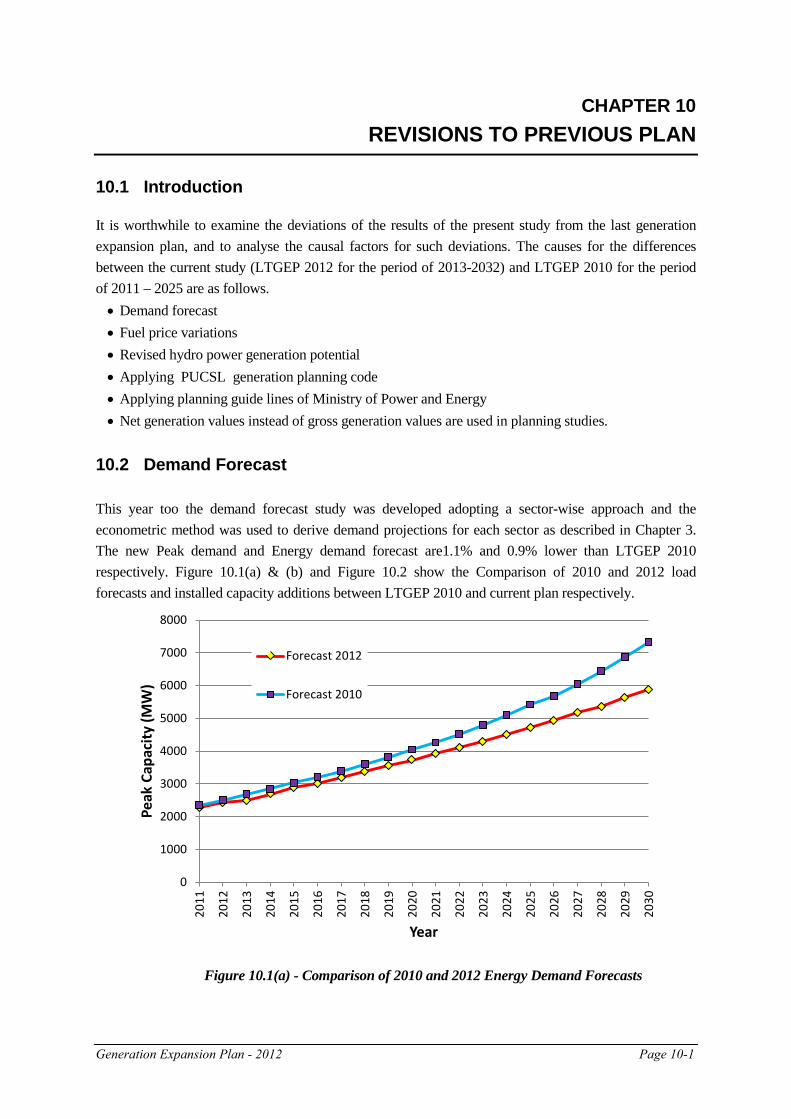
Generation Expansion Plan - 2012 Page 10-1
CHAPTER 10 REVISIONS TO PREVIOUS PLAN
10.1 Introduction
It is worthwhile to examine the deviations of the results of the present study from the last generation expansion plan, and to analyse the causal factors for such deviations. The causes for the differences between the current study (LTGEP 2012 for the period of 2013-2032) and LTGEP 2010 for the period of 2011 – 2025 are as follows. • Demand forecast • Fuel price variations • Revised hydro power generation potential • Applying PUCSL generation planning code • Applying planning guide lines of Ministry of Power and Energy • Net generation values instead of gross generation values are used in planning studies.
10.2 Demand Forecast This year too the demand forecast study was developed adopting a sector-wise approach and the econometric method was used to derive demand projections for each sector as described in Chapter 3. The new Peak demand and Energy demand forecast are1.1% and 0.9% lower than LTGEP 2010 respectively. Figure 10.1(a) & (b) and Figure 10.2 show the Comparison of 2010 and 2012 load forecasts and installed capacity additions between LTGEP 2010 and current plan respectively.
Figure 10.1(a) - Comparison of 2010 and 2012 Energy Demand Forecasts
0
1000
2000
3000
4000
5000
6000
7000
8000
2011
2012
2013
2014
2015
2016
2017
2018
2019
2020
2021
2022
2023
2024
2025
2026
2027
2028
2029
2030
Peak
Cap
acity
(MW
)
Year
Forecast 2012
Forecast 2010
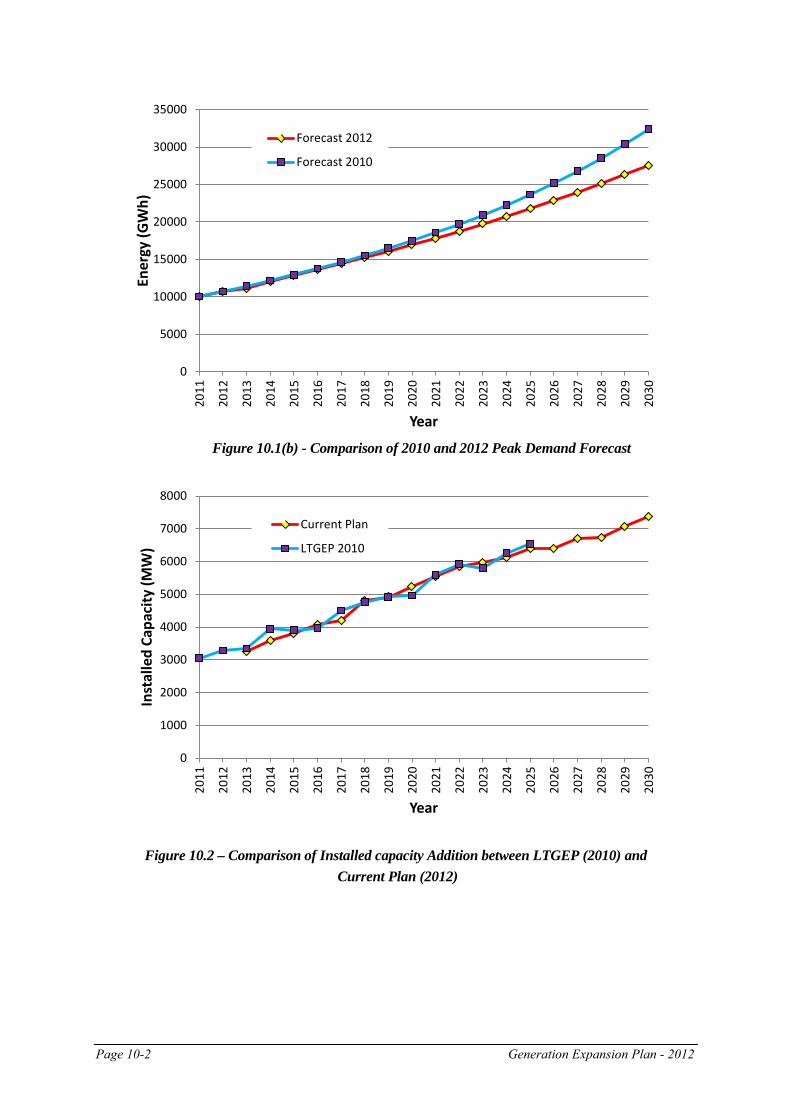
Page 10-2 Generation Expansion Plan - 2012
Figure 10.1(b) - Comparison of 2010 and 2012 Peak Demand Forecast
Figure 10.2 – Comparison of Installed capacity Addition between LTGEP (2010) and Current Plan (2012)
0
5000
10000
15000
20000
25000
30000
35000
2011
2012
2013
2014
2015
2016
2017
2018
2019
2020
2021
2022
2023
2024
2025
2026
2027
2028
2029
2030
Ener
gy (G
Wh)
Year
Forecast 2012
Forecast 2010
0
1000
2000
3000
4000
5000
6000
7000
8000
2011
2012
2013
2014
2015
2016
2017
2018
2019
2020
2021
2022
2023
2024
2025
2026
2027
2028
2029
2030
Inst
alle
d Ca
paci
ty (M
W)
Year
Current Plan
LTGEP 2010
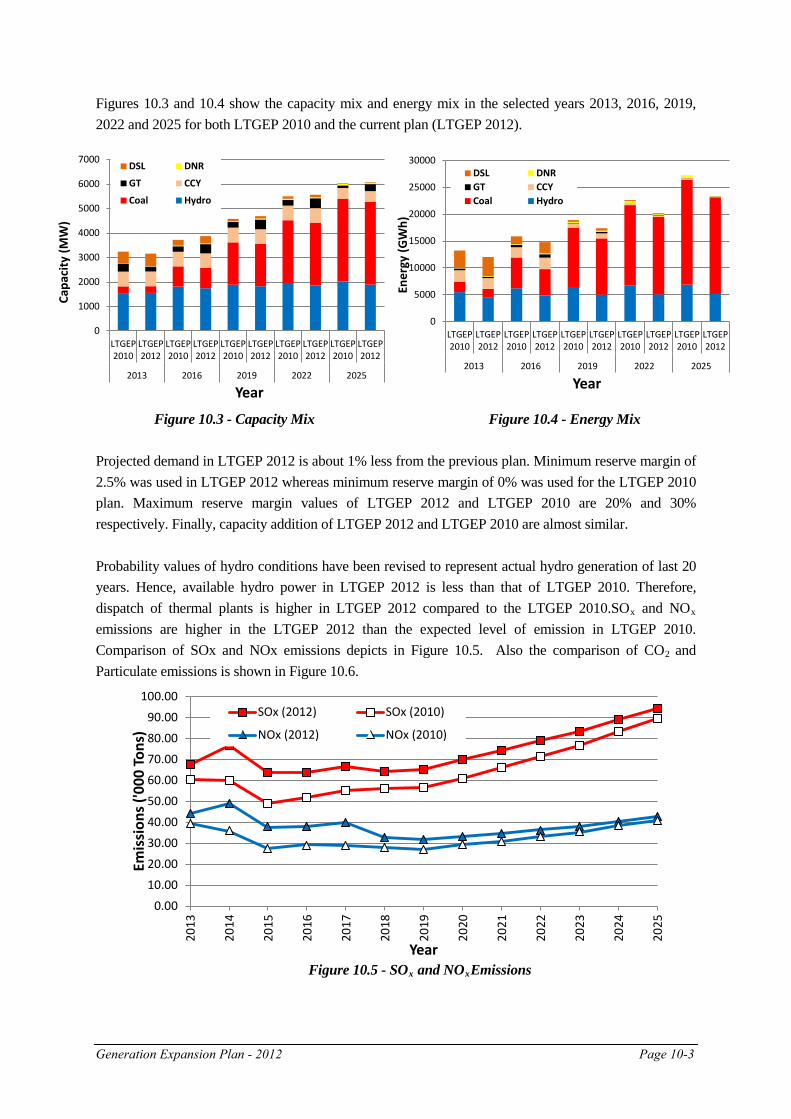
Generation Expansion Plan - 2012 Page 10-3
0
1000
2000
3000
4000
5000
6000
7000
LTGEP2010
LTGEP2012
LTGEP2010
LTGEP2012
LTGEP2010
LTGEP2012
LTGEP2010
LTGEP2012
LTGEP2010
LTGEP2012
2013 2016 2019 2022 2025
Capa
city
(MW
)
Year
DSL DNR
GT CCY
Coal Hydro
0
5000
10000
15000
20000
25000
30000
LTGEP2010
LTGEP2012
LTGEP2010
LTGEP2012
LTGEP2010
LTGEP2012
LTGEP2010
LTGEP2012
LTGEP2010
LTGEP2012
2013 2016 2019 2022 2025
Ener
gy (G
Wh)
Year
DSL DNRGT CCYCoal Hydro
Figures 10.3 and 10.4 show the capacity mix and energy mix in the selected years 2013, 2016, 2019, 2022 and 2025 for both LTGEP 2010 and the current plan (LTGEP 2012).
Figure 10.3 - Capacity Mix Figure 10.4 - Energy Mix Projected demand in LTGEP 2012 is about 1% less from the previous plan. Minimum reserve margin of 2.5% was used in LTGEP 2012 whereas minimum reserve margin of 0% was used for the LTGEP 2010 plan. Maximum reserve margin values of LTGEP 2012 and LTGEP 2010 are 20% and 30% respectively. Finally, capacity addition of LTGEP 2012 and LTGEP 2010 are almost similar. Probability values of hydro conditions have been revised to represent actual hydro generation of last 20 years. Hence, available hydro power in LTGEP 2012 is less than that of LTGEP 2010. Therefore, dispatch of thermal plants is higher in LTGEP 2012 compared to the LTGEP 2010.SOx and NOx emissions are higher in the LTGEP 2012 than the expected level of emission in LTGEP 2010. Comparison of SOx and NOx emissions depicts in Figure 10.5. Also the comparison of CO2 and Particulate emissions is shown in Figure 10.6.
Figure 10.5 - SOx and NOxEmissions
0.00
10.00
20.00
30.00
40.00
50.00
60.00
70.00
80.00
90.00
100.00
2013
2014
2015
2016
2017
2018
2019
2020
2021
2022
2023
2024
2025
Emis
sion
s ('0
00 To
ns)
Year
SOx (2012) SOx (2010)
NOx (2012) NOx (2010)
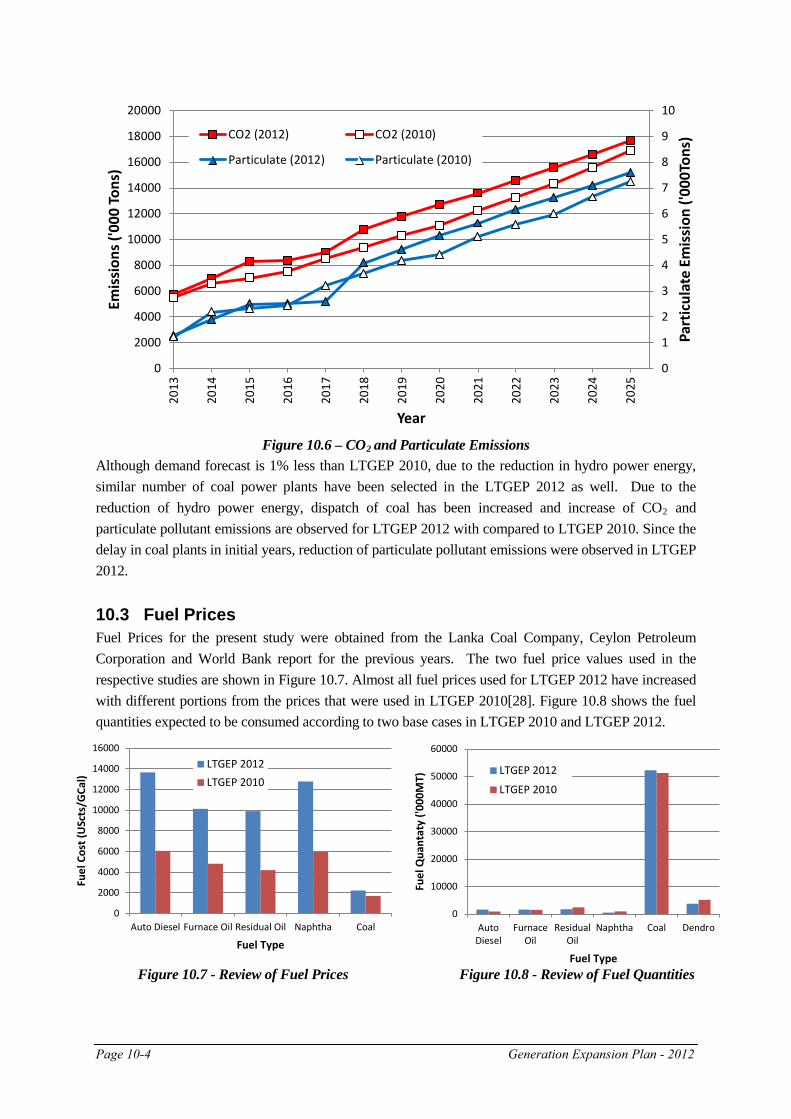
Page 10-4 Generation Expansion Plan - 2012
0
10000
20000
30000
40000
50000
60000
AutoDiesel
FurnaceOil
ResidualOil
Naphtha Coal Dendro
Fuel
Qua
ntat
y ('0
00M
T)
Fuel Type
LTGEP 2012
LTGEP 2010
Figure 10.6 – CO2 and Particulate Emissions Although demand forecast is 1% less than LTGEP 2010, due to the reduction in hydro power energy, similar number of coal power plants have been selected in the LTGEP 2012 as well. Due to the reduction of hydro power energy, dispatch of coal has been increased and increase of CO2 and particulate pollutant emissions are observed for LTGEP 2012 with compared to LTGEP 2010. Since the delay in coal plants in initial years, reduction of particulate pollutant emissions were observed in LTGEP 2012. 10.3 Fuel Prices Fuel Prices for the present study were obtained from the Lanka Coal Company, Ceylon Petroleum Corporation and World Bank report for the previous years. The two fuel price values used in the respective studies are shown in Figure 10.7. Almost all fuel prices used for LTGEP 2012 have increased with different portions from the prices that were used in LTGEP 2010[28]. Figure 10.8 shows the fuel quantities expected to be consumed according to two base cases in LTGEP 2010 and LTGEP 2012.
Figure 10.7 - Review of Fuel Prices Figure 10.8 - Review of Fuel Quantities
0
1
2
3
4
5
6
7
8
9
10
0
2000
4000
6000
8000
10000
12000
14000
16000
18000
20000
2013
2014
2015
2016
2017
2018
2019
2020
2021
2022
2023
2024
2025
Part
icul
ate
Emis
sion
('00
0Ton
s)
Emis
sion
s ('0
00 To
ns)
Year
CO2 (2012) CO2 (2010)
Particulate (2012) Particulate (2010)
0
2000
4000
6000
8000
10000
12000
14000
16000
Auto Diesel Furnace Oil Residual Oil Naphtha Coal
Fuel
Cos
t (U
Scts
/GCa
l)
Fuel Type
LTGEP 2012LTGEP 2010
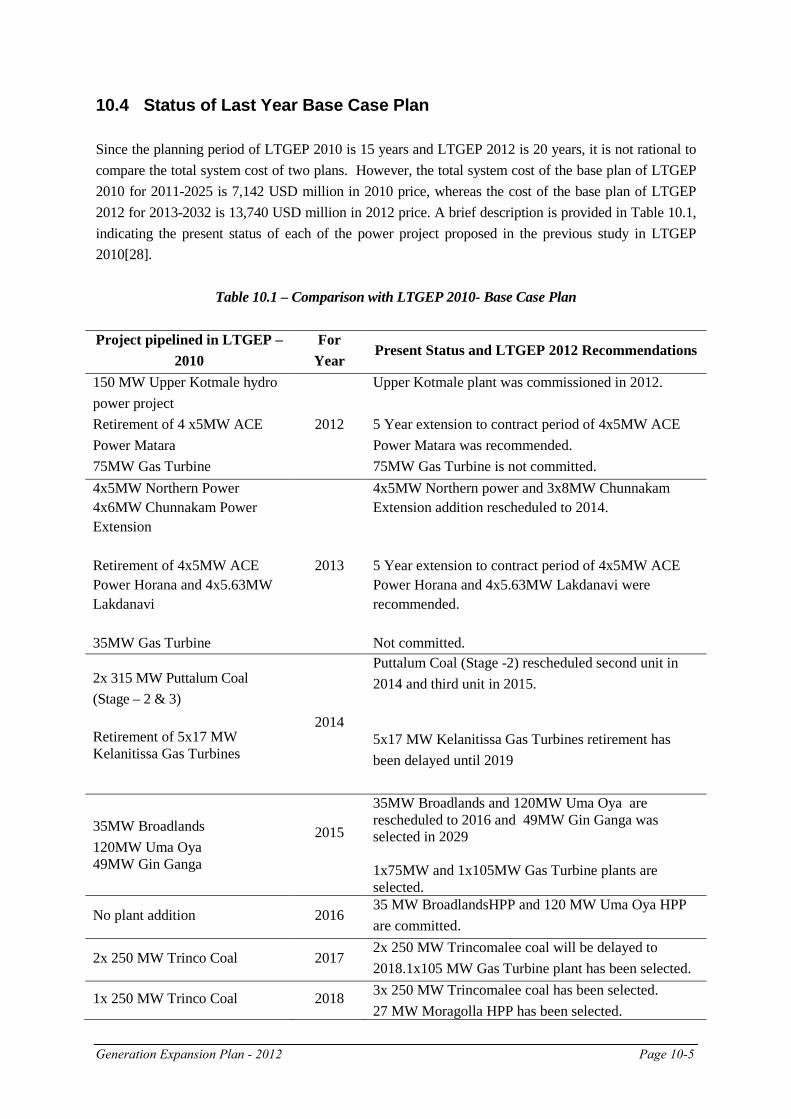
Generation Expansion Plan - 2012 Page 10-5
10.4 Status of Last Year Base Case Plan Since the planning period of LTGEP 2010 is 15 years and LTGEP 2012 is 20 years, it is not rational to compare the total system cost of two plans. However, the total system cost of the base plan of LTGEP 2010 for 2011-2025 is 7,142 USD million in 2010 price, whereas the cost of the base plan of LTGEP 2012 for 2013-2032 is 13,740 USD million in 2012 price. A brief description is provided in Table 10.1, indicating the present status of each of the power project proposed in the previous study in LTGEP 2010[28].
Table 10.1 – Comparison with LTGEP 2010- Base Case Plan
Project pipelined in LTGEP – 2010
For Year
Present Status and LTGEP 2012 Recommendations
150 MW Upper Kotmale hydro power project Retirement of 4 x5MW ACE Power Matara 75MW Gas Turbine
2012
Upper Kotmale plant was commissioned in 2012. 5 Year extension to contract period of 4x5MW ACE Power Matara was recommended. 75MW Gas Turbine is not committed.
4x5MW Northern Power 4x6MW Chunnakam Power Extension Retirement of 4x5MW ACE Power Horana and 4x5.63MW Lakdanavi 35MW Gas Turbine
2013
4x5MW Northern power and 3x8MW Chunnakam Extension addition rescheduled to 2014. 5 Year extension to contract period of 4x5MW ACE Power Horana and 4x5.63MW Lakdanavi were recommended. Not committed.
2x 315 MW Puttalum Coal (Stage – 2 & 3) Retirement of 5x17 MW Kelanitissa Gas Turbines
2014
Puttalum Coal (Stage -2) rescheduled second unit in 2014 and third unit in 2015. 5x17 MW Kelanitissa Gas Turbines retirement has been delayed until 2019
35MW Broadlands 120MW Uma Oya 49MW Gin Ganga
2015
35MW Broadlands and 120MW Uma Oya are rescheduled to 2016 and 49MW Gin Ganga was selected in 2029 1x75MW and 1x10⁵MW Gas Turbine plants are selected.
No plant addition 2016 35 MW BroadlandsHPP and 120 MW Uma Oya HPP are committed.
2x 250 MW Trinco Coal 2017 2x 250 MW Trincomalee coal will be delayed to 2018.1x105 MW Gas Turbine plant has been selected.
1x 250 MW Trinco Coal 2018 3x 250 MW Trincomalee coal has been selected. 27 MW Moragolla HPP has been selected.
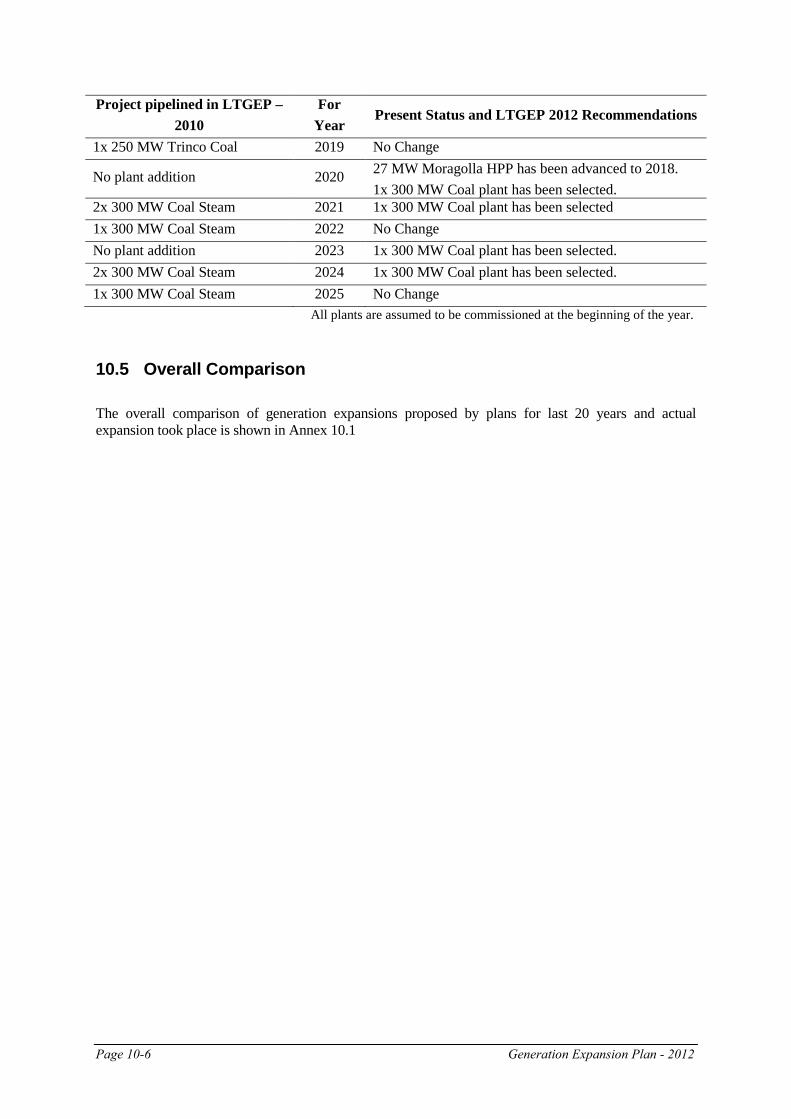
Page 10-6 Generation Expansion Plan - 2012
Project pipelined in LTGEP – 2010
For Year
Present Status and LTGEP 2012 Recommendations
1x 250 MW Trinco Coal 2019 No Change
No plant addition 2020 27 MW Moragolla HPP has been advanced to 2018. 1x 300 MW Coal plant has been selected.
2x 300 MW Coal Steam 2021 1x 300 MW Coal plant has been selected 1x 300 MW Coal Steam 2022 No Change No plant addition 2023 1x 300 MW Coal plant has been selected. 2x 300 MW Coal Steam 2024 1x 300 MW Coal plant has been selected. 1x 300 MW Coal Steam 2025 No Change
All plants are assumed to be commissioned at the beginning of the year.
10.5 Overall Comparison The overall comparison of generation expansions proposed by plans for last 20 years and actual expansion took place is shown in Annex 10.1
Revised Generation Expansion Plan – 2012 Page R-1
REFERENCES [1] Annual Report 2009, Central Bank of Sri Lanka [2] Annual Report 2010, Central Bank of Sri Lanka [3] Annual Report 2011, Central Bank of Sri Lanka [4] Master Plan for the Electricity Supply of Sri Lanka, June 1989 [5] Study of Hydropower Optimization in Sri Lanka, February 2004 [6] Feasibility Report, Broadlands Power Project, Central Engineering Consultancy Bureau, Sri
Lanka, 1986 [7] Broadlands Hydro Electric Project, Central Engineering Consultancy Bureau Communication
dated 21st October 1991 [8] Pre-feasibility Study on Uma Oya Multi-purpose Project, Central Engineering Consultancy
Bureau, July 1991 [9] Phase E Report-Master Plan for the Electricity Supply of Sri Lanka, July 1990 [10] Trincomalee Thermal Power Project, Black and Veatch International, August 1988 [11] Thermal Generation Options, Black and Veatch International, October 1988 [12] Thermal Generation Options Study, Final Report, Electrowatt Engineering Services Ltd., July
1996 [13] Special Assistance for Project Formulation (SAPROF) for Kelanitissa Combined Cycle Power
Plant Project in Sri Lanka, January 1996. [14] Review of Least Cost Generation Plan, Electrowatt Engineering, July 1997 [15] Coal Fired Thermal Development Project West Coast, April 1998 [16] The Feasibility Study on Combined Cycle Power Development Project at Kerawalapitiya, Jan
1999 [17] Sri Lanka Electric Power Technology Assessment Draft Report (Final), (July 2002) [18] Sri Lanka Natural Gas Options Study, USAID-SARI/Energy Program, Revised June 2003 [19] An assessment of the Small Hydro Potential in Sri Lanka, April 1999 [20] Wind Energy Resources in the Southern Lowlands of Sri Lanka, Ceylon Electricity Board, 1992 [21] A Study on Wind Resources Assessments, Puttlam and Central Regions of Sri Lanka, April 2002 [22] Assessment of Economic Impact of Poor Power Quality, USAID – SARI/E Programme, October 2002 [23] Sri Lanka Wind Farm Analysis and Site Selection Assistance, National Renewable Energy
Laboratory.
Revised Generation Expansion Plan – 2012 Page R-2
[24] Sri Lanka Energy Balance 2004, Energy Conservation Fund. [25] Note on Stability of Diesel Units on the Sri Lanka Power System, Economic Consulting Associates Ltd., April 2004. [26] Electricity Pricing: Conventional Views and New Concepts, Witold Teplitz-Sembitzky, The WorldBank, Washington, USA, March 1992. [27] Master Plan Study on the Development of Power Generation and Transmission System in Sri Lanka, February 2006. [28] Long Term Generation Expansion Plan 2011-2025, CEB April 2011. [29] Energy diversification enhancement by introducing Liquefied Natural Gas operated power
generation option in Sri Lanka. February 2010. [30] Second National Communication on Climate Change (Final Draft), October 2010. [31] Wind Resources in the Mannar Region, Renewable Energy Group, Sri Lanka Sustainable Energy
Authority, May 2011. [32] Renewable Energy Resource Development Plan 1/2012, Renewable Energy Group, Sri Lanka Sustainable Energy Authority.
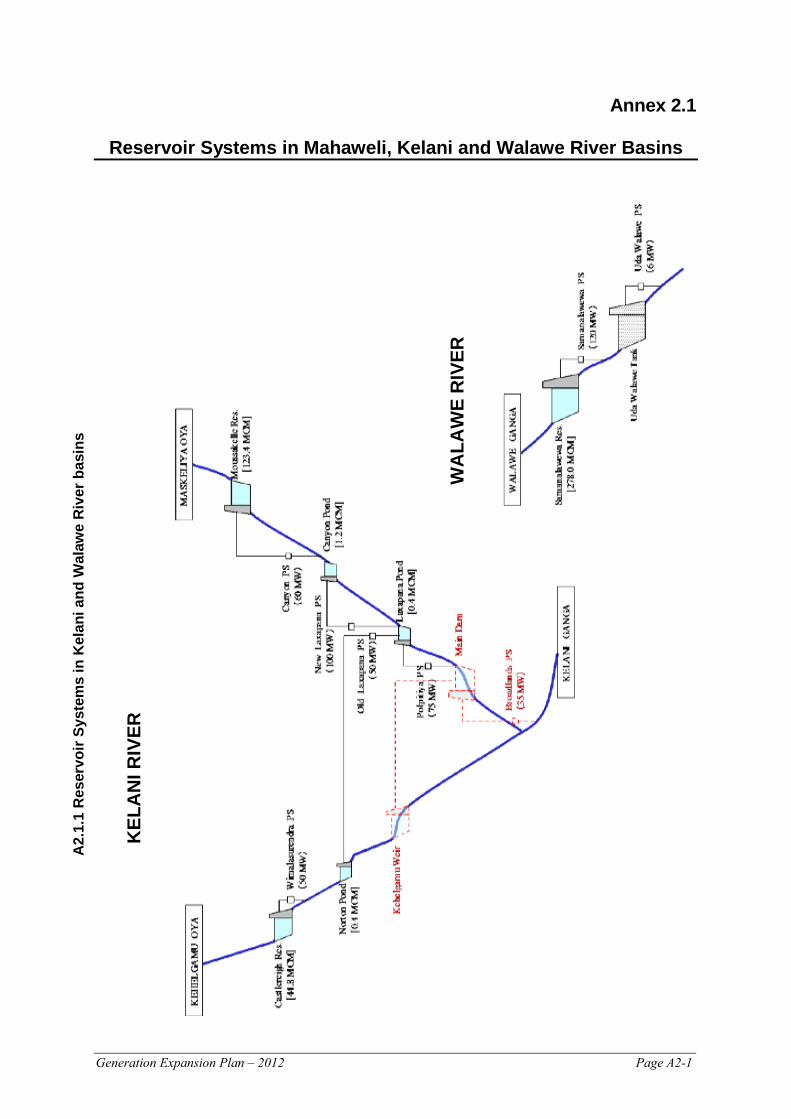
Generation Expansion Plan – 2012 Page A2-1
Annex 2.1
Reservoir Systems in Mahaweli, Kelani and Walawe River Basins
A2.
1.1
Res
ervo
ir Sy
stem
s in
Kel
ani a
nd W
alaw
e R
iver
bas
ins
KEL
AN
I RIV
ER
WA
LAW
E R
IVER
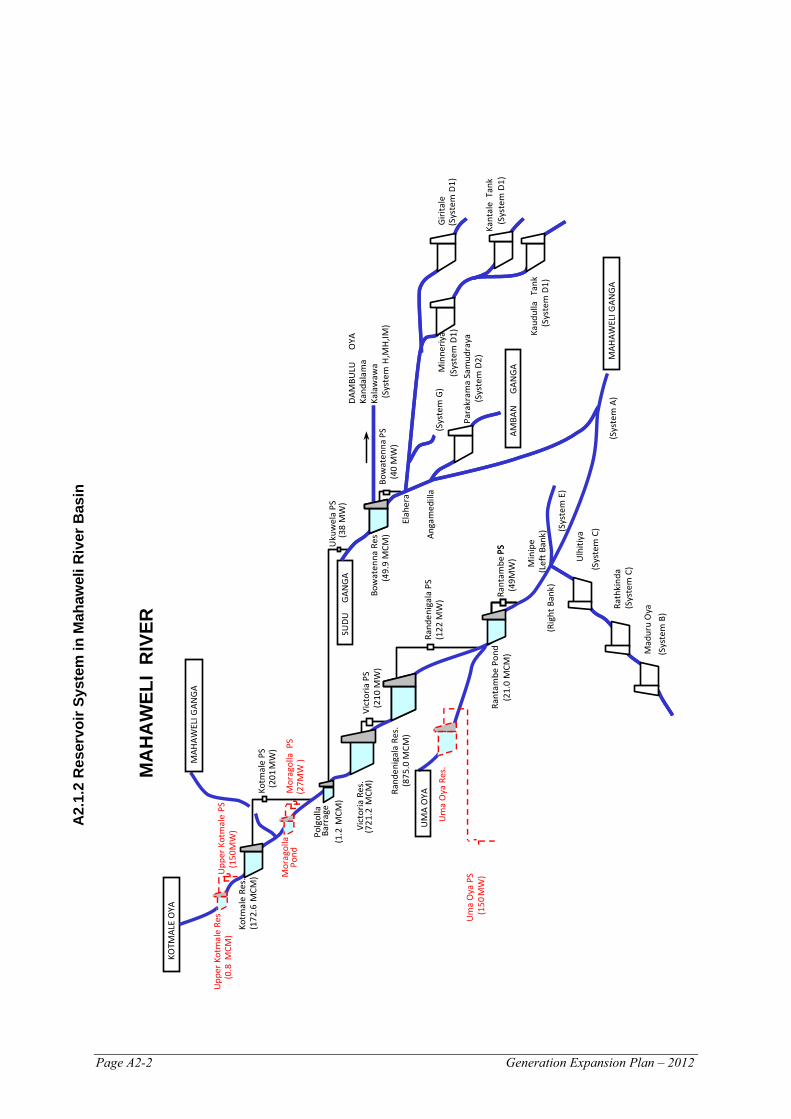
Page A2-2 Generation Expansion Plan – 2012
Upp
er Ko
tmal
e PS
(1
50 MW
)
Kotm
ale
PS
(201
MW)
Mor
agol
la P
S
Uku
wel
a PS
(38
MW
)
Bow
aten
na PS
(4
0 MW
)
KOTM
ALE
OYA
M
AHAW
ELI G
ANG
A
UM
A O
YA
Rant
ambe
PS
(49
MW)
Rand
enig
ala
PS
(122
MW
)
Vict
oria
PS
(210
MW
)
Upp
er Ko
tmal
e Re
s
(0.8
MCM
) Kotm
ale
Res.
(172
.6 M
CM) M
orag
olla
Po
nd
Polg
olla
Ba
rrag
e (1
.2 M
CM)
Vict
oria
Res
. (7
21.2
MCM
)
Rant
ambe
Pon
d
(21.
0 M
CM)
Rand
enig
ala
Res.
(875
.0 M
CM)
Bow
aten
na R
es
(49.
9 MC
M)
SUDU
GAN
GA
MAH
AWEL
I GAN
GA
AMBA
N
GAN
GA
DAM
BULU
OYA
Ka
ndal
ama
Kala
waw
a (S
yste
m H,M
H,IM
)
Giri
tale
(S
yste
m D
1)
Para
kram
a Sa
mud
raya
(S
yste
m D
2)
Ulh
itiya
Rath
kind
a
Mad
uru
Oya
Kaud
ulla
Tan
k (S
yste
m D
1)
Kant
ale
Tank
(S
yste
m D
1)
Min
neriy
a (S
yste
m D
1)
(Sys
tem
G)
(Sys
tem
A)
(Sys
tem
E)
Min
ipe
(Lef
t Ban
k)
(27M
W )
Um
a O
ya P
S
(150
MW
) PS
Um
a O
ya R
es.
(Sys
tem
C)
(Sys
tem
C)
(Sys
tem
B)
(Rig
ht B
ank)
Elah
era
Anga
med
illa
A2.
1.2
Res
ervo
ir Sy
stem
in M
ahaw
eli R
iver
Bas
in
MA
HA
WEL
I R
IVER
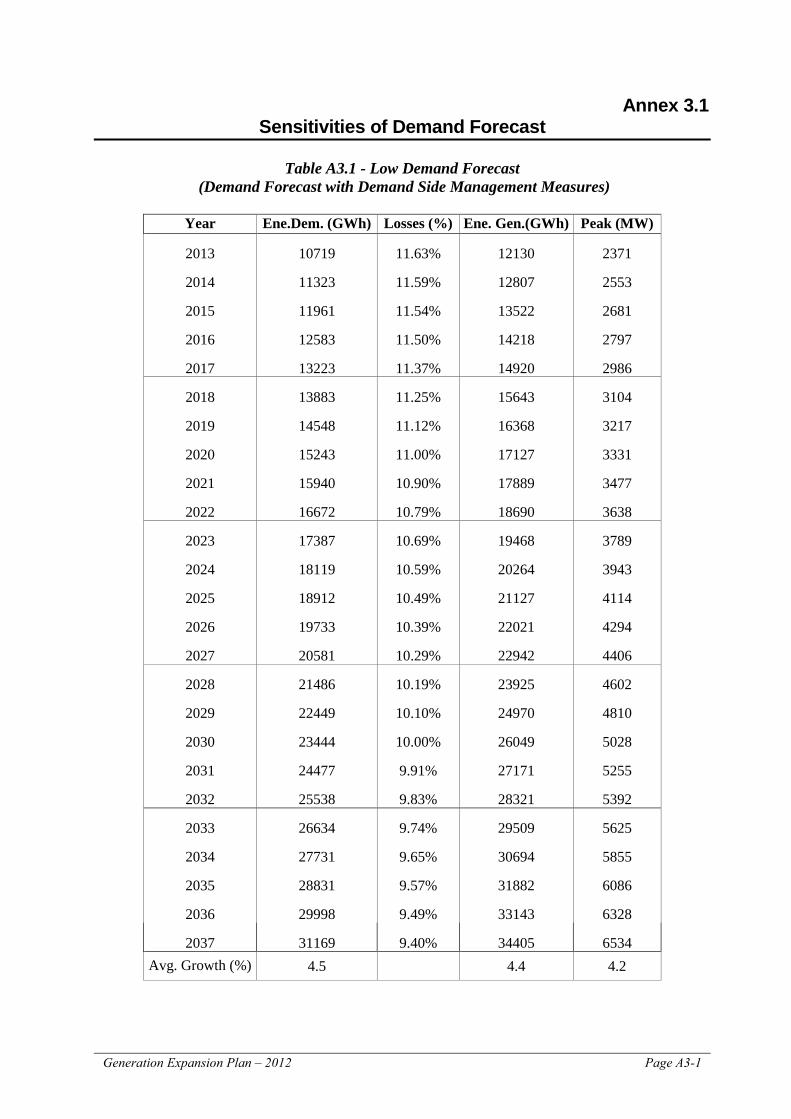
Generation Expansion Plan – 2012 Page A3-1
Annex 3.1 Sensitivities of Demand Forecast
Table A3.1 - Low Demand Forecast
(Demand Forecast with Demand Side Management Measures)
Year Ene.Dem. (GWh)
Losses (%) Ene. Gen.(GWh) Peak (MW) 2013 10719 11.63% 12130 2371
2014 11323 11.59% 12807 2553
2015 11961 11.54% 13522 2681
2016 12583 11.50% 14218 2797
2017 13223 11.37% 14920 2986
2018 13883 11.25% 15643 3104
2019 14548 11.12% 16368 3217
2020 15243 11.00% 17127 3331
2021 15940 10.90% 17889 3477
2022 16672 10.79% 18690 3638
2023 17387 10.69% 19468 3789
2024 18119 10.59% 20264 3943
2025 18912 10.49% 21127 4114
2026 19733 10.39% 22021 4294
2027 20581 10.29% 22942 4406
2028 21486 10.19% 23925 4602
2029 22449 10.10% 24970 4810
2030 23444 10.00% 26049 5028
2031 24477 9.91% 27171 5255
2032 25538 9.83% 28321 5392
2033 26634 9.74% 29509 5625
2034 27731 9.65% 30694 5855
2035 28831 9.57% 31882 6086
2036 29998 9.49% 33143 6328
2037 31169 9.40% 34405 6534 Avg. Growth (%) 4.5 4.4 4.2
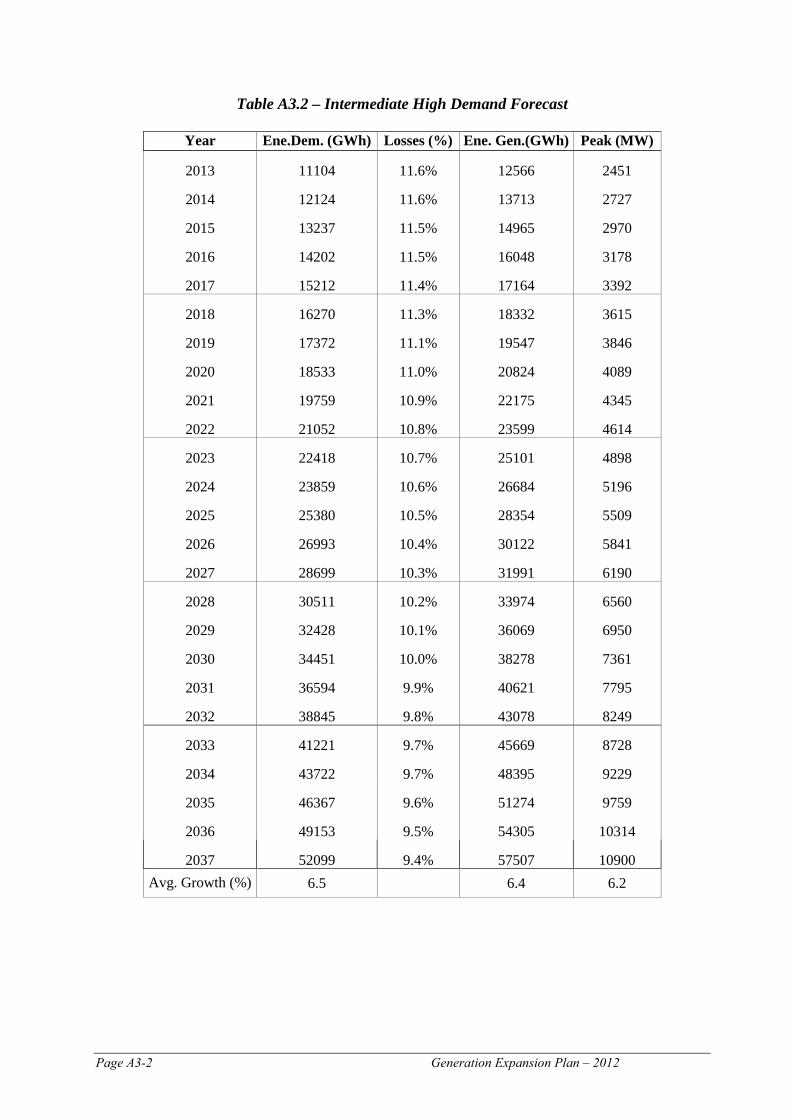
Page A3-2 Generation Expansion Plan – 2012
Table A3.2 – Intermediate High Demand Forecast
Year Ene.Dem. (GWh)
Losses (%) Ene. Gen.(GWh) Peak (MW) 2013 11104 11.6% 12566 2451
2014 12124 11.6% 13713 2727
2015 13237 11.5% 14965 2970
2016 14202 11.5% 16048 3178
2017 15212 11.4% 17164 3392
2018 16270 11.3% 18332 3615
2019 17372 11.1% 19547 3846
2020 18533 11.0% 20824 4089
2021 19759 10.9% 22175 4345
2022 21052 10.8% 23599 4614
2023 22418 10.7% 25101 4898
2024 23859 10.6% 26684 5196
2025 25380 10.5% 28354 5509
2026 26993 10.4% 30122 5841
2027 28699 10.3% 31991 6190
2028 30511 10.2% 33974 6560
2029 32428 10.1% 36069 6950
2030 34451 10.0% 38278 7361
2031 36594 9.9% 40621 7795
2032 38845 9.8% 43078 8249
2033 41221 9.7% 45669 8728
2034 43722 9.7% 48395 9229
2035 46367 9.6% 51274 9759
2036 49153 9.5% 54305 10314
2037 52099 9.4% 57507 10900 Avg. Growth (%) 6.5 6.4 6.2
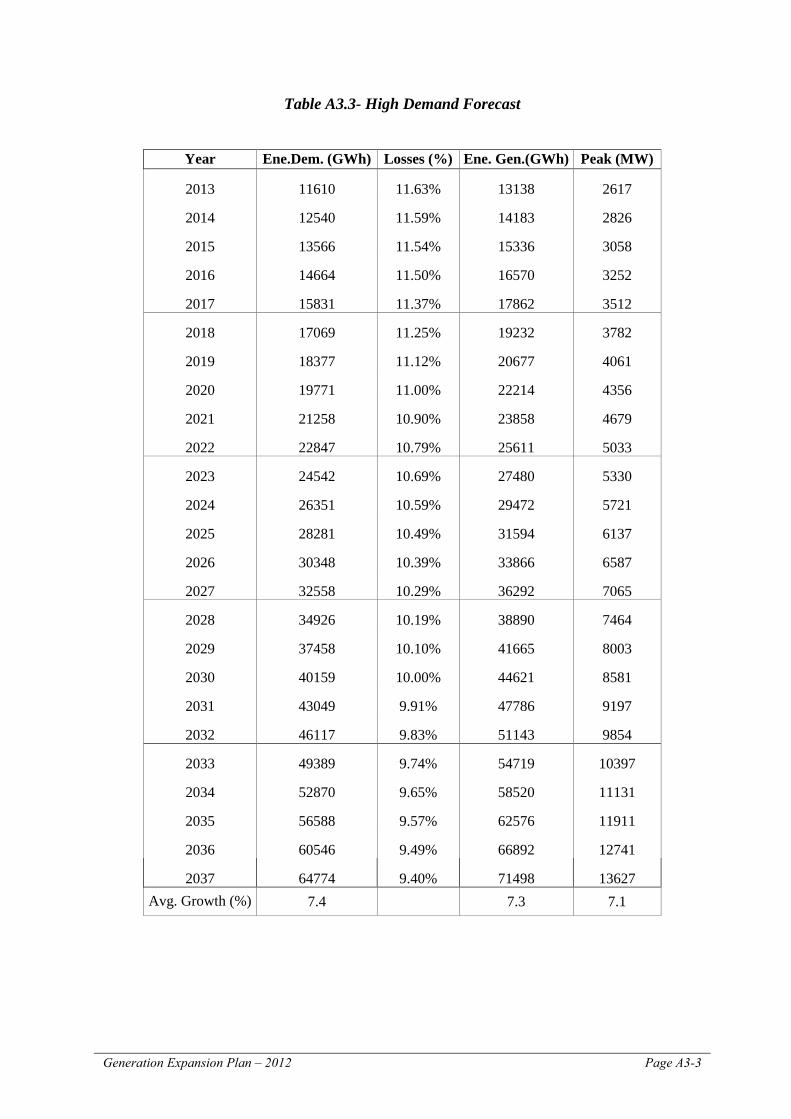
Generation Expansion Plan – 2012 Page A3-3
Table A3.3- High Demand Forecast
Year Ene.Dem. (GWh)
Losses (%) Ene. Gen.(GWh) Peak (MW) 2013 11610 11.63% 13138 2617
2014 12540 11.59% 14183 2826
2015 13566 11.54% 15336 3058
2016 14664 11.50% 16570 3252
2017 15831 11.37% 17862 3512
2018 17069 11.25% 19232 3782
2019 18377 11.12% 20677 4061
2020 19771 11.00% 22214 4356
2021 21258 10.90% 23858 4679
2022 22847 10.79% 25611 5033
2023 24542 10.69% 27480 5330
2024 26351 10.59% 29472 5721
2025 28281 10.49% 31594 6137
2026 30348 10.39% 33866 6587
2027 32558 10.29% 36292 7065
2028 34926 10.19% 38890 7464
2029 37458 10.10% 41665 8003
2030 40159 10.00% 44621 8581
2031 43049 9.91% 47786 9197
2032 46117 9.83% 51143 9854
2033 49389 9.74% 54719 10397
2034 52870 9.65% 58520 11131
2035 56588 9.57% 62576 11911
2036 60546 9.49% 66892 12741
2037 64774 9.40% 71498 13627 Avg. Growth (%) 7.4 7.3 7.1
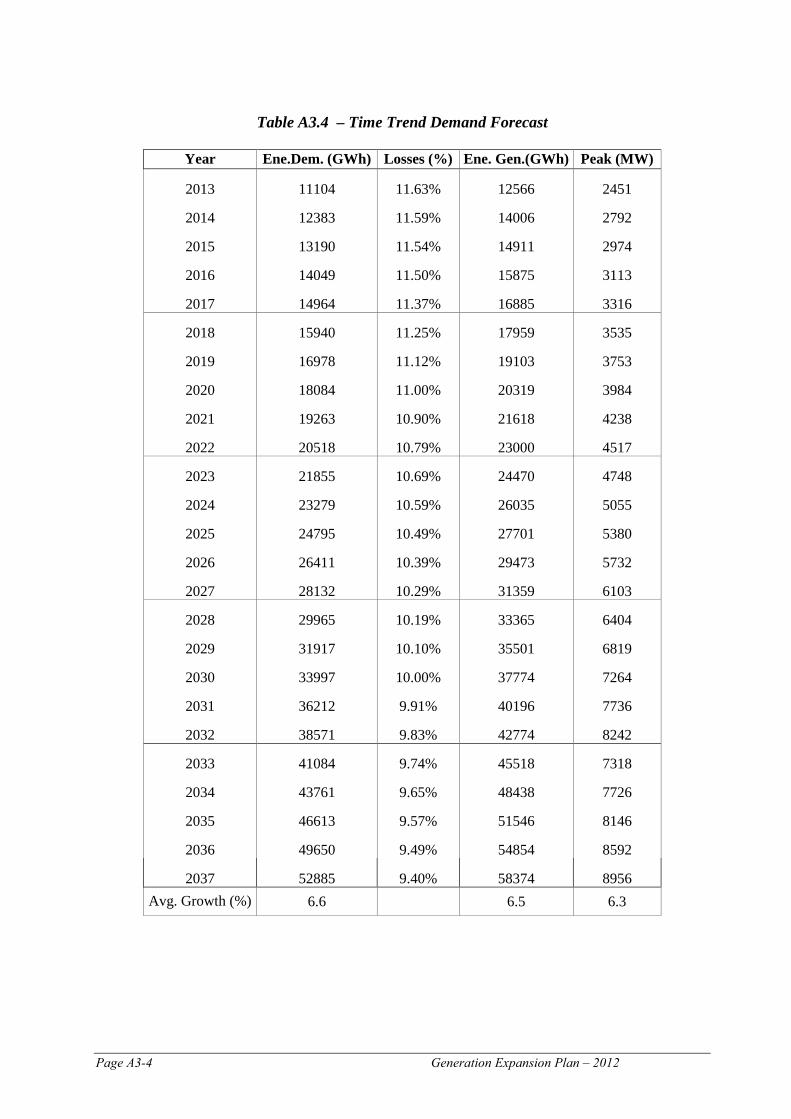
Page A3-4 Generation Expansion Plan – 2012
Table A3.4 – Time Trend Demand Forecast
Year Ene.Dem. (GWh)
Losses (%) Ene. Gen.(GWh) Peak (MW)
2013 11104 11.63% 12566 2451
2014 12383 11.59% 14006 2792
2015 13190 11.54% 14911 2974
2016 14049 11.50% 15875 3113
2017 14964 11.37% 16885 3316
2018 15940 11.25% 17959 3535
2019 16978 11.12% 19103 3753
2020 18084 11.00% 20319 3984
2021 19263 10.90% 21618 4238
2022 20518 10.79% 23000 4517
2023 21855 10.69% 24470 4748
2024 23279 10.59% 26035 5055
2025 24795 10.49% 27701 5380
2026 26411 10.39% 29473 5732
2027 28132 10.29% 31359 6103
2028 29965 10.19% 33365 6404
2029 31917 10.10% 35501 6819
2030 33997 10.00% 37774 7264
2031 36212 9.91% 40196 7736
2032 38571 9.83% 42774 8242
2033 41084 9.74% 45518 7318
2034 43761 9.65% 48438 7726
2035 46613 9.57% 51546 8146
2036 49650 9.49% 54854 8592
2037 52885 9.40% 58374 8956 Avg. Growth (%) 6.6 6.5 6.3
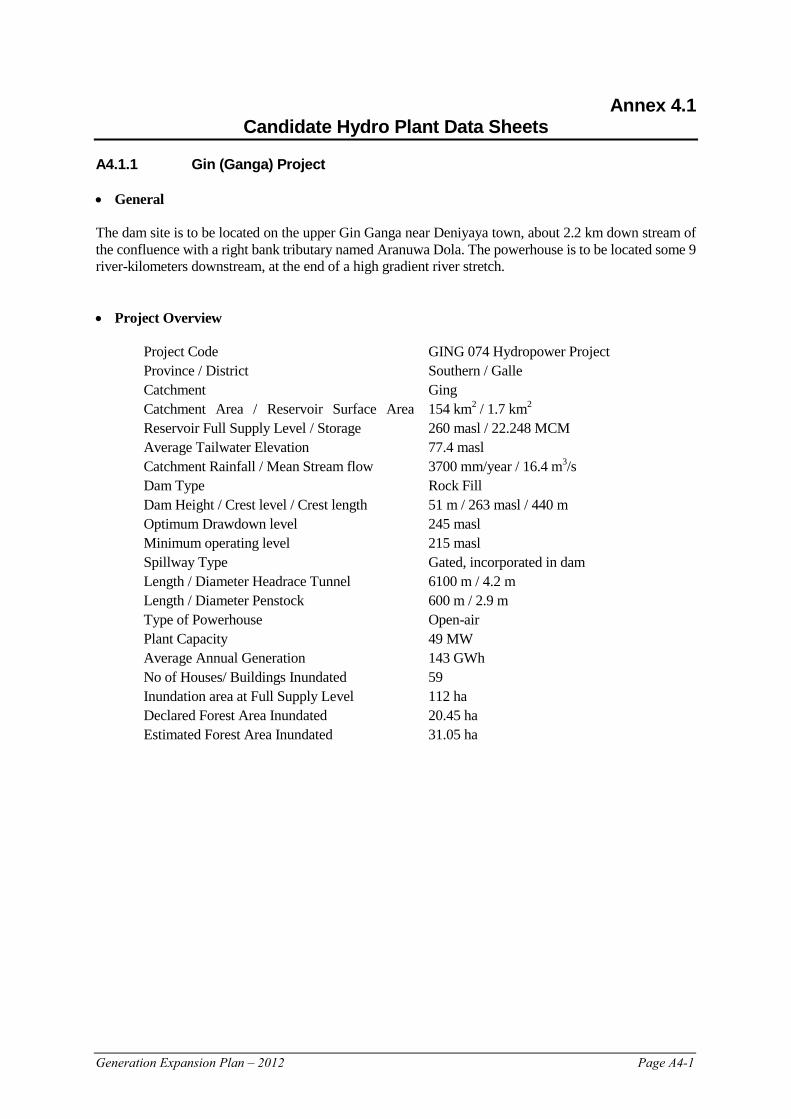
Generation Expansion Plan – 2012 Page A4-1
Annex 4.1 Candidate Hydro Plant Data Sheets
A4.1.1 Gin (Ganga) Project • General The dam site is to be located on the upper Gin Ganga near Deniyaya town, about 2.2 km down stream of the confluence with a right bank tributary named Aranuwa Dola. The powerhouse is to be located some 9 river-kilometers downstream, at the end of a high gradient river stretch. • Project Overview
Project Code GING 074 Hydropower Project Province / District Southern / Galle Catchment Ging Catchment Area / Reservoir Surface Area
154 km2 / 1.7 km2 Reservoir Full Supply Level / Storage 260 masl / 22.248 MCM Average Tailwater Elevation 77.4 masl Catchment Rainfall / Mean Stream flow 3700 mm/year / 16.4 m3/s Dam Type Rock Fill Dam Height / Crest level / Crest length 51 m / 263 masl / 440 m Optimum Drawdown level 245 masl Minimum operating level 215 masl Spillway Type Gated, incorporated in dam Length / Diameter Headrace Tunnel 6100 m / 4.2 m Length / Diameter Penstock 600 m / 2.9 m Type of Powerhouse Open-air Plant Capacity 49 MW Average Annual Generation 143 GWh No of Houses/ Buildings Inundated 59 Inundation area at Full Supply Level 112 ha Declared Forest Area Inundated 20.45 ha Estimated Forest Area Inundated 31.05 ha
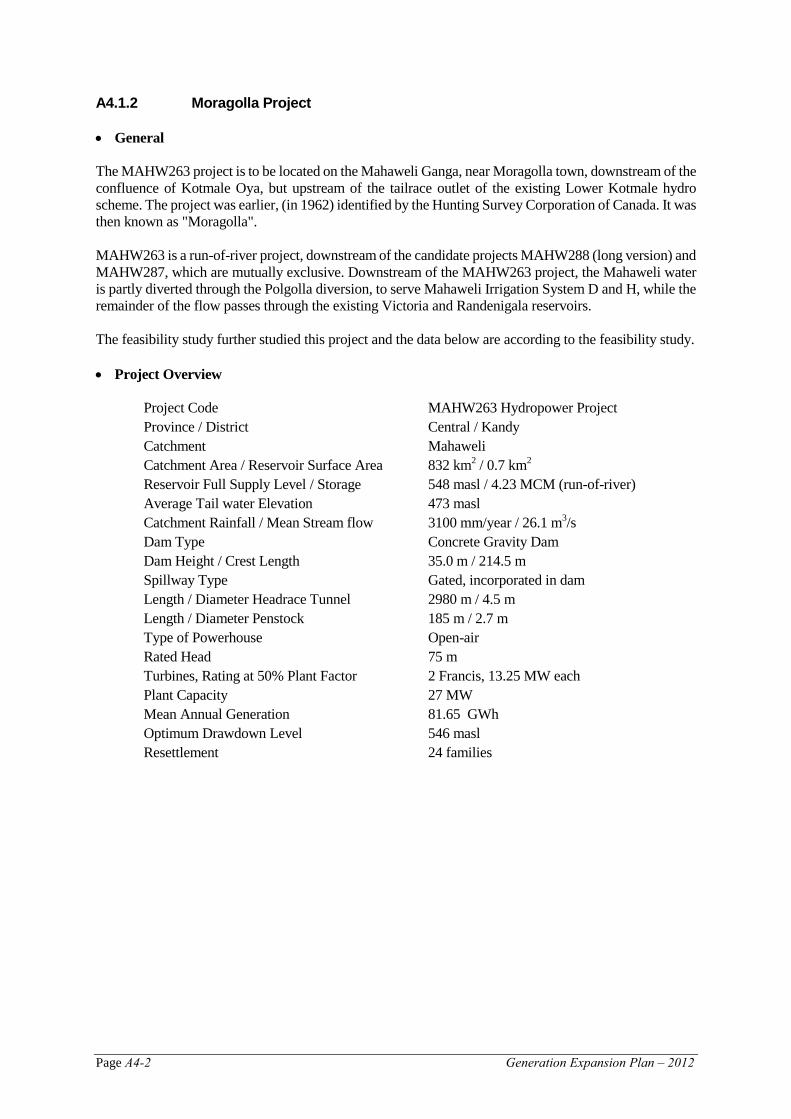
Page A4-2 Generation Expansion Plan – 2012
A4.1.2 Moragolla Project • General The MAHW263 project is to be located on the Mahaweli Ganga, near Moragolla town, downstream of the confluence of Kotmale Oya, but upstream of the tailrace outlet of the existing Lower Kotmale hydro scheme. The project was earlier, (in 1962) identified by the Hunting Survey Corporation of Canada. It was then known as "Moragolla". MAHW263 is a run-of-river project, downstream of the candidate projects MAHW288 (long version) and MAHW287, which are mutually exclusive. Downstream of the MAHW263 project, the Mahaweli water is partly diverted through the Polgolla diversion, to serve Mahaweli Irrigation System D and H, while the remainder of the flow passes through the existing Victoria and Randenigala reservoirs. The feasibility study further studied this project and the data below are according to the feasibility study. • Project Overview
Project Code MAHW263 Hydropower Project Province / District Central / Kandy Catchment Mahaweli Catchment Area / Reservoir Surface Area 832 km2 / 0.7 km2 Reservoir Full Supply Level / Storage 548 masl / 4.23 MCM (run-of-river) Average Tail water Elevation 473 masl Catchment Rainfall / Mean Stream flow 3100 mm/year / 26.1 m3/s Dam Type Concrete Gravity Dam Dam Height / Crest Length 35.0 m / 214.5 m Spillway Type Gated, incorporated in dam Length / Diameter Headrace Tunnel 2980 m / 4.5 m Length / Diameter Penstock 185 m / 2.7 m Type of Powerhouse Open-air Rated Head 75 m Turbines, Rating at 50% Plant Factor 2 Francis, 13.25 MW each Plant Capacity 27 MW Mean Annual Generation 81.65 GWh Optimum Drawdown Level 546 masl Resettlement 24 families
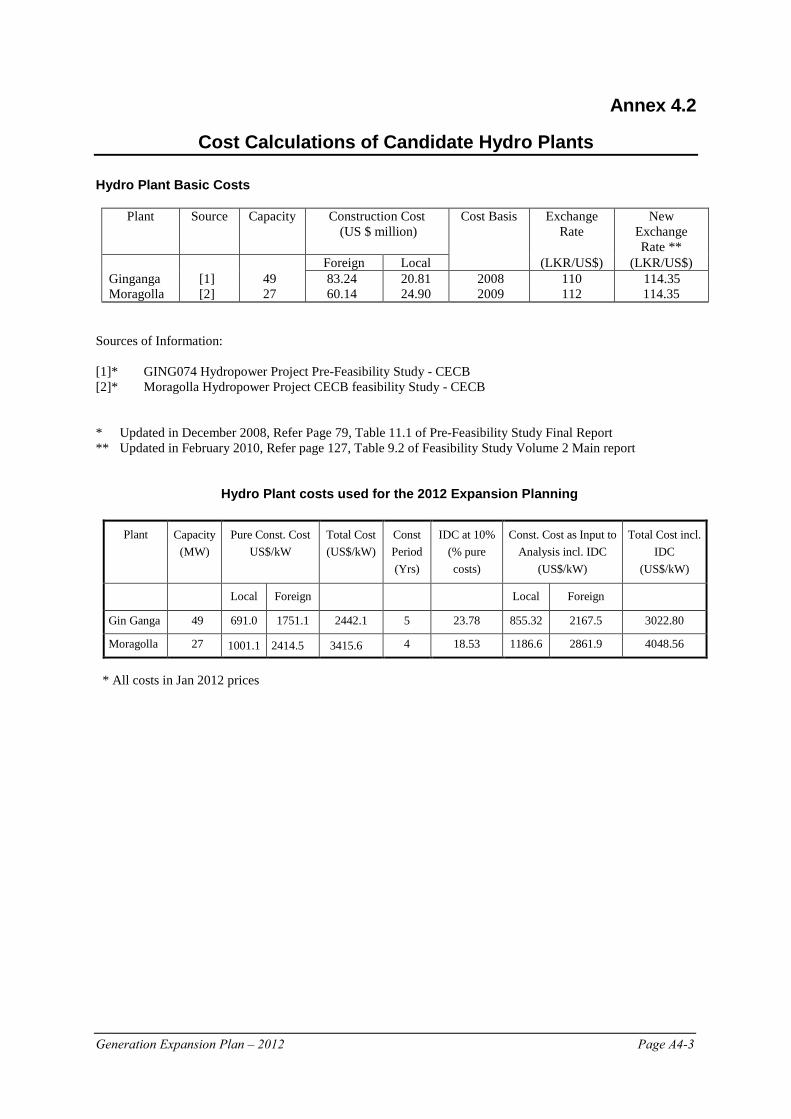
Generation Expansion Plan – 2012 Page A4-3
Annex 4.2
Cost Calculations of Candidate Hydro Plants
Hydro Plant Basic Costs
Plant Source Capacity Construction Cost (US $ million)
Cost Basis Exchange Rate
New Exchange Rate **
Foreign Local (LKR/US$) (LKR/US$) Ginganga [1] 49 83.24 20.81 2008 110 114.35 Moragolla [2] 27 60.14 24.90 2009 112 114.35
Sources of Information: [1]* GING074 Hydropower Project Pre-Feasibility Study - CECB [2]* Moragolla Hydropower Project CECB feasibility Study - CECB * Updated in December 2008, Refer Page 79, Table 11.1 of Pre-Feasibility Study Final Report ** Updated in February 2010, Refer page 127, Table 9.2 of Feasibility Study Volume 2 Main report
Hydro Plant costs used for the 2012 Expansion Planning
Plant Capacity (MW)
Pure Const. Cost US$/kW
Total Cost (US$/kW)
Const Period (Yrs)
IDC at 10% (% pure costs)
Const. Cost as Input to Analysis incl. IDC
(US$/kW)
Total Cost incl. IDC
(US$/kW)
Local Foreign Local Foreign
Gin Ganga 49 691.0 1751.1 2442.1 5 23.78 855.32 2167.5 3022.80
Moragolla 27 1001.1 2414.5 3415.6 4 18.53 1186.6 2861.9 4048.56
* All costs in Jan 2012 prices
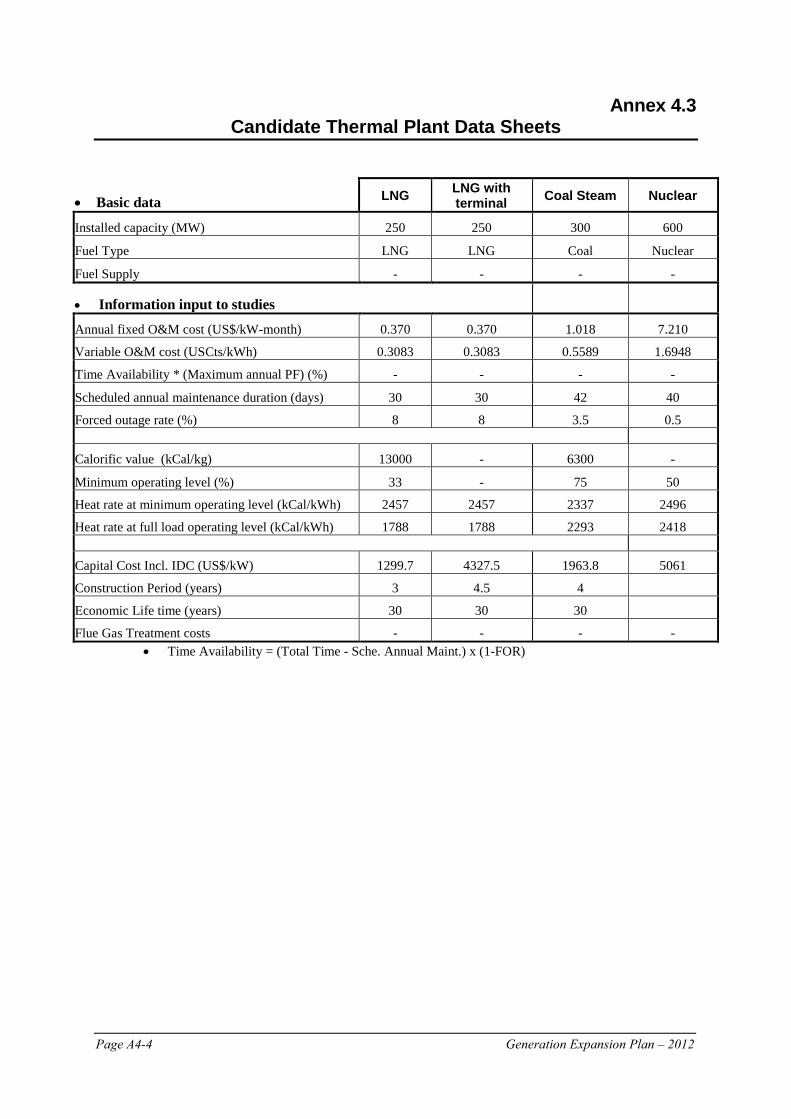
Page A4-4 Generation Expansion Plan – 2012
Annex 4.3 Candidate Thermal Plant Data Sheets
• Basic data LNG LNG with terminal Coal Steam Nuclear
Installed capacity (MW) 250 250 300 600
Fuel Type LNG LNG Coal Nuclear
Fuel Supply - - - -
• Information input to studies
Annual fixed O&M cost (US$/kW-month) 0.370 0.370 1.018 7.210
Variable O&M cost (USCts/kWh) 0.3083 0.3083 0.5589 1.6948
Time Availability * (Maximum annual PF) (%) - - - -
Scheduled annual maintenance duration (days) 30 30 42 40
Forced outage rate (%) 8 8 3.5 0.5
Calorific value (kCal/kg) 13000 - 6300 -
Minimum operating level (%) 33 - 75 50
Heat rate at minimum operating level (kCal/kWh) 2457 2457 2337 2496
Heat rate at full load operating level (kCal/kWh) 1788 1788 2293 2418
Capital Cost Incl. IDC (US$/kW) 1299.7 4327.5 1963.8 5061
Construction Period (years) 3 4.5 4
Economic Life time (years) 30 30 30
Flue Gas Treatment costs - - - - • Time Availability = (Total Time - Sche. Annual Maint.) x (1-FOR)
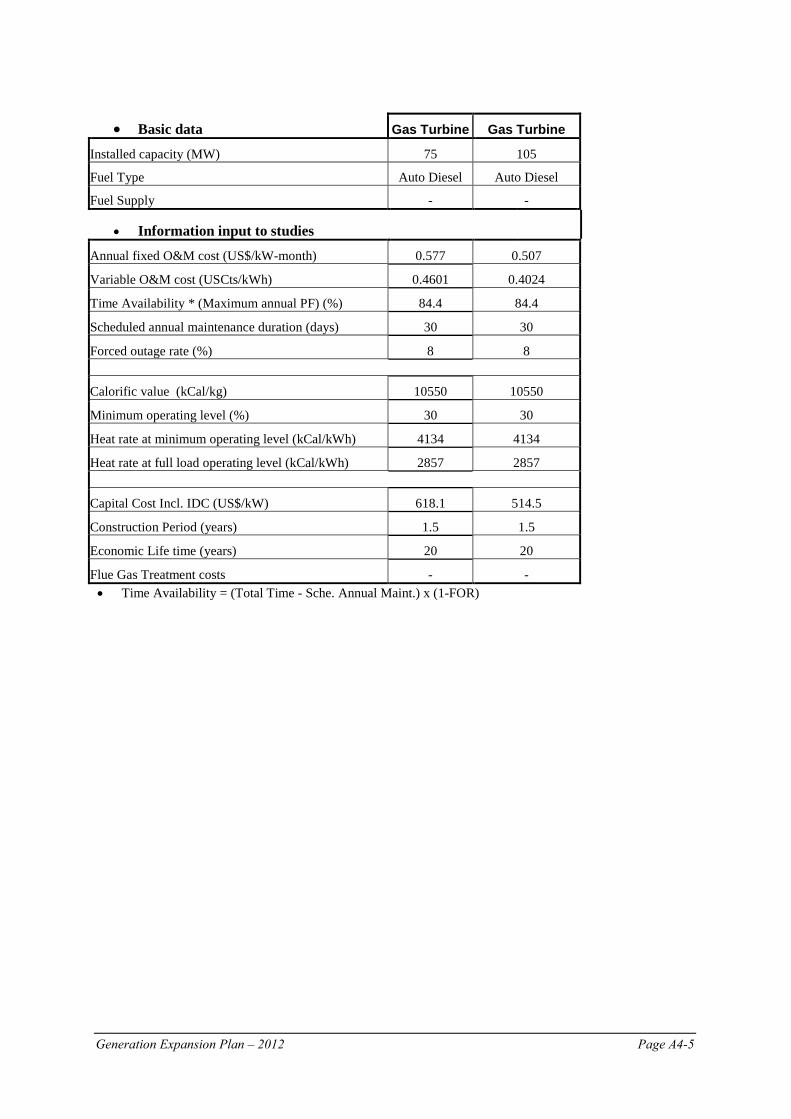
Generation Expansion Plan – 2012 Page A4-5
• Basic data Gas Turbine Gas Turbine
Installed capacity (MW) 75 105
Fuel Type Auto Diesel Auto Diesel
Fuel Supply - -
• Information input to studies
Annual fixed O&M cost (US$/kW-month) 0.577 0.507
Variable O&M cost (USCts/kWh) 0.4601 0.4024
Time Availability * (Maximum annual PF) (%) 84.4 84.4
Scheduled annual maintenance duration (days) 30 30
Forced outage rate (%) 8 8
Calorific value (kCal/kg) 10550 10550
Minimum operating level (%) 30 30
Heat rate at minimum operating level (kCal/kWh) 4134 4134
Heat rate at full load operating level (kCal/kWh) 2857 2857
Capital Cost Incl. IDC (US$/kW) 618.1 514.5
Construction Period (years) 1.5 1.5
Economic Life time (years) 20 20
Flue Gas Treatment costs - - • Time Availability = (Total Time - Sche. Annual Maint.) x (1-FOR)
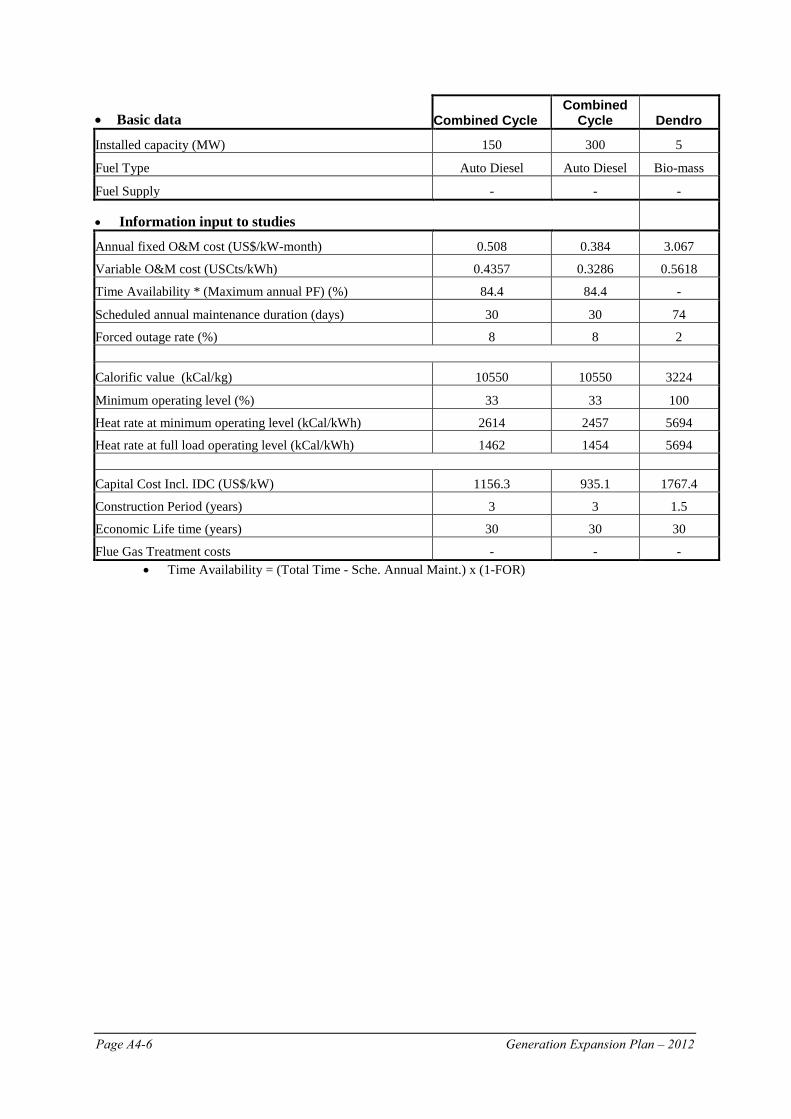
Page A4-6 Generation Expansion Plan – 2012
• Basic data Combined Cycle Combined
Cycle Dendro
Installed capacity (MW) 150 300 5
Fuel Type Auto Diesel Auto Diesel Bio-mass
Fuel Supply - - -
• Information input to studies
Annual fixed O&M cost (US$/kW-month) 0.508 0.384 3.067
Variable O&M cost (USCts/kWh) 0.4357 0.3286 0.5618
Time Availability * (Maximum annual PF) (%) 84.4 84.4 -
Scheduled annual maintenance duration (days) 30 30 74
Forced outage rate (%) 8 8 2
Calorific value (kCal/kg) 10550 10550 3224
Minimum operating level (%) 33 33 100
Heat rate at minimum operating level (kCal/kWh) 2614 2457 5694
Heat rate at full load operating level (kCal/kWh) 1462 1454 5694
Capital Cost Incl. IDC (US$/kW) 1156.3 935.1 1767.4
Construction Period (years) 3 3 1.5
Economic Life time (years) 30 30 30
Flue Gas Treatment costs - - - • Time Availability = (Total Time - Sche. Annual Maint.) x (1-FOR)
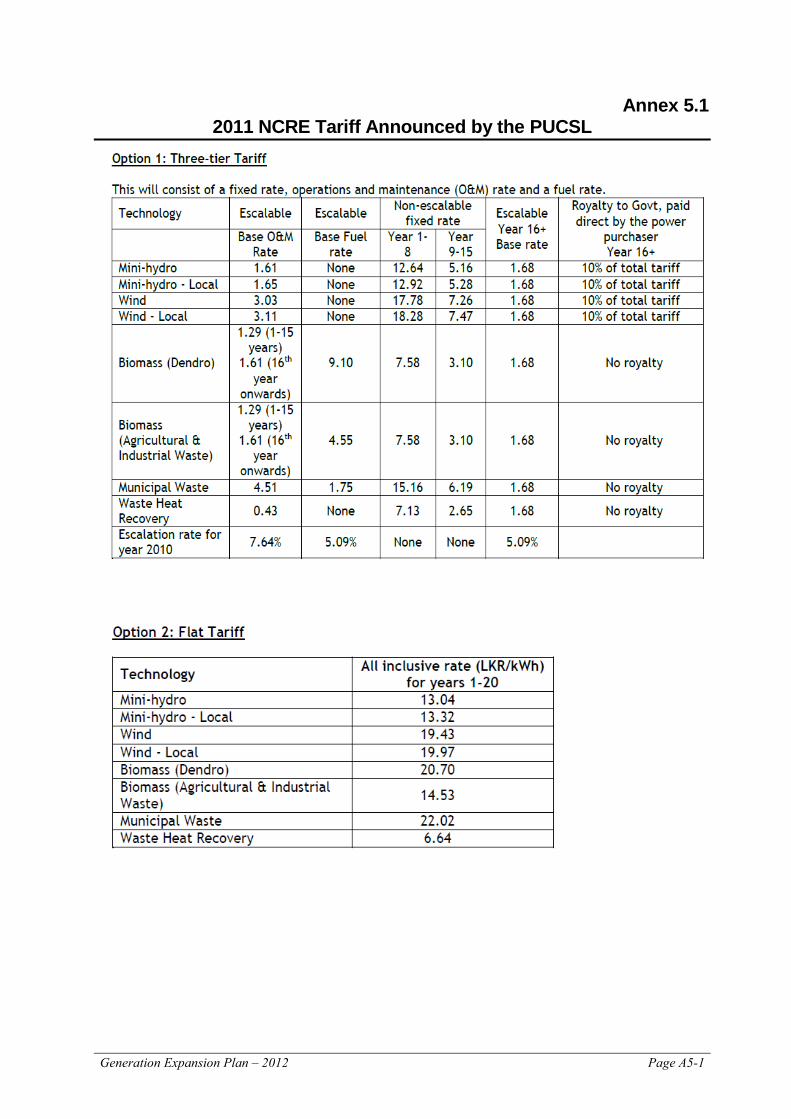
Generation Expansion Plan – 2012 Page A5-1
Annex 5.1 2011 NCRE Tariff Announced by the PUCSL
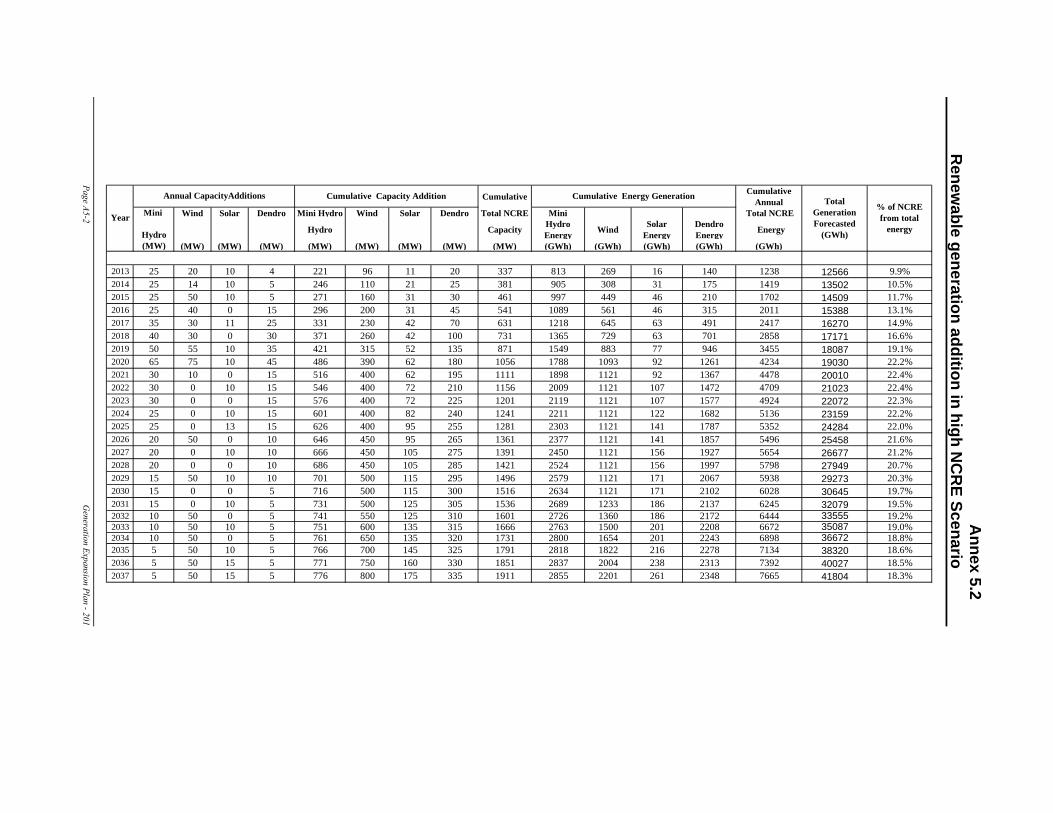
Cumulative Cumulative Annual
Mini Wind Solar Dendro Mini Hydro Wind Solar Dendro Total NCRE Mini Total NCRE
Hydro Hydro Capacity Hydro Energy Wind Solar
Energy Dendro Energy Energy
(MW) (MW) (MW) (MW) (MW) (MW) (MW) (MW) (MW) (GWh) (GWh) (GWh) (GWh) (GWh)
2013 25 20 10 4 221 96 11 20 337 813 269 16 140 1238 12566 9.9%2014 25 14 10 5 246 110 21 25 381 905 308 31 175 1419 13502 10.5%2015 25 50 10 5 271 160 31 30 461 997 449 46 210 1702 14509 11.7%2016 25 40 0 15 296 200 31 45 541 1089 561 46 315 2011 15388 13.1%2017 35 30 11 25 331 230 42 70 631 1218 645 63 491 2417 16270 14.9%2018 40 30 0 30 371 260 42 100 731 1365 729 63 701 2858 17171 16.6%2019 50 55 10 35 421 315 52 135 871 1549 883 77 946 3455 18087 19.1%2020 65 75 10 45 486 390 62 180 1056 1788 1093 92 1261 4234 19030 22.2%2021 30 10 0 15 516 400 62 195 1111 1898 1121 92 1367 4478 20010 22.4%2022 30 0 10 15 546 400 72 210 1156 2009 1121 107 1472 4709 21023 22.4%2023 30 0 0 15 576 400 72 225 1201 2119 1121 107 1577 4924 22072 22.3%2024 25 0 10 15 601 400 82 240 1241 2211 1121 122 1682 5136 23159 22.2%2025 25 0 13 15 626 400 95 255 1281 2303 1121 141 1787 5352 24284 22.0%2026 20 50 0 10 646 450 95 265 1361 2377 1121 141 1857 5496 25458 21.6%2027 20 0 10 10 666 450 105 275 1391 2450 1121 156 1927 5654 26677 21.2%2028 20 0 0 10 686 450 105 285 1421 2524 1121 156 1997 5798 27949 20.7%2029 15 50 10 10 701 500 115 295 1496 2579 1121 171 2067 5938 29273 20.3%2030 15 0 0 5 716 500 115 300 1516 2634 1121 171 2102 6028 30645 19.7%2031 15 0 10 5 731 500 125 305 1536 2689 1233 186 2137 6245 32079 19.5%2032 10 50 0 5 741 550 125 310 1601 2726 1360 186 2172 6444 33555 19.2%2033 10 50 10 5 751 600 135 315 1666 2763 1500 201 2208 6672 35087 19.0%2034 10 50 0 5 761 650 135 320 1731 2800 1654 201 2243 6898 36672 18.8%2035 5 50 10 5 766 700 145 325 1791 2818 1822 216 2278 7134 38320 18.6%2036 5 50 15 5 771 750 160 330 1851 2837 2004 238 2313 7392 40027 18.5%2037 5 50 15 5 776 800 175 335 1911 2855 2201 261 2348 7665 41804 18.3%
Annex 5.2
Page A5-2 Generation Expansion Plan - 2012
Renew
able generation addition in high NC
RE Scenario
Year
Total Generation Forecasted
(GWh)
% of NCRE from total
energy
Annual CapacityAdditions Cumulative Capacity Addition Cumulative Energy Generation
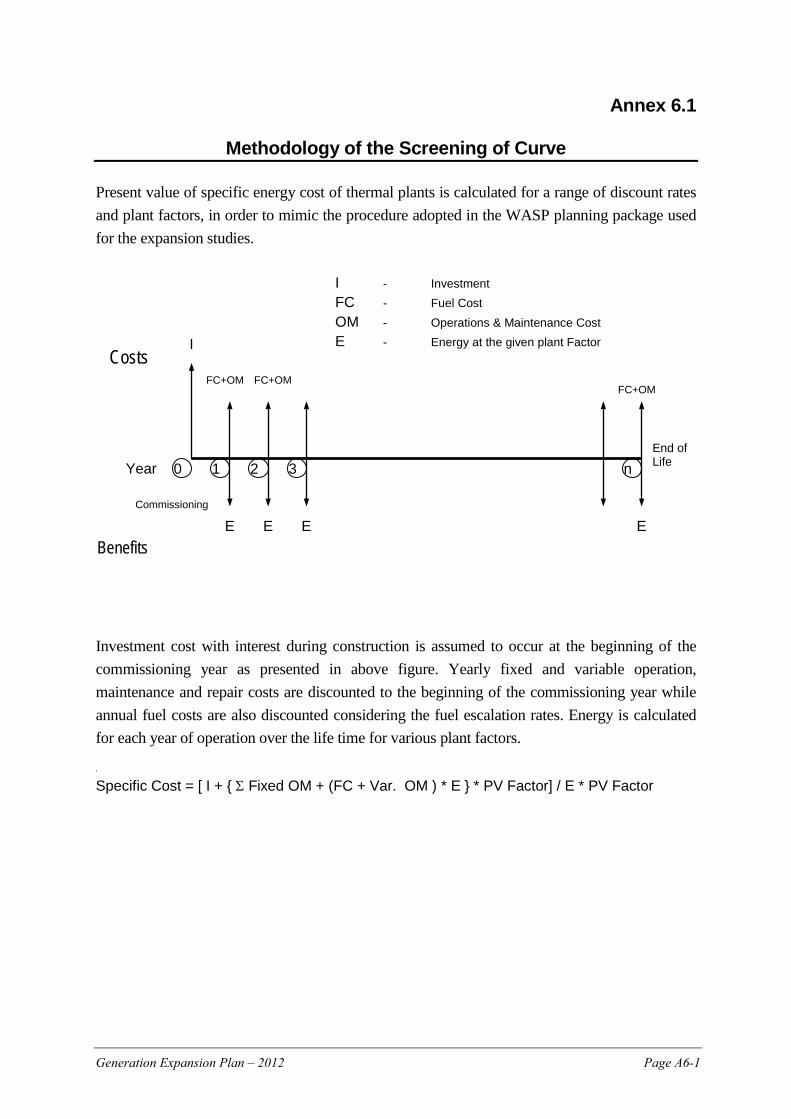
Generation Expansion Plan – 2012 Page A6-1
Annex 6.1
Methodology of the Screening of Curve Present value of specific energy cost of thermal plants is calculated for a range of discount rates and plant factors, in order to mimic the procedure adopted in the WASP planning package used for the expansion studies.
I - Investment FC - Fuel Cost OM - Operations & Maintenance Cost E - Energy at the given plant Factor
Investment cost with interest during construction is assumed to occur at the beginning of the commissioning year as presented in above figure. Yearly fixed and variable operation, maintenance and repair costs are discounted to the beginning of the commissioning year while annual fuel costs are also discounted considering the fuel escalation rates. Energy is calculated for each year of operation over the life time for various plant factors. ‘
Specific Cost = [ I + { Σ Fixed OM + (FC + Var. OM ) * E } * PV Factor] / E * PV Factor
I
FC+OM FC+OM FC+OM
E E E E
Year End of Life 2 1 3 n 0
Commissioning
Costs
Benefits
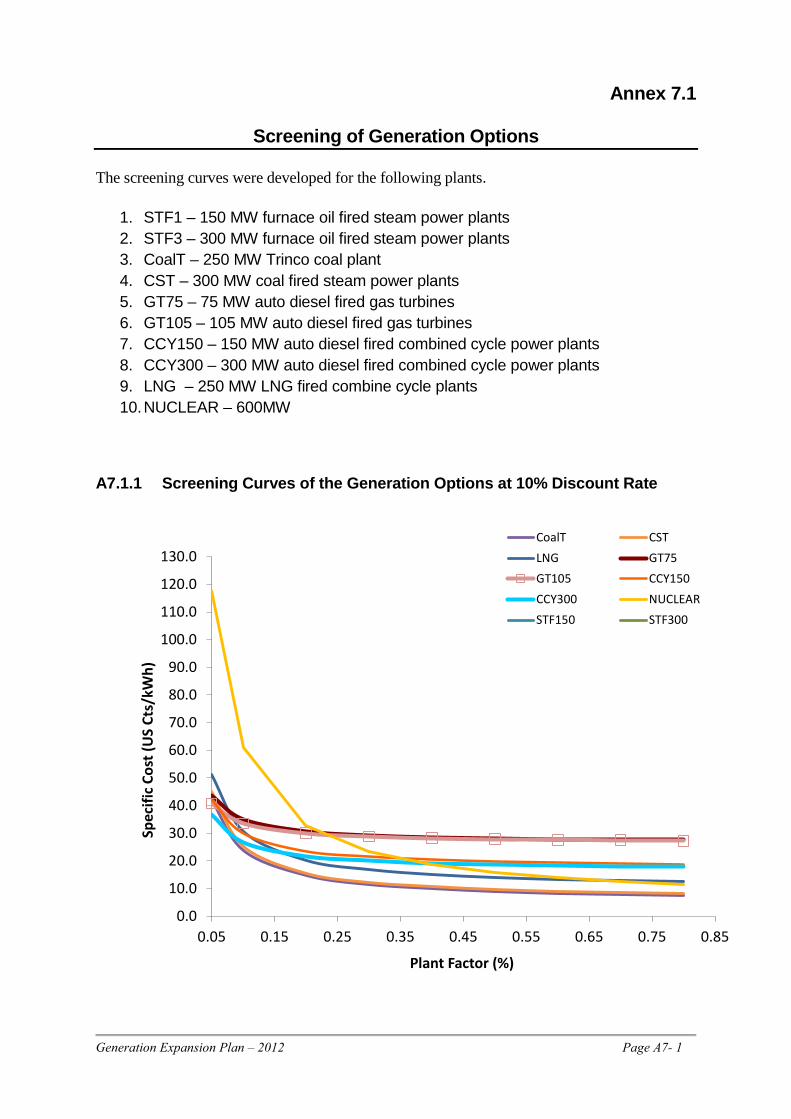
Generation Expansion Plan – 2012 Page A7- 1
Annex 7.1
Screening of Generation Options The screening curves were developed for the following plants.
1. STF1 – 150 MW furnace oil fired steam power plants 2. STF3 – 300 MW furnace oil fired steam power plants 3. CoalT – 250 MW Trinco coal plant 4. CST – 300 MW coal fired steam power plants 5. GT75 – 75 MW auto diesel fired gas turbines 6. GT105 – 105 MW auto diesel fired gas turbines 7. CCY150 – 150 MW auto diesel fired combined cycle power plants 8. CCY300 – 300 MW auto diesel fired combined cycle power plants 9. LNG – 250 MW LNG fired combine cycle plants 10. NUCLEAR – 600MW
A7.1.1 Screening Curves of the Generation Options at 10% Discount Rate
0.0
10.0
20.0
30.0
40.0
50.0
60.0
70.0
80.0
90.0
100.0
110.0
120.0
130.0
0.05 0.15 0.25 0.35 0.45 0.55 0.65 0.75 0.85
Spec
ific C
ost (
US
Cts/
kWh)
Plant Factor (%)
CoalT CSTLNG GT75GT105 CCY150CCY300 NUCLEARSTF150 STF300
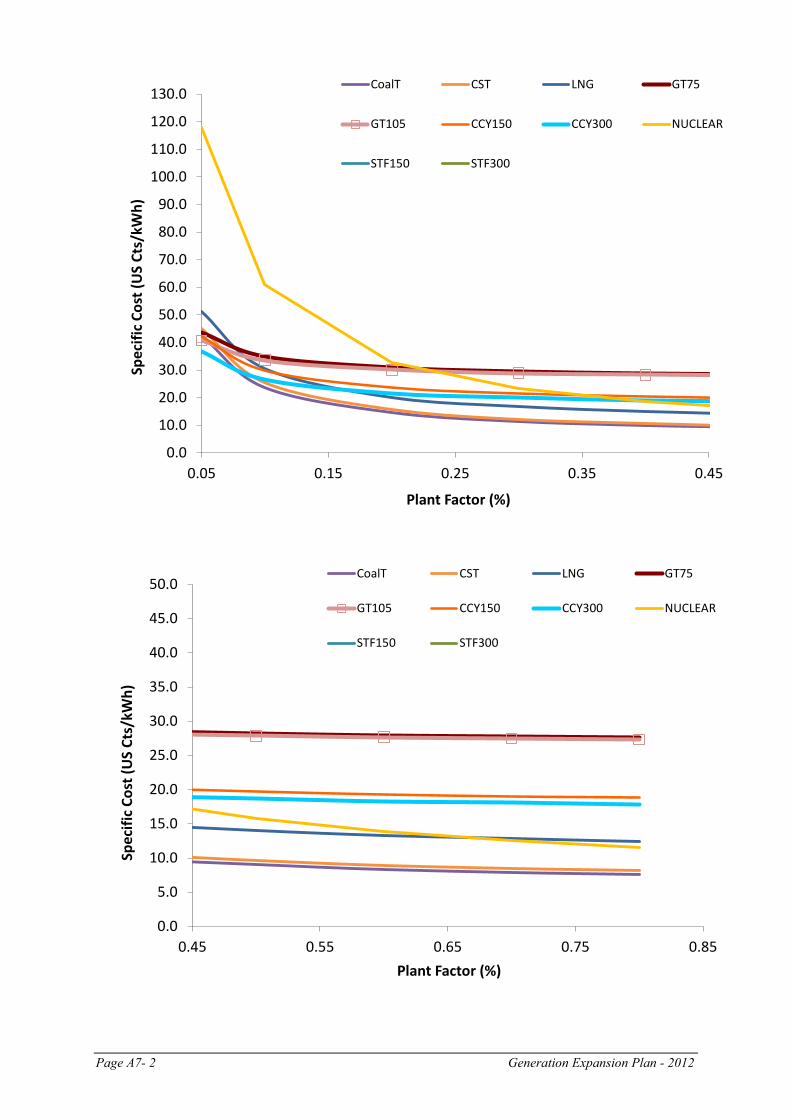
Page A7- 2 Generation Expansion Plan - 2012
0.0
10.0
20.0
30.0
40.0
50.0
60.0
70.0
80.0
90.0
100.0
110.0
120.0
130.0
0.05 0.15 0.25 0.35 0.45
Spec
ific C
ost (
US
Cts/
kWh)
Plant Factor (%)
CoalT CST LNG GT75
GT105 CCY150 CCY300 NUCLEAR
STF150 STF300
0.0
5.0
10.0
15.0
20.0
25.0
30.0
35.0
40.0
45.0
50.0
0.45 0.55 0.65 0.75 0.85
Spec
ific C
ost (
US
Cts/
kWh)
Plant Factor (%)
CoalT CST LNG GT75
GT105 CCY150 CCY300 NUCLEAR
STF150 STF300
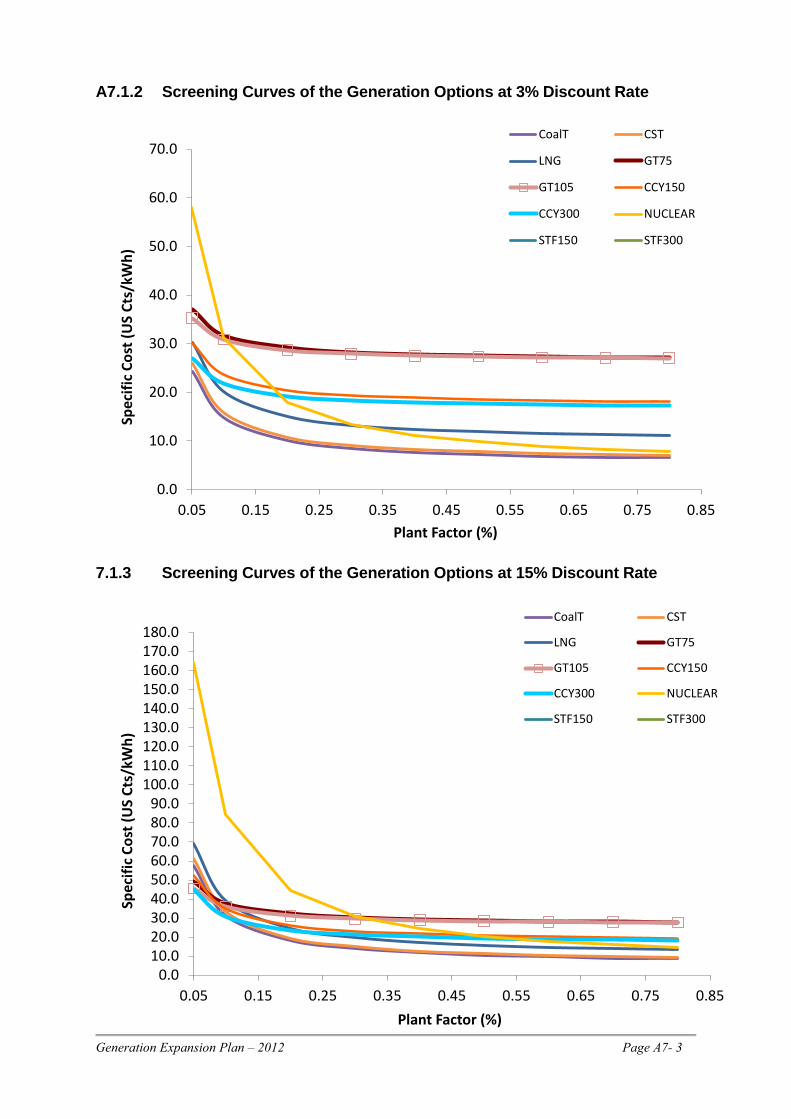
Generation Expansion Plan – 2012 Page A7- 3
A7.1.2 Screening Curves of the Generation Options at 3% Discount Rate
7.1.3 Screening Curves of the Generation Options at 15% Discount Rate
0.0
10.0
20.0
30.0
40.0
50.0
60.0
70.0
0.05 0.15 0.25 0.35 0.45 0.55 0.65 0.75 0.85
Spec
ific C
ost (
US
Cts/
kWh)
Plant Factor (%)
CoalT CST
LNG GT75
GT105 CCY150
CCY300 NUCLEAR
STF150 STF300
0.010.020.030.040.050.060.070.080.090.0
100.0110.0120.0130.0140.0150.0160.0170.0180.0
0.05 0.15 0.25 0.35 0.45 0.55 0.65 0.75 0.85
Spec
ific C
ost (
US
Cts/
kWh)
Plant Factor (%)
CoalT CST
LNG GT75
GT105 CCY150
CCY300 NUCLEAR
STF150 STF300
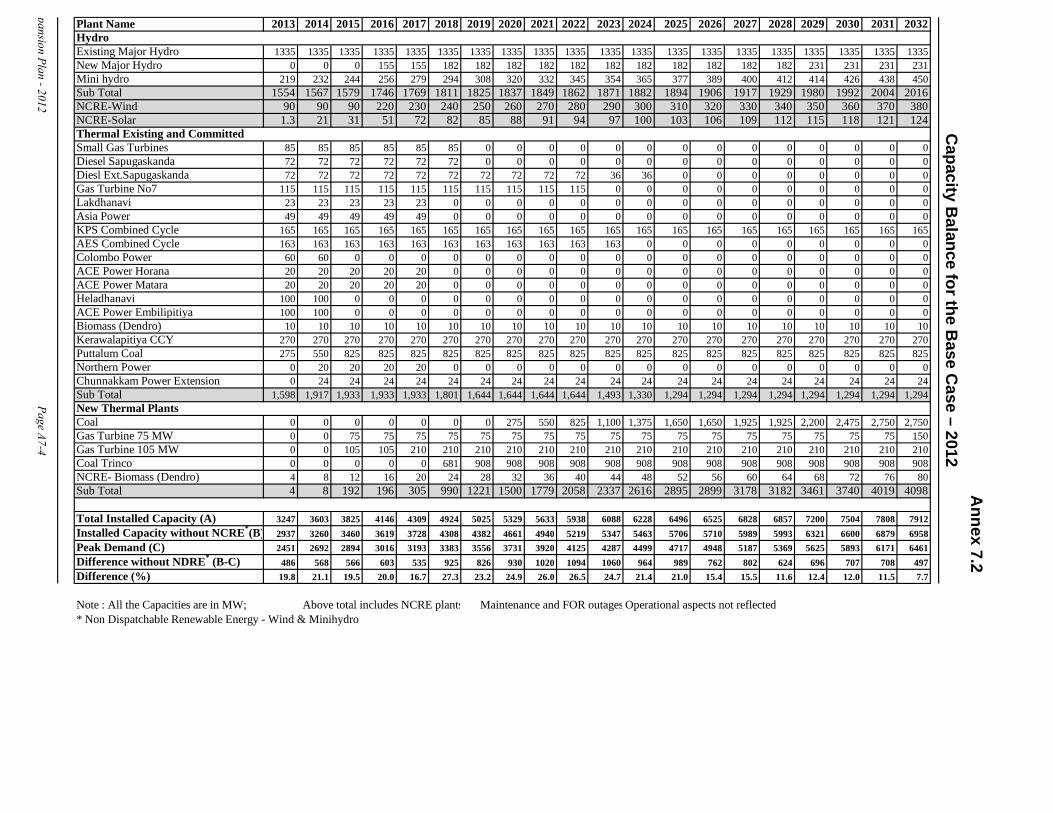
Plant Name 2013 2014 2015 2016 2017 2018 2019 2020 2021 2022 2023 2024 2025 2026 2027 2028 2029 2030 2031 2032
Existing Major Hydro 1335 1335 1335 1335 1335 1335 1335 1335 1335 1335 1335 1335 1335 1335 1335 1335 1335 1335 1335 1335New Major Hydro 0 0 0 155 155 182 182 182 182 182 182 182 182 182 182 182 231 231 231 231Mini hydro 219 232 244 256 279 294 308 320 332 345 354 365 377 389 400 412 414 426 438 450Sub Total 1554 1567 1579 1746 1769 1811 1825 1837 1849 1862 1871 1882 1894 1906 1917 1929 1980 1992 2004 2016NCRE-Wind 90 90 90 220 230 240 250 260 270 280 290 300 310 320 330 340 350 360 370 380NCRE-Solar 1.3 21 31 51 72 82 85 88 91 94 97 100 103 106 109 112 115 118 121 124
Small Gas Turbines 85 85 85 85 85 85 0 0 0 0 0 0 0 0 0 0 0 0 0 0Diesel Sapugaskanda 72 72 72 72 72 72 0 0 0 0 0 0 0 0 0 0 0 0 0 0Diesl Ext.Sapugaskanda 72 72 72 72 72 72 72 72 72 72 36 36 0 0 0 0 0 0 0 0Gas Turbine No7 115 115 115 115 115 115 115 115 115 115 0 0 0 0 0 0 0 0 0 0Lakdhanavi 23 23 23 23 23 0 0 0 0 0 0 0 0 0 0 0 0 0 0 0Asia Power 49 49 49 49 49 0 0 0 0 0 0 0 0 0 0 0 0 0 0 0KPS Combined Cycle 165 165 165 165 165 165 165 165 165 165 165 165 165 165 165 165 165 165 165 165AES Combined Cycle 163 163 163 163 163 163 163 163 163 163 163 0 0 0 0 0 0 0 0 0Colombo Power 60 60 0 0 0 0 0 0 0 0 0 0 0 0 0 0 0 0 0 0ACE Power Horana 20 20 20 20 20 0 0 0 0 0 0 0 0 0 0 0 0 0 0 0ACE Power Matara 20 20 20 20 20 0 0 0 0 0 0 0 0 0 0 0 0 0 0 0Heladhanavi 100 100 0 0 0 0 0 0 0 0 0 0 0 0 0 0 0 0 0 0ACE Power Embilipitiya 100 100 0 0 0 0 0 0 0 0 0 0 0 0 0 0 0 0 0 0Biomass (Dendro) 10 10 10 10 10 10 10 10 10 10 10 10 10 10 10 10 10 10 10 10Kerawalapitiya CCY 270 270 270 270 270 270 270 270 270 270 270 270 270 270 270 270 270 270 270 270Puttalum Coal 275 550 825 825 825 825 825 825 825 825 825 825 825 825 825 825 825 825 825 825Northern Power 0 20 20 20 20 0 0 0 0 0 0 0 0 0 0 0 0 0 0 0Chunnakkam Power Extension 0 24 24 24 24 24 24 24 24 24 24 24 24 24 24 24 24 24 24 24Sub Total 1,598 1,917 1,933 1,933 1,933 1,801 1,644 1,644 1,644 1,644 1,493 1,330 1,294 1,294 1,294 1,294 1,294 1,294 1,294 1,294
Coal 0 0 0 0 0 0 0 275 550 825 1,100 1,375 1,650 1,650 1,925 1,925 2,200 2,475 2,750 2,750Gas Turbine 75 MW 0 0 75 75 75 75 75 75 75 75 75 75 75 75 75 75 75 75 75 150Gas Turbine 105 MW 0 0 105 105 210 210 210 210 210 210 210 210 210 210 210 210 210 210 210 210Coal Trinco 0 0 0 0 0 681 908 908 908 908 908 908 908 908 908 908 908 908 908 908NCRE- Biomass (Dendro) 4 8 12 16 20 24 28 32 36 40 44 48 52 56 60 64 68 72 76 80Sub Total 4 8 192 196 305 990 1221 1500 1779 2058 2337 2616 2895 2899 3178 3182 3461 3740 4019 4098
Total Installed Capacity (A) 3247 3603 3825 4146 4309 4924 5025 5329 5633 5938 6088 6228 6496 6525 6828 6857 7200 7504 7808 7912Installed Capacity without NCRE*(B) 2937 3260 3460 3619 3728 4308 4382 4661 4940 5219 5347 5463 5706 5710 5989 5993 6321 6600 6879 6958Peak Demand (C) 2451 2692 2894 3016 3193 3383 3556 3731 3920 4125 4287 4499 4717 4948 5187 5369 5625 5893 6171 6461Difference without NDRE* (B-C) 486 568 566 603 535 925 826 930 1020 1094 1060 964 989 762 802 624 696 707 708 497Difference (%) 19.8 21.1 19.5 20.0 16.7 27.3 23.2 24.9 26.0 26.5 24.7 21.4 21.0 15.4 15.5 11.6 12.4 12.0 11.5 7.7
Note : All the Capacities are in MW; Above total includes NCRE plants Maintenance and FOR outages Operational aspects not reflected* Non Dispatchable Renewable Energy - Wind & Minihydro
pansion Plan - 2012 Page A7-4
Annex 7.2
Capacity B
alance for the Base C
ase – 2012
Hydro
New Thermal Plants
Thermal Existing and Committed
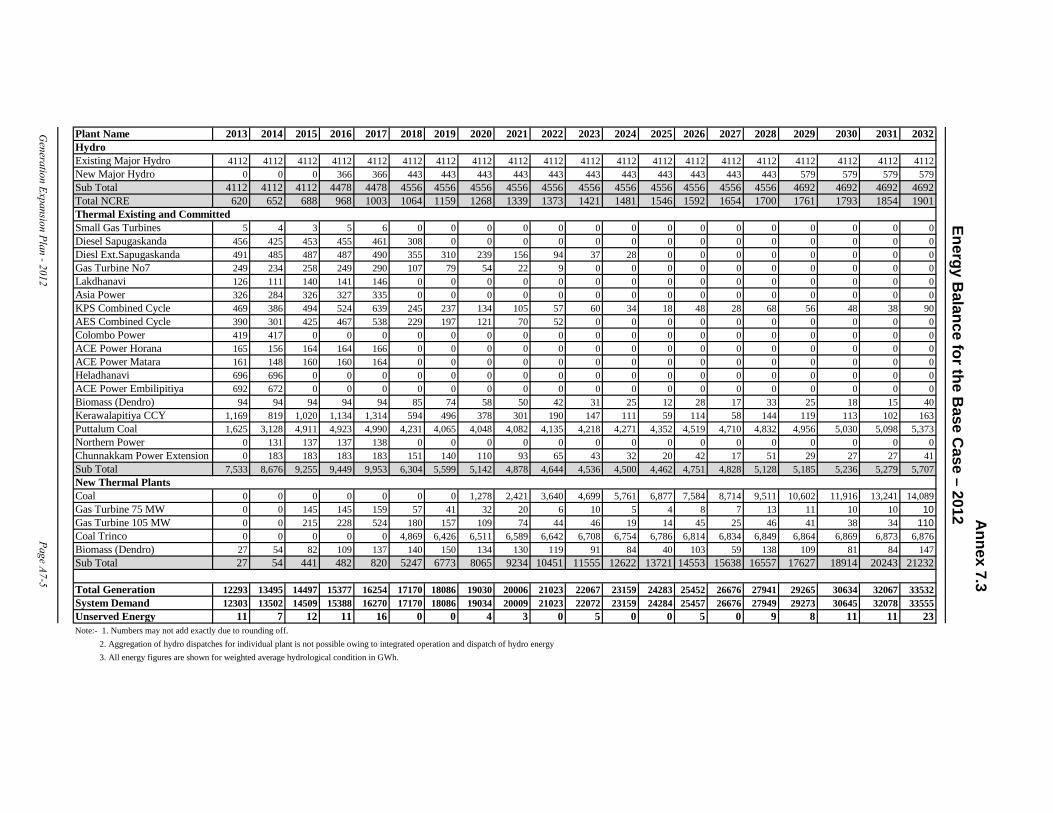
Plant Name 2013 2014 2015 2016 2017 2018 2019 2020 2021 2022 2023 2024 2025 2026 2027 2028 2029 2030 2031 2032
Existing Major Hydro 4112 4112 4112 4112 4112 4112 4112 4112 4112 4112 4112 4112 4112 4112 4112 4112 4112 4112 4112 4112New Major Hydro 0 0 0 366 366 443 443 443 443 443 443 443 443 443 443 443 579 579 579 579Sub Total 4112 4112 4112 4478 4478 4556 4556 4556 4556 4556 4556 4556 4556 4556 4556 4556 4692 4692 4692 4692Total NCRE 620 652 688 968 1003 1064 1159 1268 1339 1373 1421 1481 1546 1592 1654 1700 1761 1793 1854 1901
Small Gas Turbines 5 4 3 5 6 0 0 0 0 0 0 0 0 0 0 0 0 0 0 0Diesel Sapugaskanda 456 425 453 455 461 308 0 0 0 0 0 0 0 0 0 0 0 0 0 0Diesl Ext.Sapugaskanda 491 485 487 487 490 355 310 239 156 94 37 28 0 0 0 0 0 0 0 0Gas Turbine No7 249 234 258 249 290 107 79 54 22 9 0 0 0 0 0 0 0 0 0 0Lakdhanavi 126 111 140 141 146 0 0 0 0 0 0 0 0 0 0 0 0 0 0 0Asia Power 326 284 326 327 335 0 0 0 0 0 0 0 0 0 0 0 0 0 0 0KPS Combined Cycle 469 386 494 524 639 245 237 134 105 57 60 34 18 48 28 68 56 48 38 90AES Combined Cycle 390 301 425 467 538 229 197 121 70 52 0 0 0 0 0 0 0 0 0 0Colombo Power 419 417 0 0 0 0 0 0 0 0 0 0 0 0 0 0 0 0 0 0ACE Power Horana 165 156 164 164 166 0 0 0 0 0 0 0 0 0 0 0 0 0 0 0ACE Power Matara 161 148 160 160 164 0 0 0 0 0 0 0 0 0 0 0 0 0 0 0Heladhanavi 696 696 0 0 0 0 0 0 0 0 0 0 0 0 0 0 0 0 0 0ACE Power Embilipitiya 692 672 0 0 0 0 0 0 0 0 0 0 0 0 0 0 0 0 0 0Biomass (Dendro) 94 94 94 94 94 85 74 58 50 42 31 25 12 28 17 33 25 18 15 40Kerawalapitiya CCY 1,169 819 1,020 1,134 1,314 594 496 378 301 190 147 111 59 114 58 144 119 113 102 163Puttalum Coal 1,625 3,128 4,911 4,923 4,990 4,231 4,065 4,048 4,082 4,135 4,218 4,271 4,352 4,519 4,710 4,832 4,956 5,030 5,098 5,373Northern Power 0 131 137 137 138 0 0 0 0 0 0 0 0 0 0 0 0 0 0 0Chunnakkam Power Extension 0 183 183 183 183 151 140 110 93 65 43 32 20 42 17 51 29 27 27 41Sub Total 7,533 8,676 9,255 9,449 9,953 6,304 5,599 5,142 4,878 4,644 4,536 4,500 4,462 4,751 4,828 5,128 5,185 5,236 5,279 5,707
Coal 0 0 0 0 0 0 0 1,278 2,421 3,640 4,699 5,761 6,877 7,584 8,714 9,511 10,602 11,916 13,241 14,089Gas Turbine 75 MW 0 0 145 145 159 57 41 32 20 6 10 5 4 8 7 13 11 10 10 10Gas Turbine 105 MW 0 0 215 228 524 180 157 109 74 44 46 19 14 45 25 46 41 38 34 110Coal Trinco 0 0 0 0 0 4,869 6,426 6,511 6,589 6,642 6,708 6,754 6,786 6,814 6,834 6,849 6,864 6,869 6,873 6,876Biomass (Dendro) 27 54 82 109 137 140 150 134 130 119 91 84 40 103 59 138 109 81 84 147Sub Total 27 54 441 482 820 5247 6773 8065 9234 10451 11555 12622 13721 14553 15638 16557 17627 18914 20243 21232
Total Generation 12293 13495 14497 15377 16254 17170 18086 19030 20006 21023 22067 23159 24283 25452 26676 27941 29265 30634 32067 33532System Demand 12303 13502 14509 15388 16270 17170 18086 19034 20009 21023 22072 23159 24284 25457 26676 27949 29273 30645 32078 33555Unserved Energy 11 7 12 11 16 0 0 4 3 0 5 0 0 5 0 9 8 11 11 23Note:- 1. Numbers may not add exactly due to rounding off. 2. Aggregation of hydro dispatches for individual plant is not possible owing to integrated operation and dispatch of hydro energy 3. All energy figures are shown for weighted average hydrological condition in GWh.
Generation Expansion Plan - 2012 Page A7-5
Energy Balance for the B
ase Case – 2012
Annex 7.3
Hydro
New Thermal Plants
Thermal Existing and Committed
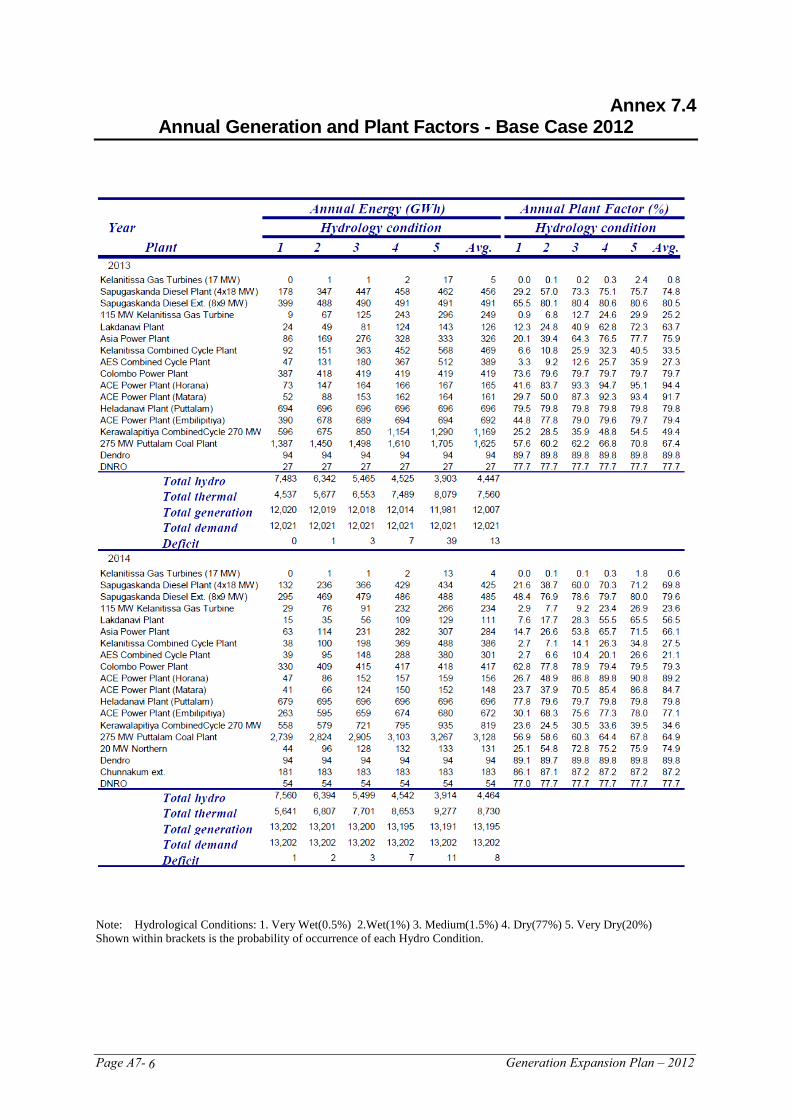
Page A7- Generation Expansion Plan – 2012 6
Annex 7.4 Annual Generation and Plant Factors - Base Case 2012
Note: Hydrological Conditions: 1. Very Wet(0.5%) 2.Wet(1%) 3. Medium(1.5%) 4. Dry(77%) 5. Very Dry(20%) Shown within brackets is the probability of occurrence of each Hydro Condition.
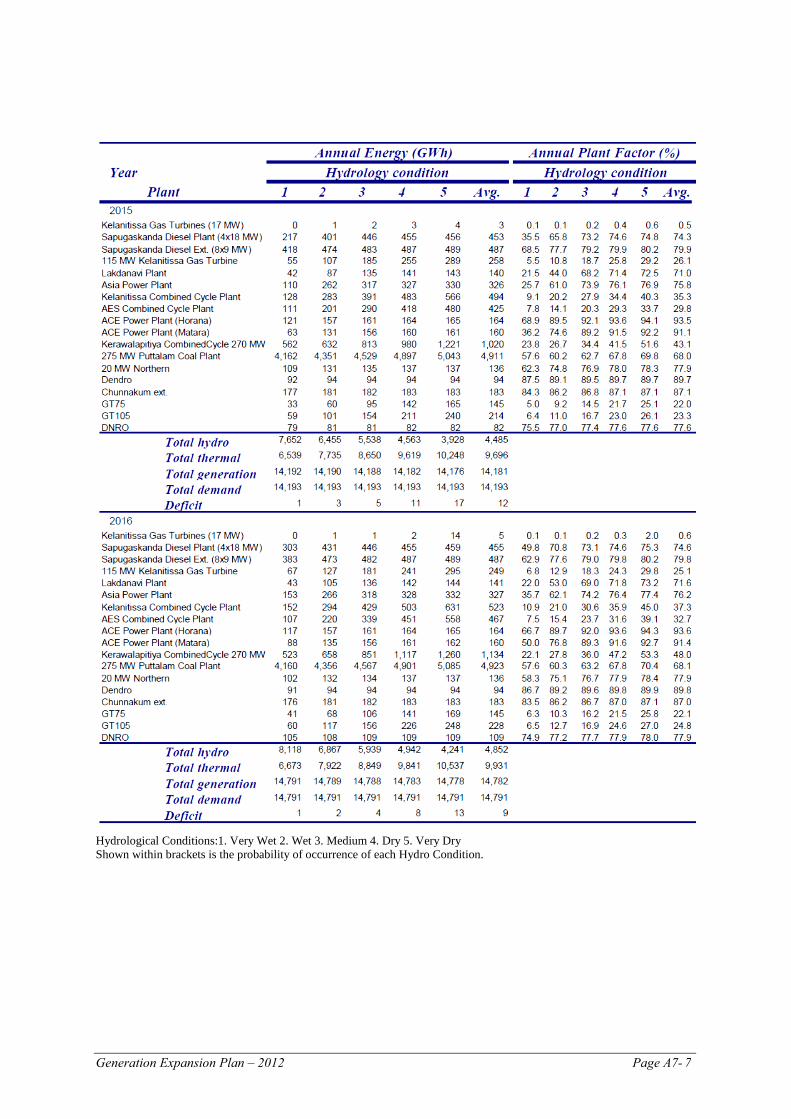
Generation Expansion Plan – 2012 Page A7- 7
Hydrological Conditions:1. Very Wet 2. Wet 3. Medium 4. Dry 5. Very Dry Shown within brackets is the probability of occurrence of each Hydro Condition.
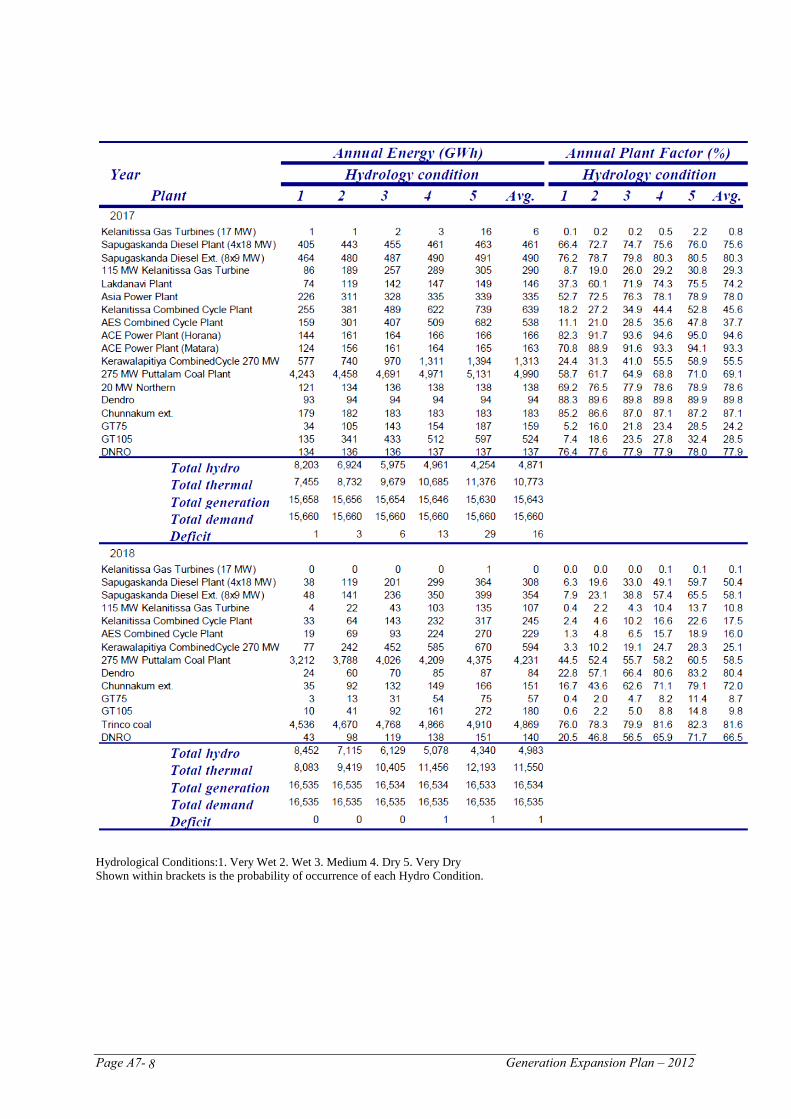
Page A7- Generation Expansion Plan – 2012 8
Hydrological Conditions:1. Very Wet 2. Wet 3. Medium 4. Dry 5. Very Dry Shown within brackets is the probability of occurrence of each Hydro Condition.
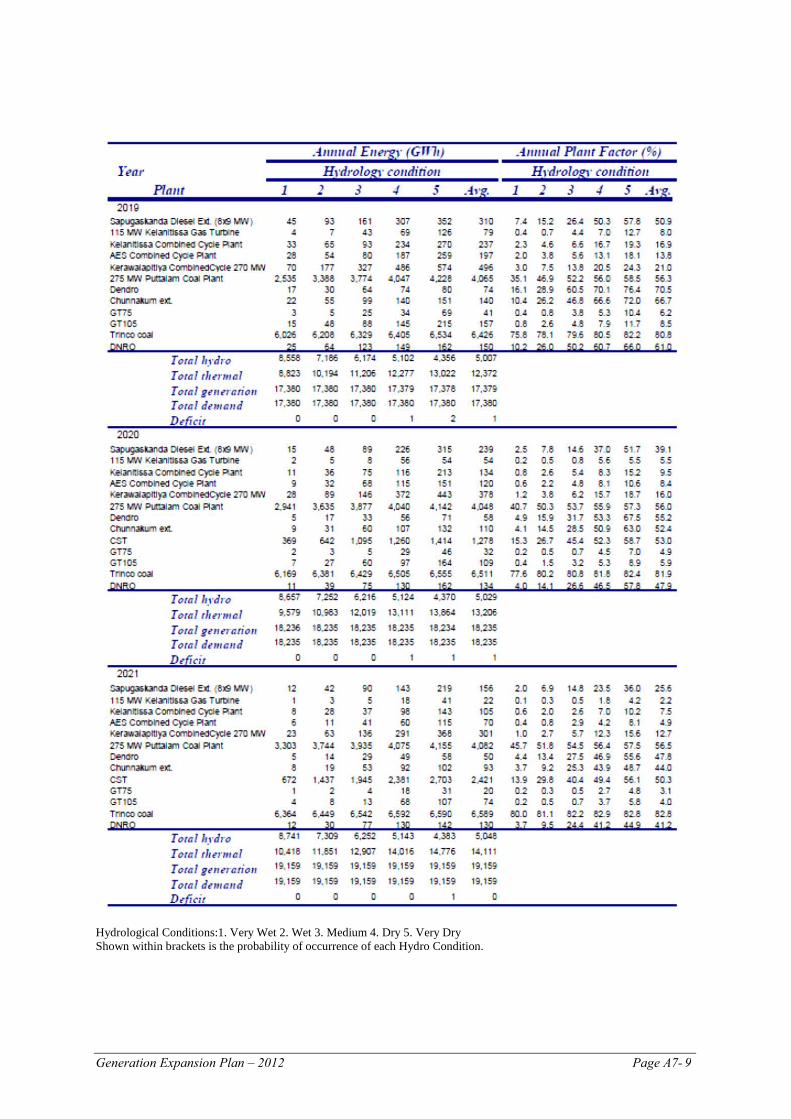
Generation Expansion Plan – 2012 Page A7- 9
Hydrological Conditions:1. Very Wet 2. Wet 3. Medium 4. Dry 5. Very Dry Shown within brackets is the probability of occurrence of each Hydro Condition.
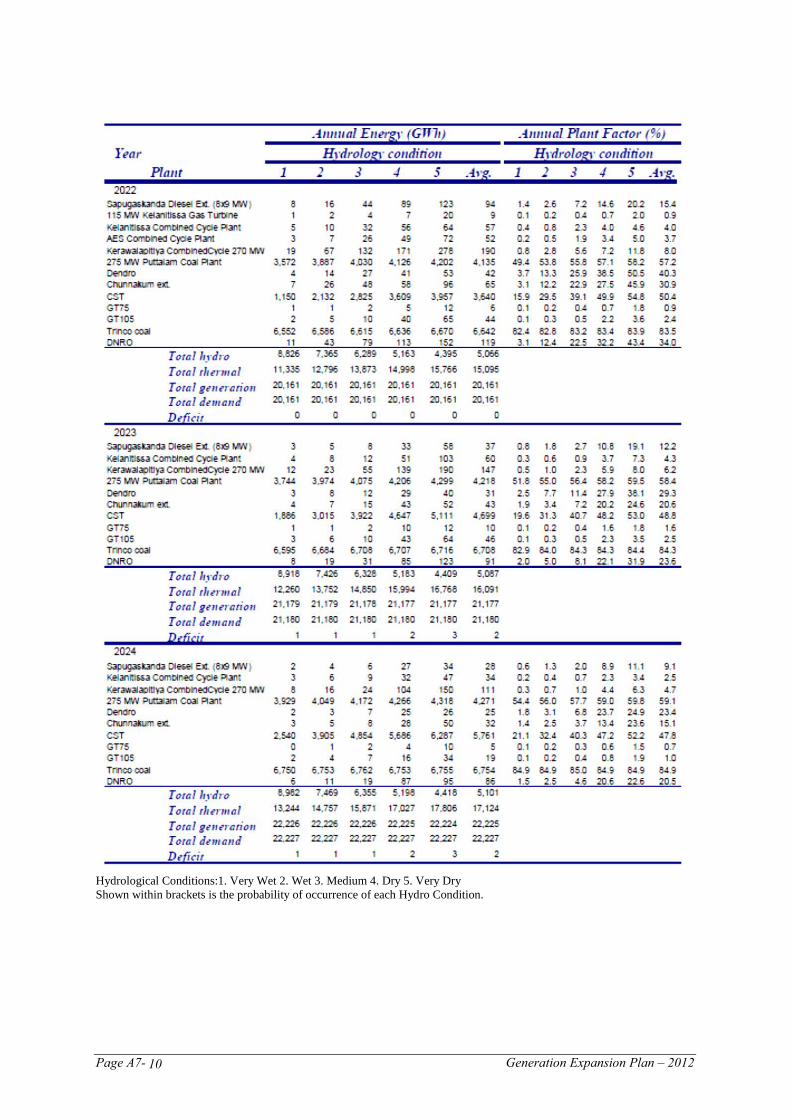
Page A7- Generation Expansion Plan – 2012 10
Hydrological Conditions:1. Very Wet 2. Wet 3. Medium 4. Dry 5. Very Dry Shown within brackets is the probability of occurrence of each Hydro Condition.
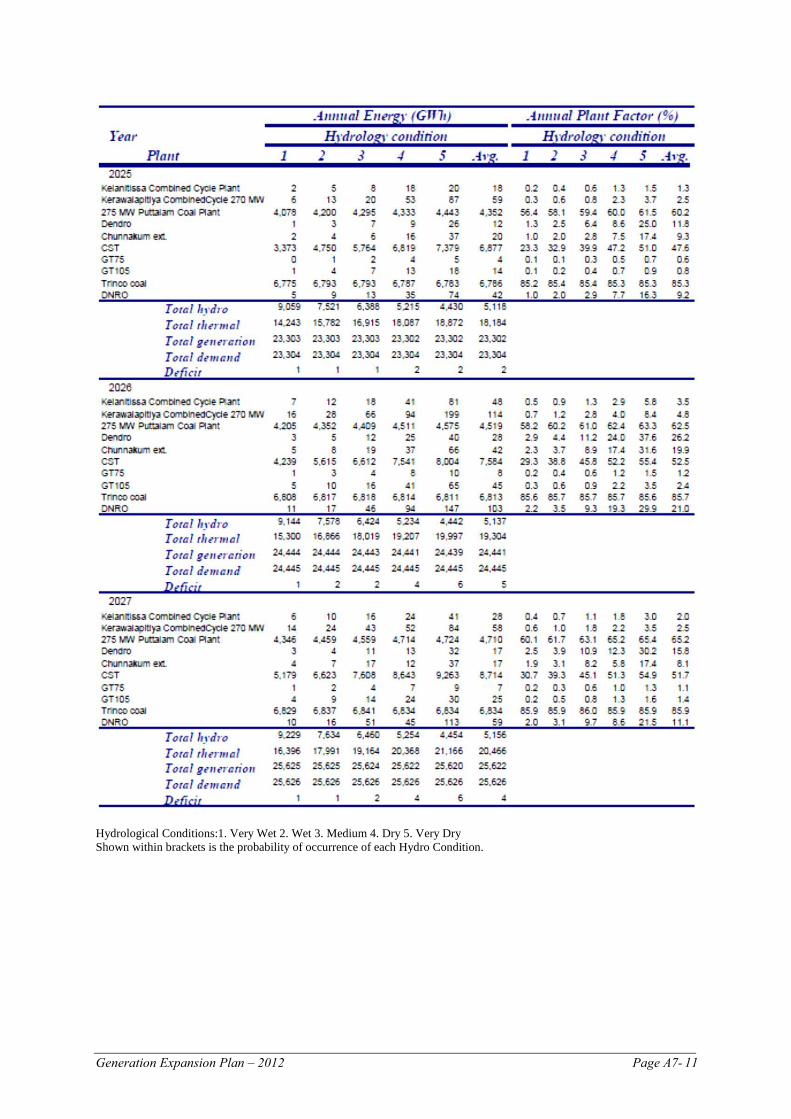
Generation Expansion Plan – 2012 Page A7- 11
Hydrological Conditions:1. Very Wet 2. Wet 3. Medium 4. Dry 5. Very Dry Shown within brackets is the probability of occurrence of each Hydro Condition.
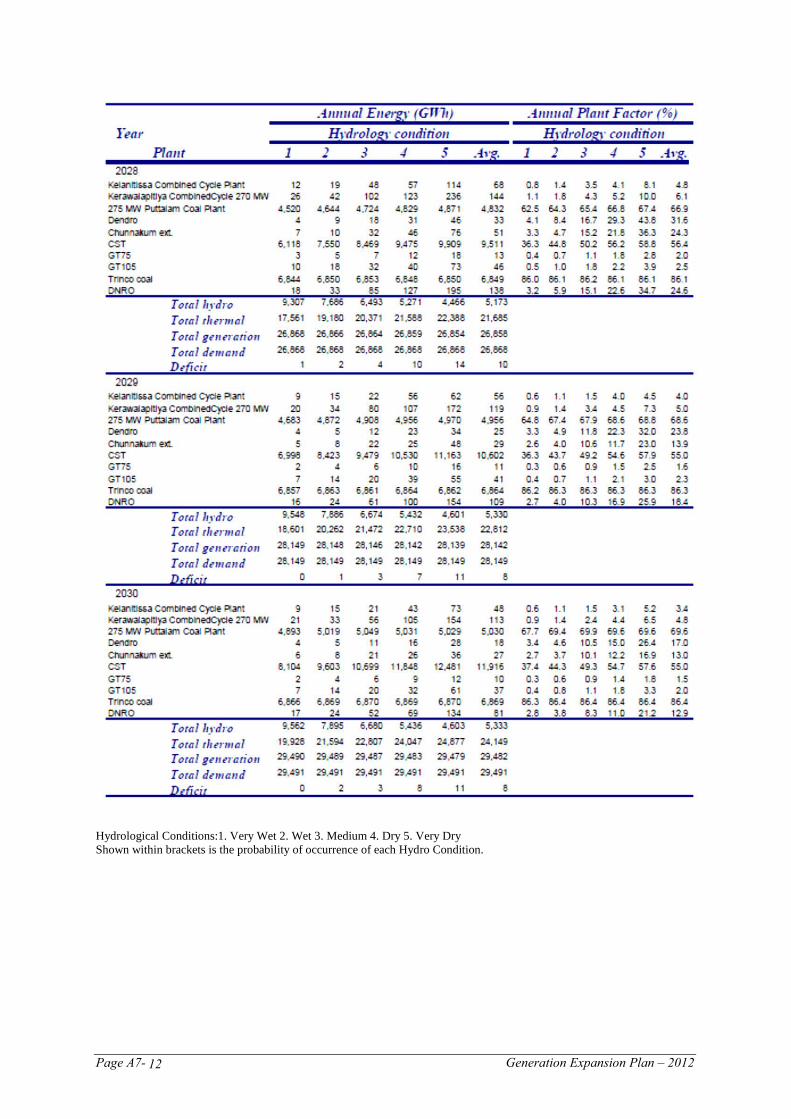
Page A7- Generation Expansion Plan – 2012 12
Hydrological Conditions:1. Very Wet 2. Wet 3. Medium 4. Dry 5. Very Dry Shown within brackets is the probability of occurrence of each Hydro Condition.
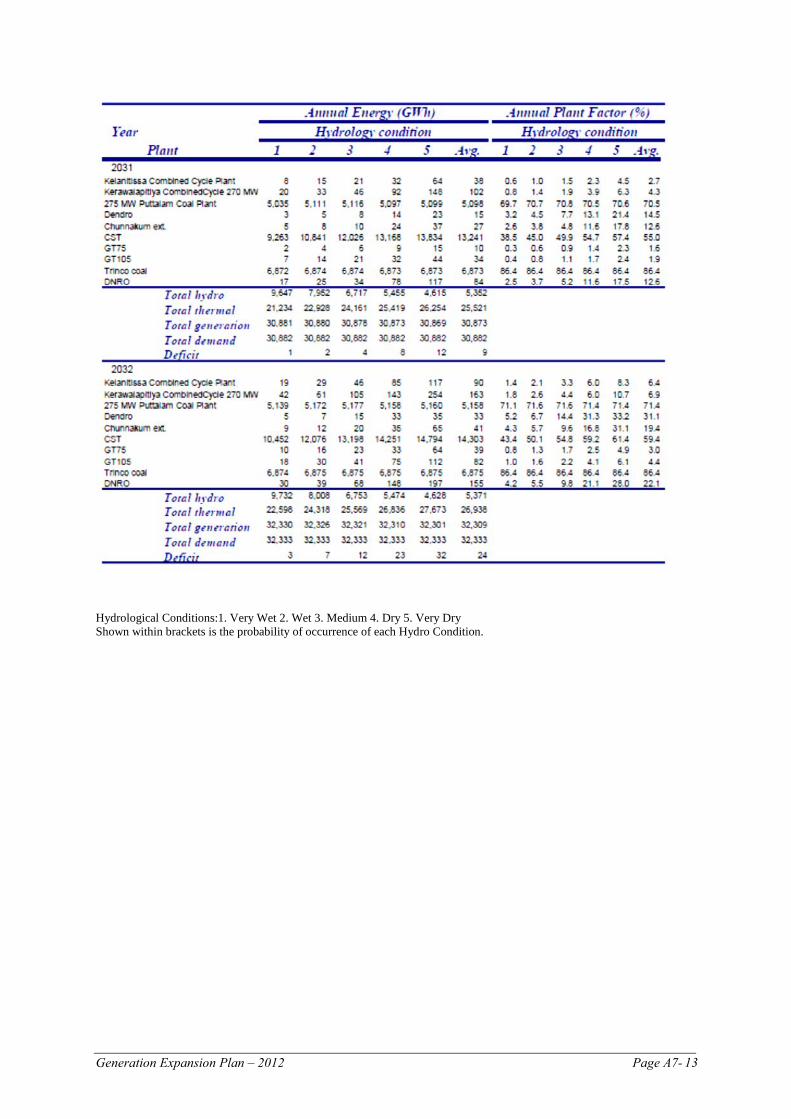
Generation Expansion Plan – 2012 Page A7- 13
Hydrological Conditions:1. Very Wet 2. Wet 3. Medium 4. Dry 5. Very Dry Shown within brackets is the probability of occurrence of each Hydro Condition.
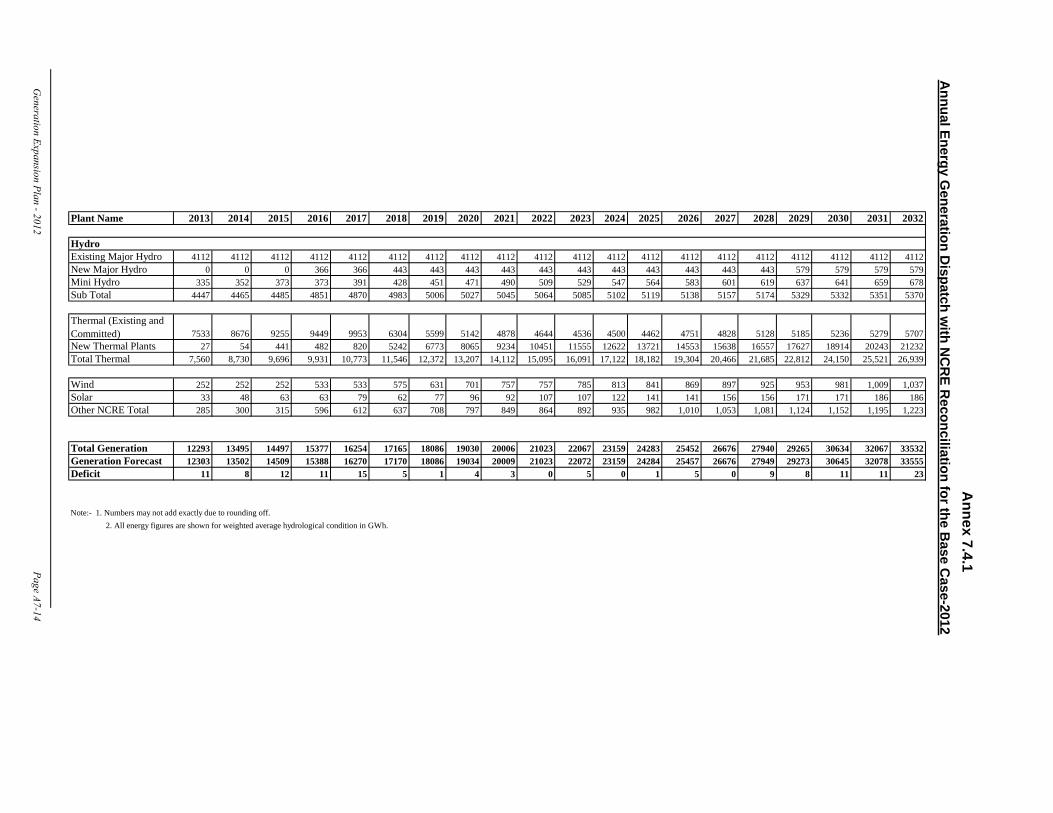
Plant Name 2013 2014 2015 2016 2017 2018 2019 2020 2021 2022 2023 2024 2025 2026 2027 2028 2029 2030 2031 2032
Existing Major Hydro 4112 4112 4112 4112 4112 4112 4112 4112 4112 4112 4112 4112 4112 4112 4112 4112 4112 4112 4112 4112New Major Hydro 0 0 0 366 366 443 443 443 443 443 443 443 443 443 443 443 579 579 579 579Mini Hydro 335 352 373 373 391 428 451 471 490 509 529 547 564 583 601 619 637 641 659 678Sub Total 4447 4465 4485 4851 4870 4983 5006 5027 5045 5064 5085 5102 5119 5138 5157 5174 5329 5332 5351 5370
Thermal (Existing and Committed) 7533 8676 9255 9449 9953 6304 5599 5142 4878 4644 4536 4500 4462 4751 4828 5128 5185 5236 5279 5707New Thermal Plants 27 54 441 482 820 5242 6773 8065 9234 10451 11555 12622 13721 14553 15638 16557 17627 18914 20243 21232Total Thermal 7,560 8,730 9,696 9,931 10,773 11,546 12,372 13,207 14,112 15,095 16,091 17,122 18,182 19,304 20,466 21,685 22,812 24,150 25,521 26,939
Wind 252 252 252 533 533 575 631 701 757 757 785 813 841 869 897 925 953 981 1,009 1,037Solar 33 48 63 63 79 62 77 96 92 107 107 122 141 141 156 156 171 171 186 186Other NCRE Total 285 300 315 596 612 637 708 797 849 864 892 935 982 1,010 1,053 1,081 1,124 1,152 1,195 1,223
Total Generation 12293 13495 14497 15377 16254 17165 18086 19030 20006 21023 22067 23159 24283 25452 26676 27940 29265 30634 32067 33532Generation Forecast 12303 13502 14509 15388 16270 17170 18086 19034 20009 21023 22072 23159 24284 25457 26676 27949 29273 30645 32078 33555Deficit 11 8 12 11 15 5 1 4 3 0 5 0 1 5 0 9 8 11 11 23
Note:- 1. Numbers may not add exactly due to rounding off. 2. All energy figures are shown for weighted average hydrological condition in GWh.
Annex 7.4.1
Annual Energy G
eneration Dispatch w
ith NC
RE R
econciliation for the Base C
ase-2012
Generation Expansion Plan - 2012 Page A7-14
Hydro
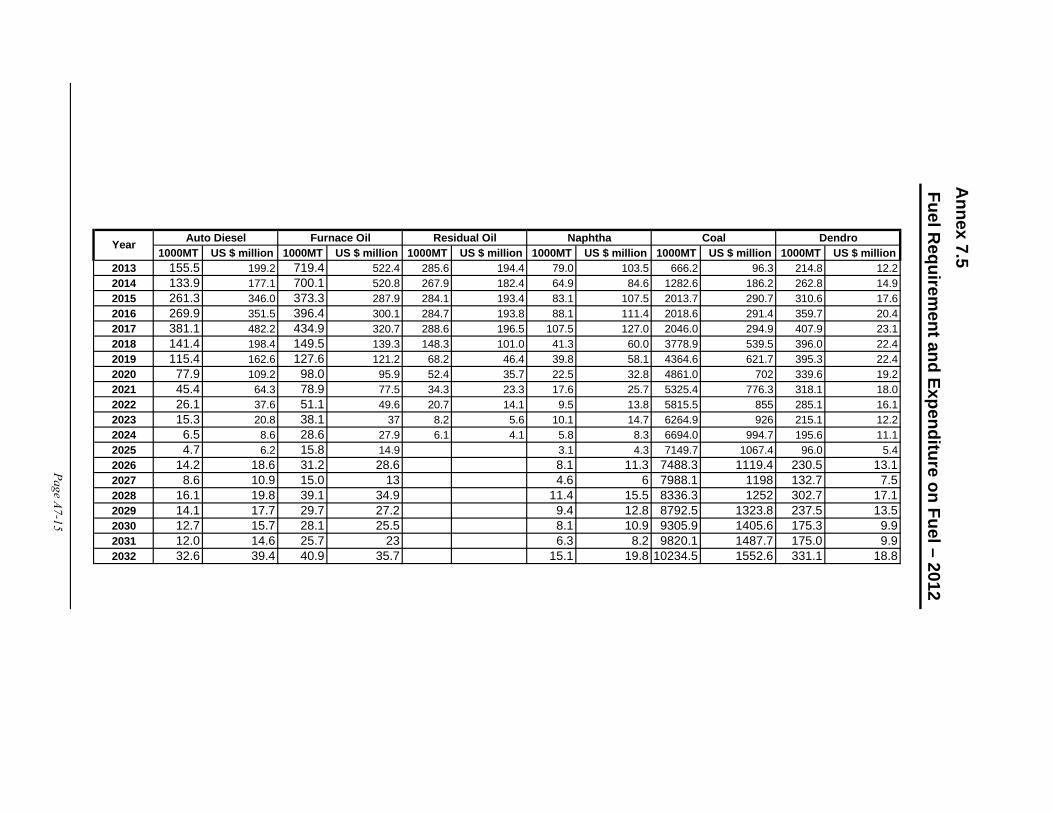
1000MT US $ million 1000MT US $ million 1000MT US $ million 1000MT US $ million 1000MT US $ million 1000MT US $ million2013 155.5 199.2 719.4 522.4 285.6 194.4 79.0 103.5 666.2 96.3 214.8 12.22014 133.9 177.1 700.1 520.8 267.9 182.4 64.9 84.6 1282.6 186.2 262.8 14.92015 261.3 346.0 373.3 287.9 284.1 193.4 83.1 107.5 2013.7 290.7 310.6 17.62016 269.9 351.5 396.4 300.1 284.7 193.8 88.1 111.4 2018.6 291.4 359.7 20.42017 381.1 482.2 434.9 320.7 288.6 196.5 107.5 127.0 2046.0 294.9 407.9 23.12018 141.4 198.4 149.5 139.3 148.3 101.0 41.3 60.0 3778.9 539.5 396.0 22.42019 115.4 162.6 127.6 121.2 68.2 46.4 39.8 58.1 4364.6 621.7 395.3 22.42020 77.9 109.2 98.0 95.9 52.4 35.7 22.5 32.8 4861.0 702 339.6 19.22021 45.4 64.3 78.9 77.5 34.3 23.3 17.6 25.7 5325.4 776.3 318.1 18.02022 26.1 37.6 51.1 49.6 20.7 14.1 9.5 13.8 5815.5 855 285.1 16.12023 15.3 20.8 38.1 37 8.2 5.6 10.1 14.7 6264.9 926 215.1 12.22024 6.5 8.6 28.6 27.9 6.1 4.1 5.8 8.3 6694.0 994.7 195.6 11.12025 4.7 6.2 15.8 14.9 3.1 4.3 7149.7 1067.4 96.0 5.42026 14.2 18.6 31.2 28.6 8.1 11.3 7488.3 1119.4 230.5 13.12027 8.6 10.9 15.0 13 4.6 6 7988.1 1198 132.7 7.52028 16.1 19.8 39.1 34.9 11.4 15.5 8336.3 1252 302.7 17.12029 14.1 17.7 29.7 27.2 9.4 12.8 8792.5 1323.8 237.5 13.52030 12.7 15.7 28.1 25.5 8.1 10.9 9305.9 1405.6 175.3 9.92031 12.0 14.6 25.7 23 6.3 8.2 9820.1 1487.7 175.0 9.92032 32.6 39.4 40.9 35.7 15.1 19.8 10234.5 1552.6 331.1 18.8
Page A7-15
Fuel Requirem
ent and Expenditure on Fuel – 2012A
nnex 7.5
Auto Diesel Furnace Oil Residual Oil Naphtha Coal DendroYear
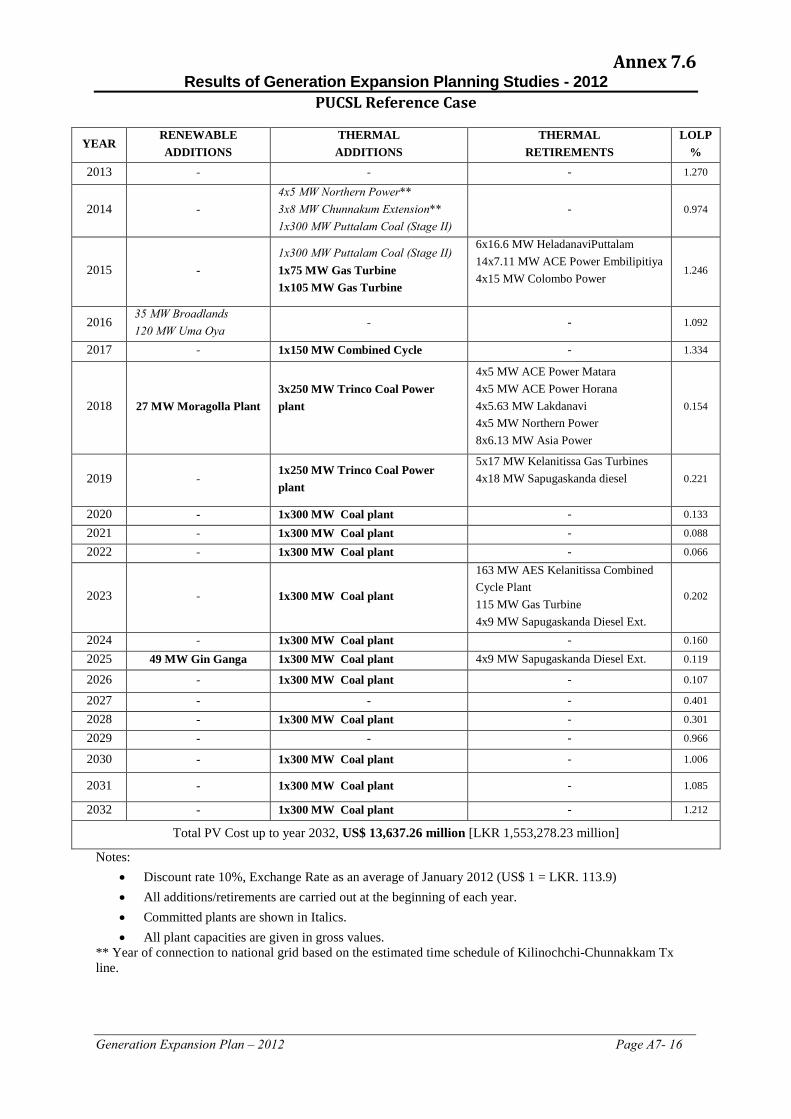
Generation Expansion Plan – 2012 Page A7- 16
Annex 7.6
Results of Generation Expansion Planning Studies - 2012 PUCSL Reference Case
YEAR RENEWABLE ADDITIONS
THERMAL ADDITIONS
THERMAL RETIREMENTS
LOLP %
2013 - - - 1.270
2014 - 4x5 MW Northern Power** 3x8 MW Chunnakum Extension** 1x300 MW Puttalam Coal (Stage II)
- 0.974
2015 - 1x300 MW Puttalam Coal (Stage II) 1x75 MW Gas Turbine 1x10⁵ MW Gas Turbine
6x16.6 MW HeladanaviPuttalam 14x7.11 MW ACE Power Embilipitiya 4x15 MW Colombo Power
1.246
2016 35 MW Broadlands 120 MW Uma Oya
- - 1.092
2017 - 1x150 MW Combined Cycle - 1.334
2018 27 MW Moragolla Plant 3x250 MW Trinco Coal Power plant
4x5 MW ACE Power Matara 4x5 MW ACE Power Horana 4x5.63 MW Lakdanavi 4x5 MW Northern Power 8x6.13 MW Asia Power
0.154
2019 - 1x250 MW Trinco Coal Power plant
5x17 MW Kelanitissa Gas Turbines 4x18 MW Sapugaskanda diesel
0.221
2020 - 1x300 MW Coal plant - 0.133
2021 - 1x300 MW Coal plant - 0.088
2022 - 1x300 MW Coal plant - 0.066
2023 - 1x300 MW Coal plant
163 MW AES Kelanitissa Combined Cycle Plant 115 MW Gas Turbine 4x9 MW Sapugaskanda Diesel Ext.
0.202
2024 - 1x300 MW Coal plant - 0.160
2025 49 MW Gin Ganga 1x300 MW Coal plant 4x9 MW Sapugaskanda Diesel Ext. 0.119
2026 - 1x300 MW Coal plant - 0.107
2027 - - - 0.401
2028 - 1x300 MW Coal plant - 0.301
2029 - - - 0.966
2030 - 1x300 MW Coal plant - 1.006
2031 - 1x300 MW Coal plant - 1.085
2032 - 1x300 MW Coal plant - 1.212
Total PV Cost up to year 2032, US$ 13,637.26 million [LKR 1,553,278.23 million]
Notes: • Discount rate 10%, Exchange Rate as an average of January 2012 (US$ 1 = LKR. 113.9) • All additions/retirements are carried out at the beginning of each year. • Committed plants are shown in Italics. • All plant capacities are given in gross values.
** Year of connection to national grid based on the estimated time schedule of Kilinochchi-Chunnakkam Tx line.
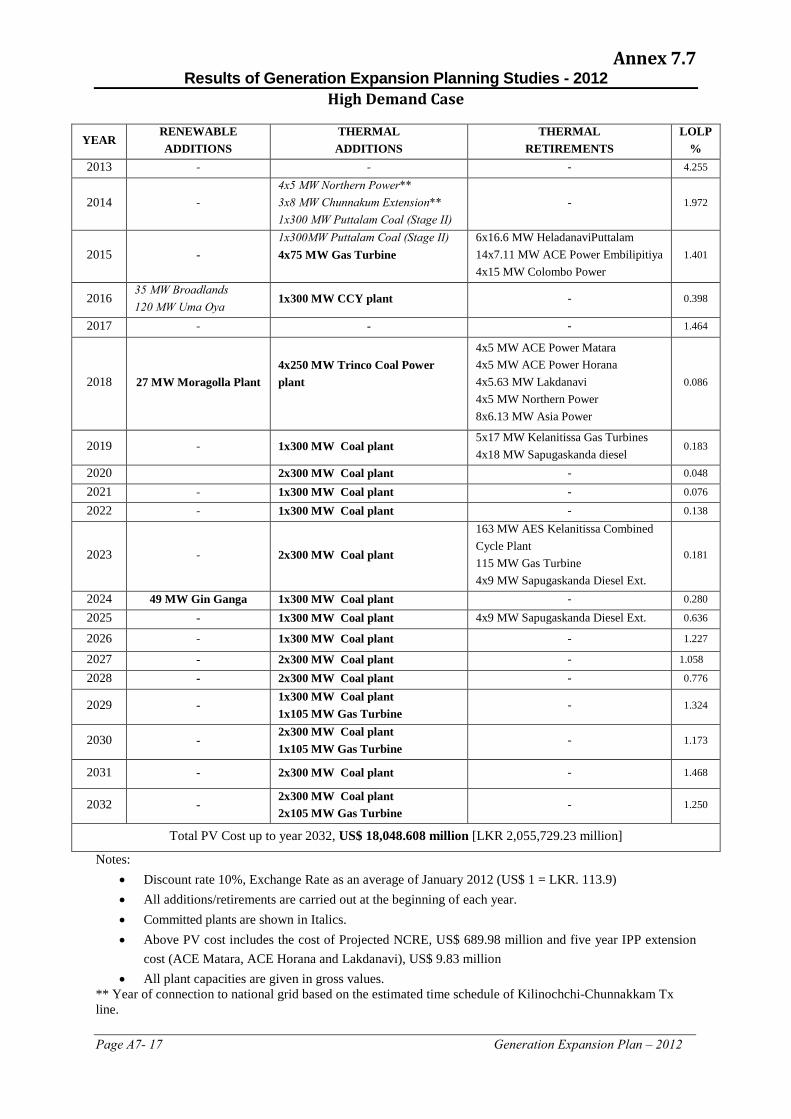
Page A7- 17 Generation Expansion Plan – 2012
Annex 7.7
Results of Generation Expansion Planning Studies - 2012 High Demand Case
YEAR RENEWABLE ADDITIONS
THERMAL ADDITIONS
THERMAL RETIREMENTS
LOLP %
2013 - - - 4.255
2014 - 4x5 MW Northern Power** 3x8 MW Chunnakum Extension** 1x300 MW Puttalam Coal (Stage II)
- 1.972
2015 - 1x300MW Puttalam Coal (Stage II) 4x75 MW Gas Turbine
6x16.6 MW HeladanaviPuttalam 14x7.11 MW ACE Power Embilipitiya 4x15 MW Colombo Power
1.401
2016 35 MW Broadlands 120 MW Uma Oya
1x300 MW CCY plant - 0.398
2017 - - - 1.464
2018 27 MW Moragolla Plant 4x250 MW Trinco Coal Power plant
4x5 MW ACE Power Matara 4x5 MW ACE Power Horana 4x5.63 MW Lakdanavi 4x5 MW Northern Power 8x6.13 MW Asia Power
0.086
2019 - 1x300 MW Coal plant 5x17 MW Kelanitissa Gas Turbines 4x18 MW Sapugaskanda diesel
0.183
2020 2x300 MW Coal plant - 0.048
2021 - 1x300 MW Coal plant - 0.076
2022 - 1x300 MW Coal plant - 0.138
2023 - 2x300 MW Coal plant
163 MW AES Kelanitissa Combined Cycle Plant 115 MW Gas Turbine 4x9 MW Sapugaskanda Diesel Ext.
0.181
2024 49 MW Gin Ganga 1x300 MW Coal plant - 0.280
2025 - 1x300 MW Coal plant 4x9 MW Sapugaskanda Diesel Ext. 0.636
2026 - 1x300 MW Coal plant - 1.227
2027 - 2x300 MW Coal plant - 1.058
2028 - 2x300 MW Coal plant - 0.776
2029 - 1x300 MW Coal plant 1x10⁵ MW Gas Turbine
- 1.324
2030 - 2x300 MW Coal plant 1x10⁵ MW Gas Turbine
- 1.173
2031 - 2x300 MW Coal plant - 1.468
2032 - 2x300 MW Coal plant 2x10⁵ MW Gas Turbine
- 1.250
Total PV Cost up to year 2032, US$ 18,048.608 million [LKR 2,055,729.23 million]
Notes: • Discount rate 10%, Exchange Rate as an average of January 2012 (US$ 1 = LKR. 113.9) • All additions/retirements are carried out at the beginning of each year. • Committed plants are shown in Italics. • Above PV cost includes the cost of Projected NCRE, US$ 689.98 million and five year IPP extension
cost (ACE Matara, ACE Horana and Lakdanavi), US$ 9.83 million • All plant capacities are given in gross values.
** Year of connection to national grid based on the estimated time schedule of Kilinochchi-Chunnakkam Tx line.
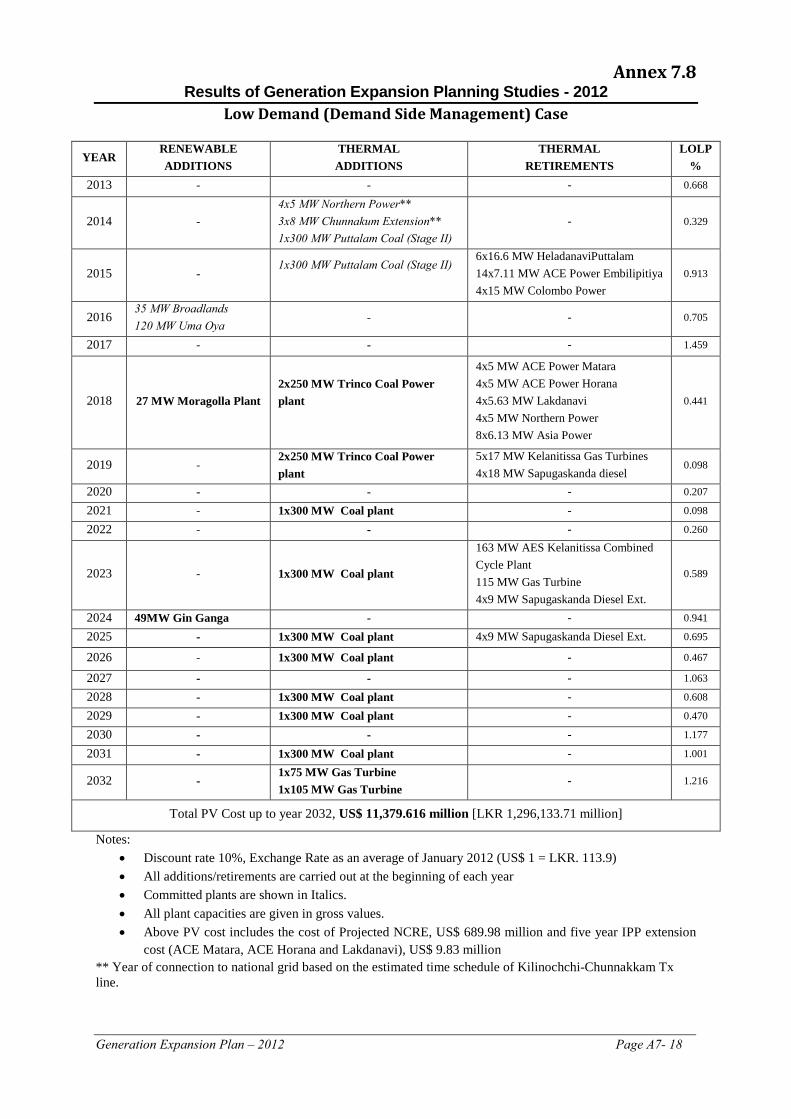
Generation Expansion Plan – 2012 Page A7- 18
Annex 7.8 Results of Generation Expansion Planning Studies - 2012
Low Demand (Demand Side Management) Case
YEAR RENEWABLE ADDITIONS
THERMAL ADDITIONS
THERMAL RETIREMENTS
LOLP %
2013 - - - 0.668
2014 - 4x5 MW Northern Power** 3x8 MW Chunnakum Extension** 1x300 MW Puttalam Coal (Stage II)
- 0.329
2015 - 1x300 MW Puttalam Coal (Stage II)
6x16.6 MW HeladanaviPuttalam 14x7.11 MW ACE Power Embilipitiya 4x15 MW Colombo Power
0.913
2016 35 MW Broadlands 120 MW Uma Oya
- - 0.705
2017 - - - 1.459
2018 27 MW Moragolla Plant 2x250 MW Trinco Coal Power plant
4x5 MW ACE Power Matara 4x5 MW ACE Power Horana 4x5.63 MW Lakdanavi 4x5 MW Northern Power 8x6.13 MW Asia Power
0.441
2019 - 2x250 MW Trinco Coal Power plant
5x17 MW Kelanitissa Gas Turbines 4x18 MW Sapugaskanda diesel
0.098
2020 - - - 0.207
2021 - 1x300 MW Coal plant - 0.098
2022 - - - 0.260
2023 - 1x300 MW Coal plant
163 MW AES Kelanitissa Combined Cycle Plant 115 MW Gas Turbine 4x9 MW Sapugaskanda Diesel Ext.
0.589
2024 49MW Gin Ganga - - 0.941
2025 - 1x300 MW Coal plant 4x9 MW Sapugaskanda Diesel Ext. 0.695
2026 - 1x300 MW Coal plant - 0.467
2027 - - - 1.063
2028 - 1x300 MW Coal plant - 0.608
2029 - 1x300 MW Coal plant - 0.470
2030 - - - 1.177
2031 - 1x300 MW Coal plant - 1.001
2032 - 1x75 MW Gas Turbine 1x10⁵ MW Gas Turbine
- 1.216
Total PV Cost up to year 2032, US$ 11,379.616 million [LKR 1,296,133.71 million]
Notes: • Discount rate 10%, Exchange Rate as an average of January 2012 (US$ 1 = LKR. 113.9) • All additions/retirements are carried out at the beginning of each year • Committed plants are shown in Italics. • All plant capacities are given in gross values. • Above PV cost includes the cost of Projected NCRE, US$ 689.98 million and five year IPP extension
cost (ACE Matara, ACE Horana and Lakdanavi), US$ 9.83 million ** Year of connection to national grid based on the estimated time schedule of Kilinochchi-Chunnakkam Tx line.
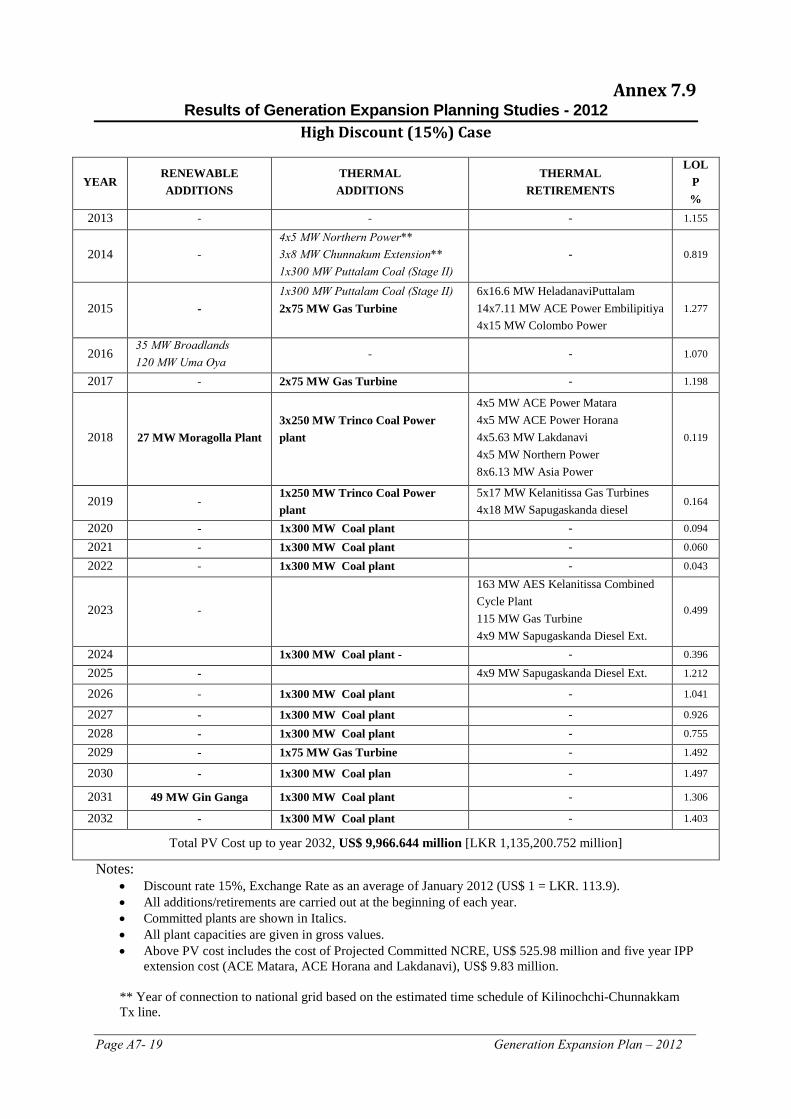
Page A7- 19 Generation Expansion Plan – 2012
Annex 7.9 Results of Generation Expansion Planning Studies - 2012
High Discount (15%) Case
YEAR RENEWABLE ADDITIONS
THERMAL ADDITIONS
THERMAL RETIREMENTS
LOLP %
2013 - - - 1.155
2014 - 4x5 MW Northern Power** 3x8 MW Chunnakum Extension** 1x300 MW Puttalam Coal (Stage II)
- 0.819
2015 - 1x300 MW Puttalam Coal (Stage II) 2x75 MW Gas Turbine
6x16.6 MW HeladanaviPuttalam 14x7.11 MW ACE Power Embilipitiya 4x15 MW Colombo Power
1.277
2016 35 MW Broadlands 120 MW Uma Oya
- - 1.070
2017 - 2x75 MW Gas Turbine - 1.198
2018 27 MW Moragolla Plant 3x250 MW Trinco Coal Power plant
4x5 MW ACE Power Matara 4x5 MW ACE Power Horana 4x5.63 MW Lakdanavi 4x5 MW Northern Power 8x6.13 MW Asia Power
0.119
2019 - 1x250 MW Trinco Coal Power plant
5x17 MW Kelanitissa Gas Turbines 4x18 MW Sapugaskanda diesel
0.164
2020 - 1x300 MW Coal plant - 0.094
2021 - 1x300 MW Coal plant - 0.060
2022 - 1x300 MW Coal plant - 0.043
2023 -
163 MW AES Kelanitissa Combined Cycle Plant 115 MW Gas Turbine 4x9 MW Sapugaskanda Diesel Ext.
0.499
2024 1x300 MW Coal plant - - 0.396
2025 - 4x9 MW Sapugaskanda Diesel Ext. 1.212
2026 - 1x300 MW Coal plant - 1.041
2027 - 1x300 MW Coal plant - 0.926
2028 - 1x300 MW Coal plant - 0.755
2029 - 1x75 MW Gas Turbine - 1.492
2030 - 1x300 MW Coal plan - 1.497
2031 49 MW Gin Ganga 1x300 MW Coal plant - 1.306
2032 - 1x300 MW Coal plant - 1.403
Total PV Cost up to year 2032, US$ 9,966.644 million [LKR 1,135,200.752 million]
Notes: • Discount rate 15%, Exchange Rate as an average of January 2012 (US$ 1 = LKR. 113.9). • All additions/retirements are carried out at the beginning of each year. • Committed plants are shown in Italics. • All plant capacities are given in gross values. • Above PV cost includes the cost of Projected Committed NCRE, US$ 525.98 million and five year IPP
extension cost (ACE Matara, ACE Horana and Lakdanavi), US$ 9.83 million.
** Year of connection to national grid based on the estimated time schedule of Kilinochchi-Chunnakkam Tx line.

Generation Expansion Plan – 2012 Page A7- 20
Annex 7.10 Results of Generation Expansion Planning Studies - 2012
Low Discount Rate (3%) Case
YEAR RENEWABLE ADDITIONS
THERMAL ADDITIONS
THERMAL RETIREMENTS
LOLP %
2013 - - - 1.155
2014 - 4x5 MW Northern Power** 3x8 MW Chunnakum Extension** 1x300 MW Puttalam Coal (Stage II)
- 0.819
2015 - 1x300 MW Puttalam Coal (Stage II) 1x75 MW Gas Turbine 1x10⁵ MW Gas Turbine
6x16.6 MW HeladanaviPuttalam 14x7.11 MW ACE Power Embilipitiya 4x15 MW Colombo Power
1.103
2016 35 MW Broadlands 120 MW Uma Oya
- - 0.854
2017 - 1x10⁵ MW Gas Turbine - 1.320
2018 - 3x250 MW Trinco Coal Power plant
4x5 MW ACE Power Matara 4x5 MW ACE Power Horana 4x5.63 MW Lakdanavi 4x5 MW Northern Power 8x6.13 MW Asia Power
0.160
2019 - 1x300 MW Coal plant 5x17 MW Kelanitissa Gas Turbines 4x18 MW Sapugaskanda diesel
0.172
2020 27 MW Moragolla Plant 1x250 MW Trinco Coal Power plant
- 0.106
2021 - 1x300 MW Coal plant - 0.067
2022 - 1x300 MW Coal plant - 0.048
2023 - 1x300 MW Coal plant
163 MW AES Kelanitissa Combined Cycle Plant 115 MW Gas Turbine 4x9 MW Sapugaskanda Diesel Ext.
0.134
2024 49 MW Gin Ganga 1x300 MW Coal plant - 0.074
2025 - 1x300 MW Coal plant 4x9 MW Sapugaskanda Diesel Ext. 0.073
2026 - 1x300 MW Coal plant - 0.063
2027 - - - 0.241
2028 - 1x300 MW Coal plant - 0.189
2029 - 1x300 MW Coal plant - 0.190
2030 - - - 0.654
2031 - 1x300 MW Coal plant - 0.697
2032 - 1x300 MW Coal plant - 0.775
Total PV Cost up to year 2032, US$ 23,979.994 million [LKR 2,731,321.31 million]
Notes: • Discount rate 3 %, Exchange Rate as an average of January 2012 (US$ 1 = LKR. 113.9) • All additions/retirements are carried out at the beginning of each year • Committed plants are shown in Italics • Above PV cost includes the cost of Projected NCRE, US$ 1135.61 million and five year IPP extension
cost (ACE Matara, ACE Horana and Lakdanavi), US$ 9.83 million. • All plant capacities are given in gross values.
** Year of connection to national grid based on the estimated time schedule of Kilinochchi-Chunnakkam Tx line.
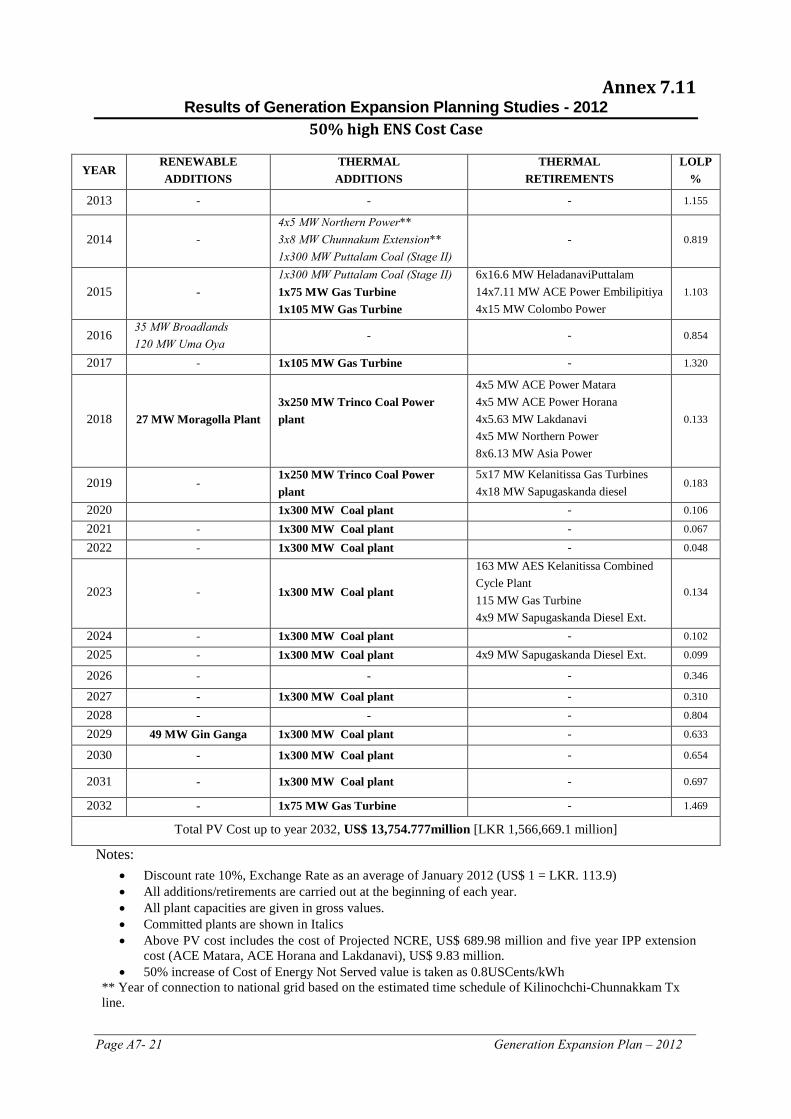
Page A7- 21 Generation Expansion Plan – 2012
Annex 7.11 Results of Generation Expansion Planning Studies - 2012
50% high ENS Cost Case
YEAR RENEWABLE ADDITIONS
THERMAL ADDITIONS
THERMAL RETIREMENTS
LOLP %
2013 - - - 1.155
2014 - 4x5 MW Northern Power** 3x8 MW Chunnakum Extension** 1x300 MW Puttalam Coal (Stage II)
- 0.819
2015 - 1x300 MW Puttalam Coal (Stage II) 1x75 MW Gas Turbine 1x10⁵ MW Gas Turbine
6x16.6 MW HeladanaviPuttalam 14x7.11 MW ACE Power Embilipitiya 4x15 MW Colombo Power
1.103
2016 35 MW Broadlands 120 MW Uma Oya
- - 0.854
2017 - 1x10⁵ MW Gas Turbine - 1.320
2018 27 MW Moragolla Plant 3x250 MW Trinco Coal Power plant
4x5 MW ACE Power Matara 4x5 MW ACE Power Horana 4x5.63 MW Lakdanavi 4x5 MW Northern Power 8x6.13 MW Asia Power
0.133
2019 - 1x250 MW Trinco Coal Power plant
5x17 MW Kelanitissa Gas Turbines 4x18 MW Sapugaskanda diesel
0.183
2020 1x300 MW Coal plant - 0.106
2021 - 1x300 MW Coal plant - 0.067
2022 - 1x300 MW Coal plant - 0.048
2023 - 1x300 MW Coal plant
163 MW AES Kelanitissa Combined Cycle Plant 115 MW Gas Turbine 4x9 MW Sapugaskanda Diesel Ext.
0.134
2024 - 1x300 MW Coal plant - 0.102
2025 - 1x300 MW Coal plant 4x9 MW Sapugaskanda Diesel Ext. 0.099
2026 - - - 0.346
2027 - 1x300 MW Coal plant - 0.310
2028 - - - 0.804
2029 49 MW Gin Ganga 1x300 MW Coal plant - 0.633
2030 - 1x300 MW Coal plant - 0.654
2031 - 1x300 MW Coal plant - 0.697
2032 - 1x75 MW Gas Turbine - 1.469
Total PV Cost up to year 2032, US$ 13,754.777million [LKR 1,566,669.1 million]
Notes: • Discount rate 10%, Exchange Rate as an average of January 2012 (US$ 1 = LKR. 113.9) • All additions/retirements are carried out at the beginning of each year. • All plant capacities are given in gross values. • Committed plants are shown in Italics • Above PV cost includes the cost of Projected NCRE, US$ 689.98 million and five year IPP extension
cost (ACE Matara, ACE Horana and Lakdanavi), US$ 9.83 million. • 50% increase of Cost of Energy Not Served value is taken as 0.8USCents/kWh
** Year of connection to national grid based on the estimated time schedule of Kilinochchi-Chunnakkam Tx line.
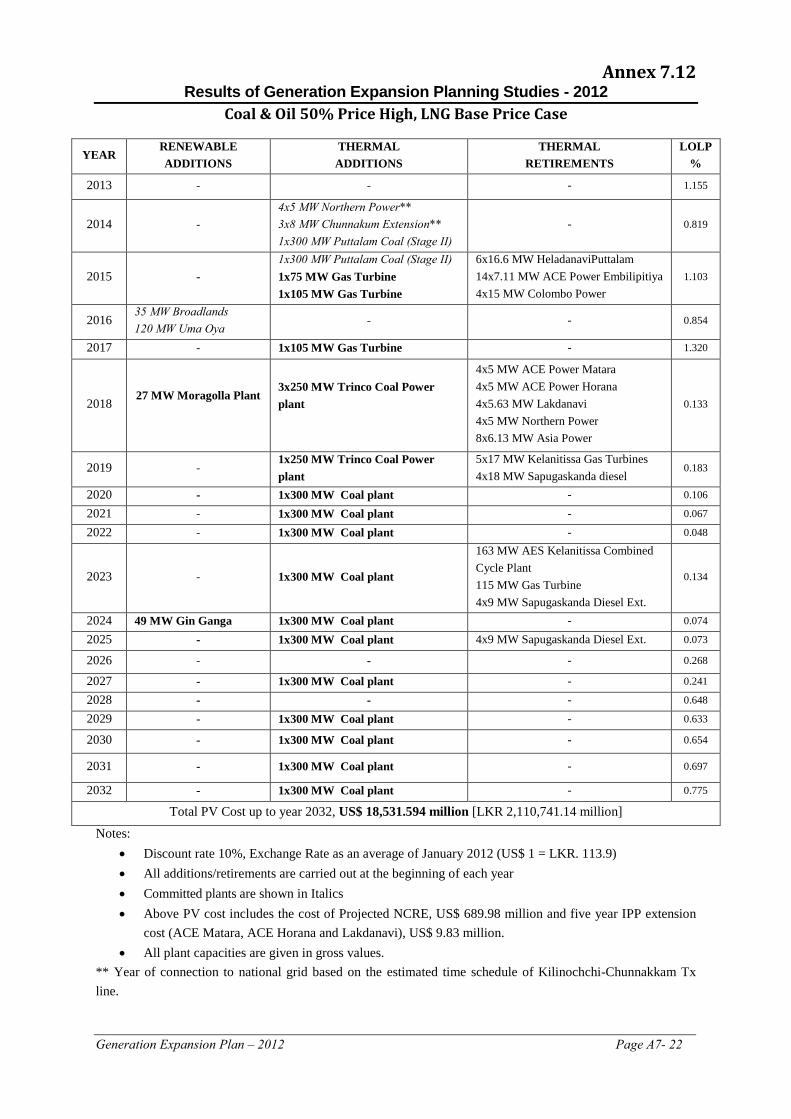
Generation Expansion Plan – 2012 Page A7- 22
Annex 7.12 Results of Generation Expansion Planning Studies - 2012
Coal & Oil 50% Price High, LNG Base Price Case
YEAR RENEWABLE ADDITIONS
THERMAL ADDITIONS
THERMAL RETIREMENTS
LOLP %
2013 - - - 1.155
2014 - 4x5 MW Northern Power** 3x8 MW Chunnakum Extension** 1x300 MW Puttalam Coal (Stage II)
- 0.819
2015 - 1x300 MW Puttalam Coal (Stage II) 1x75 MW Gas Turbine 1x10⁵ MW Gas Turbine
6x16.6 MW HeladanaviPuttalam 14x7.11 MW ACE Power Embilipitiya 4x15 MW Colombo Power
1.103
2016 35 MW Broadlands 120 MW Uma Oya
- - 0.854
2017 - 1x10⁵ MW Gas Turbine - 1.320
2018 27 MW Moragolla Plant
3x250 MW Trinco Coal Power plant
4x5 MW ACE Power Matara 4x5 MW ACE Power Horana 4x5.63 MW Lakdanavi 4x5 MW Northern Power 8x6.13 MW Asia Power
0.133
2019 - 1x250 MW Trinco Coal Power plant
5x17 MW Kelanitissa Gas Turbines 4x18 MW Sapugaskanda diesel
0.183
2020 - 1x300 MW Coal plant - 0.106
2021 - 1x300 MW Coal plant - 0.067
2022 - 1x300 MW Coal plant - 0.048
2023 - 1x300 MW Coal plant
163 MW AES Kelanitissa Combined Cycle Plant 115 MW Gas Turbine 4x9 MW Sapugaskanda Diesel Ext.
0.134
2024 49 MW Gin Ganga 1x300 MW Coal plant - 0.074
2025 - 1x300 MW Coal plant 4x9 MW Sapugaskanda Diesel Ext. 0.073
2026 - - - 0.268
2027 - 1x300 MW Coal plant - 0.241
2028 - - - 0.648
2029 - 1x300 MW Coal plant - 0.633
2030 - 1x300 MW Coal plant - 0.654
2031 - 1x300 MW Coal plant - 0.697
2032 - 1x300 MW Coal plant - 0.775
Total PV Cost up to year 2032, US$ 18,531.594 million [LKR 2,110,741.14 million]
Notes: • Discount rate 10%, Exchange Rate as an average of January 2012 (US$ 1 = LKR. 113.9) • All additions/retirements are carried out at the beginning of each year • Committed plants are shown in Italics • Above PV cost includes the cost of Projected NCRE, US$ 689.98 million and five year IPP extension
cost (ACE Matara, ACE Horana and Lakdanavi), US$ 9.83 million. • All plant capacities are given in gross values.
** Year of connection to national grid based on the estimated time schedule of Kilinochchi-Chunnakkam Tx line.
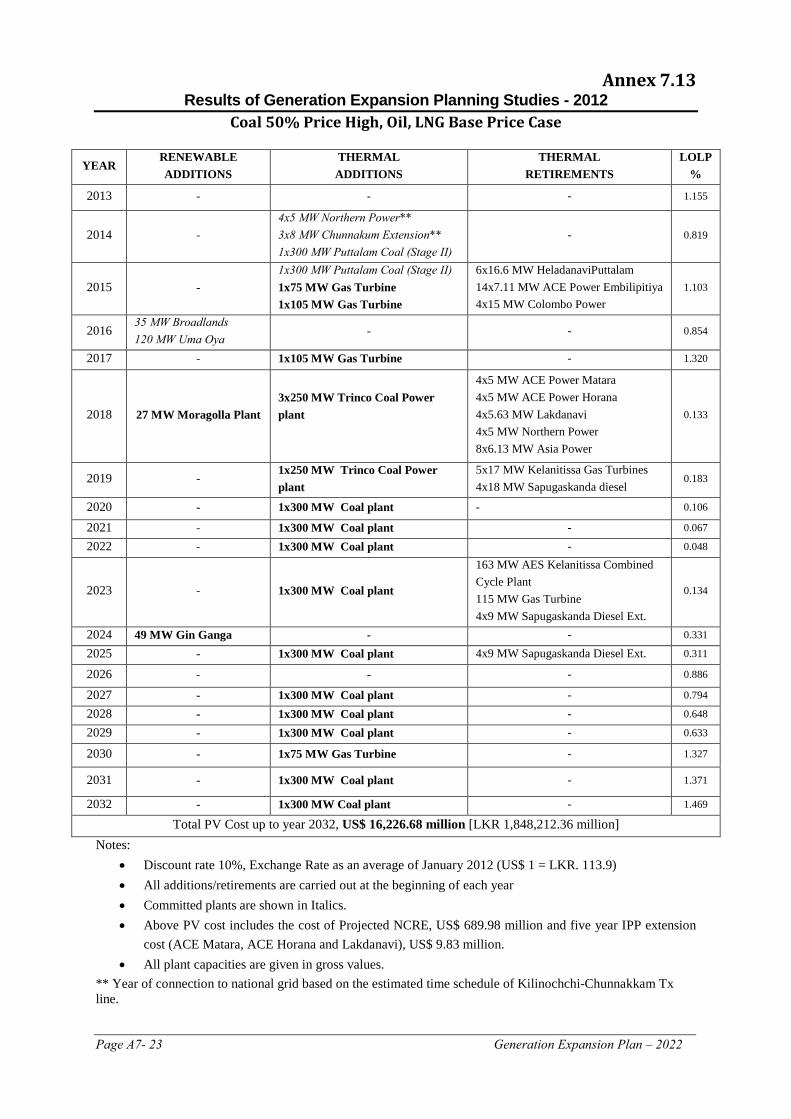
Page A7- 23 Generation Expansion Plan – 2022
Annex 7.13 Results of Generation Expansion Planning Studies - 2012
Coal 50% Price High, Oil, LNG Base Price Case
YEAR RENEWABLE ADDITIONS
THERMAL ADDITIONS
THERMAL RETIREMENTS
LOLP %
2013 - - - 1.155
2014 - 4x5 MW Northern Power** 3x8 MW Chunnakum Extension** 1x300 MW Puttalam Coal (Stage II)
- 0.819
2015 - 1x300 MW Puttalam Coal (Stage II) 1x75 MW Gas Turbine 1x10⁵ MW Gas Turbine
6x16.6 MW HeladanaviPuttalam 14x7.11 MW ACE Power Embilipitiya 4x15 MW Colombo Power
1.103
2016 35 MW Broadlands 120 MW Uma Oya
- - 0.854
2017 - 1x10⁵ MW Gas Turbine - 1.320
2018 27 MW Moragolla Plant 3x250 MW Trinco Coal Power plant
4x5 MW ACE Power Matara 4x5 MW ACE Power Horana 4x5.63 MW Lakdanavi 4x5 MW Northern Power 8x6.13 MW Asia Power
0.133
2019 - 1x250 MW Trinco Coal Power plant
5x17 MW Kelanitissa Gas Turbines 4x18 MW Sapugaskanda diesel
0.183
2020 - 1x300 MW Coal plant - 0.106
2021 - 1x300 MW Coal plant - 0.067
2022 - 1x300 MW Coal plant - 0.048
2023 - 1x300 MW Coal plant
163 MW AES Kelanitissa Combined Cycle Plant 115 MW Gas Turbine 4x9 MW Sapugaskanda Diesel Ext.
0.134
2024 49 MW Gin Ganga - - 0.331
2025 - 1x300 MW Coal plant 4x9 MW Sapugaskanda Diesel Ext. 0.311
2026 - - - 0.886
2027 - 1x300 MW Coal plant - 0.794
2028 - 1x300 MW Coal plant - 0.648
2029 - 1x300 MW Coal plant - 0.633
2030 - 1x75 MW Gas Turbine - 1.327
2031 - 1x300 MW Coal plant - 1.371
2032 - 1x300 MW Coal plant - 1.469
Total PV Cost up to year 2032, US$ 16,226.68 million [LKR 1,848,212.36 million] Notes:
• Discount rate 10%, Exchange Rate as an average of January 2012 (US$ 1 = LKR. 113.9) • All additions/retirements are carried out at the beginning of each year • Committed plants are shown in Italics. • Above PV cost includes the cost of Projected NCRE, US$ 689.98 million and five year IPP extension
cost (ACE Matara, ACE Horana and Lakdanavi), US$ 9.83 million. • All plant capacities are given in gross values.
** Year of connection to national grid based on the estimated time schedule of Kilinochchi-Chunnakkam Tx line.
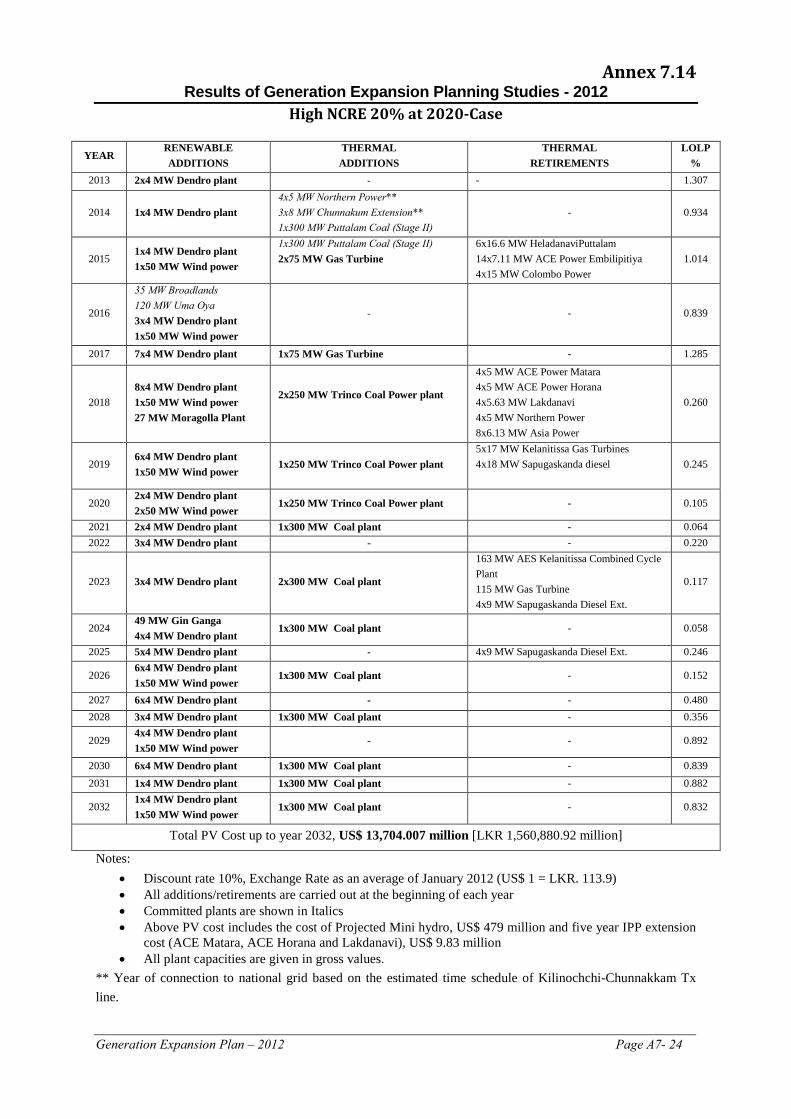
Generation Expansion Plan – 2012 Page A7- 24
Annex 7.14 Results of Generation Expansion Planning Studies - 2012
High NCRE 20% at 2020-Case
YEAR RENEWABLE ADDITIONS
THERMAL ADDITIONS
THERMAL RETIREMENTS
LOLP %
2013 2x4 MW Dendro plant - - 1.307
2014 1x4 MW Dendro plant 4x5 MW Northern Power** 3x8 MW Chunnakum Extension** 1x300 MW Puttalam Coal (Stage II)
- 0.934
2015 1x4 MW Dendro plant 1x50 MW Wind power
1x300 MW Puttalam Coal (Stage II) 2x75 MW Gas Turbine
6x16.6 MW HeladanaviPuttalam 14x7.11 MW ACE Power Embilipitiya 4x15 MW Colombo Power
1.014
2016
35 MW Broadlands 120 MW Uma Oya 3x4 MW Dendro plant 1x50 MW Wind power
- - 0.839
2017 7x4 MW Dendro plant 1x75 MW Gas Turbine - 1.285
2018 8x4 MW Dendro plant 1x50 MW Wind power 27 MW Moragolla Plant
2x250 MW Trinco Coal Power plant
4x5 MW ACE Power Matara 4x5 MW ACE Power Horana 4x5.63 MW Lakdanavi 4x5 MW Northern Power 8x6.13 MW Asia Power
0.260
2019 6x4 MW Dendro plant 1x50 MW Wind power
1x250 MW Trinco Coal Power plant 5x17 MW Kelanitissa Gas Turbines 4x18 MW Sapugaskanda diesel
0.245
2020 2x4 MW Dendro plant 2x50 MW Wind power
1x250 MW Trinco Coal Power plant - 0.105
2021 2x4 MW Dendro plant 1x300 MW Coal plant - 0.064 2022 3x4 MW Dendro plant - - 0.220
2023 3x4 MW Dendro plant 2x300 MW Coal plant
163 MW AES Kelanitissa Combined Cycle Plant 115 MW Gas Turbine 4x9 MW Sapugaskanda Diesel Ext.
0.117
2024 49 MW Gin Ganga 4x4 MW Dendro plant
1x300 MW Coal plant - 0.058
2025 5x4 MW Dendro plant - 4x9 MW Sapugaskanda Diesel Ext. 0.246
2026 6x4 MW Dendro plant 1x50 MW Wind power
1x300 MW Coal plant - 0.152
2027 6x4 MW Dendro plant - - 0.480 2028 3x4 MW Dendro plant 1x300 MW Coal plant - 0.356
2029 4x4 MW Dendro plant 1x50 MW Wind power
- - 0.892
2030 6x4 MW Dendro plant 1x300 MW Coal plant - 0.839 2031 1x4 MW Dendro plant 1x300 MW Coal plant - 0.882
2032 1x4 MW Dendro plant 1x50 MW Wind power
1x300 MW Coal plant - 0.832
Total PV Cost up to year 2032, US$ 13,704.007 million [LKR 1,560,880.92 million]
Notes: • Discount rate 10%, Exchange Rate as an average of January 2012 (US$ 1 = LKR. 113.9) • All additions/retirements are carried out at the beginning of each year • Committed plants are shown in Italics • Above PV cost includes the cost of Projected Mini hydro, US$ 479 million and five year IPP extension
cost (ACE Matara, ACE Horana and Lakdanavi), US$ 9.83 million • All plant capacities are given in gross values.
** Year of connection to national grid based on the estimated time schedule of Kilinochchi-Chunnakkam Tx line.
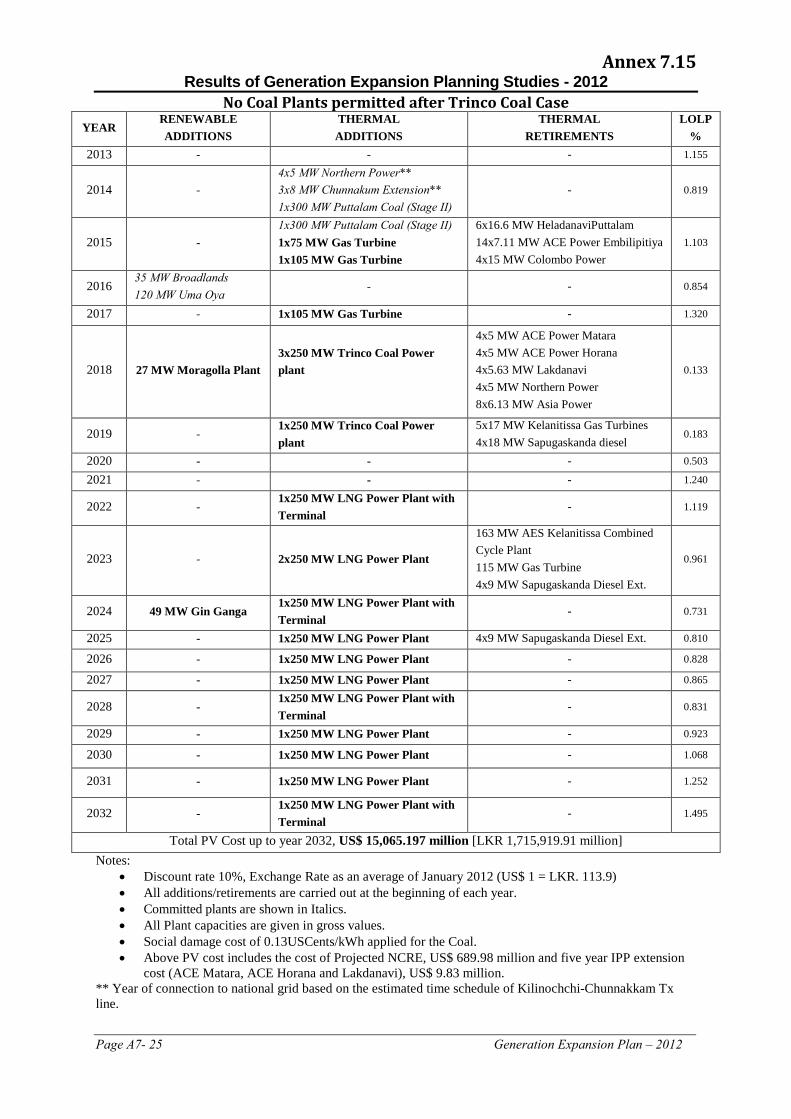
Page A7- 25 Generation Expansion Plan – 2012
Annex 7.15
Results of Generation Expansion Planning Studies - 2012 No Coal Plants permitted after Trinco Coal Case
YEAR RENEWABLE ADDITIONS
THERMAL ADDITIONS
THERMAL RETIREMENTS
LOLP %
2013 - - - 1.155
2014 - 4x5 MW Northern Power** 3x8 MW Chunnakum Extension** 1x300 MW Puttalam Coal (Stage II)
- 0.819
2015 - 1x300 MW Puttalam Coal (Stage II) 1x75 MW Gas Turbine 1x10⁵ MW Gas Turbine
6x16.6 MW HeladanaviPuttalam 14x7.11 MW ACE Power Embilipitiya 4x15 MW Colombo Power
1.103
2016 35 MW Broadlands 120 MW Uma Oya
- - 0.854
2017 - 1x10⁵ MW Gas Turbine - 1.320
2018 27 MW Moragolla Plant 3x250 MW Trinco Coal Power plant
4x5 MW ACE Power Matara 4x5 MW ACE Power Horana 4x5.63 MW Lakdanavi 4x5 MW Northern Power 8x6.13 MW Asia Power
0.133
2019 - 1x250 MW Trinco Coal Power plant
5x17 MW Kelanitissa Gas Turbines 4x18 MW Sapugaskanda diesel
0.183
2020 - - - 0.503
2021 - - - 1.240
2022 - 1x250 MW LNG Power Plant with Terminal
- 1.119
2023 - 2x250 MW LNG Power Plant
163 MW AES Kelanitissa Combined Cycle Plant 115 MW Gas Turbine 4x9 MW Sapugaskanda Diesel Ext.
0.961
2024 49 MW Gin Ganga 1x250 MW LNG Power Plant with Terminal
- 0.731
2025 - 1x250 MW LNG Power Plant 4x9 MW Sapugaskanda Diesel Ext. 0.810
2026 - 1x250 MW LNG Power Plant - 0.828
2027 - 1x250 MW LNG Power Plant - 0.865
2028 - 1x250 MW LNG Power Plant with Terminal
- 0.831
2029 - 1x250 MW LNG Power Plant - 0.923
2030 - 1x250 MW LNG Power Plant - 1.068
2031 - 1x250 MW LNG Power Plant - 1.252
2032 - 1x250 MW LNG Power Plant with Terminal
- 1.495
Total PV Cost up to year 2032, US$ 15,065.197 million [LKR 1,715,919.91 million]
Notes: • Discount rate 10%, Exchange Rate as an average of January 2012 (US$ 1 = LKR. 113.9) • All additions/retirements are carried out at the beginning of each year. • Committed plants are shown in Italics. • All Plant capacities are given in gross values. • Social damage cost of 0.13USCents/kWh applied for the Coal. • Above PV cost includes the cost of Projected NCRE, US$ 689.98 million and five year IPP extension
cost (ACE Matara, ACE Horana and Lakdanavi), US$ 9.83 million. ** Year of connection to national grid based on the estimated time schedule of Kilinochchi-Chunnakkam Tx line.
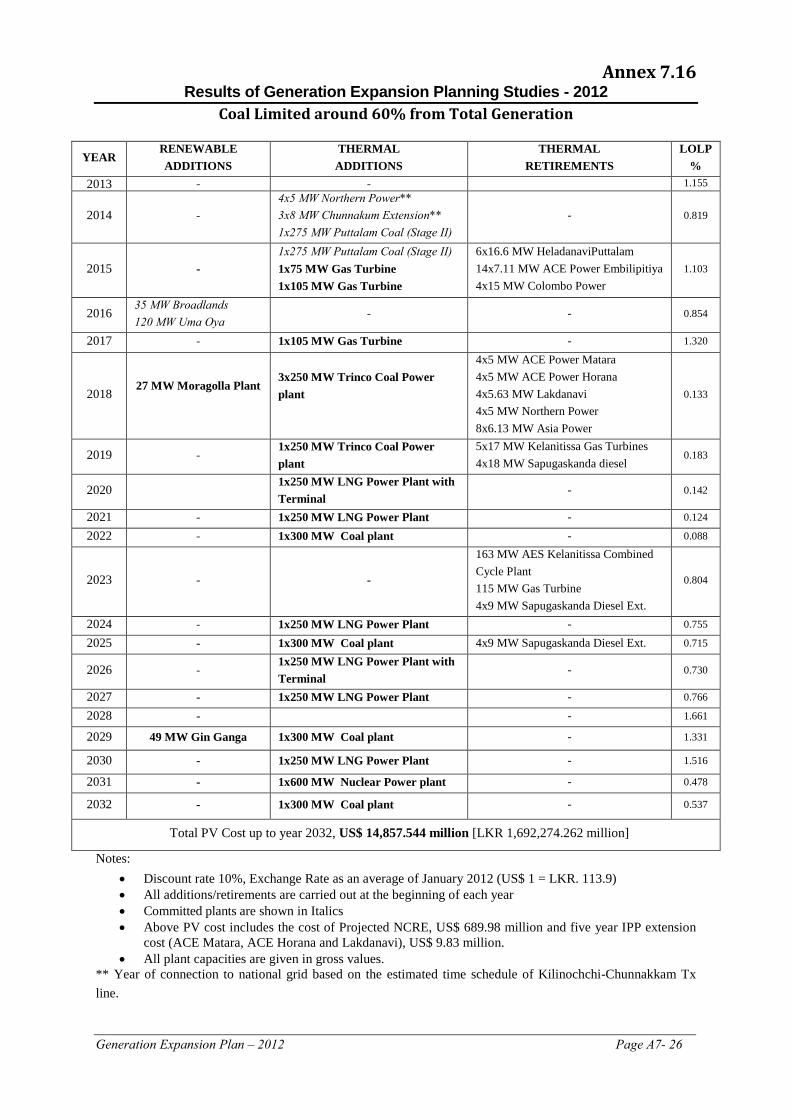
Generation Expansion Plan – 2012 Page A7- 26
Annex 7.16 Results of Generation Expansion Planning Studies - 2012
Coal Limited around 60% from Total Generation
YEAR RENEWABLE ADDITIONS
THERMAL ADDITIONS
THERMAL RETIREMENTS
LOLP %
2013 - -
1.155
2014 - 4x5 MW Northern Power** 3x8 MW Chunnakum Extension** 1x275 MW Puttalam Coal (Stage II)
- 0.819
2015 - 1x275 MW Puttalam Coal (Stage II) 1x75 MW Gas Turbine 1x10⁵ MW Gas Turbine
6x16.6 MW HeladanaviPuttalam 14x7.11 MW ACE Power Embilipitiya 4x15 MW Colombo Power
1.103
2016 35 MW Broadlands 120 MW Uma Oya
- - 0.854
2017 - 1x10⁵ MW Gas Turbine - 1.320
2018 27 MW Moragolla Plant
3x250 MW Trinco Coal Power plant
4x5 MW ACE Power Matara 4x5 MW ACE Power Horana 4x5.63 MW Lakdanavi 4x5 MW Northern Power 8x6.13 MW Asia Power
0.133
2019 - 1x250 MW Trinco Coal Power plant
5x17 MW Kelanitissa Gas Turbines 4x18 MW Sapugaskanda diesel
0.183
2020 1x250 MW LNG Power Plant with Terminal
- 0.142
2021 - 1x250 MW LNG Power Plant - 0.124
2022 - 1x300 MW Coal plant - 0.088
2023 - -
163 MW AES Kelanitissa Combined Cycle Plant 115 MW Gas Turbine 4x9 MW Sapugaskanda Diesel Ext.
0.804
2024 - 1x250 MW LNG Power Plant - 0.755
2025 - 1x300 MW Coal plant 4x9 MW Sapugaskanda Diesel Ext. 0.715
2026 - 1x250 MW LNG Power Plant with Terminal
- 0.730
2027 - 1x250 MW LNG Power Plant - 0.766
2028 - - 1.661
2029 49 MW Gin Ganga 1x300 MW Coal plant - 1.331
2030 - 1x250 MW LNG Power Plant - 1.516
2031 - 1x600 MW Nuclear Power plant - 0.478
2032 - 1x300 MW Coal plant - 0.537
Total PV Cost up to year 2032, US$ 14,857.544 million [LKR 1,692,274.262 million]
Notes: • Discount rate 10%, Exchange Rate as an average of January 2012 (US$ 1 = LKR. 113.9) • All additions/retirements are carried out at the beginning of each year • Committed plants are shown in Italics • Above PV cost includes the cost of Projected NCRE, US$ 689.98 million and five year IPP extension
cost (ACE Matara, ACE Horana and Lakdanavi), US$ 9.83 million. • All plant capacities are given in gross values.
** Year of connection to national grid based on the estimated time schedule of Kilinochchi-Chunnakkam Tx line.

Page A7- 27 Generation Expansion Plan – 2012
Annex 7.17 Results of Generation Expansion Planning Studies - 2012
Dendro Candidate with Local Fuel Concession Case
YEAR
RENEWABLE ADDITIONS
THERMAL ADDITIONS
THERMAL RETIREMENTS
LOLP %
2013 2x4 MW Dendro plant - - 1.123
2014 1x4 MW Dendro plant 4x5 MW Northern Power** 3x8 MW Chunnakum Extension** 1x300 MW Puttalam Coal (Stage II)
- 0.801
2015 5x4 MW Dendro plant 1x300 MW Puttalam Coal (Stage II) 2x75 MW Gas Turbine
6x16.6 MW HeladanaviPuttalam 14x7.11 MW ACE Power Embilipitiya 4x15 MW Colombo Power
1.162
2016 35 MW Broadlands 120 MW Uma Oya 7x4 MW Dendro plant
- - 0.791
2017 7x4 MW Dendro plant 1x75MW Gas Turbine - 1.284
2018
27 MW Moragolla Plant 6x4 MW Dendro plant
3x250 MW Trinco Coal Power plant
4x5 MW ACE Power Matara 4x5 MW ACE Power Horana 4x5.63 MW Lakdanavi 4x5 MW Northern Power 8x6.13 MW Asia Power
0.113
2019 - 1x250 MW Trinco Coal Power plant 5x17 MW Kelanitissa Gas Turbines 4x18 MW Sapugaskanda diesel
0.160
2020 - 1x300 MW Coal plant - 0.094
2021 - 1x300 MW Coal plant - 0.061
2022 - 1x300 MW Coal plant - 0.045
2023 - 1x300 MW Coal plant
163 MW AES Kelanitissa Combined Cycle Plant 115 MW Gas Turbine 4x9 MW Sapugaskanda Diesel Ext.
0.128
2024 49MW Gin Ganga - - 0.326
2025 - 1x300 MW Coal plant 4x9 MW Sapugaskanda Diesel Ext. 0.313
2026 - 1x300 MW Coal plant - 0.275
2027 - - - 0.823
2028 - 1x300 MW Coal plant - 0.686
2029 - 1x300 MW Coal plant - 0.679
2030 - 1x300 MW Coal plant - 0.709
2031 - 1x300 MW Coal plant - 0.764
2032 - 1x10⁵ MW Gas Turbine - 1.469
Total PV Cost up to year 2032, US$ 13,625.885 million [LKR 1,551,982.85 million]
Notes: • Discount rate 10%, Exchange Rate as an average of January 2012 (US$ 1 = LKR. 113.9) • All additions/retirements are carried out at the beginning of each year • Committed plants are shown in Italics • Above PV cost includes the cost of Projected NCRE, US$ 689.98 million and five year IPP extension
cost (ACE Matara, ACE Horana and Lakdanavi), US$ 9.83 million. • All plant capacities are given in gross values.
** Year of connection to national grid based on the estimated time schedule of Kilinochchi-Chunnakkam Tx line.
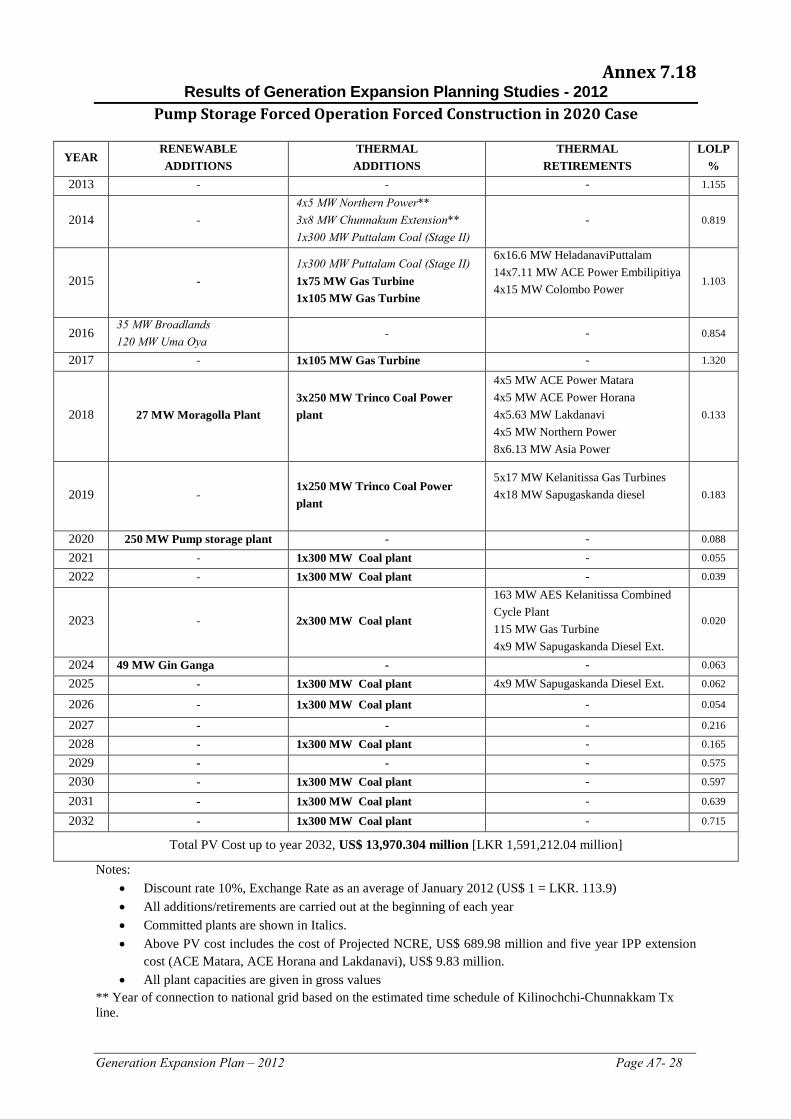
Generation Expansion Plan – 2012 Page A7- 28
Annex 7.18 Results of Generation Expansion Planning Studies - 2012
Pump Storage Forced Operation Forced Construction in 2020 Case
YEAR RENEWABLE ADDITIONS
THERMAL ADDITIONS
THERMAL RETIREMENTS
LOLP %
2013 - - - 1.155
2014 - 4x5 MW Northern Power** 3x8 MW Chunnakum Extension** 1x300 MW Puttalam Coal (Stage II)
- 0.819
2015 - 1x300 MW Puttalam Coal (Stage II) 1x75 MW Gas Turbine 1x10⁵ MW Gas Turbine
6x16.6 MW HeladanaviPuttalam 14x7.11 MW ACE Power Embilipitiya 4x15 MW Colombo Power
1.103
2016 35 MW Broadlands 120 MW Uma Oya
- - 0.854
2017 - 1x10⁵ MW Gas Turbine - 1.320
2018 27 MW Moragolla Plant 3x250 MW Trinco Coal Power plant
4x5 MW ACE Power Matara 4x5 MW ACE Power Horana 4x5.63 MW Lakdanavi 4x5 MW Northern Power 8x6.13 MW Asia Power
0.133
2019 -
1x250 MW Trinco Coal Power plant
5x17 MW Kelanitissa Gas Turbines 4x18 MW Sapugaskanda diesel
0.183
2020 250 MW Pump storage plant - - 0.088
2021 - 1x300 MW Coal plant - 0.055
2022 - 1x300 MW Coal plant - 0.039
2023 - 2x300 MW Coal plant
163 MW AES Kelanitissa Combined Cycle Plant 115 MW Gas Turbine 4x9 MW Sapugaskanda Diesel Ext.
0.020
2024 49 MW Gin Ganga - - 0.063
2025 - 1x300 MW Coal plant 4x9 MW Sapugaskanda Diesel Ext. 0.062
2026 - 1x300 MW Coal plant - 0.054
2027 - - - 0.216
2028 - 1x300 MW Coal plant - 0.165
2029 - - - 0.575
2030 - 1x300 MW Coal plant - 0.597
2031 - 1x300 MW Coal plant - 0.639
2032 - 1x300 MW Coal plant - 0.715
Total PV Cost up to year 2032, US$ 13,970.304 million [LKR 1,591,212.04 million]
Notes: • Discount rate 10%, Exchange Rate as an average of January 2012 (US$ 1 = LKR. 113.9) • All additions/retirements are carried out at the beginning of each year • Committed plants are shown in Italics. • Above PV cost includes the cost of Projected NCRE, US$ 689.98 million and five year IPP extension
cost (ACE Matara, ACE Horana and Lakdanavi), US$ 9.83 million. • All plant capacities are given in gross values
** Year of connection to national grid based on the estimated time schedule of Kilinochchi-Chunnakkam Tx line.
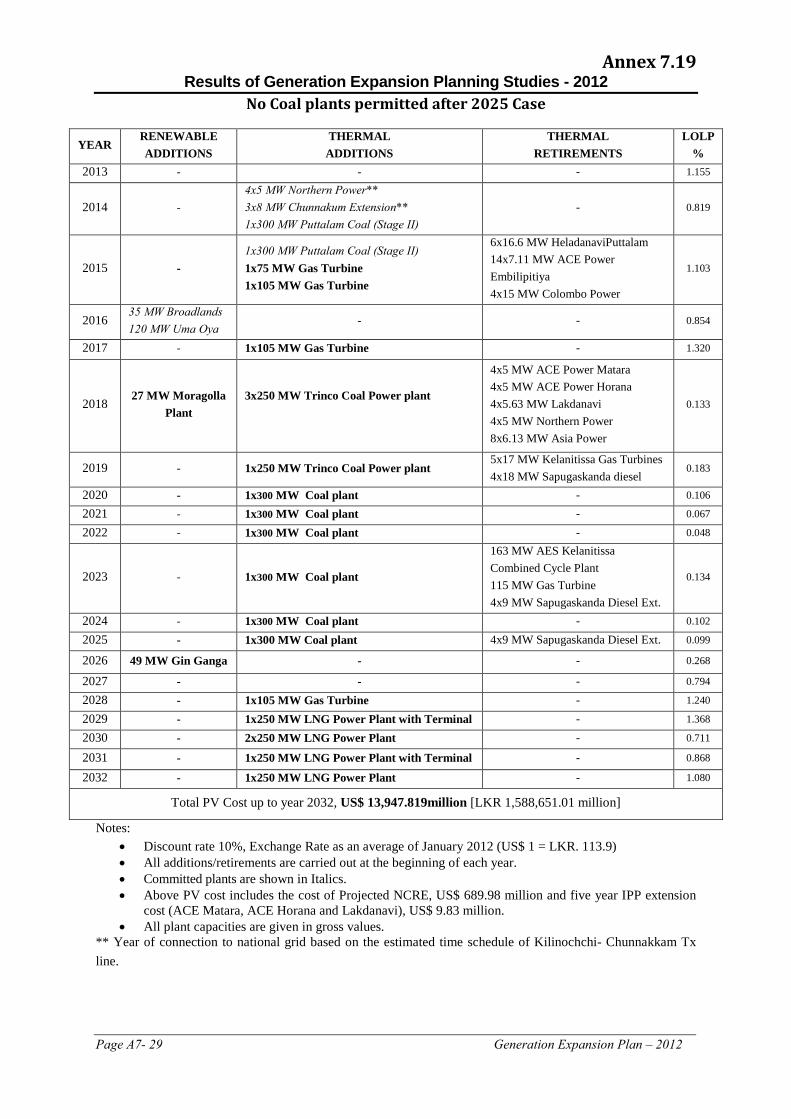
Page A7- 29 Generation Expansion Plan – 2012
Annex 7.19
Results of Generation Expansion Planning Studies - 2012 No Coal plants permitted after 2025 Case
YEAR RENEWABLE ADDITIONS
THERMAL ADDITIONS
THERMAL RETIREMENTS
LOLP %
2013 - - - 1.155
2014 - 4x5 MW Northern Power** 3x8 MW Chunnakum Extension** 1x300 MW Puttalam Coal (Stage II)
- 0.819
2015 - 1x300 MW Puttalam Coal (Stage II) 1x75 MW Gas Turbine 1x10⁵ MW Gas Turbine
6x16.6 MW HeladanaviPuttalam 14x7.11 MW ACE Power Embilipitiya 4x15 MW Colombo Power
1.103
2016 35 MW Broadlands 120 MW Uma Oya
- - 0.854
2017 - 1x10⁵ MW Gas Turbine - 1.320
2018 27 MW Moragolla
Plant 3x250 MW Trinco Coal Power plant
4x5 MW ACE Power Matara 4x5 MW ACE Power Horana 4x5.63 MW Lakdanavi 4x5 MW Northern Power 8x6.13 MW Asia Power
0.133
2019 - 1x250 MW Trinco Coal Power plant 5x17 MW Kelanitissa Gas Turbines 4x18 MW Sapugaskanda diesel
0.183
2020 - 1x300 MW Coal plant - 0.106
2021 - 1x300 MW Coal plant - 0.067
2022 - 1x300 MW Coal plant - 0.048
2023 - 1x300 MW Coal plant
163 MW AES Kelanitissa Combined Cycle Plant 115 MW Gas Turbine 4x9 MW Sapugaskanda Diesel Ext.
0.134
2024 - 1x300 MW Coal plant - 0.102
2025 - 1x300 MW Coal plant 4x9 MW Sapugaskanda Diesel Ext. 0.099
2026 49 MW Gin Ganga - - 0.268
2027 - - - 0.794
2028 - 1x10⁵ MW Gas Turbine - 1.240
2029 - 1x250 MW LNG Power Plant with Terminal - 1.368
2030 - 2x250 MW LNG Power Plant - 0.711
2031 - 1x250 MW LNG Power Plant with Terminal - 0.868
2032 - 1x250 MW LNG Power Plant - 1.080
Total PV Cost up to year 2032, US$ 13,947.819million [LKR 1,588,651.01 million]
Notes: • Discount rate 10%, Exchange Rate as an average of January 2012 (US$ 1 = LKR. 113.9) • All additions/retirements are carried out at the beginning of each year. • Committed plants are shown in Italics. • Above PV cost includes the cost of Projected NCRE, US$ 689.98 million and five year IPP extension
cost (ACE Matara, ACE Horana and Lakdanavi), US$ 9.83 million. • All plant capacities are given in gross values.
** Year of connection to national grid based on the estimated time schedule of Kilinochchi- Chunnakkam Tx line.
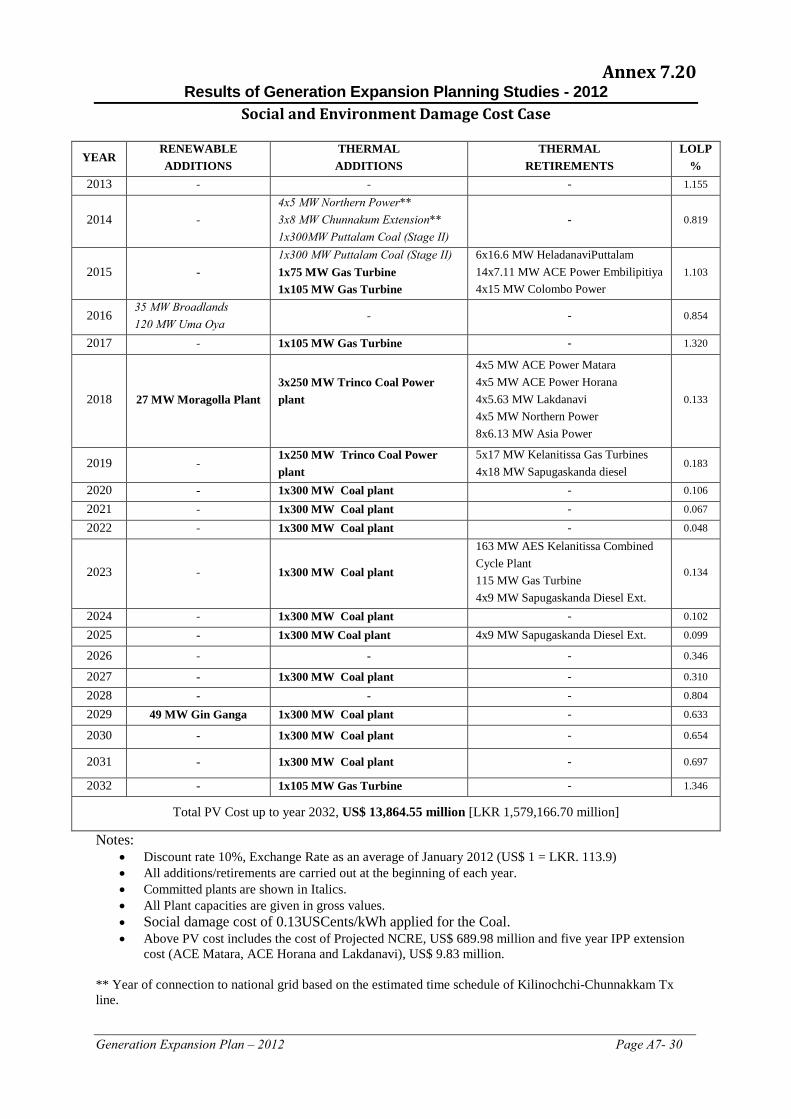
Generation Expansion Plan – 2012 Page A7- 30
Annex 7.20 Results of Generation Expansion Planning Studies - 2012
Social and Environment Damage Cost Case
YEAR RENEWABLE ADDITIONS
THERMAL ADDITIONS
THERMAL RETIREMENTS
LOLP %
2013 - - - 1.155
2014 - 4x5 MW Northern Power** 3x8 MW Chunnakum Extension** 1x300MW Puttalam Coal (Stage II)
- 0.819
2015 - 1x300 MW Puttalam Coal (Stage II) 1x75 MW Gas Turbine 1x10⁵ MW Gas Turbine
6x16.6 MW HeladanaviPuttalam 14x7.11 MW ACE Power Embilipitiya 4x15 MW Colombo Power
1.103
2016 35 MW Broadlands 120 MW Uma Oya
- - 0.854
2017 - 1x10⁵ MW Gas Turbine - 1.320
2018 27 MW Moragolla Plant 3x250 MW Trinco Coal Power plant
4x5 MW ACE Power Matara 4x5 MW ACE Power Horana 4x5.63 MW Lakdanavi 4x5 MW Northern Power 8x6.13 MW Asia Power
0.133
2019 - 1x250 MW Trinco Coal Power plant
5x17 MW Kelanitissa Gas Turbines 4x18 MW Sapugaskanda diesel
0.183
2020 - 1x300 MW Coal plant - 0.106
2021 - 1x300 MW Coal plant - 0.067
2022 - 1x300 MW Coal plant - 0.048
2023 - 1x300 MW Coal plant
163 MW AES Kelanitissa Combined Cycle Plant 115 MW Gas Turbine 4x9 MW Sapugaskanda Diesel Ext.
0.134
2024 - 1x300 MW Coal plant - 0.102
2025 - 1x300 MW Coal plant 4x9 MW Sapugaskanda Diesel Ext. 0.099
2026 - - - 0.346
2027 - 1x300 MW Coal plant - 0.310
2028 - - - 0.804
2029 49 MW Gin Ganga 1x300 MW Coal plant - 0.633
2030 - 1x300 MW Coal plant - 0.654
2031 - 1x300 MW Coal plant - 0.697
2032 - 1x10⁵ MW Gas Turbine - 1.346
Total PV Cost up to year 2032, US$ 13,864.55 million [LKR 1,579,166.70 million]
Notes: • Discount rate 10%, Exchange Rate as an average of January 2012 (US$ 1 = LKR. 113.9) • All additions/retirements are carried out at the beginning of each year. • Committed plants are shown in Italics. • All Plant capacities are given in gross values. • Social damage cost of 0.13USCents/kWh applied for the Coal. • Above PV cost includes the cost of Projected NCRE, US$ 689.98 million and five year IPP extension
cost (ACE Matara, ACE Horana and Lakdanavi), US$ 9.83 million.
** Year of connection to national grid based on the estimated time schedule of Kilinochchi-Chunnakkam Tx line.
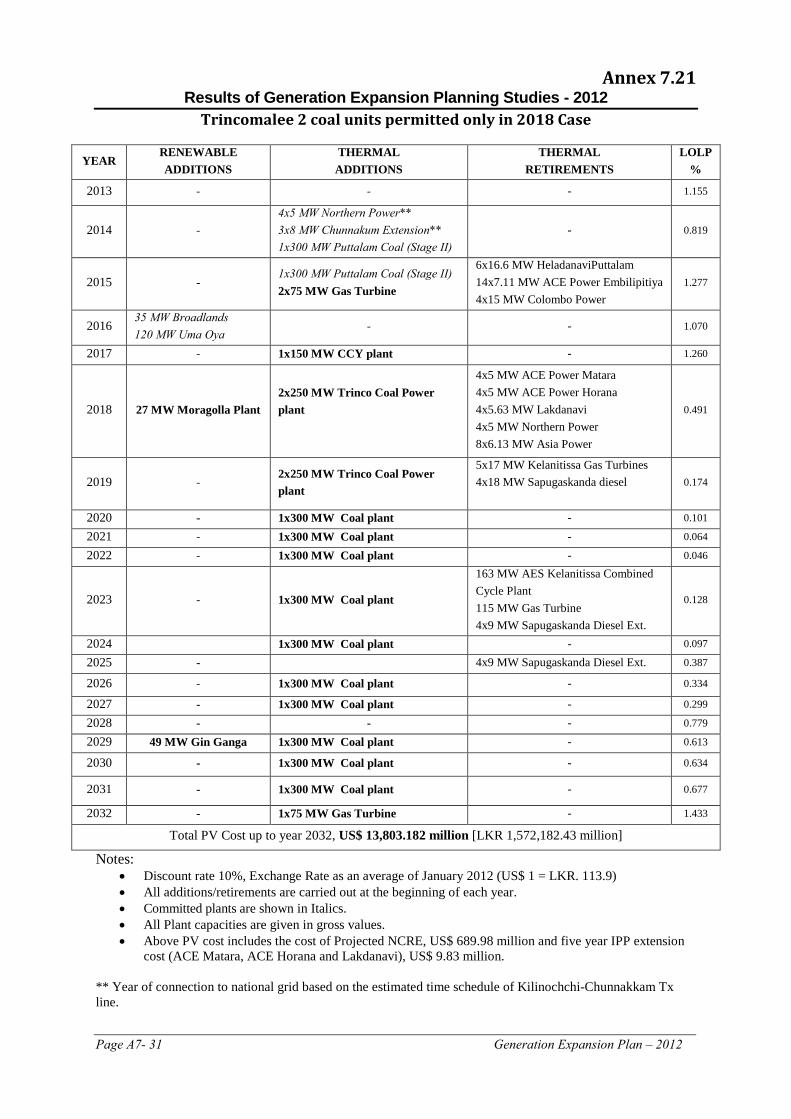
Page A7- 31 Generation Expansion Plan – 2012
Annex 7.21 Results of Generation Expansion Planning Studies - 2012
Trincomalee 2 coal units permitted only in 2018 Case
YEAR RENEWABLE ADDITIONS
THERMAL ADDITIONS
THERMAL RETIREMENTS
LOLP %
2013 - - - 1.155
2014 - 4x5 MW Northern Power** 3x8 MW Chunnakum Extension** 1x300 MW Puttalam Coal (Stage II)
- 0.819
2015 - 1x300 MW Puttalam Coal (Stage II) 2x75 MW Gas Turbine
6x16.6 MW HeladanaviPuttalam 14x7.11 MW ACE Power Embilipitiya 4x15 MW Colombo Power
1.277
2016 35 MW Broadlands 120 MW Uma Oya
- - 1.070
2017 - 1x150 MW CCY plant - 1.260
2018 27 MW Moragolla Plant 2x250 MW Trinco Coal Power plant
4x5 MW ACE Power Matara 4x5 MW ACE Power Horana 4x5.63 MW Lakdanavi 4x5 MW Northern Power 8x6.13 MW Asia Power
0.491
2019 - 2x250 MW Trinco Coal Power plant
5x17 MW Kelanitissa Gas Turbines 4x18 MW Sapugaskanda diesel
0.174
2020 - 1x300 MW Coal plant - 0.101
2021 - 1x300 MW Coal plant - 0.064
2022 - 1x300 MW Coal plant - 0.046
2023 - 1x300 MW Coal plant
163 MW AES Kelanitissa Combined Cycle Plant 115 MW Gas Turbine 4x9 MW Sapugaskanda Diesel Ext.
0.128
2024 1x300 MW Coal plant - 0.097
2025 - 4x9 MW Sapugaskanda Diesel Ext. 0.387
2026 - 1x300 MW Coal plant - 0.334
2027 - 1x300 MW Coal plant - 0.299
2028 - - - 0.779
2029 49 MW Gin Ganga 1x300 MW Coal plant - 0.613
2030 - 1x300 MW Coal plant - 0.634
2031 - 1x300 MW Coal plant - 0.677
2032 - 1x75 MW Gas Turbine - 1.433
Total PV Cost up to year 2032, US$ 13,803.182 million [LKR 1,572,182.43 million]
Notes: • Discount rate 10%, Exchange Rate as an average of January 2012 (US$ 1 = LKR. 113.9) • All additions/retirements are carried out at the beginning of each year. • Committed plants are shown in Italics. • All Plant capacities are given in gross values. • Above PV cost includes the cost of Projected NCRE, US$ 689.98 million and five year IPP extension
cost (ACE Matara, ACE Horana and Lakdanavi), US$ 9.83 million.
** Year of connection to national grid based on the estimated time schedule of Kilinochchi-Chunnakkam Tx line.
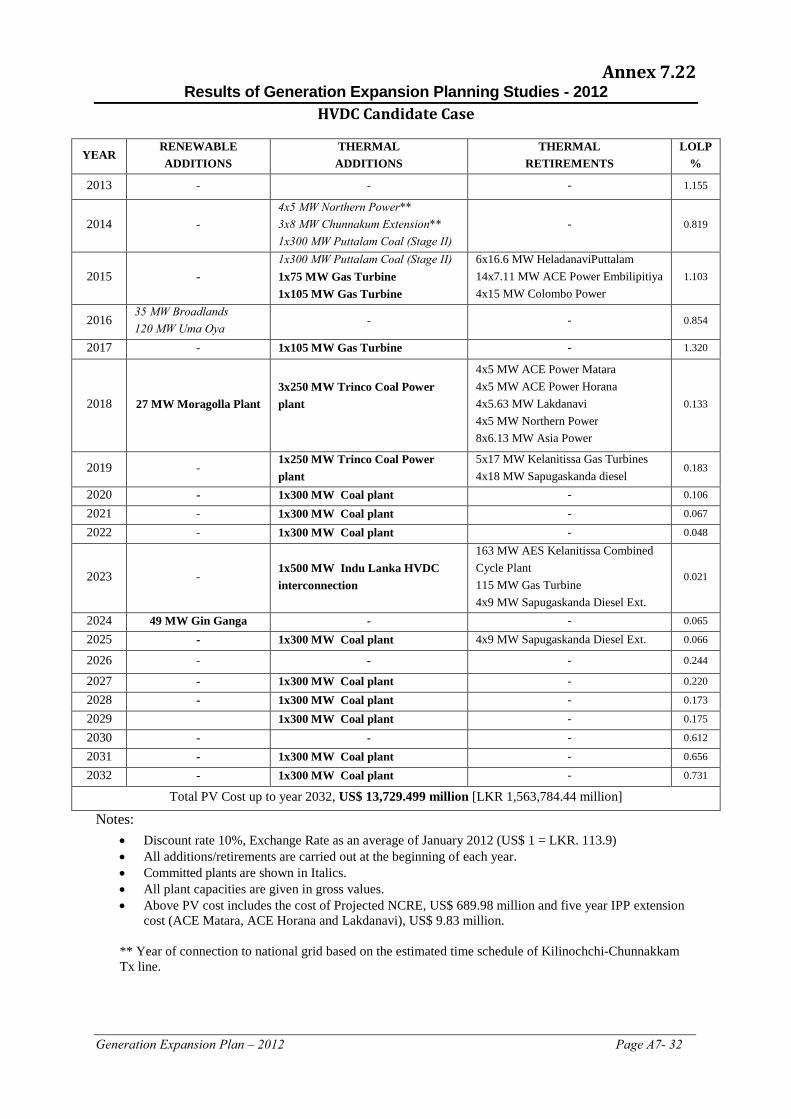
Generation Expansion Plan – 2012 Page A7- 32
Annex 7.22 Results of Generation Expansion Planning Studies - 2012
HVDC Candidate Case
YEAR RENEWABLE ADDITIONS
THERMAL ADDITIONS
THERMAL RETIREMENTS
LOLP %
2013 - - - 1.155
2014 - 4x5 MW Northern Power** 3x8 MW Chunnakum Extension** 1x300 MW Puttalam Coal (Stage II)
- 0.819
2015 - 1x300 MW Puttalam Coal (Stage II) 1x75 MW Gas Turbine 1x10⁵ MW Gas Turbine
6x16.6 MW HeladanaviPuttalam 14x7.11 MW ACE Power Embilipitiya 4x15 MW Colombo Power
1.103
2016 35 MW Broadlands 120 MW Uma Oya
- - 0.854
2017 - 1x10⁵ MW Gas Turbine - 1.320
2018 27 MW Moragolla Plant 3x250 MW Trinco Coal Power plant
4x5 MW ACE Power Matara 4x5 MW ACE Power Horana 4x5.63 MW Lakdanavi 4x5 MW Northern Power 8x6.13 MW Asia Power
0.133
2019 - 1x250 MW Trinco Coal Power plant
5x17 MW Kelanitissa Gas Turbines 4x18 MW Sapugaskanda diesel
0.183
2020 - 1x300 MW Coal plant - 0.106
2021 - 1x300 MW Coal plant - 0.067
2022 - 1x300 MW Coal plant - 0.048
2023 - 1x500 MW Indu Lanka HVDC interconnection
163 MW AES Kelanitissa Combined Cycle Plant 115 MW Gas Turbine 4x9 MW Sapugaskanda Diesel Ext.
0.021
2024 49 MW Gin Ganga - - 0.065
2025 - 1x300 MW Coal plant 4x9 MW Sapugaskanda Diesel Ext. 0.066
2026 - - - 0.244
2027 - 1x300 MW Coal plant - 0.220
2028 - 1x300 MW Coal plant - 0.173
2029 1x300 MW Coal plant - 0.175
2030 - - - 0.612
2031 - 1x300 MW Coal plant - 0.656
2032 - 1x300 MW Coal plant - 0.731
Total PV Cost up to year 2032, US$ 13,729.499 million [LKR 1,563,784.44 million]
Notes: • Discount rate 10%, Exchange Rate as an average of January 2012 (US$ 1 = LKR. 113.9) • All additions/retirements are carried out at the beginning of each year. • Committed plants are shown in Italics. • All plant capacities are given in gross values. • Above PV cost includes the cost of Projected NCRE, US$ 689.98 million and five year IPP extension
cost (ACE Matara, ACE Horana and Lakdanavi), US$ 9.83 million. ** Year of connection to national grid based on the estimated time schedule of Kilinochchi-Chunnakkam Tx line.
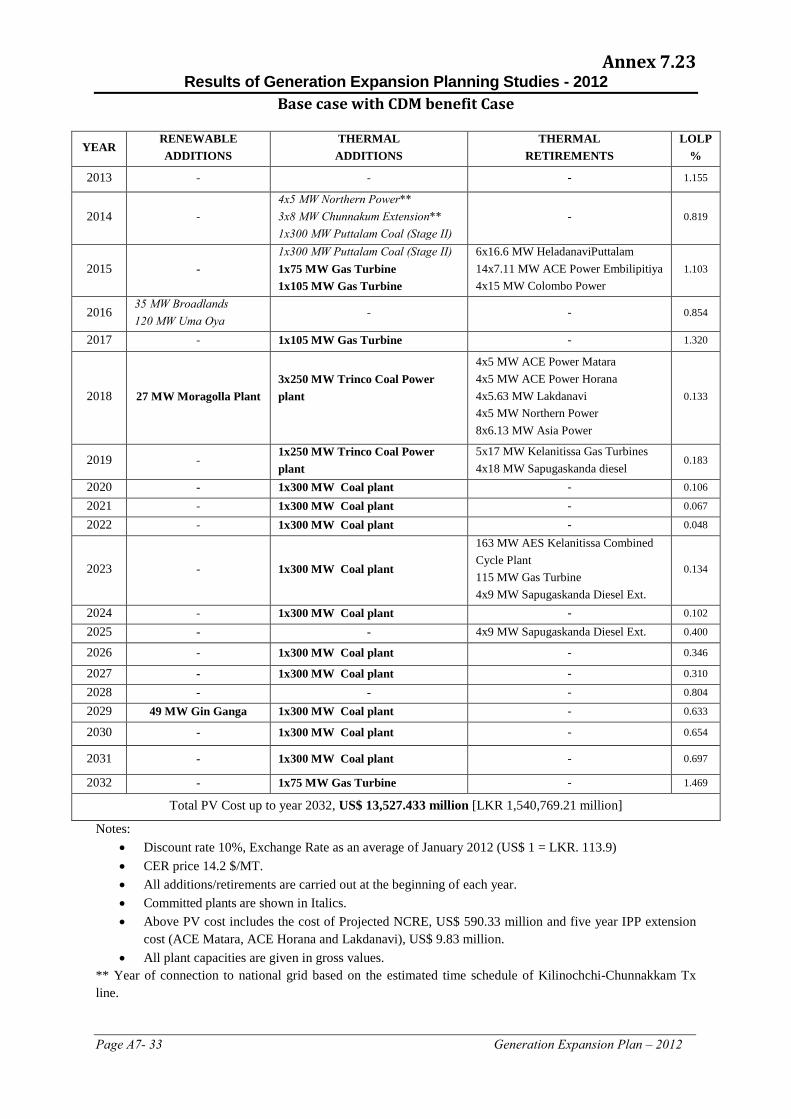
Page A7- 33 Generation Expansion Plan – 2012
Annex 7.23
Results of Generation Expansion Planning Studies - 2012 Base case with CDM benefit Case
YEAR
RENEWABLE ADDITIONS
THERMAL ADDITIONS
THERMAL RETIREMENTS
LOLP %
2013 - - - 1.155
2014 - 4x5 MW Northern Power** 3x8 MW Chunnakum Extension** 1x300 MW Puttalam Coal (Stage II)
- 0.819
2015 - 1x300 MW Puttalam Coal (Stage II) 1x75 MW Gas Turbine 1x10⁵ MW Gas Turbine
6x16.6 MW HeladanaviPuttalam 14x7.11 MW ACE Power Embilipitiya 4x15 MW Colombo Power
1.103
2016 35 MW Broadlands 120 MW Uma Oya
- - 0.854
2017 - 1x10⁵ MW Gas Turbine - 1.320
2018 27 MW Moragolla Plant 3x250 MW Trinco Coal Power plant
4x5 MW ACE Power Matara 4x5 MW ACE Power Horana 4x5.63 MW Lakdanavi 4x5 MW Northern Power 8x6.13 MW Asia Power
0.133
2019 - 1x250 MW Trinco Coal Power plant
5x17 MW Kelanitissa Gas Turbines 4x18 MW Sapugaskanda diesel
0.183
2020 - 1x300 MW Coal plant - 0.106
2021 - 1x300 MW Coal plant - 0.067
2022 - 1x300 MW Coal plant - 0.048
2023 - 1x300 MW Coal plant
163 MW AES Kelanitissa Combined Cycle Plant 115 MW Gas Turbine 4x9 MW Sapugaskanda Diesel Ext.
0.134
2024 - 1x300 MW Coal plant - 0.102
2025 - - 4x9 MW Sapugaskanda Diesel Ext. 0.400
2026 - 1x300 MW Coal plant - 0.346
2027 - 1x300 MW Coal plant - 0.310
2028 - - - 0.804
2029 49 MW Gin Ganga 1x300 MW Coal plant - 0.633
2030 - 1x300 MW Coal plant - 0.654
2031 - 1x300 MW Coal plant - 0.697
2032 - 1x75 MW Gas Turbine - 1.469
Total PV Cost up to year 2032, US$ 13,527.433 million [LKR 1,540,769.21 million]
Notes: • Discount rate 10%, Exchange Rate as an average of January 2012 (US$ 1 = LKR. 113.9) • CER price 14.2 $/MT. • All additions/retirements are carried out at the beginning of each year. • Committed plants are shown in Italics. • Above PV cost includes the cost of Projected NCRE, US$ 590.33 million and five year IPP extension
cost (ACE Matara, ACE Horana and Lakdanavi), US$ 9.83 million. • All plant capacities are given in gross values.
** Year of connection to national grid based on the estimated time schedule of Kilinochchi-Chunnakkam Tx line.
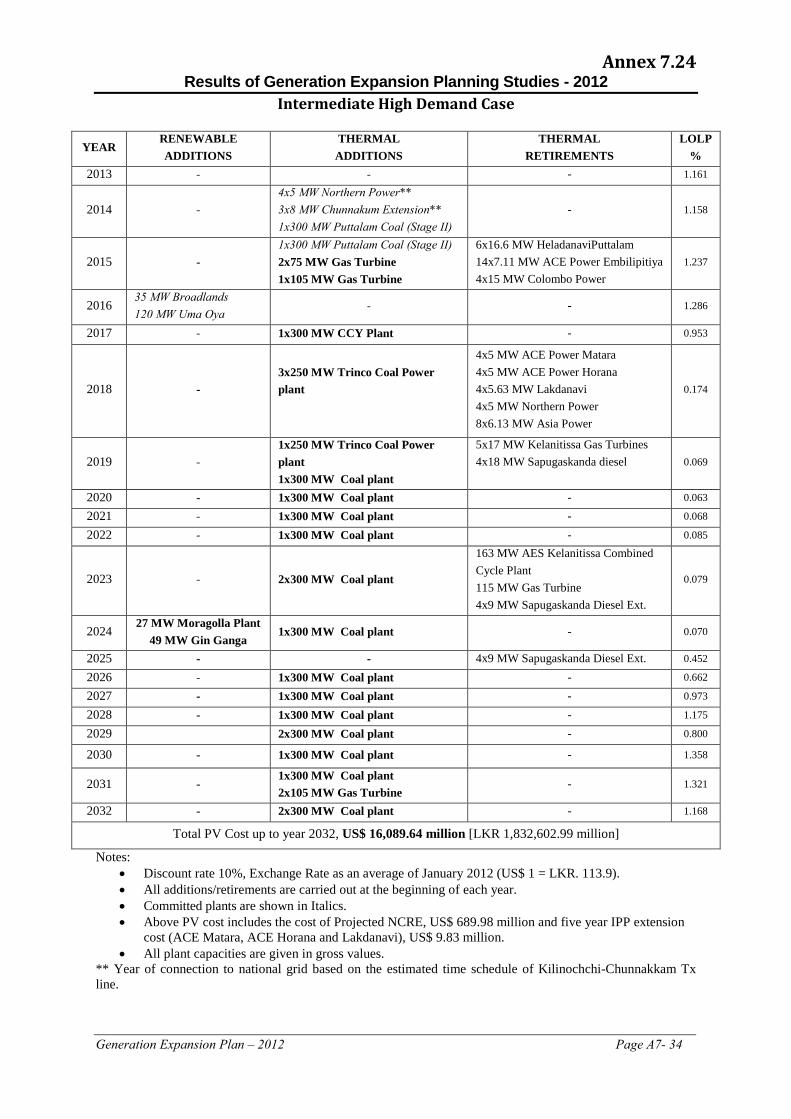
Generation Expansion Plan – 2012 Page A7- 34
Annex 7.24
Results of Generation Expansion Planning Studies - 2012 Intermediate High Demand Case
YEAR
RENEWABLE ADDITIONS
THERMAL ADDITIONS
THERMAL RETIREMENTS
LOLP %
2013 - - - 1.161
2014 - 4x5 MW Northern Power** 3x8 MW Chunnakum Extension** 1x300 MW Puttalam Coal (Stage II)
- 1.158
2015 - 1x300 MW Puttalam Coal (Stage II) 2x75 MW Gas Turbine 1x10⁵ MW Gas Turbine
6x16.6 MW HeladanaviPuttalam 14x7.11 MW ACE Power Embilipitiya 4x15 MW Colombo Power
1.237
2016 35 MW Broadlands 120 MW Uma Oya
- - 1.286
2017 - 1x300 MW CCY Plant - 0.953
2018 - 3x250 MW Trinco Coal Power plant
4x5 MW ACE Power Matara 4x5 MW ACE Power Horana 4x5.63 MW Lakdanavi 4x5 MW Northern Power 8x6.13 MW Asia Power
0.174
2019 - 1x250 MW Trinco Coal Power plant 1x300 MW Coal plant
5x17 MW Kelanitissa Gas Turbines 4x18 MW Sapugaskanda diesel
0.069
2020 - 1x300 MW Coal plant - 0.063
2021 - 1x300 MW Coal plant - 0.068
2022 - 1x300 MW Coal plant - 0.085
2023 - 2x300 MW Coal plant
163 MW AES Kelanitissa Combined Cycle Plant 115 MW Gas Turbine 4x9 MW Sapugaskanda Diesel Ext.
0.079
2024 27 MW Moragolla Plant
49 MW Gin Ganga 1x300 MW Coal plant - 0.070
2025 - - 4x9 MW Sapugaskanda Diesel Ext. 0.452
2026 - 1x300 MW Coal plant - 0.662
2027 - 1x300 MW Coal plant - 0.973
2028 - 1x300 MW Coal plant - 1.175
2029 2x300 MW Coal plant - 0.800
2030 - 1x300 MW Coal plant - 1.358
2031 - 1x300 MW Coal plant 2x10⁵ MW Gas Turbine
- 1.321
2032 - 2x300 MW Coal plant - 1.168
Total PV Cost up to year 2032, US$ 16,089.64 million [LKR 1,832,602.99 million]
Notes: • Discount rate 10%, Exchange Rate as an average of January 2012 (US$ 1 = LKR. 113.9). • All additions/retirements are carried out at the beginning of each year. • Committed plants are shown in Italics. • Above PV cost includes the cost of Projected NCRE, US$ 689.98 million and five year IPP extension
cost (ACE Matara, ACE Horana and Lakdanavi), US$ 9.83 million. • All plant capacities are given in gross values.
** Year of connection to national grid based on the estimated time schedule of Kilinochchi-Chunnakkam Tx line.
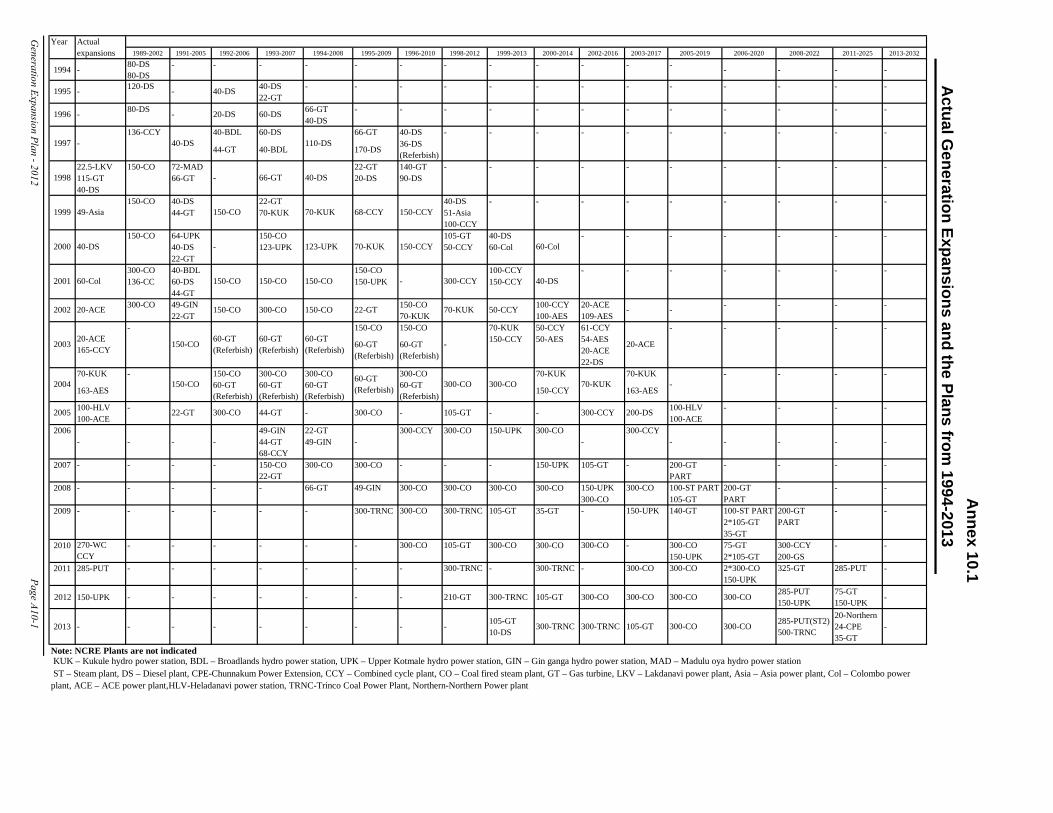
1989-2002 1991-2005 1992-2006 1993-2007 1994-2008 1995-2009 1996-2010 1998-2012 1999-2013 2000-2014 2002-2016 2003-2017 2005-2019 2006-2020 2008-2022 2011-2025 2013-2032
1994 - 80-DS 80-DS
- - - - - - - - - - - - - - - -
120-DS 40-DS - - - -22-GT
80-DS 66-GT - - - -40-DS
136-CCY 40-BDL 60-DS 66-GT 40-DS - - - -
44-GT 40-BDL 170-DS36-DS (Referbish)
22.5-LKV 150-CO 72-MAD 22-GT 140-GT - - - -115-GT 66-GT 20-DS 90-DS40-DS
150-CO 40-DS 22-GT 40-DS - - - -44-GT 70-KUK 51-Asia
100-CCY150-CO 64-UPK 150-CO 105-GT 40-DS - - - -
40-DS 123-UPK 50-CCY 60-Col22-GT
300-CO 40-BDL 150-CO 100-CCY - - - -136-CC 60-DS 150-UPK 150-CCY
44-GT300-CO 49-GIN 150-CO 100-CCY 20-ACE - - - -
22-GT 70-KUK 100-AES 109-AES- 150-CO 150-CO 70-KUK 50-CCY 61-CCY - - - -
150-CCY 50-AES 54-AES20-ACE22-DS
70-KUK - 150-CO 300-CO 300-CO 300-CO 70-KUK 70-KUK - - - -
163-AES 60-GT (Referbish)
60-GT (Referbish)
60-GT (Referbish)
60-GT (Referbish)
150-CCY 163-AES
100-HLV - 100-HLV - - - -100-ACE 100-ACE
2006 49-GIN 22-GT 300-CCY 300-CO 150-UPK 300-CO 300-CCY- - - - 44-GT 49-GIN - - - - - - -
68-CCY2007 - - - - 150-CO 300-CO 300-CO - - - 150-UPK 105-GT - 200-GT - - - -
22-GT PART2008 - - - - - 66-GT 49-GIN 300-CO 300-CO 300-CO 300-CO 150-UPK 300-CO 100-ST PART 200-GT - - -
300-CO 105-GT PART2009 - - - - - - 300-TRNC 300-CO 300-TRNC 105-GT 35-GT - 150-UPK 140-GT 100-ST PART 200-GT - -
2*105-GT PART35-GT
2010 - - - - - - 300-CO 105-GT 300-CO 300-CO 300-CO - 300-CO 75-GT 300-CCY - -150-UPK 2*105-GT 200-GS
2011 285-PUT - - - - - - - 300-TRNC - 300-TRNC - 300-CO 300-CO 2*300-CO 325-GT 285-PUT -150-UPK
2012 150-UPK - - - - - - - 210-GT 300-TRNC 105-GT 300-CO 300-CO 300-CO 300-CO 285-PUT 150-UPK
75-GT 150-UPK -
2013 - - - - - - - - - 105-GT 10-DS
300-TRNC 300-TRNC 105-GT 300-CO 300-CO 285-PUT(ST2) 500-TRNC
20-Northern 24-CPE 35-GT
-
ST – Steam plant, DS – Diesel plant, CPE-Chunnakum Power Extension, CCY – Combined cycle plant, CO – Coal fired steam plant, GT – Gas turbine, LKV – Lakdanavi power plant, Asia – Asia power plant, Col – Colombo power plant, ACE – ACE power plant,HLV-Heladanavi power station, TRNC-Trinco Coal Power Plant, Northern-Northern Power plant
Note: NCRE Plants are not indicated
Generation Expansion Plan - 2012 Page A10-1
- - 300-CCY 200-DS
70-KUK300-CO
2005 22-GT 300-CO 44-GT
-300-CO
- 300-CO - 105-GT
- 20-ACE
-
60-GT (Referbish)
60-GT (Referbish)
2004 150-CO 60-GT (Referbish)
70-KUK 50-CCY -300-CO 150-CO 22-GT -
2003 20-ACE 165-CCY
150-CO 60-GT (Referbish)
60-GT (Referbish)
60-GT (Referbish)
2002 20-ACE 150-CO
- 300-CCY 40-DS- - -
150-CCY 60-Col- - -
2001 60-Col 150-CO 150-CO 150-CO
- - - - -
2000 40-DS - 123-UPK 70-KUK
- - - -
1999 49-Asia 150-CO 70-KUK 68-CCY 150-CCY
- - - -
1998 - 66-GT 40-DS- -
1997 - 40-DS 110-DS- -
- - - - - -
- - -
1996 - - 20-DS 60-DS - -
- -
Year Actual expansions
1995 -
KUK – Kukule hydro power station, BDL – Broadlands hydro power station, UPK – Upper Kotmale hydro power station, GIN – Gin ganga hydro power station, MAD – Madulu oya hydro power station
270-WC CCY
Actual G
eneration Expansions and the Plans from 1994-2013
Annex 10.1
-- 40-DS - - -
Annex 11
Addendum
Results of Generation Expansion Planning Studies Revised Base Case
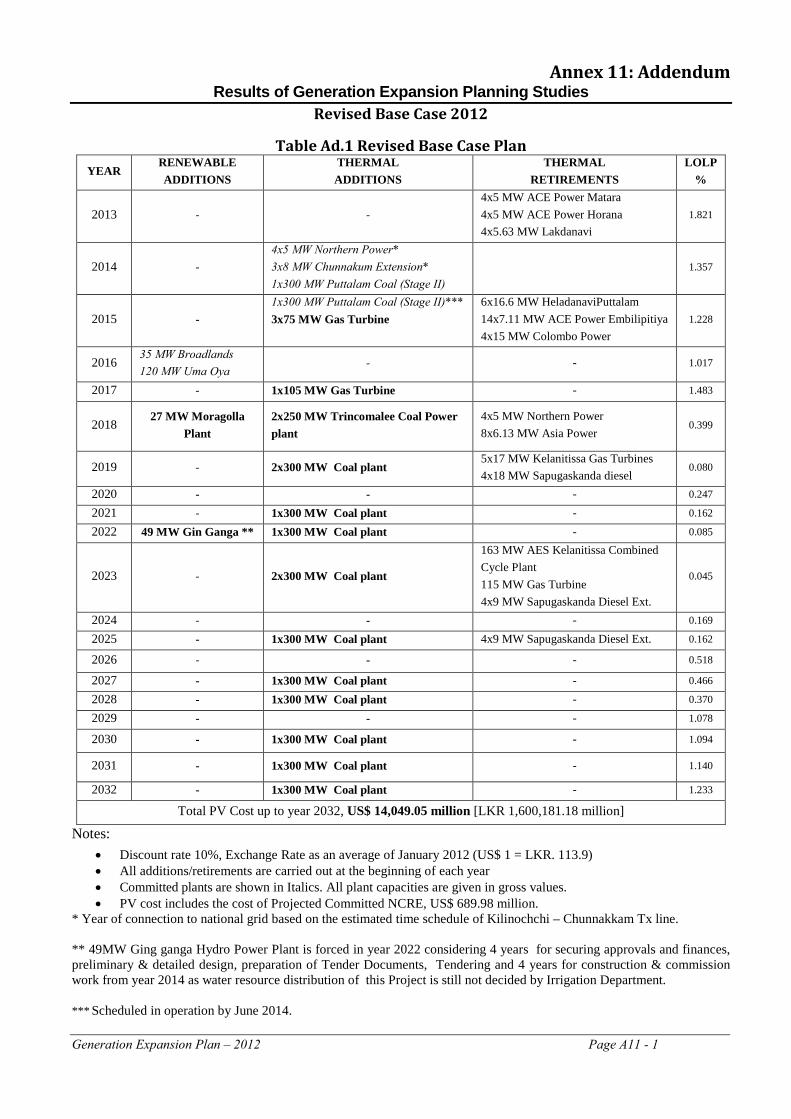
Generation Expansion Plan – 2012 Page A11 - 1
Annex 11: Addendum Results of Generation Expansion Planning Studies
Revised Base Case 2012
Table Ad.1 Revised Base Case Plan YEAR
RENEWABLE ADDITIONS
THERMAL ADDITIONS
THERMAL RETIREMENTS
LOLP %
2013 - - 4x5 MW ACE Power Matara 4x5 MW ACE Power Horana 4x5.63 MW Lakdanavi
1.821
2014 - 4x5 MW Northern Power* 3x8 MW Chunnakum Extension* 1x300 MW Puttalam Coal (Stage II)
1.357
2015 - 1x300 MW Puttalam Coal (Stage II)*** 3x75 MW Gas Turbine
6x16.6 MW HeladanaviPuttalam 14x7.11 MW ACE Power Embilipitiya 4x15 MW Colombo Power
1.228
2016 35 MW Broadlands 120 MW Uma Oya
- - 1.017
2017 - 1x10⁵ MW Gas Turbine - 1.483
2018 27 MW Moragolla
Plant 2x250 MW Trincomalee Coal Power plant
4x5 MW Northern Power 8x6.13 MW Asia Power
0.399
2019 - 2x300 MW Coal plant 5x17 MW Kelanitissa Gas Turbines 4x18 MW Sapugaskanda diesel
0.080
2020 - - - 0.247
2021 - 1x300 MW Coal plant - 0.162
2022 49 MW Gin Ganga ** 1x300 MW Coal plant - 0.085
2023 - 2x300 MW Coal plant
163 MW AES Kelanitissa Combined Cycle Plant 115 MW Gas Turbine 4x9 MW Sapugaskanda Diesel Ext.
0.045
2024 - - - 0.169
2025 - 1x300 MW Coal plant 4x9 MW Sapugaskanda Diesel Ext. 0.162
2026 - - - 0.518
2027 - 1x300 MW Coal plant - 0.466
2028 - 1x300 MW Coal plant - 0.370
2029 - - - 1.078
2030 - 1x300 MW Coal plant - 1.094
2031 - 1x300 MW Coal plant - 1.140
2032 - 1x300 MW Coal plant - 1.233
Total PV Cost up to year 2032, US$ 14,049.05 million [LKR 1,600,181.18 million]
Notes: • Discount rate 10%, Exchange Rate as an average of January 2012 (US$ 1 = LKR. 113.9) • All additions/retirements are carried out at the beginning of each year • Committed plants are shown in Italics. All plant capacities are given in gross values. • PV cost includes the cost of Projected Committed NCRE, US$ 689.98 million.
* Year of connection to national grid based on the estimated time schedule of Kilinochchi – Chunnakkam Tx line. ** 49MW Ging ganga Hydro Power Plant is forced in year 2022 considering 4 years for securing approvals and finances, preliminary & detailed design, preparation of Tender Documents, Tendering and 4 years for construction & commission work from year 2014 as water resource distribution of this Project is still not decided by Irrigation Department. *** Scheduled in operation by June 2014.
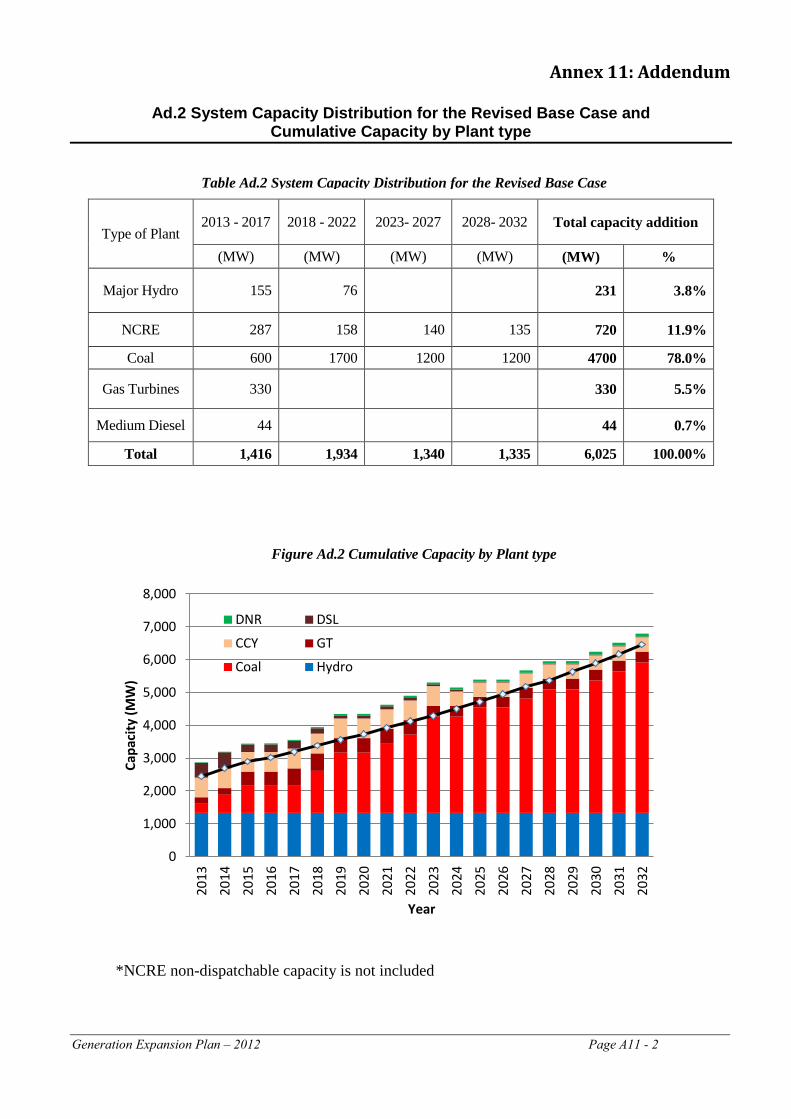
Generation Expansion Plan – 2012 Page A11 - 2
Annex 11: Addendum
Ad.2 System Capacity Distribution for the Revised Base Case and Cumulative Capacity by Plant type
Type of Plant 2013 - 2017 2018 - 2022 2023- 2027 2028- 2032 Total capacity addition
(MW) (MW) (MW) (MW) (MW) %
Major Hydro 155 76
231 3.8%
NCRE 287 158 140 135 720 11.9%
Coal 600 1700 1200 1200 4700 78.0%
Gas Turbines 330 330 5.5%
Medium Diesel 44 44 0.7%
Total 1,416 1,934 1,340 1,335 6,025 100.00%
*NCRE non-dispatchable capacity is not included
0
1,000
2,000
3,000
4,000
5,000
6,000
7,000
8,000
2013
2014
2015
2016
2017
2018
2019
2020
2021
2022
2023
2024
2025
2026
2027
2028
2029
2030
2031
2032
Capa
city
(MW
)
Year
DNR DSL
CCY GT
Coal Hydro
Table Ad.2 System Capacity Distribution for the Revised Base Case
Figure Ad.2 Cumulative Capacity by Plant type
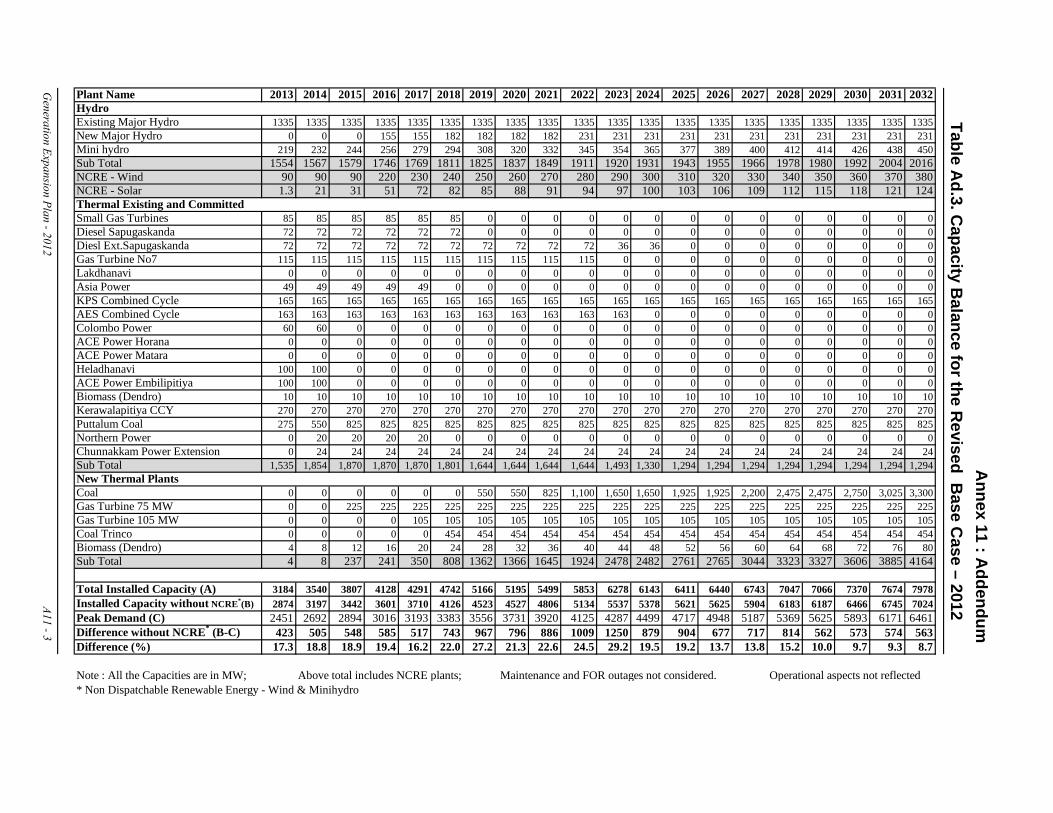
Plant Name 2013 2014 2015 2016 2017 2018 2019 2020 2021 2022 2023 2024 2025 2026 2027 2028 2029 2030 2031 2032
Existing Major Hydro 1335 1335 1335 1335 1335 1335 1335 1335 1335 1335 1335 1335 1335 1335 1335 1335 1335 1335 1335 1335New Major Hydro 0 0 0 155 155 182 182 182 182 231 231 231 231 231 231 231 231 231 231 231Mini hydro 219 232 244 256 279 294 308 320 332 345 354 365 377 389 400 412 414 426 438 450Sub Total 1554 1567 1579 1746 1769 1811 1825 1837 1849 1911 1920 1931 1943 1955 1966 1978 1980 1992 2004 2016NCRE - Wind 90 90 90 220 230 240 250 260 270 280 290 300 310 320 330 340 350 360 370 380NCRE - Solar 1.3 21 31 51 72 82 85 88 91 94 97 100 103 106 109 112 115 118 121 124
Small Gas Turbines 85 85 85 85 85 85 0 0 0 0 0 0 0 0 0 0 0 0 0 0Diesel Sapugaskanda 72 72 72 72 72 72 0 0 0 0 0 0 0 0 0 0 0 0 0 0Diesl Ext.Sapugaskanda 72 72 72 72 72 72 72 72 72 72 36 36 0 0 0 0 0 0 0 0Gas Turbine No7 115 115 115 115 115 115 115 115 115 115 0 0 0 0 0 0 0 0 0 0Lakdhanavi 0 0 0 0 0 0 0 0 0 0 0 0 0 0 0 0 0 0 0 0Asia Power 49 49 49 49 49 0 0 0 0 0 0 0 0 0 0 0 0 0 0 0KPS Combined Cycle 165 165 165 165 165 165 165 165 165 165 165 165 165 165 165 165 165 165 165 165AES Combined Cycle 163 163 163 163 163 163 163 163 163 163 163 0 0 0 0 0 0 0 0 0Colombo Power 60 60 0 0 0 0 0 0 0 0 0 0 0 0 0 0 0 0 0 0ACE Power Horana 0 0 0 0 0 0 0 0 0 0 0 0 0 0 0 0 0 0 0 0ACE Power Matara 0 0 0 0 0 0 0 0 0 0 0 0 0 0 0 0 0 0 0 0Heladhanavi 100 100 0 0 0 0 0 0 0 0 0 0 0 0 0 0 0 0 0 0ACE Power Embilipitiya 100 100 0 0 0 0 0 0 0 0 0 0 0 0 0 0 0 0 0 0Biomass (Dendro) 10 10 10 10 10 10 10 10 10 10 10 10 10 10 10 10 10 10 10 10Kerawalapitiya CCY 270 270 270 270 270 270 270 270 270 270 270 270 270 270 270 270 270 270 270 270Puttalum Coal 275 550 825 825 825 825 825 825 825 825 825 825 825 825 825 825 825 825 825 825Northern Power 0 20 20 20 20 0 0 0 0 0 0 0 0 0 0 0 0 0 0 0Chunnakkam Power Extension 0 24 24 24 24 24 24 24 24 24 24 24 24 24 24 24 24 24 24 24Sub Total 1,535 1,854 1,870 1,870 1,870 1,801 1,644 1,644 1,644 1,644 1,493 1,330 1,294 1,294 1,294 1,294 1,294 1,294 1,294 1,294
Coal 0 0 0 0 0 0 550 550 825 1,100 1,650 1,650 1,925 1,925 2,200 2,475 2,475 2,750 3,025 3,300Gas Turbine 75 MW 0 0 225 225 225 225 225 225 225 225 225 225 225 225 225 225 225 225 225 225Gas Turbine 105 MW 0 0 0 0 105 105 105 105 105 105 105 105 105 105 105 105 105 105 105 105Coal Trinco 0 0 0 0 0 454 454 454 454 454 454 454 454 454 454 454 454 454 454 454Biomass (Dendro) 4 8 12 16 20 24 28 32 36 40 44 48 52 56 60 64 68 72 76 80Sub Total 4 8 237 241 350 808 1362 1366 1645 1924 2478 2482 2761 2765 3044 3323 3327 3606 3885 4164
Total Installed Capacity (A) 3184 3540 3807 4128 4291 4742 5166 5195 5499 5853 6278 6143 6411 6440 6743 7047 7066 7370 7674 7978Installed Capacity without NCRE*(B) 2874 3197 3442 3601 3710 4126 4523 4527 4806 5134 5537 5378 5621 5625 5904 6183 6187 6466 6745 7024Peak Demand (C) 2451 2692 2894 3016 3193 3383 3556 3731 3920 4125 4287 4499 4717 4948 5187 5369 5625 5893 6171 6461Difference without NCRE* (B-C) 423 505 548 585 517 743 967 796 886 1009 1250 879 904 677 717 814 562 573 574 563Difference (%) 17.3 18.8 18.9 19.4 16.2 22.0 27.2 21.3 22.6 24.5 29.2 19.5 19.2 13.7 13.8 15.2 10.0 9.7 9.3 8.7
Note : All the Capacities are in MW; Above total includes NCRE plants; Maintenance and FOR outages not considered. Operational aspects not reflected* Non Dispatchable Renewable Energy - Wind & Minihydro
Annex 11 : A
ddendum
Generation Expansion Plan - 2012 A11 - 3
Table Ad.3. C
apacity Balance for the R
evised Base C
ase – 2012Hydro
New Thermal Plants
Thermal Existing and Committed
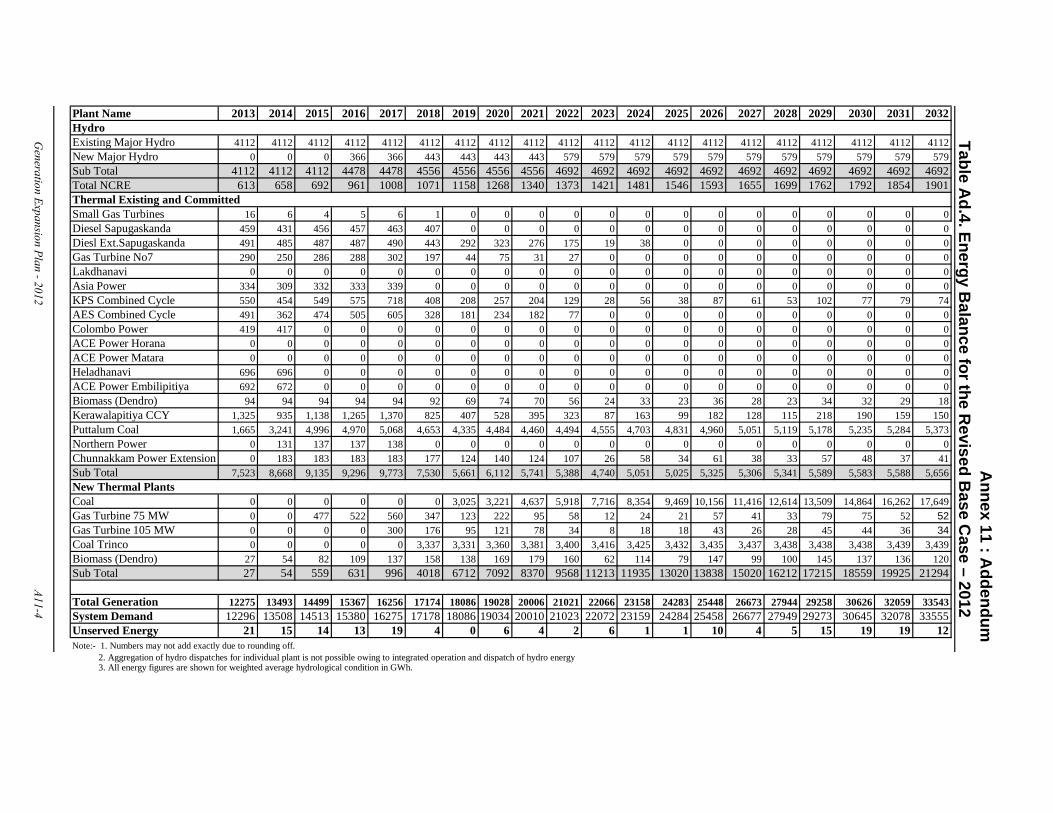
Plant Name 2013 2014 2015 2016 2017 2018 2019 2020 2021 2022 2023 2024 2025 2026 2027 2028 2029 2030 2031 2032
Existing Major Hydro 4112 4112 4112 4112 4112 4112 4112 4112 4112 4112 4112 4112 4112 4112 4112 4112 4112 4112 4112 4112New Major Hydro 0 0 0 366 366 443 443 443 443 579 579 579 579 579 579 579 579 579 579 579Sub Total 4112 4112 4112 4478 4478 4556 4556 4556 4556 4692 4692 4692 4692 4692 4692 4692 4692 4692 4692 4692Total NCRE 613 658 692 961 1008 1071 1158 1268 1340 1373 1421 1481 1546 1593 1655 1699 1762 1792 1854 1901
Small Gas Turbines 16 6 4 5 6 1 0 0 0 0 0 0 0 0 0 0 0 0 0 0Diesel Sapugaskanda 459 431 456 457 463 407 0 0 0 0 0 0 0 0 0 0 0 0 0 0Diesl Ext.Sapugaskanda 491 485 487 487 490 443 292 323 276 175 19 38 0 0 0 0 0 0 0 0Gas Turbine No7 290 250 286 288 302 197 44 75 31 27 0 0 0 0 0 0 0 0 0 0Lakdhanavi 0 0 0 0 0 0 0 0 0 0 0 0 0 0 0 0 0 0 0 0Asia Power 334 309 332 333 339 0 0 0 0 0 0 0 0 0 0 0 0 0 0 0KPS Combined Cycle 550 454 549 575 718 408 208 257 204 129 28 56 38 87 61 53 102 77 79 74AES Combined Cycle 491 362 474 505 605 328 181 234 182 77 0 0 0 0 0 0 0 0 0 0Colombo Power 419 417 0 0 0 0 0 0 0 0 0 0 0 0 0 0 0 0 0 0ACE Power Horana 0 0 0 0 0 0 0 0 0 0 0 0 0 0 0 0 0 0 0 0ACE Power Matara 0 0 0 0 0 0 0 0 0 0 0 0 0 0 0 0 0 0 0 0Heladhanavi 696 696 0 0 0 0 0 0 0 0 0 0 0 0 0 0 0 0 0 0ACE Power Embilipitiya 692 672 0 0 0 0 0 0 0 0 0 0 0 0 0 0 0 0 0 0Biomass (Dendro) 94 94 94 94 94 92 69 74 70 56 24 33 23 36 28 23 34 32 29 18Kerawalapitiya CCY 1,325 935 1,138 1,265 1,370 825 407 528 395 323 87 163 99 182 128 115 218 190 159 150Puttalum Coal 1,665 3,241 4,996 4,970 5,068 4,653 4,335 4,484 4,460 4,494 4,555 4,703 4,831 4,960 5,051 5,119 5,178 5,235 5,284 5,373Northern Power 0 131 137 137 138 0 0 0 0 0 0 0 0 0 0 0 0 0 0 0Chunnakkam Power Extension 0 183 183 183 183 177 124 140 124 107 26 58 34 61 38 33 57 48 37 41Sub Total 7,523 8,668 9,135 9,296 9,773 7,530 5,661 6,112 5,741 5,388 4,740 5,051 5,025 5,325 5,306 5,341 5,589 5,583 5,588 5,656
Coal 0 0 0 0 0 0 3,025 3,221 4,637 5,918 7,716 8,354 9,469 10,156 11,416 12,614 13,509 14,864 16,262 17,649Gas Turbine 75 MW 0 0 477 522 560 347 123 222 95 58 12 24 21 57 41 33 79 75 52 52Gas Turbine 105 MW 0 0 0 0 300 176 95 121 78 34 8 18 18 43 26 28 45 44 36 34Coal Trinco 0 0 0 0 0 3,337 3,331 3,360 3,381 3,400 3,416 3,425 3,432 3,435 3,437 3,438 3,438 3,438 3,439 3,439Biomass (Dendro) 27 54 82 109 137 158 138 169 179 160 62 114 79 147 99 100 145 137 136 120Sub Total 27 54 559 631 996 4018 6712 7092 8370 9568 11213 11935 13020 13838 15020 16212 17215 18559 19925 21294
Total Generation 12275 13493 14499 15367 16256 17174 18086 19028 20006 21021 22066 23158 24283 25448 26673 27944 29258 30626 32059 33543System Demand 12296 13508 14513 15380 16275 17178 18086 19034 20010 21023 22072 23159 24284 25458 26677 27949 29273 30645 32078 33555Unserved Energy 21 15 14 13 19 4 0 6 4 2 6 1 1 10 4 5 15 19 19 12Note:- 1. Numbers may not add exactly due to rounding off. 2. Aggregation of hydro dispatches for individual plant is not possible owing to integrated operation and dispatch of hydro energy 3. All energy figures are shown for weighted average hydrological condition in GWh.
Generation Expansion Plan - 2012 A11-4
Table Ad.4. Energy B
alance for the Revised B
ase Case – 2012
Annex 11 : A
ddendum
Hydro
New Thermal Plants
Thermal Existing and Committed
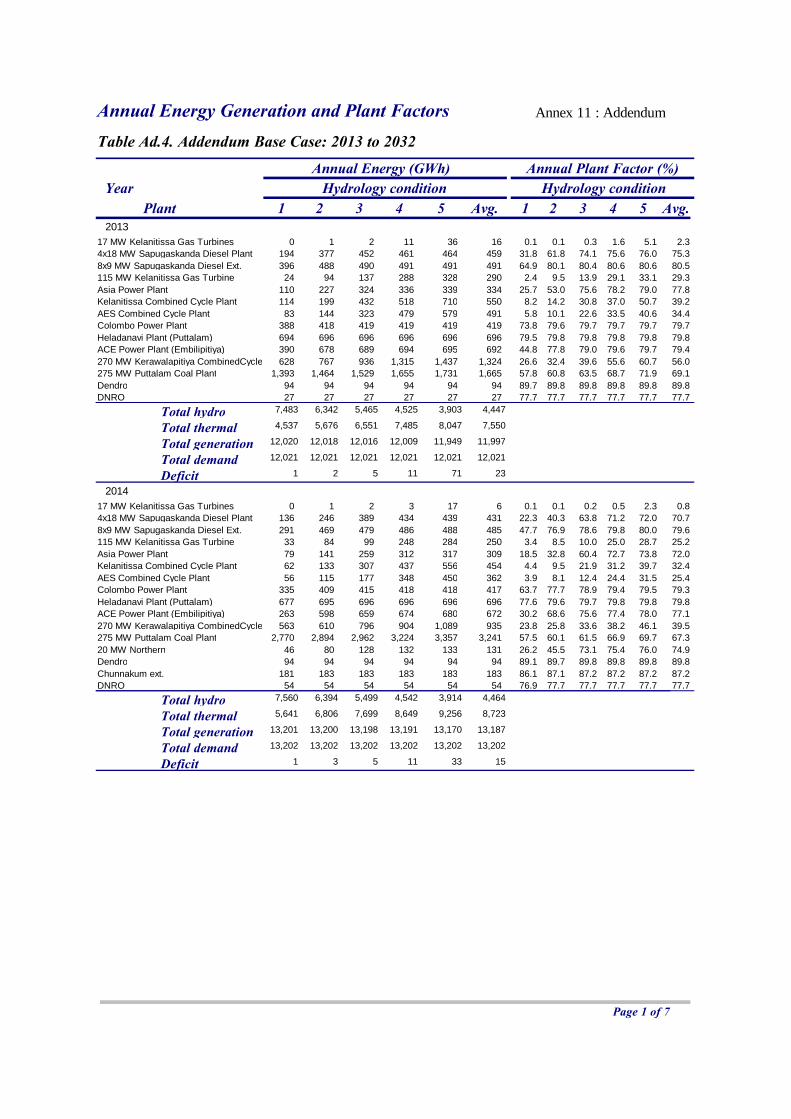
Annual Energy Generation and Plant Factors Annex 11 : Addendum
Table Ad.4. Addendum Base Case: 2013 to 2032
PlantYear
1 2 3 4 5 Avg. 1 2 3 4 5 Avg.
Annual Energy (GWh)Hydrology condition Hydrology condition
Annual Plant Factor (%)
201317 MW Kelanitissa Gas Turbines 0 1 2 11 36 16 0.1 0.1 0.3 1.6 5.1 2.34x18 MW Sapugaskanda Diesel Plant 194 377 452 461 464 459 31.8 61.8 74.1 75.6 76.0 75.38x9 MW Sapugaskanda Diesel Ext. 396 488 490 491 491 491 64.9 80.1 80.4 80.6 80.6 80.5115 MW Kelanitissa Gas Turbine 24 94 137 288 328 290 2.4 9.5 13.9 29.1 33.1 29.3Asia Power Plant 110 227 324 336 339 334 25.7 53.0 75.6 78.2 79.0 77.8Kelanitissa Combined Cycle Plant 114 199 432 518 710 550 8.2 14.2 30.8 37.0 50.7 39.2AES Combined Cycle Plant 83 144 323 479 579 491 5.8 10.1 22.6 33.5 40.6 34.4Colombo Power Plant 388 418 419 419 419 419 73.8 79.6 79.7 79.7 79.7 79.7Heladanavi Plant (Puttalam) 694 696 696 696 696 696 79.5 79.8 79.8 79.8 79.8 79.8ACE Power Plant (Embilipitiya) 390 678 689 694 695 692 44.8 77.8 79.0 79.6 79.7 79.4270 MW Kerawalapitiya CombinedCycle 628 767 936 1,315 1,437 1,324 26.6 32.4 39.6 55.6 60.7 56.0275 MW Puttalam Coal Plant 1,393 1,464 1,529 1,655 1,731 1,665 57.8 60.8 63.5 68.7 71.9 69.1Dendro 94 94 94 94 94 94 89.7 89.8 89.8 89.8 89.8 89.8DNRO 27 27 27 27 27 27 77.7 77.7 77.7 77.7 77.7 77.7
12,020 12,018 12,016 12,009 11,949 11,997
12,021 12,021 12,021 12,021 12,021 12,021
7,483 6,342 5,465 4,525 3,903 4,447Total hydroTotal thermal 4,537 5,676 6,551 7,485 8,047 7,550
Total generationTotal demand
1 2 5 11 71 23Deficit2014
17 MW Kelanitissa Gas Turbines 0 1 2 3 17 6 0.1 0.1 0.2 0.5 2.3 0.84x18 MW Sapugaskanda Diesel Plant 136 246 389 434 439 431 22.3 40.3 63.8 71.2 72.0 70.78x9 MW Sapugaskanda Diesel Ext. 291 469 479 486 488 485 47.7 76.9 78.6 79.8 80.0 79.6115 MW Kelanitissa Gas Turbine 33 84 99 248 284 250 3.4 8.5 10.0 25.0 28.7 25.2Asia Power Plant 79 141 259 312 317 309 18.5 32.8 60.4 72.7 73.8 72.0Kelanitissa Combined Cycle Plant 62 133 307 437 556 454 4.4 9.5 21.9 31.2 39.7 32.4AES Combined Cycle Plant 56 115 177 348 450 362 3.9 8.1 12.4 24.4 31.5 25.4Colombo Power Plant 335 409 415 418 418 417 63.7 77.7 78.9 79.4 79.5 79.3Heladanavi Plant (Puttalam) 677 695 696 696 696 696 77.6 79.6 79.7 79.8 79.8 79.8ACE Power Plant (Embilipitiya) 263 598 659 674 680 672 30.2 68.6 75.6 77.4 78.0 77.1270 MW Kerawalapitiya CombinedCycle 563 610 796 904 1,089 935 23.8 25.8 33.6 38.2 46.1 39.5275 MW Puttalam Coal Plant 2,770 2,894 2,962 3,224 3,357 3,241 57.5 60.1 61.5 66.9 69.7 67.320 MW Northern 46 80 128 132 133 131 26.2 45.5 73.1 75.4 76.0 74.9Dendro 94 94 94 94 94 94 89.1 89.7 89.8 89.8 89.8 89.8Chunnakum ext. 181 183 183 183 183 183 86.1 87.1 87.2 87.2 87.2 87.2DNRO 54 54 54 54 54 54 76.9 77.7 77.7 77.7 77.7 77.7
13,201 13,200 13,198 13,191 13,170 13,187
13,202 13,202 13,202 13,202 13,202 13,202
7,560 6,394 5,499 4,542 3,914 4,464Total hydroTotal thermal 5,641 6,806 7,699 8,649 9,256 8,723
Total generationTotal demand
1 3 5 11 33 15Deficit
Page 1 of 7
Administrator
Text Box
Table Ad.5. Revised Base Case: 2013 to 2032
Administrator
Text Box
Note : Hydrological Conditions:1. Very Wet (0.5%) 2. Wet (1%) 3. Medium (1.5%) 4. Dry (77%) 5. Very Dry (20%) Shown within brackets is the probability of occurrence of each Hydro Condition.
Administrator
Text Box
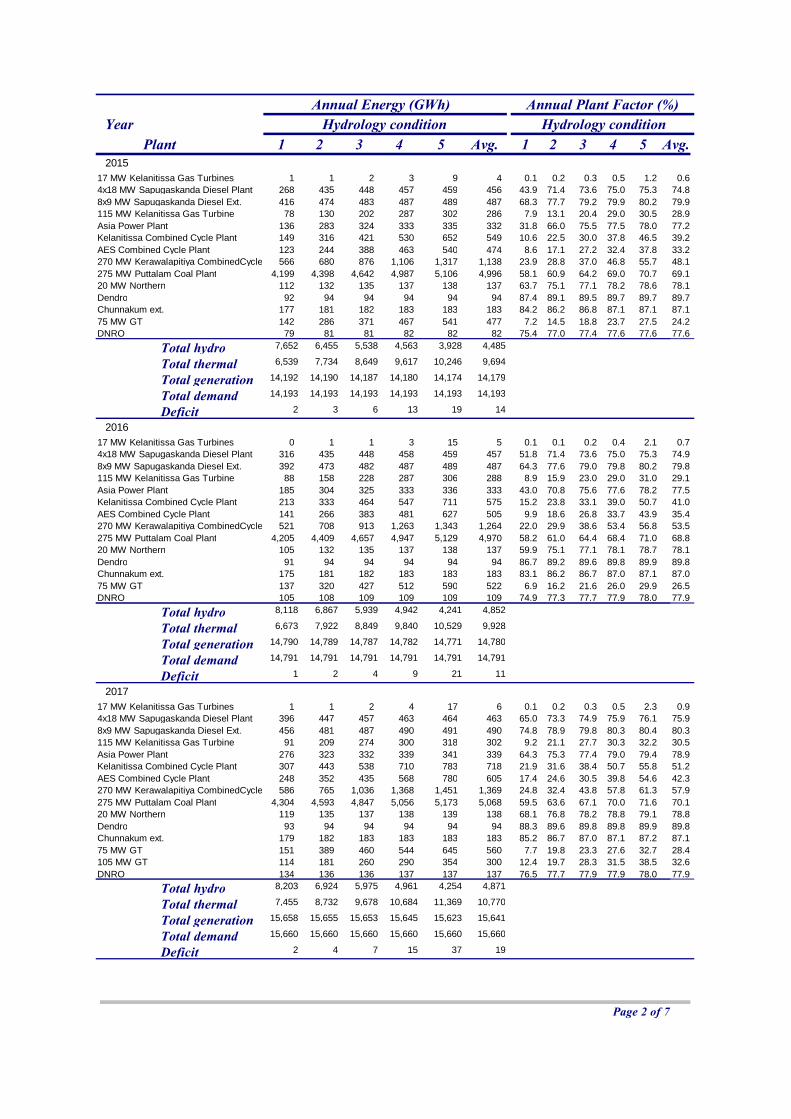
PlantYear
1 2 3 4 5 Avg. 1 2 3 4 5 Avg.
Annual Energy (GWh)Hydrology condition Hydrology condition
Annual Plant Factor (%)
201517 MW Kelanitissa Gas Turbines 1 1 2 3 9 4 0.1 0.2 0.3 0.5 1.2 0.64x18 MW Sapugaskanda Diesel Plant 268 435 448 457 459 456 43.9 71.4 73.6 75.0 75.3 74.88x9 MW Sapugaskanda Diesel Ext. 416 474 483 487 489 487 68.3 77.7 79.2 79.9 80.2 79.9115 MW Kelanitissa Gas Turbine 78 130 202 287 302 286 7.9 13.1 20.4 29.0 30.5 28.9Asia Power Plant 136 283 324 333 335 332 31.8 66.0 75.5 77.5 78.0 77.2Kelanitissa Combined Cycle Plant 149 316 421 530 652 549 10.6 22.5 30.0 37.8 46.5 39.2AES Combined Cycle Plant 123 244 388 463 540 474 8.6 17.1 27.2 32.4 37.8 33.2270 MW Kerawalapitiya CombinedCycle 566 680 876 1,106 1,317 1,138 23.9 28.8 37.0 46.8 55.7 48.1275 MW Puttalam Coal Plant 4,199 4,398 4,642 4,987 5,106 4,996 58.1 60.9 64.2 69.0 70.7 69.120 MW Northern 112 132 135 137 138 137 63.7 75.1 77.1 78.2 78.6 78.1Dendro 92 94 94 94 94 94 87.4 89.1 89.5 89.7 89.7 89.7Chunnakum ext. 177 181 182 183 183 183 84.2 86.2 86.8 87.1 87.1 87.175 MW GT 142 286 371 467 541 477 7.2 14.5 18.8 23.7 27.5 24.2DNRO 79 81 81 82 82 82 75.4 77.0 77.4 77.6 77.6 77.6
14,192 14,190 14,187 14,180 14,174 14,179
14,193 14,193 14,193 14,193 14,193 14,193
7,652 6,455 5,538 4,563 3,928 4,485Total hydroTotal thermal 6,539 7,734 8,649 9,617 10,246 9,694
Total generationTotal demand
2 3 6 13 19 14Deficit2016
17 MW Kelanitissa Gas Turbines 0 1 1 3 15 5 0.1 0.1 0.2 0.4 2.1 0.74x18 MW Sapugaskanda Diesel Plant 316 435 448 458 459 457 51.8 71.4 73.6 75.0 75.3 74.98x9 MW Sapugaskanda Diesel Ext. 392 473 482 487 489 487 64.3 77.6 79.0 79.8 80.2 79.8115 MW Kelanitissa Gas Turbine 88 158 228 287 306 288 8.9 15.9 23.0 29.0 31.0 29.1Asia Power Plant 185 304 325 333 336 333 43.0 70.8 75.6 77.6 78.2 77.5Kelanitissa Combined Cycle Plant 213 333 464 547 711 575 15.2 23.8 33.1 39.0 50.7 41.0AES Combined Cycle Plant 141 266 383 481 627 505 9.9 18.6 26.8 33.7 43.9 35.4270 MW Kerawalapitiya CombinedCycle 521 708 913 1,263 1,343 1,264 22.0 29.9 38.6 53.4 56.8 53.5275 MW Puttalam Coal Plant 4,205 4,409 4,657 4,947 5,129 4,970 58.2 61.0 64.4 68.4 71.0 68.820 MW Northern 105 132 135 137 138 137 59.9 75.1 77.1 78.1 78.7 78.1Dendro 91 94 94 94 94 94 86.7 89.2 89.6 89.8 89.9 89.8Chunnakum ext. 175 181 182 183 183 183 83.1 86.2 86.7 87.0 87.1 87.075 MW GT 137 320 427 512 590 522 6.9 16.2 21.6 26.0 29.9 26.5DNRO 105 108 109 109 109 109 74.9 77.3 77.7 77.9 78.0 77.9
14,790 14,789 14,787 14,782 14,771 14,780
14,791 14,791 14,791 14,791 14,791 14,791
8,118 6,867 5,939 4,942 4,241 4,852Total hydroTotal thermal 6,673 7,922 8,849 9,840 10,529 9,928
Total generationTotal demand
1 2 4 9 21 11Deficit2017
17 MW Kelanitissa Gas Turbines 1 1 2 4 17 6 0.1 0.2 0.3 0.5 2.3 0.94x18 MW Sapugaskanda Diesel Plant 396 447 457 463 464 463 65.0 73.3 74.9 75.9 76.1 75.98x9 MW Sapugaskanda Diesel Ext. 456 481 487 490 491 490 74.8 78.9 79.8 80.3 80.4 80.3115 MW Kelanitissa Gas Turbine 91 209 274 300 318 302 9.2 21.1 27.7 30.3 32.2 30.5Asia Power Plant 276 323 332 339 341 339 64.3 75.3 77.4 79.0 79.4 78.9Kelanitissa Combined Cycle Plant 307 443 538 710 783 718 21.9 31.6 38.4 50.7 55.8 51.2AES Combined Cycle Plant 248 352 435 568 780 605 17.4 24.6 30.5 39.8 54.6 42.3270 MW Kerawalapitiya CombinedCycle 586 765 1,036 1,368 1,451 1,369 24.8 32.4 43.8 57.8 61.3 57.9275 MW Puttalam Coal Plant 4,304 4,593 4,847 5,056 5,173 5,068 59.5 63.6 67.1 70.0 71.6 70.120 MW Northern 119 135 137 138 139 138 68.1 76.8 78.2 78.8 79.1 78.8Dendro 93 94 94 94 94 94 88.3 89.6 89.8 89.8 89.9 89.8Chunnakum ext. 179 182 183 183 183 183 85.2 86.7 87.0 87.1 87.2 87.175 MW GT 151 389 460 544 645 560 7.7 19.8 23.3 27.6 32.7 28.4105 MW GT 114 181 260 290 354 300 12.4 19.7 28.3 31.5 38.5 32.6DNRO 134 136 136 137 137 137 76.5 77.7 77.9 77.9 78.0 77.9
15,658 15,655 15,653 15,645 15,623 15,641
15,660 15,660 15,660 15,660 15,660 15,660
8,203 6,924 5,975 4,961 4,254 4,871Total hydroTotal thermal 7,455 8,732 9,678 10,684 11,369 10,770
Total generationTotal demand
2 4 7 15 37 19Deficit
Page 2 of 7
Administrator
Text Box
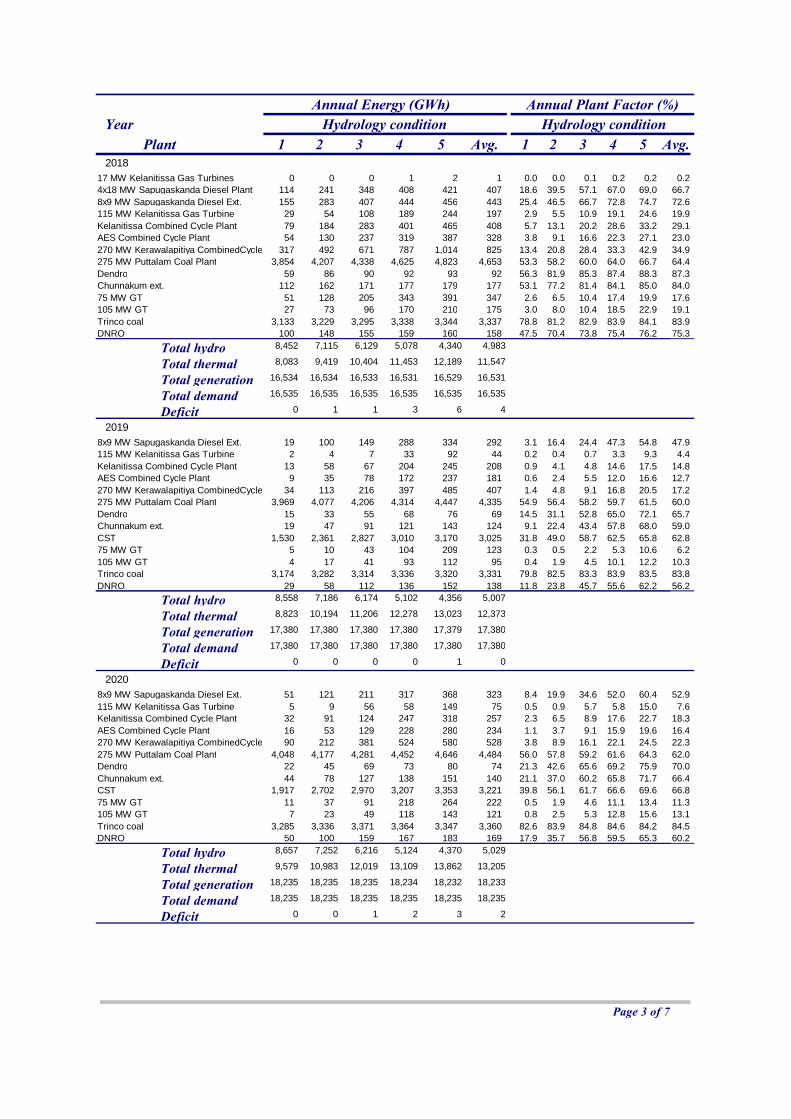
PlantYear
1 2 3 4 5 Avg. 1 2 3 4 5 Avg.
Annual Energy (GWh)Hydrology condition Hydrology condition
Annual Plant Factor (%)
201817 MW Kelanitissa Gas Turbines 0 0 0 1 2 1 0.0 0.0 0.1 0.2 0.2 0.24x18 MW Sapugaskanda Diesel Plant 114 241 348 408 421 407 18.6 39.5 57.1 67.0 69.0 66.78x9 MW Sapugaskanda Diesel Ext. 155 283 407 444 456 443 25.4 46.5 66.7 72.8 74.7 72.6115 MW Kelanitissa Gas Turbine 29 54 108 189 244 197 2.9 5.5 10.9 19.1 24.6 19.9Kelanitissa Combined Cycle Plant 79 184 283 401 465 408 5.7 13.1 20.2 28.6 33.2 29.1AES Combined Cycle Plant 54 130 237 319 387 328 3.8 9.1 16.6 22.3 27.1 23.0270 MW Kerawalapitiya CombinedCycle 317 492 671 787 1,014 825 13.4 20.8 28.4 33.3 42.9 34.9275 MW Puttalam Coal Plant 3,854 4,207 4,338 4,625 4,823 4,653 53.3 58.2 60.0 64.0 66.7 64.4Dendro 59 86 90 92 93 92 56.3 81.9 85.3 87.4 88.3 87.3Chunnakum ext. 112 162 171 177 179 177 53.1 77.2 81.4 84.1 85.0 84.075 MW GT 51 128 205 343 391 347 2.6 6.5 10.4 17.4 19.9 17.6105 MW GT 27 73 96 170 210 175 3.0 8.0 10.4 18.5 22.9 19.1Trinco coal 3,133 3,229 3,295 3,338 3,344 3,337 78.8 81.2 82.9 83.9 84.1 83.9DNRO 100 148 155 159 160 158 47.5 70.4 73.8 75.4 76.2 75.3
16,534 16,534 16,533 16,531 16,529 16,531
16,535 16,535 16,535 16,535 16,535 16,535
8,452 7,115 6,129 5,078 4,340 4,983Total hydroTotal thermal 8,083 9,419 10,404 11,453 12,189 11,547
Total generationTotal demand
0 1 1 3 6 4Deficit2019
8x9 MW Sapugaskanda Diesel Ext. 19 100 149 288 334 292 3.1 16.4 24.4 47.3 54.8 47.9115 MW Kelanitissa Gas Turbine 2 4 7 33 92 44 0.2 0.4 0.7 3.3 9.3 4.4Kelanitissa Combined Cycle Plant 13 58 67 204 245 208 0.9 4.1 4.8 14.6 17.5 14.8AES Combined Cycle Plant 9 35 78 172 237 181 0.6 2.4 5.5 12.0 16.6 12.7270 MW Kerawalapitiya CombinedCycle 34 113 216 397 485 407 1.4 4.8 9.1 16.8 20.5 17.2275 MW Puttalam Coal Plant 3,969 4,077 4,206 4,314 4,447 4,335 54.9 56.4 58.2 59.7 61.5 60.0Dendro 15 33 55 68 76 69 14.5 31.1 52.8 65.0 72.1 65.7Chunnakum ext. 19 47 91 121 143 124 9.1 22.4 43.4 57.8 68.0 59.0CST 1,530 2,361 2,827 3,010 3,170 3,025 31.8 49.0 58.7 62.5 65.8 62.875 MW GT 5 10 43 104 209 123 0.3 0.5 2.2 5.3 10.6 6.2105 MW GT 4 17 41 93 112 95 0.4 1.9 4.5 10.1 12.2 10.3Trinco coal 3,174 3,282 3,314 3,336 3,320 3,331 79.8 82.5 83.3 83.9 83.5 83.8DNRO 29 58 112 136 152 138 11.8 23.8 45.7 55.6 62.2 56.2
17,380 17,380 17,380 17,380 17,379 17,380
17,380 17,380 17,380 17,380 17,380 17,380
8,558 7,186 6,174 5,102 4,356 5,007Total hydroTotal thermal 8,823 10,194 11,206 12,278 13,023 12,373
Total generationTotal demand
0 0 0 0 1 0Deficit2020
8x9 MW Sapugaskanda Diesel Ext. 51 121 211 317 368 323 8.4 19.9 34.6 52.0 60.4 52.9115 MW Kelanitissa Gas Turbine 5 9 56 58 149 75 0.5 0.9 5.7 5.8 15.0 7.6Kelanitissa Combined Cycle Plant 32 91 124 247 318 257 2.3 6.5 8.9 17.6 22.7 18.3AES Combined Cycle Plant 16 53 129 228 280 234 1.1 3.7 9.1 15.9 19.6 16.4270 MW Kerawalapitiya CombinedCycle 90 212 381 524 580 528 3.8 8.9 16.1 22.1 24.5 22.3275 MW Puttalam Coal Plant 4,048 4,177 4,281 4,452 4,646 4,484 56.0 57.8 59.2 61.6 64.3 62.0Dendro 22 45 69 73 80 74 21.3 42.6 65.6 69.2 75.9 70.0Chunnakum ext. 44 78 127 138 151 140 21.1 37.0 60.2 65.8 71.7 66.4CST 1,917 2,702 2,970 3,207 3,353 3,221 39.8 56.1 61.7 66.6 69.6 66.875 MW GT 11 37 91 218 264 222 0.5 1.9 4.6 11.1 13.4 11.3105 MW GT 7 23 49 118 143 121 0.8 2.5 5.3 12.8 15.6 13.1Trinco coal 3,285 3,336 3,371 3,364 3,347 3,360 82.6 83.9 84.8 84.6 84.2 84.5DNRO 50 100 159 167 183 169 17.9 35.7 56.8 59.5 65.3 60.2
18,235 18,235 18,235 18,234 18,232 18,233
18,235 18,235 18,235 18,235 18,235 18,235
8,657 7,252 6,216 5,124 4,370 5,029Total hydroTotal thermal 9,579 10,983 12,019 13,109 13,862 13,205
Total generationTotal demand
0 0 1 2 3 2Deficit
Page 3 of 7
Administrator
Text Box
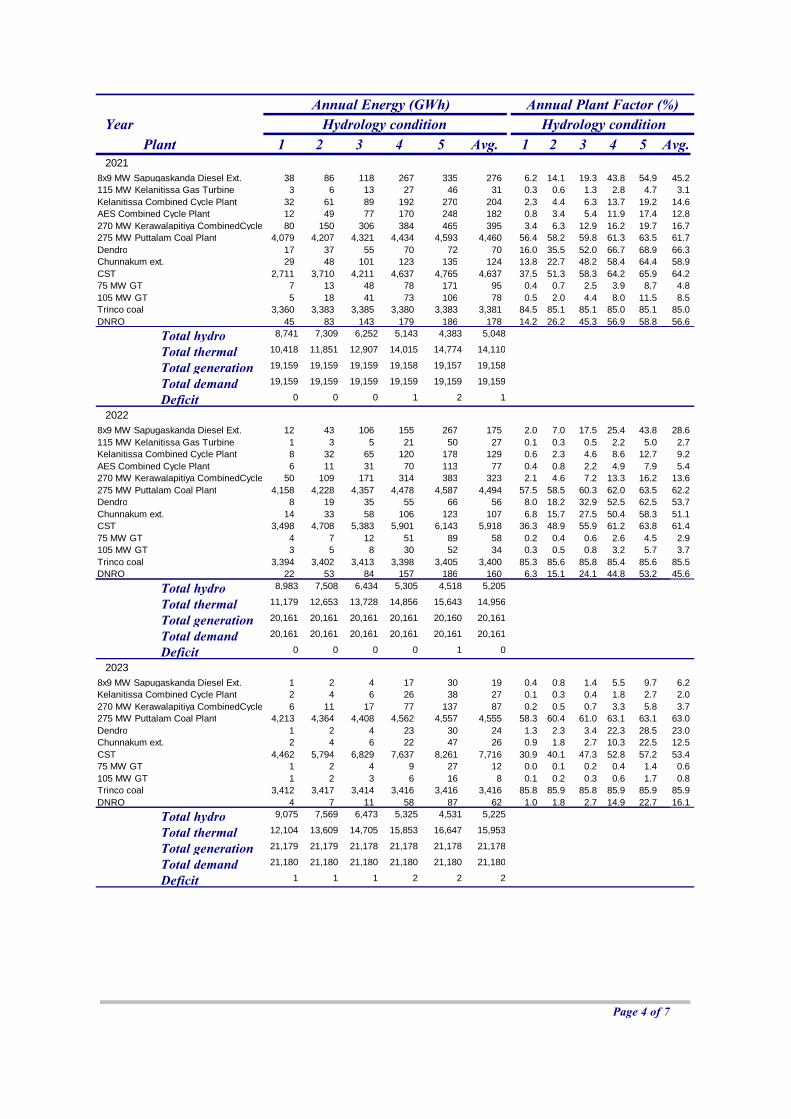
PlantYear
1 2 3 4 5 Avg. 1 2 3 4 5 Avg.
Annual Energy (GWh)Hydrology condition Hydrology condition
Annual Plant Factor (%)
20218x9 MW Sapugaskanda Diesel Ext. 38 86 118 267 335 276 6.2 14.1 19.3 43.8 54.9 45.2115 MW Kelanitissa Gas Turbine 3 6 13 27 46 31 0.3 0.6 1.3 2.8 4.7 3.1Kelanitissa Combined Cycle Plant 32 61 89 192 270 204 2.3 4.4 6.3 13.7 19.2 14.6AES Combined Cycle Plant 12 49 77 170 248 182 0.8 3.4 5.4 11.9 17.4 12.8270 MW Kerawalapitiya CombinedCycle 80 150 306 384 465 395 3.4 6.3 12.9 16.2 19.7 16.7275 MW Puttalam Coal Plant 4,079 4,207 4,321 4,434 4,593 4,460 56.4 58.2 59.8 61.3 63.5 61.7Dendro 17 37 55 70 72 70 16.0 35.5 52.0 66.7 68.9 66.3Chunnakum ext. 29 48 101 123 135 124 13.8 22.7 48.2 58.4 64.4 58.9CST 2,711 3,710 4,211 4,637 4,765 4,637 37.5 51.3 58.3 64.2 65.9 64.275 MW GT 7 13 48 78 171 95 0.4 0.7 2.5 3.9 8.7 4.8105 MW GT 5 18 41 73 106 78 0.5 2.0 4.4 8.0 11.5 8.5Trinco coal 3,360 3,383 3,385 3,380 3,383 3,381 84.5 85.1 85.1 85.0 85.1 85.0DNRO 45 83 143 179 186 178 14.2 26.2 45.3 56.9 58.8 56.6
19,159 19,159 19,159 19,158 19,157 19,158
19,159 19,159 19,159 19,159 19,159 19,159
8,741 7,309 6,252 5,143 4,383 5,048Total hydroTotal thermal 10,418 11,851 12,907 14,015 14,774 14,110
Total generationTotal demand
0 0 0 1 2 1Deficit2022
8x9 MW Sapugaskanda Diesel Ext. 12 43 106 155 267 175 2.0 7.0 17.5 25.4 43.8 28.6115 MW Kelanitissa Gas Turbine 1 3 5 21 50 27 0.1 0.3 0.5 2.2 5.0 2.7Kelanitissa Combined Cycle Plant 8 32 65 120 178 129 0.6 2.3 4.6 8.6 12.7 9.2AES Combined Cycle Plant 6 11 31 70 113 77 0.4 0.8 2.2 4.9 7.9 5.4270 MW Kerawalapitiya CombinedCycle 50 109 171 314 383 323 2.1 4.6 7.2 13.3 16.2 13.6275 MW Puttalam Coal Plant 4,158 4,228 4,357 4,478 4,587 4,494 57.5 58.5 60.3 62.0 63.5 62.2Dendro 8 19 35 55 66 56 8.0 18.2 32.9 52.5 62.5 53.7Chunnakum ext. 14 33 58 106 123 107 6.8 15.7 27.5 50.4 58.3 51.1CST 3,498 4,708 5,383 5,901 6,143 5,918 36.3 48.9 55.9 61.2 63.8 61.475 MW GT 4 7 12 51 89 58 0.2 0.4 0.6 2.6 4.5 2.9105 MW GT 3 5 8 30 52 34 0.3 0.5 0.8 3.2 5.7 3.7Trinco coal 3,394 3,402 3,413 3,398 3,405 3,400 85.3 85.6 85.8 85.4 85.6 85.5DNRO 22 53 84 157 186 160 6.3 15.1 24.1 44.8 53.2 45.6
20,161 20,161 20,161 20,161 20,160 20,161
20,161 20,161 20,161 20,161 20,161 20,161
8,983 7,508 6,434 5,305 4,518 5,205Total hydroTotal thermal 11,179 12,653 13,728 14,856 15,643 14,956
Total generationTotal demand
0 0 0 0 1 0Deficit2023
8x9 MW Sapugaskanda Diesel Ext. 1 2 4 17 30 19 0.4 0.8 1.4 5.5 9.7 6.2Kelanitissa Combined Cycle Plant 2 4 6 26 38 27 0.1 0.3 0.4 1.8 2.7 2.0270 MW Kerawalapitiya CombinedCycle 6 11 17 77 137 87 0.2 0.5 0.7 3.3 5.8 3.7275 MW Puttalam Coal Plant 4,213 4,364 4,408 4,562 4,557 4,555 58.3 60.4 61.0 63.1 63.1 63.0Dendro 1 2 4 23 30 24 1.3 2.3 3.4 22.3 28.5 23.0Chunnakum ext. 2 4 6 22 47 26 0.9 1.8 2.7 10.3 22.5 12.5CST 4,462 5,794 6,829 7,637 8,261 7,716 30.9 40.1 47.3 52.8 57.2 53.475 MW GT 1 2 4 9 27 12 0.0 0.1 0.2 0.4 1.4 0.6105 MW GT 1 2 3 6 16 8 0.1 0.2 0.3 0.6 1.7 0.8Trinco coal 3,412 3,417 3,414 3,416 3,416 3,416 85.8 85.9 85.8 85.9 85.9 85.9DNRO 4 7 11 58 87 62 1.0 1.8 2.7 14.9 22.7 16.1
21,179 21,179 21,178 21,178 21,178 21,178
21,180 21,180 21,180 21,180 21,180 21,180
9,075 7,569 6,473 5,325 4,531 5,225Total hydroTotal thermal 12,104 13,609 14,705 15,853 16,647 15,953
Total generationTotal demand
1 1 1 2 2 2Deficit
Page 4 of 7
Administrator
Text Box
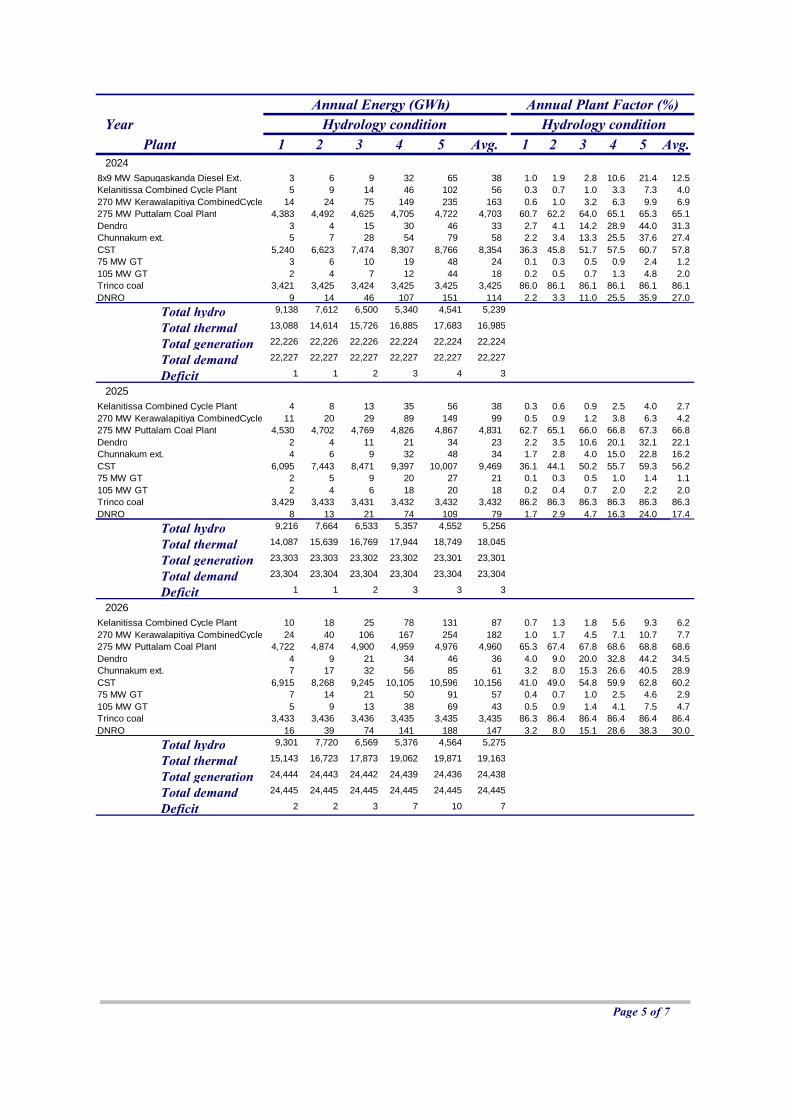
PlantYear
1 2 3 4 5 Avg. 1 2 3 4 5 Avg.
Annual Energy (GWh)Hydrology condition Hydrology condition
Annual Plant Factor (%)
20248x9 MW Sapugaskanda Diesel Ext. 3 6 9 32 65 38 1.0 1.9 2.8 10.6 21.4 12.5Kelanitissa Combined Cycle Plant 5 9 14 46 102 56 0.3 0.7 1.0 3.3 7.3 4.0270 MW Kerawalapitiya CombinedCycle 14 24 75 149 235 163 0.6 1.0 3.2 6.3 9.9 6.9275 MW Puttalam Coal Plant 4,383 4,492 4,625 4,705 4,722 4,703 60.7 62.2 64.0 65.1 65.3 65.1Dendro 3 4 15 30 46 33 2.7 4.1 14.2 28.9 44.0 31.3Chunnakum ext. 5 7 28 54 79 58 2.2 3.4 13.3 25.5 37.6 27.4CST 5,240 6,623 7,474 8,307 8,766 8,354 36.3 45.8 51.7 57.5 60.7 57.875 MW GT 3 6 10 19 48 24 0.1 0.3 0.5 0.9 2.4 1.2105 MW GT 2 4 7 12 44 18 0.2 0.5 0.7 1.3 4.8 2.0Trinco coal 3,421 3,425 3,424 3,425 3,425 3,425 86.0 86.1 86.1 86.1 86.1 86.1DNRO 9 14 46 107 151 114 2.2 3.3 11.0 25.5 35.9 27.0
22,226 22,226 22,226 22,224 22,224 22,224
22,227 22,227 22,227 22,227 22,227 22,227
9,138 7,612 6,500 5,340 4,541 5,239Total hydroTotal thermal 13,088 14,614 15,726 16,885 17,683 16,985
Total generationTotal demand
1 1 2 3 4 3Deficit2025
Kelanitissa Combined Cycle Plant 4 8 13 35 56 38 0.3 0.6 0.9 2.5 4.0 2.7270 MW Kerawalapitiya CombinedCycle 11 20 29 89 149 99 0.5 0.9 1.2 3.8 6.3 4.2275 MW Puttalam Coal Plant 4,530 4,702 4,769 4,826 4,867 4,831 62.7 65.1 66.0 66.8 67.3 66.8Dendro 2 4 11 21 34 23 2.2 3.5 10.6 20.1 32.1 22.1Chunnakum ext. 4 6 9 32 48 34 1.7 2.8 4.0 15.0 22.8 16.2CST 6,095 7,443 8,471 9,397 10,007 9,469 36.1 44.1 50.2 55.7 59.3 56.275 MW GT 2 5 9 20 27 21 0.1 0.3 0.5 1.0 1.4 1.1105 MW GT 2 4 6 18 20 18 0.2 0.4 0.7 2.0 2.2 2.0Trinco coal 3,429 3,433 3,431 3,432 3,432 3,432 86.2 86.3 86.3 86.3 86.3 86.3DNRO 8 13 21 74 109 79 1.7 2.9 4.7 16.3 24.0 17.4
23,303 23,303 23,302 23,302 23,301 23,301
23,304 23,304 23,304 23,304 23,304 23,304
9,216 7,664 6,533 5,357 4,552 5,256Total hydroTotal thermal 14,087 15,639 16,769 17,944 18,749 18,045
Total generationTotal demand
1 1 2 3 3 3Deficit2026
Kelanitissa Combined Cycle Plant 10 18 25 78 131 87 0.7 1.3 1.8 5.6 9.3 6.2270 MW Kerawalapitiya CombinedCycle 24 40 106 167 254 182 1.0 1.7 4.5 7.1 10.7 7.7275 MW Puttalam Coal Plant 4,722 4,874 4,900 4,959 4,976 4,960 65.3 67.4 67.8 68.6 68.8 68.6Dendro 4 9 21 34 46 36 4.0 9.0 20.0 32.8 44.2 34.5Chunnakum ext. 7 17 32 56 85 61 3.2 8.0 15.3 26.6 40.5 28.9CST 6,915 8,268 9,245 10,105 10,596 10,156 41.0 49.0 54.8 59.9 62.8 60.275 MW GT 7 14 21 50 91 57 0.4 0.7 1.0 2.5 4.6 2.9105 MW GT 5 9 13 38 69 43 0.5 0.9 1.4 4.1 7.5 4.7Trinco coal 3,433 3,436 3,436 3,435 3,435 3,435 86.3 86.4 86.4 86.4 86.4 86.4DNRO 16 39 74 141 188 147 3.2 8.0 15.1 28.6 38.3 30.0
24,444 24,443 24,442 24,439 24,436 24,438
24,445 24,445 24,445 24,445 24,445 24,445
9,301 7,720 6,569 5,376 4,564 5,275Total hydroTotal thermal 15,143 16,723 17,873 19,062 19,871 19,163
Total generationTotal demand
2 2 3 7 10 7Deficit
Page 5 of 7
Administrator
Text Box
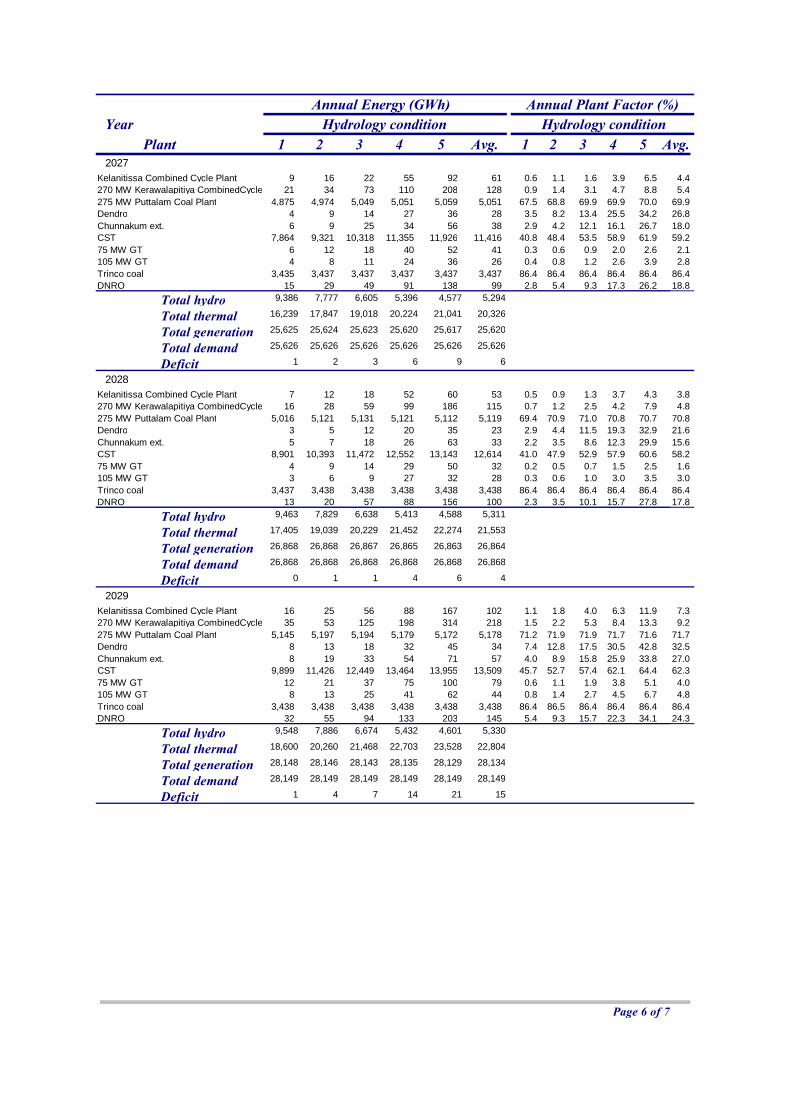
PlantYear
1 2 3 4 5 Avg. 1 2 3 4 5 Avg.
Annual Energy (GWh)Hydrology condition Hydrology condition
Annual Plant Factor (%)
2027Kelanitissa Combined Cycle Plant 9 16 22 55 92 61 0.6 1.1 1.6 3.9 6.5 4.4270 MW Kerawalapitiya CombinedCycle 21 34 73 110 208 128 0.9 1.4 3.1 4.7 8.8 5.4275 MW Puttalam Coal Plant 4,875 4,974 5,049 5,051 5,059 5,051 67.5 68.8 69.9 69.9 70.0 69.9Dendro 4 9 14 27 36 28 3.5 8.2 13.4 25.5 34.2 26.8Chunnakum ext. 6 9 25 34 56 38 2.9 4.2 12.1 16.1 26.7 18.0CST 7,864 9,321 10,318 11,355 11,926 11,416 40.8 48.4 53.5 58.9 61.9 59.275 MW GT 6 12 18 40 52 41 0.3 0.6 0.9 2.0 2.6 2.1105 MW GT 4 8 11 24 36 26 0.4 0.8 1.2 2.6 3.9 2.8Trinco coal 3,435 3,437 3,437 3,437 3,437 3,437 86.4 86.4 86.4 86.4 86.4 86.4DNRO 15 29 49 91 138 99 2.8 5.4 9.3 17.3 26.2 18.8
25,625 25,624 25,623 25,620 25,617 25,620
25,626 25,626 25,626 25,626 25,626 25,626
9,386 7,777 6,605 5,396 4,577 5,294Total hydroTotal thermal 16,239 17,847 19,018 20,224 21,041 20,326
Total generationTotal demand
1 2 3 6 9 6Deficit2028
Kelanitissa Combined Cycle Plant 7 12 18 52 60 53 0.5 0.9 1.3 3.7 4.3 3.8270 MW Kerawalapitiya CombinedCycle 16 28 59 99 186 115 0.7 1.2 2.5 4.2 7.9 4.8275 MW Puttalam Coal Plant 5,016 5,121 5,131 5,121 5,112 5,119 69.4 70.9 71.0 70.8 70.7 70.8Dendro 3 5 12 20 35 23 2.9 4.4 11.5 19.3 32.9 21.6Chunnakum ext. 5 7 18 26 63 33 2.2 3.5 8.6 12.3 29.9 15.6CST 8,901 10,393 11,472 12,552 13,143 12,614 41.0 47.9 52.9 57.9 60.6 58.275 MW GT 4 9 14 29 50 32 0.2 0.5 0.7 1.5 2.5 1.6105 MW GT 3 6 9 27 32 28 0.3 0.6 1.0 3.0 3.5 3.0Trinco coal 3,437 3,438 3,438 3,438 3,438 3,438 86.4 86.4 86.4 86.4 86.4 86.4DNRO 13 20 57 88 156 100 2.3 3.5 10.1 15.7 27.8 17.8
26,868 26,868 26,867 26,865 26,863 26,864
26,868 26,868 26,868 26,868 26,868 26,868
9,463 7,829 6,638 5,413 4,588 5,311Total hydroTotal thermal 17,405 19,039 20,229 21,452 22,274 21,553
Total generationTotal demand
0 1 1 4 6 4Deficit2029
Kelanitissa Combined Cycle Plant 16 25 56 88 167 102 1.1 1.8 4.0 6.3 11.9 7.3270 MW Kerawalapitiya CombinedCycle 35 53 125 198 314 218 1.5 2.2 5.3 8.4 13.3 9.2275 MW Puttalam Coal Plant 5,145 5,197 5,194 5,179 5,172 5,178 71.2 71.9 71.9 71.7 71.6 71.7Dendro 8 13 18 32 45 34 7.4 12.8 17.5 30.5 42.8 32.5Chunnakum ext. 8 19 33 54 71 57 4.0 8.9 15.8 25.9 33.8 27.0CST 9,899 11,426 12,449 13,464 13,955 13,509 45.7 52.7 57.4 62.1 64.4 62.375 MW GT 12 21 37 75 100 79 0.6 1.1 1.9 3.8 5.1 4.0105 MW GT 8 13 25 41 62 44 0.8 1.4 2.7 4.5 6.7 4.8Trinco coal 3,438 3,438 3,438 3,438 3,438 3,438 86.4 86.5 86.4 86.4 86.4 86.4DNRO 32 55 94 133 203 145 5.4 9.3 15.7 22.3 34.1 24.3
28,148 28,146 28,143 28,135 28,129 28,134
28,149 28,149 28,149 28,149 28,149 28,149
9,548 7,886 6,674 5,432 4,601 5,330Total hydroTotal thermal 18,600 20,260 21,468 22,703 23,528 22,804
Total generationTotal demand
1 4 7 14 21 15Deficit
Page 6 of 7
Administrator
Text Box

PlantYear
1 2 3 4 5 Avg. 1 2 3 4 5 Avg.
Annual Energy (GWh)Hydrology condition Hydrology condition
Annual Plant Factor (%)
2030Kelanitissa Combined Cycle Plant 15 24 44 71 107 77 1.1 1.7 3.1 5.1 7.6 5.5270 MW Kerawalapitiya CombinedCycle 34 51 86 175 268 190 1.4 2.2 3.7 7.4 11.3 8.1275 MW Puttalam Coal Plant 5,220 5,246 5,250 5,235 5,235 5,235 72.2 72.6 72.7 72.4 72.4 72.4Dendro 5 7 17 30 42 32 4.7 6.2 15.8 29.0 39.6 30.5Chunnakum ext. 8 11 20 47 57 48 3.8 5.2 9.4 22.3 27.0 22.8CST 11,164 12,750 13,818 14,797 15,397 14,864 46.3 52.9 57.4 61.4 63.9 61.775 MW GT 12 21 30 72 97 75 0.6 1.1 1.5 3.7 4.9 3.8105 MW GT 8 13 17 40 67 44 0.8 1.4 1.9 4.3 7.2 4.8Trinco coal 3,438 3,438 3,438 3,438 3,438 3,438 86.5 86.5 86.5 86.5 86.5 86.5DNRO 24 31 82 135 159 137 3.7 5.0 13.1 21.3 25.3 21.7
29,489 29,487 29,483 29,476 29,469 29,475
29,491 29,491 29,491 29,491 29,491 29,491
9,562 7,895 6,680 5,436 4,603 5,333Total hydroTotal thermal 19,927 21,592 22,803 24,040 24,866 24,142
Total generationTotal demand
1 4 7 15 21 16Deficit2031
Kelanitissa Combined Cycle Plant 15 24 32 73 113 79 1.0 1.7 2.3 5.2 8.1 5.7270 MW Kerawalapitiya CombinedCycle 33 50 73 147 222 159 1.4 2.1 3.1 6.2 9.4 6.7275 MW Puttalam Coal Plant 5,270 5,296 5,295 5,283 5,286 5,284 72.9 73.3 73.3 73.1 73.1 73.1Dendro 5 9 11 28 35 29 4.5 8.1 10.7 27.0 33.1 27.7Chunnakum ext. 8 11 18 33 57 37 3.7 5.1 8.8 15.5 26.9 17.5CST 12,421 14,032 15,184 16,203 16,779 16,262 46.9 53.0 57.3 61.2 63.3 61.475 MW GT 12 21 30 47 77 52 0.6 1.1 1.5 2.4 3.9 2.7105 MW GT 7 13 18 32 54 36 0.8 1.4 1.9 3.4 5.9 3.9Trinco coal 3,438 3,439 3,439 3,439 3,439 3,439 86.5 86.5 86.5 86.5 86.5 86.5DNRO 24 33 58 127 183 136 3.6 4.9 8.7 19.1 27.5 20.4
30,880 30,878 30,874 30,866 30,859 30,865
30,882 30,882 30,882 30,882 30,882 30,882
9,647 7,952 6,717 5,455 4,615 5,352Total hydroTotal thermal 21,233 22,926 24,157 25,411 26,244 25,513
Total generationTotal demand
2 4 8 16 23 17Deficit2032
Kelanitissa Combined Cycle Plant 15 24 33 76 75 74 1.1 1.7 2.3 5.4 5.3 5.3270 MW Kerawalapitiya CombinedCycle 33 51 84 144 184 150 1.4 2.2 3.5 6.1 7.8 6.3275 MW Puttalam Coal Plant 5,317 5,336 5,333 5,326 5,322 5,326 73.6 73.8 73.8 73.7 73.7 73.7Dendro 5 6 13 20 35 22 4.5 6.0 12.1 18.7 33.5 21.4Chunnakum ext. 8 11 15 31 52 35 3.6 5.0 7.3 14.9 24.7 16.6CST 13,737 15,384 16,537 17,628 18,263 17,696 47.5 53.2 57.2 61.0 63.2 61.275 MW GT 12 22 31 48 73 52 0.6 1.1 1.6 2.4 3.7 2.6105 MW GT 8 13 18 31 48 34 0.9 1.4 2.0 3.4 5.3 3.7Trinco coal 3,439 3,439 3,439 3,439 3,439 3,439 86.5 86.5 86.5 86.5 86.5 86.5DNRO 25 34 69 98 190 115 3.6 4.9 9.8 14.0 27.1 16.4
32,331 32,328 32,324 32,315 32,307 32,314
32,333 32,333 32,333 32,333 32,333 32,333
9,732 8,008 6,753 5,474 4,628 5,371Total hydroTotal thermal 22,599 24,320 25,571 26,841 27,680 26,943
Total generationTotal demand
2 5 9 18 26 19Deficit
Page 7 of 7
Administrator
Text Box