LSSA PROJECT TASK REPORT LSSA FIELD TEST ACTIVITY … Field Test... · LSSA FIELD TEST ACTIVITY...
29
Transcript of LSSA PROJECT TASK REPORT LSSA FIELD TEST ACTIVITY … Field Test... · LSSA FIELD TEST ACTIVITY...


LSSA PROJECT TASK REPORT
5101-39
LSSA FIELD TEST ACTIVITY SYSTEM DESCRIPTION
August 3, 1977
JET PROPULSION LABORATORY
CALIFORNIA INSTITUTE OF TECHNOLOGY
PASADENA, CALIFORNIA
DISTRIBUTION
R. Forney--------------------------------- 169-422 J. Goldsmith------------------------------ 169-422 R. McDonald------------------------------- 169-527 R. Lutwack -------------------------------- 125-147 G. Cumming--------------------------------- T-1073 W. Callaghan------------------------------ 169-422 D. Bickler-------------------------------- FHB-201 C. Coulbert -------------------------------- 67-201 L. Runkle--------------------------------- 157-102 R. Ross----------------------------------- 157-507 L. Dumas---------------------------------- 157-102 J. Arnett--------------------------------- 157-507 W. Bishop---------------------------------- 72-112 K. Anhalt---------------------------------- 72-112 E. Schneider------------------------------ 180-504 R. Downing--------------------------------- 198-B9 E. Christensen---------------------------- 169-422 R. Conover-------------------------------- 233-316 R. Greenwood------------------~------------ 198-B9 M. Smokler -------------------------------- 183-901 J. Griffith----------------------------------- 150 E. Headrick------------------------------- 248-101 R. Grippi--------------------------------- 158-224 R. Kocsis--------------------------------- 233-307 R. Lee--------------------------------------- 79-6 R. Mueller--------------------------------- 198-B9 R. Webster-------------------------------- 125-147 J. Repar ---------------------------------- 157-316 L. Sidwell-------------------------------- 125-147 S. Sollock-------------------------------- 158-205 J. Stultz--------------------------------- 157-102 P. Tsou----------------------------------- 156-203 J. Wang----------------------------------- 144-218 A. Hoffman-------------------------------- 144-218 R. Barlow--------------------------------- 157-205 J. Spiegel-------------------------------- 157-102 R. Embry---------------------------------- 200-119 J. Donhauser ------------------------------ 125-128 D. LoGiurato ------------------------------ 144-218 L. Parker -------------------------------------79-6
LSSA FIELD TEST ACTIVITY SYSTEM DESCRIPTION
SECTION I
INTRODUCTION
The purpose of this memorandum is to provide details of the current status and plans of the Field Testing Activity. An attempt has been made to incorporate into these plans the capability of being responsive to the changing needs of the Project. This has, hopefully, been accomplished by not only recognizing near-ter~ requirements but also by providing imbedded flexibility in the structure of the Activity.
The objectives of the Activity are to:
(1) Obtain high quality continuous performance field data on a limited quantity of modules.
(2) Track module degradation to provide a base for the development of endurance projection techniques.
(3) Develop improved in-situ diagnostic testing tools and analytical techniques.
(4) Provide confirmation data for qualification testing.
(5) Provide real-time/real-weather facilities for general Project use.
SECTION II
TEST FACILITIES
The Activity currently has three test sites - the principal site at JPL (an urban exposure) and two secondary sites: one at Table Mountain in the San Bernardino Mountains (an alpine exposure), and one at Goldstone (a high desert exposure). Establishment of a fourth site, adjacent to the ocean at the Coast Guard station at Point Vicente on the Palos Verdes Peninsula, is also being proposed. A request was made to the Coast Guard on June 21. The Commanding Officer of the station formally endorsed the proposal on July 25; final approval from the District Commander is expected.
At the writing of this memo, the Table Mountain and Goldstone facilities were complete and a facilities service contract had been let for completion of the JPL site. The following table shows the number of test stands currently at each site, the number that will be there at completion, and the anticipated completion dates. Indicated also is the proposed Point Vicente site. The plan for that site calls for 8 stands, which would make it identical in capacity to the other two secondary sites.
1

Site No. of Test Stands No. of Test Stands Anticipated Now Installed at Completion Completion Date
JPL 15 33 Sept. 9' 1977
Table Mountain 8 8 May 20, 1977
Goldstone 8 8 July 25, 1977
(Point Vicente) (8)
Figures 1, 2, and 3 contain photographs showing the JPL, Table Mountain and Goldstone sites. The Table Mountain and Goldstone photographs show the sites as they were before the final 4 stands were installed.
All the stands at the sites are identical, and all are oriented with their tilt axes east-west. Each has the capability of holding the equivalent of two 4 x 4-ft subarrays. The mounting rack upon which the subarrays are fixed can be pivoted to different tilt angles by unbolting two bolts. Holes are provided for tilt angles of O, 15, 30, 34, 45 and SO degrees; however, others can be drilled if desired. Figure 4 shows the details of one of the stands. The supporting I-beam posts are made of galvanized steel, and are anchored into the ground with concrete. The upper portions of the stands are made of anodized aluminum. The three I-beam members of the mounting racks provide a great deal of latitude in the manner in which subarrays can be mounted and the sizP of test units that can be accommodated. It is conceivable, for insLance, that a very large array covering two or more stands could be tested.
SECTION III
JPL SITE
The drawing in Figure 5 shows an aerial view of the JPL Site as it will be at completion. The field is situated just south and across the road from Building 248. It is bounded on the south and east by the edge of a hill, and on the north and west by a chain link fence. At the northeast corner of the field is the field test trailer (Trailer No. 1198) which houses the data system, a work room and a display room.
At the southwest corner of the field are two 5 x 5-foot concrete slabs. The slab farthest east supports the rain gage. The other slab has the most unobstructed view and will support a suntracker and instrumentation. Current plans call for a pyroheliometer and a turbidity measuring device to be mounted on the tracker. At the northwest corner of the field just south of the trailer is a mast supporting a skyvane for measuring wind direction and speed. Mounted above the trailer and to the side on the mast is a radiation shield containing humidity and temperature sensors. Lower down on the mast is a tiltable
2

w
Figure 1. JPL Field Test Site
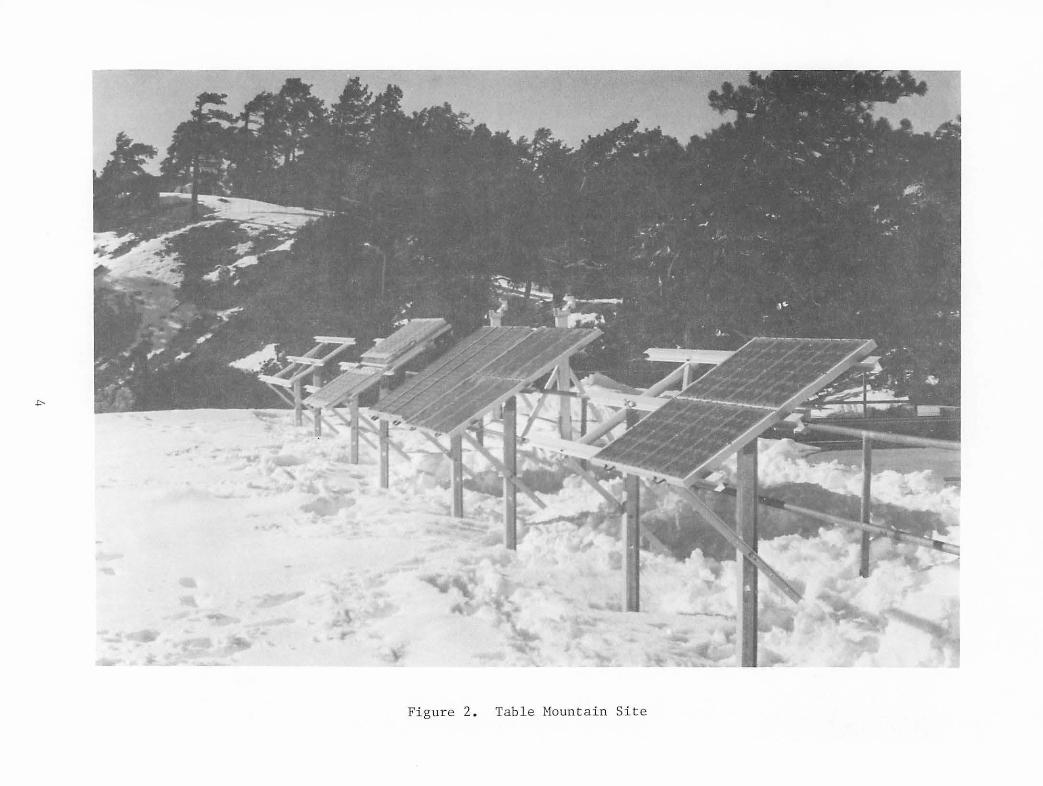
Fi gure 2 . Ta b l e Mounta in Site
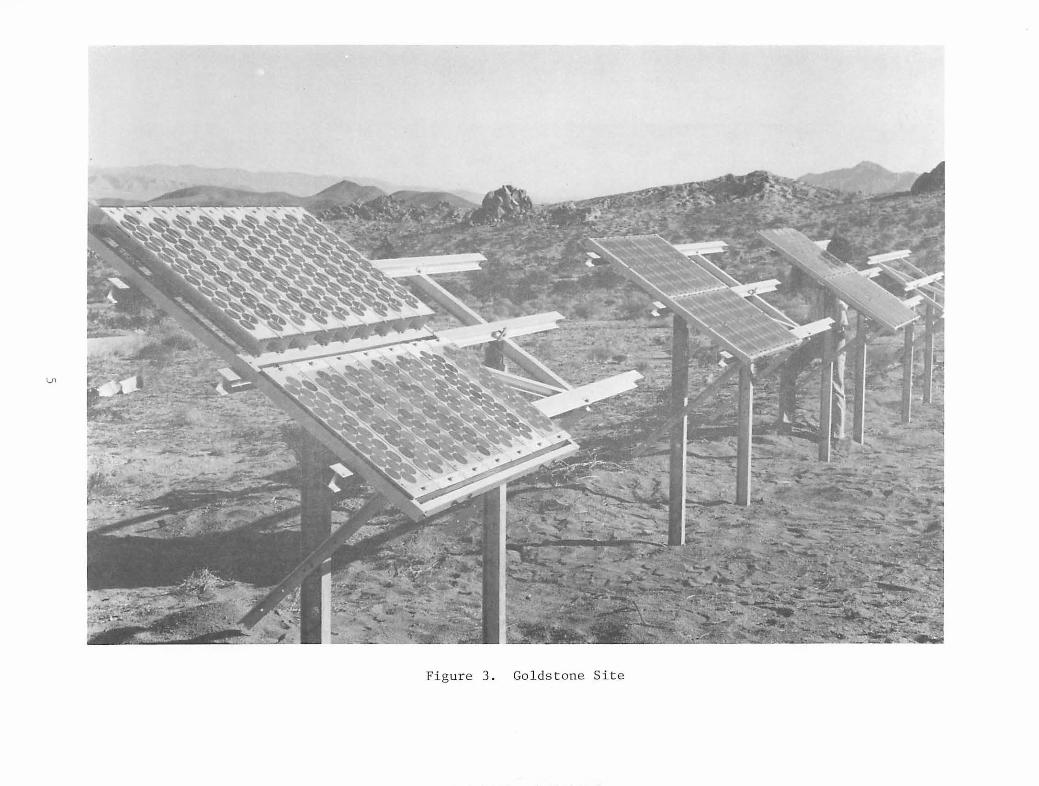
Figure 3. Golds t one Site

Figure 4. Test Stand

4\ ft
~s:,4 f:,:t ~~~=\ l'\ElO tESl tAA\\.f.R
__ __,r-,:a:~~-:::;:::::ao- su&MERGEO v,/\REWAYS
11 00 0mww mm0

pyranometer table. The activity currently has two pyranometers that will be mounted on the table, an Eppley and a Star. The height of the skyvane can be adjusted; it will typically be set at about 12 ft above the trailer.
In laying out the field, careful consideration was placed on the shadowing factor. Because of the limited amount of area at the test site a compromise between tolerable shadowing and the space between rows of stands had to be achieved. Figure 6 shows the time for termination of any shadows based upon the tilt angle and the space between rows on December 21, 1976. The times shown are referenced to solar noon. From the plot it can be seen that the greater the tilt angle the later the shadow will persist. For a 35-degree tilt angle a spacing of 9 ft would be required to insure no shadowing by 9 a.m. (solar time). After considering all the factors and recognizing that this plot depicts the worst case of December 21, a row spacing of 8 ft was selected.
SECTION IV
TABLE MOUNTAIN AND GOLDSTONE SITES
All of the stands at both of these sites are aligned east-west in a row, as shown in Figures 2 and 3, Some weather instrumentation exists at both sites. A review of the type of instrumentation, the accessibility of the information from these instruments, and the appropriateness of their data for our needs is currently being made. Some additional instrumentation and/or arrangements with the resident personnel may be required.
SECTION V
MODULE DEPLOYMENT
All of the modules from the Block I procurement designated for field testing have been deployed. The following table shows the distribution of those modules by manufacturer.
Manufacturer Modules/Subarray JPL Table Mountain Goldstone
Sensor Tech 14 58 14 14 Spectrolab 18 38 18 18 Solarex 8 33 8 8 Solar Power 6 14 6 6
Total 143 46 46
Of those at the JPL Site, two from each vendor are on a "long-term dirt subarray."
8

,t
:c I-C) z w _.J
~ 0 0 ,c( :c V,
Vl
SOLAR NOON
7
6
5
4
3
2
11 :00
SHADOW BOUNDARY FOR X = 9 ft
10:00 9:00 8:30
1 ... s---•-1 •~-------x~-------~•
SOUTHERN STAND
NORTHERN STAND
QL--------------------------------------------
Figure 6. Shadow Termination Plot for December 21

The following table shows the planned deployment of the Block II procurement modules.
Manufacturer Modules/Subarray JPL Table Mountain Goldstone
Sensor Tech 8 32 8 8 Spectrolab 3 12 3 3 Solarex 4 16 4 4 Solar Power 3 12 3 3
Total 72 18 18
These modules are being deployed as they become available. At this writing, approximately 50% had been deployed.
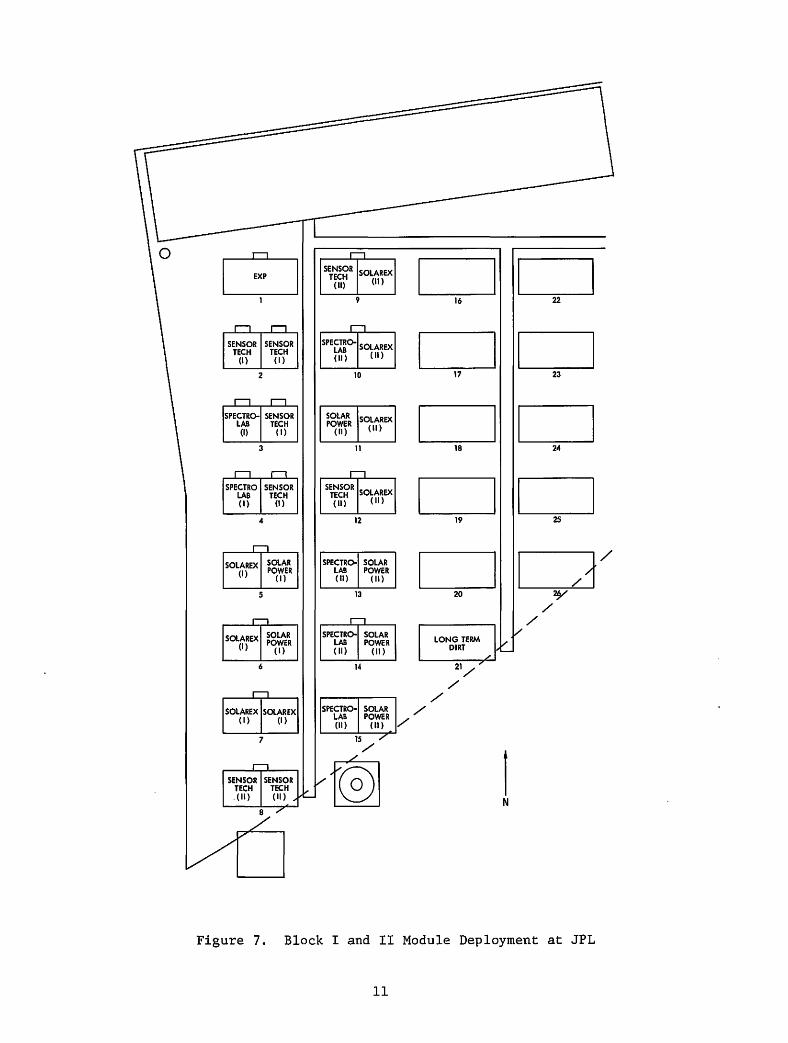
Figure 7 shows the planned deployment at the JPL Site, by subarray, for both the Block I and Block II procurements. The Block I modules are deployed on stands 2 through 7 and the Block II modules will be deployed on stands 8 through 15. Stands 4, 5, 12, and 13 are denoted as "medium duration dirt subarrays." Stand 1 is designated as the "experimental stand." It is intended to be used for short-term tests. Stand 21 will contain the Block I "long-term dirt subarray" and a companion dirt subarray from the Block II procurement (not specified in the above table). The modules on these subarrays will not be artificially cleaned. In general, the arrangement of subarrays was chosen to: (1) segregate the different procurements, (2) group them in such a way as to optimize the data acquisition multiplexing, and (3) organize them according to the dirt testing and, therefore, the washing strategy.
SECTION VI
DATA ACQUISITION, JPL SITE
A. HARDWARE
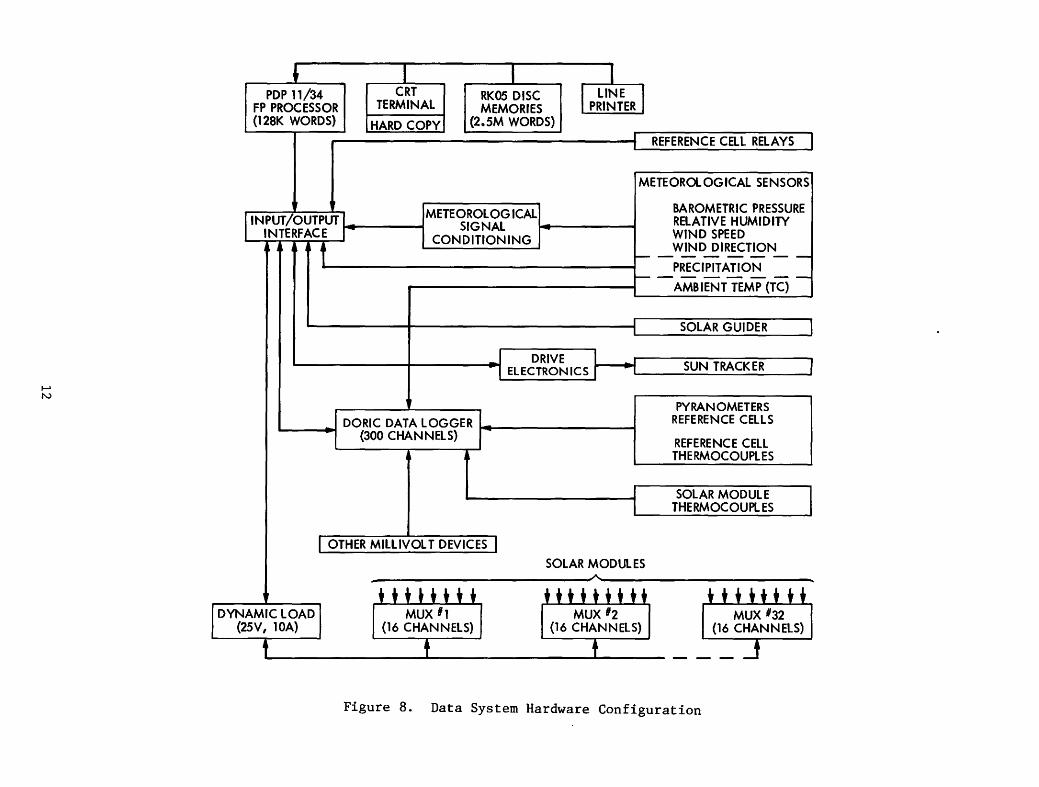
Data acquisition at the JPL Site will be accomplished by means of a fully automated system consisting of a PDP 11/34 minicomputer as its central element, a dynamic load for the generation of module or subarray I-V data, a DORIC 220 data logger for the acquisition of millivolt sensor signals from devices such as thermocouples and reference cells, and meterological sensors and the accompanying interface electronics. Figure 8 shows the hardware configuration. All of the equipment with the exception of the meteorological sensors and the dynamic load multiplexers (discussed later) are housed in the west end of the field test trailer (see Figure 5).
10
[:] I I 9 16 22
I I 17 23
I I 3 II 18 24
I I 19 25
/r SPECTRO- SOLAR
I I LAB POWER (II) (11)
5 13 20 7¥ /
/ LONG TERM
DIRT
6 14 21/
/ /
/ /
7 15 /
1 0 N
Figure 7. Block I and II Module Deployment at JPL
11
PDP 11/34 FP PROCESSOR (128K WORDS)
CRT TERMINAL
HARD COPY
RK05 DISC MEMORIES
(2o5M WORDS)
LINE PRINTER
INPUT 'OUTPUT METEOROLOGICAL ,, t4-----. SIGNAL ~-------.. INTERFACE CONDITIONING
DRIVE ELECTRONICS
DORIC DATA LOGGER 14---------"'""4 --.....-i (300 CHANNELS)
OTHER MILLIVOLT DEVICES
REFERENCE Cal RELAYS
METEOROLOGICAL SENSORS
BAROMETRIC PRESSURE RELATIVE HUMIDITY WIND SPEED WIND DIRECTION ------PRECIPITATION ------AMBIENT TEMP (TC)
SOLAR GUIDER
SUN TRACKER
PY RAN OMETERS REFERENCE CRLS
REFERENCE CELL THERMOCOUPLES
SOLAR MODULE THERMOCOUPLES
SOLAR MODUl ES
DYNAMIC LOAD (25V, 10A)
"-------------.......1~--~---------------- - -
Figure 8. Data System Hardware Configuration

The 11/34 is equipped with 128K words of memory, a floating point processor, Fortran IV Plus programming language, a VTSS CRT terminal with hard copy capability and an LA180 line printer. The DORIC has available 300 input channels, expandable to 1000 if required. It is configured to accept chromel-constantan thermocouple leads or analog input signals in the 0-30 mV and 0-300 mV range. The resolution in the Oto 30 mV range is 1 µV and the resolution in the higher range is 10 µV. The DORIC (as well as all the components in the system) is slaved to the computer; in that configuration it collects approximately 5 channels of data per second.
The dynamic load has a capacity of 10 A and 25 V. On demand from the computer it sends a prescribed current to a designated solar module. The accuracy of the current delivered is specified to be within± .5% of the programmed value for current values of 200 mA or greater. Below that value it is within± 1 mA. The measured voltage is specified to be within± .5% of the actual value for voltages of 2 V or more, and within ± 10 mA for voltages less than that.
Attached to the back of each test stand is a 24 x 20 x 8-inch rain-tight junction box. A few of the stands have two boxes because of the number of modules they service. The junction boxes are connected via 2-in conduits to 6-in square north-south rain-tight wireways submerged in the gutters shown in Figure 5. These wireways junction with the main east-west wireway, which terminates in the trailer. Each box is capable of accommodating a computer-controlled 16-channel multiplexer unit, terminal junctions for thermocouples, etc. Depending upon the arrangement of the modules nearby, each box will contain either a multiplexer unit or serve as a depot before going to the box containing the assigned multiplexer. Wiring will be routed through the junction boxes as much as possible.
The designated multiplex stations for the first 15 stands are indicated by small rectangles attached to the rears of the stands in Figure 7. Stands 2, 3 and 4 each have two stations to accommodate the large number of modules at those stands, whereas the stations at stands 10, 13 and 14 wil"l accommodate the modules from neighboring stands. It is important to note that except for the extra boxes at Stands 2, 3, and 4 the field can be reconfigured since each stand has at least one junction box capable of accommodating a multiplex card and thus becoming a multiplex station.
The system is sized for 32 MUX stations for a total of 512 modules. The computer directs the traffic between the dynamic load and the module via the MUX station and can individually access any module in the field. Similarly, the computer also directs traffic to and from the DORIC and weather sensors. The JPL custom software will control all the activities of acquisition, reduction, storage and display of the data. The details of the software are presented in more detail later.
The meteorological equipment in the system includes the following:
lJ

(l) One Weather Measure Corporation Model WlOl-P Skyvane I Wind Sensor, which gives both wind speed and wind direction.
(2) One Weather Measure Corporation Model B242 Analog Output Barometer.
(3) One Weather Measure Corporation Model HM Relative Humidity Sensor.
(4) One Weather Measure Corporation Model P501-l Tipping Bucket Rain Gage.
(5) A thermocouple for the ambient temperature.
The thermocouple and the humidity sensor are housed in a Weather Measure Corporation Model IS6 Aspirated Radiation Shield. All of the signals from these devices, except the thermocouple, go to an Instrumentation Technology Corporation Signal Conditioner, which is linked to the computer. The environmental sensor thermocouple is connected to the DORIC, as are all thermocouples in the system. A nominal ongoing check on the DORIC is made with a thermocouple mounted inside the trailer. This temperature will be recorded every time weather data is taken.
Behind Stand 11 is a bank of eight reference cell units. Associated with each module in the field will be a unit containing a reference cell made from the same material as the module itself. Each unit consists of a cylindrical housing and a pneumatically operated upper watertight door. Just below the door and inside the cylinder is the reference cell, mounted on a large piece of copper that has a thermocouple imbedded in it. The cells are mounted so that they are parallel to the modules in the field. The door will be shielded from direct sunlight by an insulating cover. Upon conunand of the computer the door will be opened, exposing the cell to sunlight. Both the reference cell and the thermocouple signals are measured by the DORIC.
Figure 9 contains a photograph showing the bank of reference cell units; two of them have prototype insulation covers. Each type of module in the field will have its own reference cell. Therefore, this bank is sufficient only for the Block I and II procurements. For subsequent procurements additional reference cell units will be required unless there is a satisfactory match with existing ones.
B. SOFTWARE
The acqusition of data will exist in two distinct but complementar: modes: the dedicated mode, providing automatic daily acquisition of basic I-V, weather, and insolation data, and the interactive or demand mode. In the interactive mode an operator can go to the CRT terminal and request information from almost any device in the field. The operator can also request that this information be provided repeatedly at a selected interval. In the dedicated mode an I-V curve will be generated for each of the modules in the field once a day at a predetermined insolation level, or in the event of an overcast day, at
14
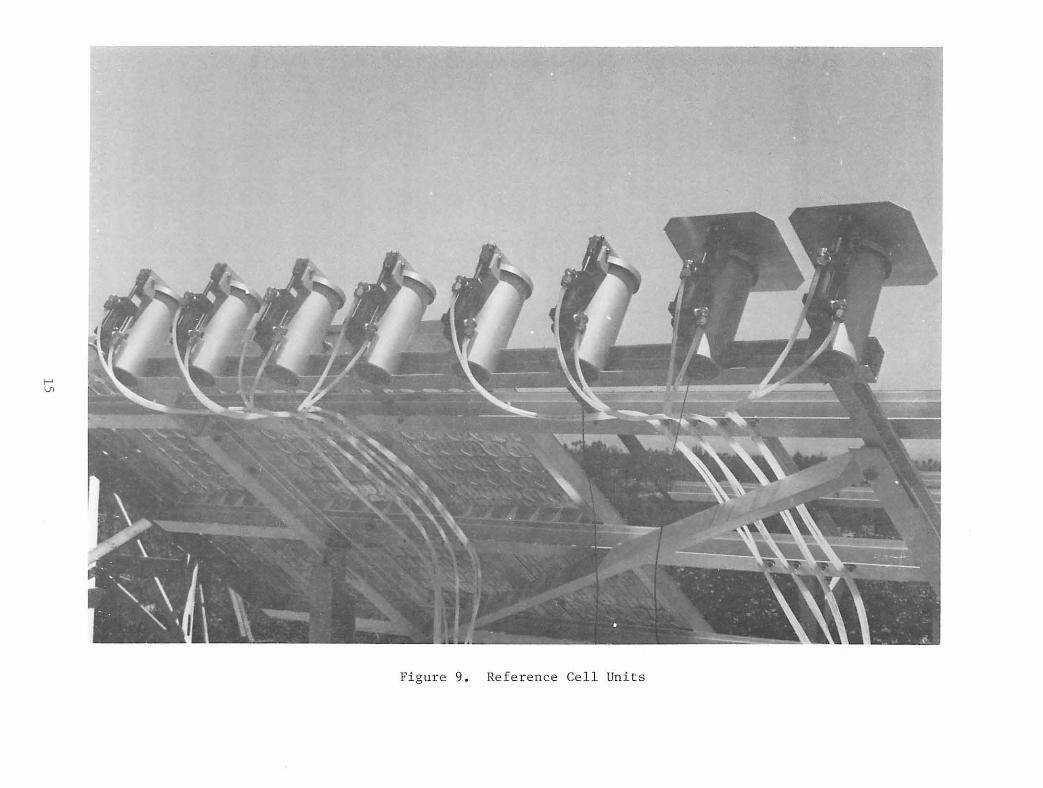
Figure 9. Re ference Cell Units

solar noon. The weather data will be obtained every 15 minutes, 24 hours a day, and insolation data every 5 minutes from sunrise to sunset.
The readings from standard cells form the basis for correcting the I-V data to the reference insolation level. The temperature used to correct the data will be obtained as follows: Three thermocouples will be judiciously placed on three modules of each subarray. At essentially the same time as any module in the subarray is interrogated the temperature readings from the three thermocouples will be taken. The average of the three will be used for the module temperature correction.
To best understand the dedicated mode it is worthwhile to look at the sequence of events for one day: At midnight the MIDNIGHT TASK is initiated. The task determines what day of the week (some special tasks occur once a week) and whether it is a weekend day or holiday. When it is a weekend or holiday the printer is inhibited and the summary tasks are rescheduled. It then calls up the SUN PREDICTOR TASK which calculates sunrise, sunset and solar noon based upon the new declination angle and equation-of-time for the day.· The REPOSITION SOLAR TRACKER TASK is then called up and drives the tracker (when one is obtained) to the correct azimuth and elevation angles for sunrise. The WEATHER DATA ACQUISITION TASK is also re-initiated for another day. At sunrise, or a short time afterward, the INSOLATION TASK and the SOLAR TRACKER TASK are started up. The latter task monitors the motion of the tracker and can also drive it in the event that the light level goes below a certain value (because of clouds, etc.) or the tracking errors become too large. One of the basic options in scheduling tasks is to use sunset as the starting time base. Other options are also available, such as solar noon, real time, etc. The scheduling of tasks is done by means of the DAILY TASK SCHEDULING TABLE. Within the constraints of the system any bonafide task can be put on the schedule.
As the day progresses, insolation data is obtained every 5 minutes. When the insolation level reaches a predetermined threshold the SOLAR MODULE DATA ACQUISITION TASK is initiated. This task provides the basic I-V data and is the main reason for the data system.
All the modules in the field exist in a correlation table (SOLAR MODULE HARDWARE CORRELATION TABLE) along with their associated reference cells, reference cell thermocouples, and subarray thermocouples. In another table (the SOLAR MODULE SEQUENCE TABLE) is a listing of the order in which the modules are to be interrogated. This order does not have to be the same as the arrangement in the field. In general, it will be specified to minimize the opening and closing of the reference cell doors. A provision has been built into the system to keep the door open if the next module up uses the same reference cell.
The actual acquisition of the I-V data generally follows this sequence: When the module's number comes up on the sequence table, the routine checks to see if the associated reference cell relay is open. If not, it initiates opening and waits a predetermined amount of time (a fraction of a second). It next obtains temperatures from the three subarray thermocouples via the DORIC. Following that the I-V data is obtained. The GETIV routine collects data (via the dynamic load) based
16

upon the previously established and stored ~I value and the maximum number of points possible. The I-V process is started at zero current and continues until zero voltage or the designated maximum nvmber of points is reached, whichever occurs first. After the 1-V data is obtained the reference cell short circuit current and its thermocouple temperature are determined. Finally, a pyranometer data point is obtained. Weather data will be recorded with every tenth module reading. It is estimated that it will take 1 sec to obtain a 400 point I-V curve and the accessory information.
An abort routine has also been built into the system in the event of rain. Using the rain gage record, an internal computer flag is raised if rain falls during the day. This flag inhibits the SOLAR MODULE DATA ACQUISITION TASK. The principal reason for including this provision in the system is to provide a safeguard for the reference cells.
The I-V data in the dedicated mode is not stored as raw data but goes through a correction process first. The current plan calls for the data to be corrected for both temperature and insolation level according to the ~~om. However, it is anticipated that further refinements to this procedure will be implemented. The strategy being contemplated for the temperature correction is to use a reference temperature close to the mean operating temperature of modules of the same type in the field in order~to minimize the correction. It is conceivable, therefore, that there will be a different reference temperature for each kind of module. For the insolation reference, a value just slightly lower than the threshold insolation level used to activate the data system will be used for all modules.
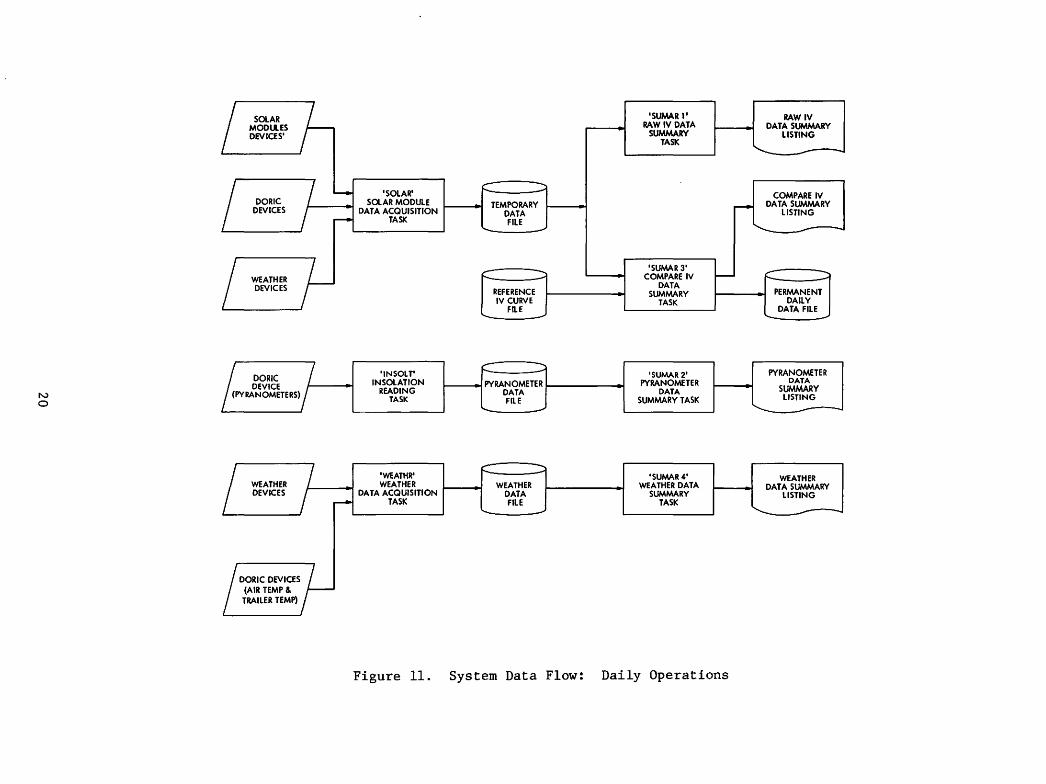
In the late afternoon (except on weekends and holidays) the data from the dedicated tasks will be summarized and listed. The listings for the weather and insolation tasks will be self-explanatory, and will contain the data obtained as a function of time. The I-V record from the field will be presented in two forms: The RAW IV DATA SUMMARY and the COMPARE IV DATA SUMMARY. The RAW IV DATA SUMMARY will contain the highlights of the raw data, which is defined as the uncorrected data. The listing will contain the number of points for the curve, the short circuit current, the open circuit voltage, the maximum power and the corresponding current point, the reference cell and pyranometer values, the reference cell temperature and the three subarray temperatures. The COMPARE IV DATA SUMMARY will compare the key parameters of the corrected I-V curve, such as open circuit voltage, short circuit current and maximum power, with a reference I-V curve for the same module. The reference I-V curve will be updated once a week. It is anticipated that the type of daily analysis and comparison that will be performed will become more sophisticated with time. The goal is to be able to accurately characterize a complete 1-V curve with a series of constants and use these constants to denote changes in the modules.
To complete the picture it is instructive to look at the data storage and handling cycle for the dedicated 1-V data. Daily, the corrected I-V record for each module will be put into the TEMPORARY DATA FILE along with some basic raw data parameters such as short circuit current and open circuit voltage, and all the peripheral information
17

such as the reference cell reading and the subarray temperatures. In addition, a summarized version of this data which contains only the key parameters from the IV record will be put into the PERMANENT DAILY DATA FILE. The TEMPORARY DATA FILE will automatically be purged once a week whereas the PERMANENT DAILY DATA FILE will never be purged. As indicated before there will be a REFERENCE IV CURVE FILE for the modules. The curves in this file will be updated once a week on a prescribed day. The day chosen will very likely be linked to a module cleaning schedule. The information in this file will be obtained directly from the TEMPORARY DATA FILE for the prescribed day. Once a new set of reference I-V curves are put on file the old curves will be placed in the PERMANENT WEEKLY DATA FILE where they will be retained indefinitely. To summarize: Daily I-V curves will be kept for a week. Beyond the week, one complete I-V record per week will be retained in the PERMANENT WEEKLY DATA FILE. A condensed version of the 1-V record will be retained on a daily basis in the PERMANANENT DAILY DATA FILE. All the I-V records in the dedicated mode are in the corrected form. A provision has been included in the software to reverse the process at the console and obtain the original raw data for diagnostic purposes; this is accomplished with the RAW IV DATA RECONSTRUCTION TASK.
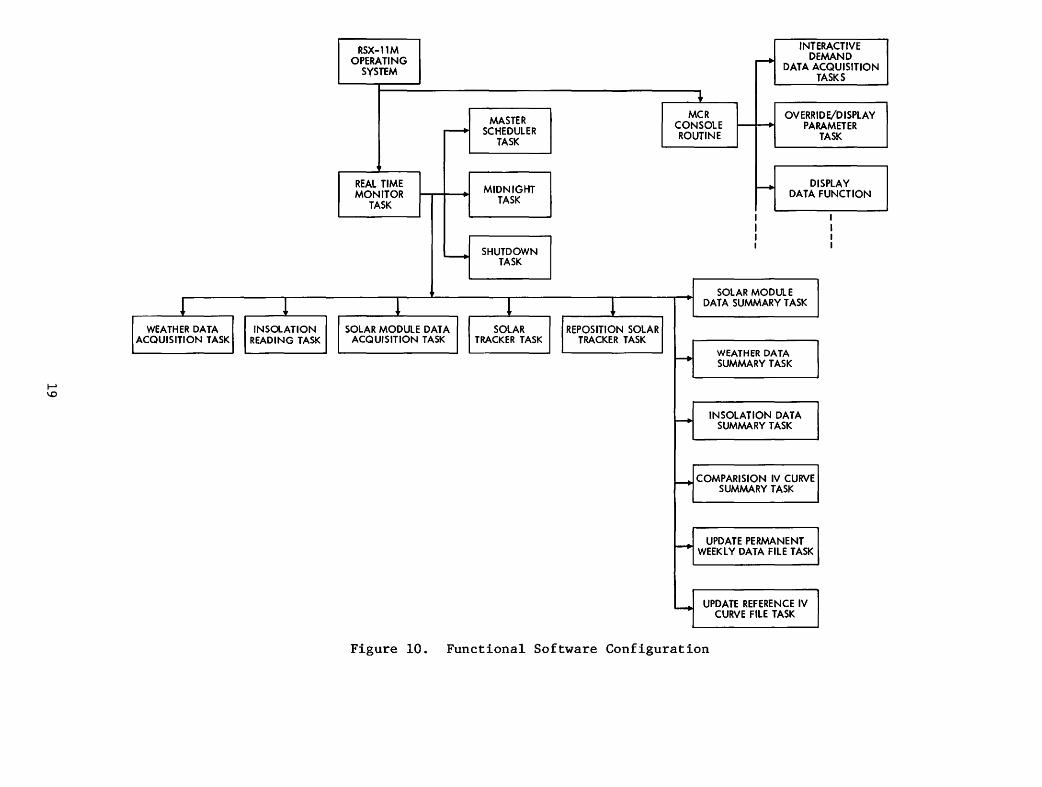
The software described above is summarized in three figures. Figure 10 contains a functional diagram of the software, and Figures 11 and 12 describe the daily and weekly data flow.
C. DATA SYSTEM MILESTONES
Implementation of the data system will occur in two phases: Phase 1 will provide the hardware and some basic but minimal software.
1. Phase 1
*
System Planning and Checkout
Completion of software requirements documents
Arrival of the data system
Temporary hook-up of checkout MUXs and modules
Incorporate filter algorithm into ITC demonstration routine (DEMO)
Completion by ITC of system checkout and demonstration per specifications
April 29, 1977
May 26, 1977
May 27, 1977
July 12, 1977
*
The checkout was due to be complete one week after delivery of the system or about June 30. However, at this writing some of the components were still not functioning properly.
18
WEATHER DATA INSO..ATION ACQUISITION TASK READING TASK
RSX-11M OPERATING
SYSTEM
REAL TIME MONITOR
TASK
SOLAR MODULE DATA ACQUISITION TASK
MASTER SCHEDULER
TASK
MIDNIGHT TASK
SHUTDOWN TASK
SOLAR TRACKER TASK
REPOSITION SOLAR TRACKER TASK
MCR CONSOLE ROUTINE
INTERACTIVE DEMAND
DATA ACQUISITION TASKS
OVERRIDE/DISPLAY PARAMETER
TASK
DISPLAY DATA FUNCTION
SOLAR MODULE DATA SUMMARY TASK
WEATHER DATA SUMMARY TASK
INSOLATION DATA SUMMARY TASK
COMPARISION IV CURVE SUMMARY TASK
UPDATE PERMANENT WEEKLY DATA FILE TASK
UPDATE REFERENCE IV CURVE FILE TASK
Figure 10. Functional Software Configuration
SOLAR MODU.ES DEVICES'
DORIC DEVICES
WEATHER DEVICES
DORIC DEVICE
(PYRANOMETERS)
WEATHER DEVICES
DORIC DEVICES (AIR TEMP &
TRAILER TEMP)
'SOLAR' SOLAR MODULE
DATA ACQUISITION TASK
'INSOLT' INSOLATION
READING TASK
'WEATHR' WEATHER
DATA ACQUISITION TASK
Figure 11.
TEMPORARY DATA FILE
REFERENCE IV CURVE
FILE
PYRANOMETER ------DATA FILE
WEATHER DATA FILE
'SUMAR 1' RAW IV DATA
SUMMARY TASK
'SUMAR 3' COMPARE IV
DATA SUMMARY
TASK
'SUMAR2' PYRANOMETER
DATA SUMMARY TASK
'SUMAR4' WEATHER DATA
SUMMARY TASK
System Data Flow: Daily Operations
RAWIV DATA SUMMARY
LISTING
COMPARE IV DATA SUMMARY
LISTING
PERMANENT DAILY
DATA FILE
PYRANOMETER DATA
SUMMARY LISTING
WEATHER DATA SUMMARY
LISTING

REFERENCE IV CURVE
FILE
TEMPORARY DATA FILE
RAW DATA FILE
1 UPDATE l 1
.,__ ___ .,. UPDATE PERMANENT ..,.._ ___ .,. WEEKLY DATA
FILE TASK
'UPDATE 2' UPDATE REFERENCE
IV CURVE FILE TASK
Figure 12a. System Data Flow: Weekly Operations
'UPDATE 3' SAVE RAW DATA FILE
PERMANENT WEEKLY
DATA FILE
REFERENCE IV CURVE
FILE
TEMPORARY DATA FILE
Figure 12b. System Data Flow: Interactive Initiated Operations
21

Field.Hardware Installation
Installation of the field J-boxes and wireways for Stands 1-15.
Completion/installation and hook-up of standard cell units
Installation and hook-up of the meteorological and insolation sensors
Software
Complete minimum data and file structure
Define interface specifications for calling sequences of subroutines and programs
Structure tables
Development software for setting and displaying program tables
Complete real-time monitor and support tasks
Complete basic data acquisition tasks: SOLAR (I-V curve task), INSOL (pyranometer task) and WEATHR (weather task)
2. Phase 2
June 20, 1977
July 29, 1977
July 29, 1977
June 1, 1977
June 10, 1977
July 15, 1977
July 22, 1977
July 27, 1977
August 15, 1977
Phase 2 will complete the basic software requirements. Upon its completion everything discussed above will be operational. The dedicated portions of Phase 2 are due to be completed September 1, and the interactive programs will be complete near the end of December.
SECTION VII
DATA ACQUISITION AT SECONDARY SITES
Two data acquisition procedures are being considered for the secondary sites. One entails bringing the modules back to JPL on a bi-monthly basis to acquire an updated I-V record with the Large Area Pulsed Solar Simulator (LAPSS). The second involves developing portable I-V equipment which would permit obtaining I-V data on the modules in the field and later feeding the results into the JPL data system. Currently the first method is being employed. Once the portable equipment is developed the first procedure will probably be eliminated.
22
The minimum requirements for the portable equipment are:
(1) It should be able to record a complete I-V record in 4 sec or less.
(2) It should be able to simultaneously record the output from a matched reference cell.
(3) It should be able to simultaneously record the output from a thermocouple taped to the module being interrogated.
(4) It should be able to simultaneously record the output from an ambient air thermocouple.
(5) The recording device must be capable of being linked to the JPL data system.
(6) The recording device must be capable of accepting header information.
(7) It must be capable of operating from battery power and be portable in size and weight.
At the moment, it is conceived that the system will consist of a VIP instrument and a digital logging tape recorder. The instrumentation section is currently working on the system.
SECTION VIII
TESTING ROUTINE
The weekday ·testing routine at the JPL Site will be approximately as follows:
(1) The pyranometers will be wiped clean and covered instruments uncovered.
(2) A data system status check will be made by calling for a status update on the console.
(3) A general inspection of the field will be made. Anything unusual will be logged and, if warranted, photographed.
(4) At this point, interactive data can be obt~ined or background computer analysis performed. At the approach of the dedicated threshold insolation level no further interactive or background functions will be initiated. The trailer will be equipped with a meter which continuously displays the approximate insolation level.
23
(5) The dedicated I-V data will automatically be obtained.
(6) At approximately 2 p.rn. the summary I-V, weather and insolation data will be listed. This data will then be filed in appropriate notebooks.
(7) If the summary data shows a questionable result a backup interactive data point reading will be taken and additional diagnostic activity undertaken as required.
(8) The data system will once again be available for interactive and background work.
(9) At the end of the normal work day the site will be secured.
Once a week, probably on Wednesday, those modules not designated as "long-term dirt modules" or "medium duration dirt modules" will be cleaned. The cleaning procedure will be as follows:
The modules are thoroughly wet with a hose and then cleaned with a solution of Brulin 815 mix (2 ox. per gallon of water). Brulin 815 is a concentrated detergent that has been used successfully in the past for cleaning equipment in the shock-tube. A combination sponge and squeegee is used for applying the cleaning solution. The modules are than rinsed with a hose and squeegeed dry; this is followed by a thorough wiping with a chamois.
SECTION IX
FUTURE TASKS
At present, our primary concerns are to complete the three sites, put the data acquisition system in operation and establish routine testing procedures. Once these tasks are complete, and perhaps even concurrently with their implementation, it will be appropriate to embark upon the second wave of activity, which is oriented toward improving the testing techniques and providing more useful data. A partial list of the tasks that fall into this category are:
A. DATA PROCESSING
(1) Develop techniques for characterizing I-V curves.
(2) Develop improved correction procedures for module temperature and light intensity.
(3) Develop a rationale for the long-term archival of I-V data.
(4) Develop methods for the statistical processing of I-V data.
24
B. SPECIALIZED INSTRUMENTATION
This is an open area requiring inputs from other parts of the Project.
C. SPECIAL TESTS
The focus in this area is to perform specially conceived tests designed to provide insight into the problem of making endurance predictions. Here again inputs from other members of the Project and elsewhere will be welcome.
NASA-JPL-Coml., LA., Calit.
25