LSS_ Project Green Belt -Dheeraj Mehta
19
LSS NSC installation within 72 hrs 1
-
Upload
dheeraj-mehta -
Category
Documents
-
view
27 -
download
0
Transcript of LSS_ Project Green Belt -Dheeraj Mehta

1
LSSNSC installation within 72 hrs

2
PROJECT DETAIL
Name of the Project: To Improve NSC installation within SLA of 72 Hrs
Project Ref. no. UJN / NSC
Project Leader Name
Dheeraj Mehta
Designation ManagerFunction MMG - CS
Date Jun2015
Business Unit Ujjain
Project detail
3
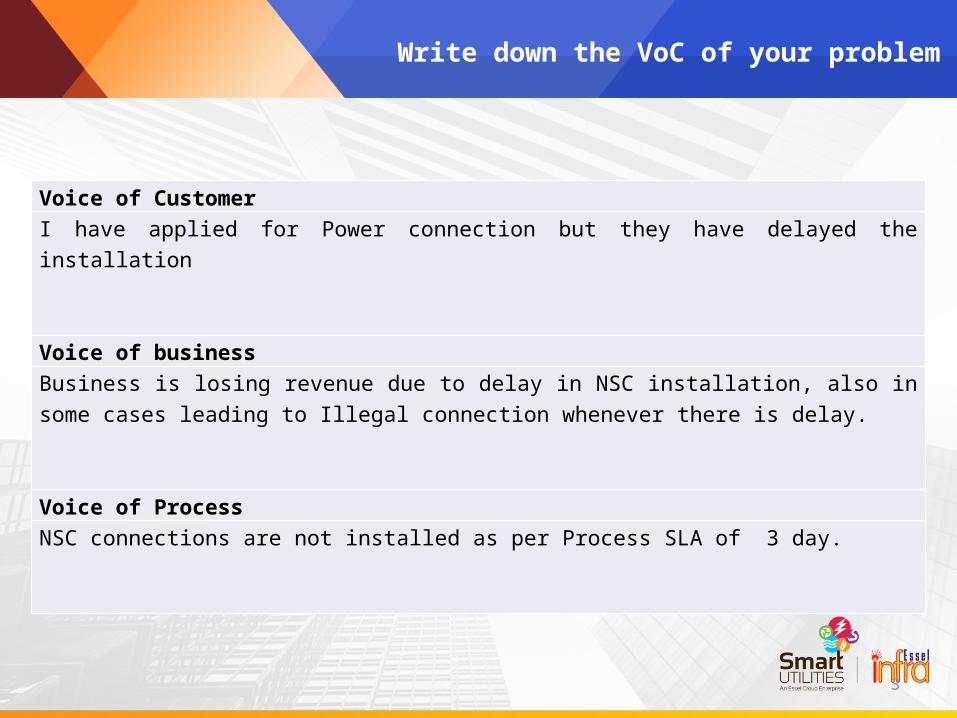
Voice of CustomerI have applied for Power connection but they have delayed the installation
Voice of businessBusiness is losing revenue due to delay in NSC installation, also in some cases leading to Illegal connection whenever there is delay.
Voice of ProcessNSC connections are not installed as per Process SLA of 3 day.
Write down the VoC of your problem

4
PROBLEM STATEMENT
In Power DF, Ujjain City in the month of May’15, NSC installation within 72 hrs. is 55%
GOAL STATEMENT
To Improve NSC installation within 72 hrs. from current May’15 – 55% to 85% within 3 days by 30th Jul’15, for Ujjain City Power DF
CTQ’s FOR YOUR PROJECT
Paste Charter Signed Scanned Copy
CTQ Parameter UoMAt Project Start Target
Planned Completion Date
Actual Completion DateValue Value
NSC installation within 3 days % 55% 85% 10th Jul 2015
30th Jul 2015

In Project Scope Out Of Project ScopeLT NSC connection request below 10 kW
All other NSC request and NSC connection of Industrial , Agriculture & Govt.
Identify Big Y’s of your project
Operational Expense (OPEX) Reduction
Capital Expense (CAPEX) Reduction
Revenue Enhancement Y
Improve Customer Satisfaction – CSAT Y
Improve Employee Satisfaction Y
Technical Loss Reduction
Commercial Loss Reduction
Project Scope and Big YProject Scope
5
If I will do this project then this will impact following Big Y of Organization

Revenue enhancementCost Optimization Customer ResponsivenessCustomer/ Intermediary SatisfactionOthers (Pls. Specify)
Definition of Opportunity
Project Team Business Impact
CEO :
Champion :
Project Leader :
Quality Facilitator :
Team Members :
Business Case Problem Statement:
Definition of Defect :
Lean Six Sigma - Project Charter
Financial Impact
Project Title:
CTQs Baseline TargetIn scope Out Scope
Critical MilestonesProject Start Date
Project End Date
Goal Statement:
Financial Impact
Project Leader Quality Facilitator Champion BE Head

7
NSC / CSD Desk
Material Requisition send to Main Store
MMG Store manual count & registered the meter No in system .
Meter allocated to
vendor Number wise
Daily validation of balance meter & installation at evening
Updation of Meter in
CCB for first billing
Details of Customer who has paid Demand Note
Meter installed and updated in billing system
Registered Consumer for Business (for 1 new connection added in billing base)
Supplier Input Process Output Customer
Zone wise distribution of cases to vendor for installation
Sample SIPOC

8
Down Timer Model for VA / NVA Identification

9
Identify VA / NVA for your process
Value & Cycle Time Track sheet
Process Step 1 2 3 4 5 6 7 8 8 9 Total %Total
Value Added 150 120 60 30 60 120 30 90
660
Material requisition sent to warehouse for vendor wise
MMG store manual count meter & registered the meter No in system
Meter Allocated to Vendor
Zone wise distribution of cases to vendor for installation
Vendor takes the material & meter No allocated to team
Vendor start work in field
Daily validation of balance meter & installation at evening
Updation of Meter in IT system for first billing
Value Enabled
Same number validated by MMG during issue
Non Value Added
30
2650 3750 6430
Store Tracks the same meter No
Site not
ready for installation
Installation delay / Customer denied / Out of Station
Total Time 7090
Time Notation in: Total Value Added work time 630
% Value added work time 8.89%

10
Data Validation
Ensure that the present CTQ is measurable, if noto What is secondary measureo Is new measurement system required
Ensure that it is from the correct primary source In case it is auto generated
o Check / Audit MIS / System (CCB / CRM)
S. no. Data Particulars Data Source Data Period1 Total Application received CRM - CCB May’15 – Nov ’152 Total Installation done CRM - CCB May’15 – Nov ’153 Material movement Oracle - WAM - May’15 – Nov
’15 4 Vendor manpower details MMG5
Please fill this – what all data you have taken for project analysis
Attach Data

11
Vendor Productivity issue
Delay reporting of vendors
Manual tracking of meters
Off line Meter request to store
Out calling process not designed
Meter not available
Cable not available
Premises not ready
Delay in data in MMG grid
Refuse to install
Vendor doing multiple jobs
Delay in NSC
installation
Board not installed
Customer requested delay On line protocol
sheet not generated
Identify all Potential Causes for Your Problem
EDIT CAUSES WRITTEN IN BLUE
Two vendor same site
Public resistance for outside installation

12
RCA TOOLS
Pareto Analysis – to be done for available data
Reason Contribution Cumulative Cumulative ContributionPremises not ready 400 400 43.96%Unavailability of Consumer 370 770 84.62%Demand note Payment delay Updation 89 859 94.40%Material issues 27 886 97.36%Two Team on same site 12 898 98.68%Repeat Visit 10 908 99.78%Installation Delay 2 910 100.00% 910
Premises n
ot ready
Unavaila
bility o
f Consumer
Demand note Payment d
elay Updation
Material is
sues
Two Team on same sit
e
Repeat Visit
Installa
tion Delay0
100200300400
0.00%
40.00%
80.00%
120.00%400 370
8927 12 10 2
Pareto
Contribution Cumulative Contribution

13
Problem Why 1 Why 2 Why 3 Why 4 Why 5
Delay in cases in MMG grid
It runs batch file on daily basis
System designed in the same form
No thought given for delay related losses
Loksewa gives SLA of 7 days
Meter manual tracking
No systemno bar code option
No interface in WAM & CCB
No Meter Number tracking in CCB
Repeat site Visit
No fixing of meter with consumer number
No system generated MCR to fixed vendor
Why analysis for Key Problem from Fishbone and Pareto
14
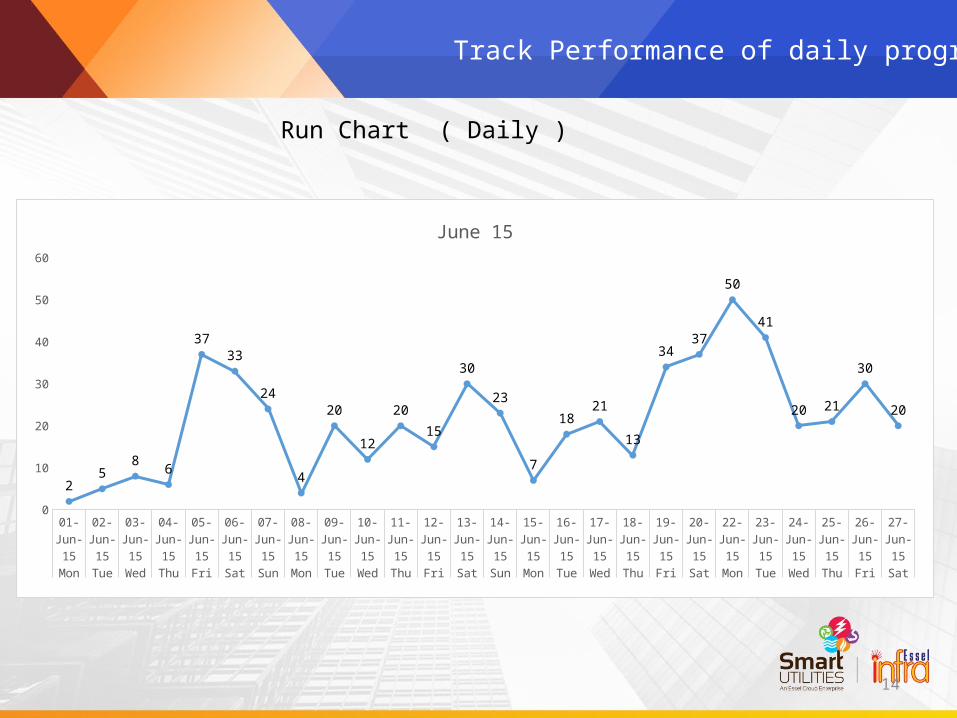
Run Chart ( Daily )
Track Performance of daily progress
01-Jun-15
02-Jun-15
03-Jun-15
04-Jun-15
05-Jun-15
06-Jun-15
07-Jun-15
08-Jun-15
09-Jun-15
10-Jun-15
11-Jun-15
12-Jun-15
13-Jun-15
14-Jun-15
15-Jun-15
16-Jun-15
17-Jun-15
18-Jun-15
19-Jun-15
20-Jun-15
22-Jun-15
23-Jun-15
24-Jun-15
25-Jun-15
26-Jun-15
27-Jun-15
Mon Tue Wed Thu Fri Sat Sun Mon Tue Wed Thu Fri Sat Sun Mon Tue Wed Thu Fri Sat Mon Tue Wed Thu Fri Sat
0
10
20
30
40
50
60
25
86
3733
24
4
20
12
20
15
30
23
7
1821
13
3437
50
41
20 21
30
20
June 15

15
S. No. Root Cause Remedial Action
Resp.Name of the Person /
Function
Target Date
1Demand note Payment case not move to MMG Grid
Run batch file 3 Hrs interval bases MMG Done
2 Delay from Consumer side
1. Documentation guidelines / and checklist to be given to front desk and call center to ready pre installation activity
2. Calling to consumer who are delay 24 Hrs 3. Installation mark during TF at site for meter
fixing , application No . , cable type
NSC / CSD / MMG Done
3 Vendor Alignment Two team of two vendor will dedicatedly work on NSC process MMG Done
4 Automation
1. For faster & accurate meter number automatic barcode scanner is planned
2. System generated MCR report to couple meter & consumer number .
MMG Done
Action planning

16
Action planning
Before – Two Step & manual Job After – Automation Calling to Delay Consumer
Before – Manual MCR After – System Generated MCR
Meter Counting & Updation of Meter Consumer Calling
Meter & consumer Coupling
Meter Fixing Place & Instruction
Instruction to Consumer at site

17
CTQ Baseline
Target Achieved
NSC installation within 3 days 55% 85% 86 %
Sustenance/ Control :• Mistake Proofing: Wrong meter number & incorrect consumer detail
•Control Plan: next slide
Project Name: To Improve NSC installation within SLA of 72hrs
Project TeamProject Champion: Anupam Rajput Project Leader: Dheeraj MehtaQuality Facilitator: Naresh KumarTeam : Zahid Hussain , Praveen Garg , Rakesh Gautam , Sandeep Srivastava
Financial Impact: 30 % or 140 consumer per month come in our network with in 72 Hrs cause 21 K unit increase per year .
Innovations / Solutions1. Processes Impacted- Improve Punching Accuracy & Efficiency in System , reduced failure rate .
2. Process changes – i Meter Number capturing Automatic (through Bar Coder)ii Predefine meter with consumer number
3. Trainings/ Communication – i) Store team ii) Back End team iii ) Vendor Team
4. Best Practices – Bar Code meter Number Capturing .
Project Completion Sheet: Control Phase
May 15 Sep 15 Oct 15 Nov 150%
20%
40%
60%
80%
100%
55%
75% 77%86%
45%
25% 23%14%
CTQ Trend
72 Hrs> 72 Hrs

18
Project Completion Sheet: Control Phase
# Action implemented / To be ensured at regular frequency Resp Frequency
1 MMG received Meter from ware house captured the number via Bar code scanner .
Ashish Bahal
Weekly
2 Same number will be enter in CCB Ashish Bahal
Weekly
3 Validating the system number & actual meter number received
Sandeep Srivastava
Weekly
4 Meter issued to vendor team through system generated protocol sheet
Rakesh Daily
5 Application Number mention on site at standard position for meter installation
Praveen Garg
Daily
Key actions – Why this problem will NOT REPEAT / REOCCUR?

19
Thanks