LSL New Build Index · (house builder) respondents to ... movers and buy to let were all slightly...
5
In the year to end January 2018 new build house prices rose on average by 9.8% across the UK which is up on last year’s figure of 5.8% Political events Help to buy: Equity loan transactions now represent about one third of new build sales. The scheme comes to an end in 2021 and some forward planning will be needed to prepare for this change in the demand base. The recently published Lloyds Bank House Building Report 2018, finds that over four in five (house builder) respondents to their survey finds the scheme to be fairly or very important to the industry. One way in which the Land Registry is trying to speed up and secure property transactions is through ‘Digital Streets’. The aim is in part to speed up and reduce risk in the conveyancing process. Of course this sort of thing is particularly important to house builders as one title deed gets split down to many and anything that can simplify the surrounding legal complexities is to be welcomed. Market forces are pushing change in terms of construction techniques and labour availability and this is discussed below. The market The UK Finance Mortgage Trends survey came out in January and reported some slightly mixed news on the mortgage front. It reports that mortgage lending to first time buyers, home movers and buy to let were all slightly down in December 2017 compared to the same month last year. But that said, 2017 saw the highest number of first time buyers since 2006, standing at 365,000. And of course the good thing about first time buyers is that for the most part they start buyer chains. Their research also finds that the average age of a first time buyer is 30 with an income of £40,000, an LTV (loan-to-value ratio) of just under 85% and loan of £138,000. The average Home mover is 39 with an income of £54,000. Their average LTV is just under 73% and average borrowing is £175,000. But whilst the whole year figures show signs of healthy Powered by LSL New Build Index The market indicator for New Builds February 2018
Transcript of LSL New Build Index · (house builder) respondents to ... movers and buy to let were all slightly...
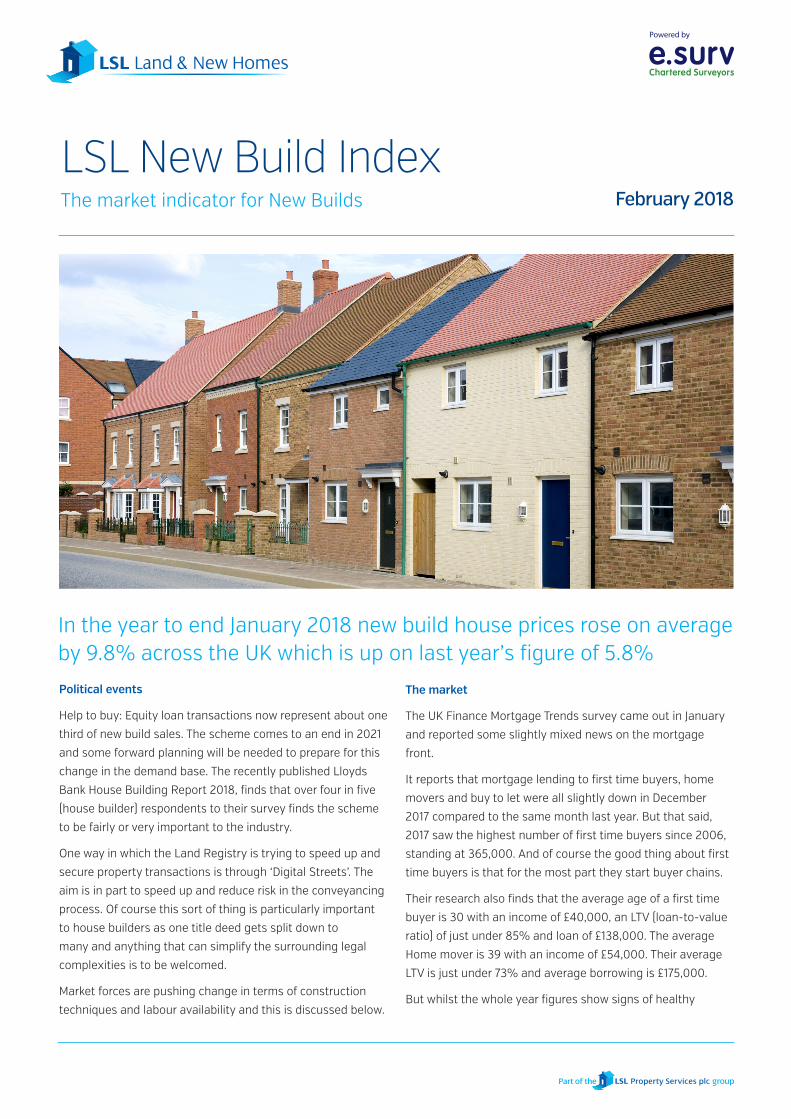
In the year to end January 2018 new build house prices rose on average by 9.8% across the UK which is up on last year’s figure of 5.8%
Political events
Help to buy: Equity loan transactions now represent about one
third of new build sales. The scheme comes to an end in 2021
and some forward planning will be needed to prepare for this
change in the demand base. The recently published Lloyds
Bank House Building Report 2018, finds that over four in five
(house builder) respondents to their survey finds the scheme
to be fairly or very important to the industry.
One way in which the Land Registry is trying to speed up and
secure property transactions is through ‘Digital Streets’. The
aim is in part to speed up and reduce risk in the conveyancing
process. Of course this sort of thing is particularly important
to house builders as one title deed gets split down to
many and anything that can simplify the surrounding legal
complexities is to be welcomed.
Market forces are pushing change in terms of construction
techniques and labour availability and this is discussed below.
The market
The UK Finance Mortgage Trends survey came out in January
and reported some slightly mixed news on the mortgage
front.
It reports that mortgage lending to first time buyers, home
movers and buy to let were all slightly down in December
2017 compared to the same month last year. But that said,
2017 saw the highest number of first time buyers since 2006,
standing at 365,000. And of course the good thing about first
time buyers is that for the most part they start buyer chains.
Their research also finds that the average age of a first time
buyer is 30 with an income of £40,000, an LTV (loan-to-value
ratio) of just under 85% and loan of £138,000. The average
Home mover is 39 with an income of £54,000. Their average
LTV is just under 73% and average borrowing is £175,000.
But whilst the whole year figures show signs of healthy
Powered by
LSL New Build IndexThe market indicator for New Builds February 2018

Powered by
growth, the volume of mortgage approvals in December was
down on last year - so this might be an early indicator of a
slowing market. Whether this is a blip or a knock on effect
to the shortage of property for sale that has been previously
reported is something that will become evident through 2018.
Deloitte run a survey of economic activity at city level
by counting the number of cranes in various centres, as
more building work generally indicates more economic
prosperity. Record levels of construction activity were noted
in Birmingham City Centre with confidence
being high as a result of HS2 and the
2022 Commonwealth Games. Over 4,000
residential units were identified as being
under construction. In Leeds the second
highest volume of office construction
in a decade was noted, which is driving
employment and in turn nearly 1,600
residential units were found to be under
construction - the highest level since 2008.
Manchester has been tagged as one of
Europe’s fastest growing cities and the
report has found that 11,000 residential
units are under construction, up 60% on
last year.
The long view
The Lloyds Bank 2018 House Building
Report proves a good sounding board for
the industry and includes some interesting
findings. Average five year turnover growth
expectations from current turnover, for the
100 house builders that were interviewed
stood at 29%, with SME house builders
predicting a higher rate of growth than
last year and top ten house builders now
expecting a slower rate of growth over the
period. This may of course be due to the
Government’s targeted help towards these
smaller businesses.
The report also found that only around
one in four companies were expecting
to increase the number of houses that
they were building this year and five year
house price inflation expectations has held
steady at 11%. That is broadly consistent with other market
projections.
Against Government led calls for a growth in the output of
new housing, the report finds that the sector expects to see a
contraction in its workforce in coming years as the workforce
ages and recruitment issues continue.
Brexit uncertainty, rising material costs and access to EU
labour were cited in the report as key challenges facing the
new build industry. As with the wider economy, the Brexit
effect seems to be to reduce investment levels and confidence
in planning for the future.
Propertywire has recently reported that one of the tallest
modular property developments has just got the go ahead
in Croydon. The 21 storey modular block will be constructed
offsite and then the units are dropped into place on site.
So market forces – a demand for ever more new build property,
combined with a reducing ability to build new homes in the
traditional manner - must eventually drive output towards

Powered by
Modern Methods of Construction (MMC). The above mentioned
Lloyds Bank review finds that for the most part, over 50% of
companies with a turnover exceeding £25 million are trying out
various MMC approaches.
The above mentioned Deloitte’s crane report suggests that
there may be more opportunities around key city centres
and MMC modular construction is well suited to high rise.
There are of course various spin off issues arising from
this, not least lender acceptability and having a method
of recording the MMC build type for future generations.
Hopefully the Land Registry will be aware of the potential
to link this sort of information to the more traditionally held
legal data that accompanies a property’s title deeds. The
Land Registry is actively looking to industry to advise it on
how to make its data more relevant and this type new build
construction type ‘log book’ is one way.
Current news
The recent stock market corrections, in which some markets
have fallen by over ten percent, will be a source of confusion
or concern for many. As with the housing market, the value
of shares is determined by the trading of a relatively small
amount of them on any given day. And as with the housing
market, sentiment plays a key role. Ironically it was the
economic strength of America that seems to have caused the
market correction. A strong labour market has led to wage
growth which brings with it the likelihood of price inflation
which generally brings the desire to cool things down by
raising interest rates.
And rising interest rates in America will have a global knock on
effect and will make gilts a more attractive investment as their
return improves. So the outlook to shares relative to gilts has
changed and a share price correction occurs. But whilst few
seemed to have forecast this market correction, the resulting
likelihood of earlier and higher interest rate rises in the UK now
seems more predictable. We are still looking at relatively small
interest rate changes but they will have a knock on effect on
mortgage rates.
At the start of February it was reported that 550 of the 1,400
apprentices at Carillion had received new job offers. This was
partly due to the CITB having sourced a £1000 a head incentive
to companies taking on the affected staff.
A report from House Simple has found a larger than expected
increase in new sales listings in January so perhaps this is an
indication that more sellers will be entering the market this
year. If so then estate agents will be pleased as they have
reported a shortage of property coming to the market over a
sustained period.
This is based on a weighted calculation which reflects regional differences in sales volumes of flats and terraced property. Ave annual earnings from ONS EARN 05: Average Gross Earnings of Full Time Employees.
2 BED 70 SQ.M
STARTER HOMEAVE ANNUAL EARNINGS FULL TIME EMPLOYEES HPE AFFORDABILITY
INDEX
East Anglia £252,560 £32,646 7.74 125
East Midlands £136,023 £27,507 4.95 80
Greater London £494,250 £38,559 12.82 206
North East £114,026 £26,602 4.29 69
North West £142,974 £28,446 5.03 81
Scotland £136,253 £29,442 4.63 74
South East £253,994 £34,151 7.44 120
South West £186,754 £29,721 6.28 101
Wales £121,402 £27,285 4.45 72
West Midlands £160,812 £28,329 5.68 91
Yorkshire and the Humber £139,954 £27,681 5.06 81
Average 6.21 100
First Time Buyers - Affordability.

Powered by
Average New Home PricesPeriod February 2017 to January 2018.
SCOTLAND £ AVERAGE
£280,006
£141,856
£194,876
£193,267
NORTH EAST £ AVERAGE
£300,627
£128,110
£184,741
£167,924
NORTH WEST £ AVERAGE
£341,485
£156,649
£202,692
£210,894
YORKSHIRE & THE HUMBER £ AVERAGE
£307,698
£160,652
£190,071
£191,994
WEST MIDLANDS £ AVERAGE
£374,271
£182,396
£239,194
£232,217
EAST ANGLIA £ AVERAGE
£467,148
£278,358
£335,768
£326,232
WALES £ AVERAGE
£247,808
£163,134
£187,911
£167,273
EAST MIDLANDS £ AVERAGE
£329,165
£162,822
£199,720
£202,324
SOUTH WEST £ AVERAGE
£381,886
£218,837
£255,511
£259,461
GREATER LONDON £ AVERAGE
£865,148
£496,382
£584,407
£622,153
SOUTH EAST £ AVERAGE
£535,549
£268,996
£368,535
£354,908
NORTH % AVERAGE
4.58%
5.27%
9.19%
5.22%
SOUTH % AVERAGE
12.31%
17.55%
11.51%
14.30%
Detached
Flats
Semis
Terrace
North/South Average % Change
Powered by
This Index has been prepared by e.surv using anonymised
data based on a proportion of all new build valuations
provided for lending purposes. Figures represent 12 month
rolling averages for each period. The copyright and all other
intellectual property rights in the Index belong to e.surv.
Reproduction in whole or part is not permitted unless an
acknowledgement to e.surv as the source is included. No
modification is permitted without e.surv’s prior written
consent.
Whilst care is taken in the compilation of the Index no
representation or assurances are made as to its accuracy
or completeness. e.surv reserves the right to vary the
methodology and to edit or discontinue the Index in whole or
in part at anytime.
e.surv (www.esurv.co.uk) is the Valuation business of LSL
Property Services plc (www.lslps.co.uk) and is the UK’s largest
residential valuation practice, acting for lenders, developers,
Social Housing organisations and other stakeholders in the
residential property market.
The business employs circa 450 chartered surveyors and
covers the entire UK.
LSL Land & New Homes is a trading style for members of the
LSL Property Services Group Estate Agency Division, one of
the leading residential property services groups in the UK. It’s
strategy is to create partnerships with developers and builders
to support their objectives and add value to their businesses.
It can provide integrated solutions for their benefit drawing
on the expertise of companies who are also under the LSL
Group umbrella including valuation services (e.surv), rental
portfolio services, asset management services and estate
agency services fronted by well-known high street estate
agency brands like Your Move and Reeds Rains. Services
can be tailored to suite individual needs from bespoke site
sales and marketing, agency referral to the disposal of part
exchange, assisted schemes and new build stock, land sales
and acquisitions.
Disclaimer: The data is provided by LSL Land & New Homes and is based on data provided as described above. While reasonable skill and care has been taken in the preparation of the data – the copyright and all other intellectual property rights of which belong to e.surv limited - neither e.surv Limited nor LSL Land & New Homes can accept liability for the accuracy or completeness of the data provided.
Reproduction in whole or part is not permitted unless an acknowledgment to e.surv Limited is included. No modification is permitted without e.surv Limited’s prior written consent.
No warranty of the figures is given and no responsibility or liability of any nature to you or any third party for the whole or any part of its content is accepted. It is assumed that you will carry out your own due diligence before proceeding with any proposals or making any financial commitments.
For further information or enquiries regarding the underlying data of the
LSL New Build Index, please contact Shaun Peart via email
[email protected] or by phoning 07789 948411.
For further information about the LSL Property Services Group including
LSL Land & New Homes and e.surv, visit www.lslps.co.uk
Notes