LPFMII-15-007 COLLECTING TAXES TECHNICAL NOTE · The tax administration indicators examine the main...
44
Date: June 2018 COLLECTING TAXES TECHNICAL NOTE Leadership in Public Financial Management II (LPFM II) LPFMII-15-007
Transcript of LPFMII-15-007 COLLECTING TAXES TECHNICAL NOTE · The tax administration indicators examine the main...

i
Date: June 2018
COLLECTING TAXES TECHNICAL NOTE Leadership in Public Financial Management II (LPFM II)
LPFMII-15-007

DISCLAIMER
This document is made possible by the support of the American people through the United States Agency for International Development (USAID). Its contents are the sole responsibility of the author or authors and do not necessarily reflect the views of USAID or the United States government.
This publication was produced by Nathan Associates Inc. for the United States Agency for International Development
CONTENTS
Contents
Acronyms 2
Introduction 1
Indicator Definitions and Sources 1
Tax Performance 1
Tax Administration 6
Country Notes 10

2
Acronyms
ADB Asian Development Bank CIT Corporate Income Tax CTD Collecting Taxes Database FAD Fiscal Affairs Department of the International Monetary Fund GDP Gross Domestic Product GFS Government Financial Statistics GNI Gross National Income GST Goods and Services Tax IAMTAX Integrated Assessment Model for Tax ICRG International Country Risk Guide (of the PRS Group) ICTD International Centre for Tax and Development IMF International Monetary Fund IT Information Technology LPFM II Leadership in Public Financial Management II LTU Large Taxpayer Unit ODA Official Development Assistance OECD Organisation for Economic Co-operation and Development OLS Ordinary least squares (estimation technique) PFM Public financial management PIT Personal Income Tax RA-FIT Revenue Administration’s Fiscal Information Tool TADAT Tax Administration Diagnostic Assessment Tool USAID United States Agency for International Development USAID/E3 United States Agency for International Development Bureau for Economic
Growth, Education and Environment USG United States Government VAT Value Added Tax WB World Bank WDI World Development Indicators WEO World Economic Outlook (of the IMF) WGI Worldwide Governance Indicators (of the World Bank) WoRLD World Revenue Longitudinal Data (of the IMF)

INTRODUCTION 1
1
Introduction USAID has been using the Collecting Taxes Database (CTD) since it was launched in 2008 to promote tax system assessment and measurement as a means to promote improvements in tax policy and tax administration. With the rise of other databases and increased work on tax analysis in recent years, USAID reviewed and updated the CTD methodology and indicators in 2015. More than 40 indicators were initially examined and collected during a pilot phase. To ensure consistency with evolving good practice and to account for the recent publication of other databases, CTD was modified and now comprises a set of 20 indicators. The current database is divided into two main categories -- (1) tax performance; and (2) tax administration characteristics -- and includes information on 200 national tax systems. The tax performance indicators measure how effectively the tax system produces revenues. The tax administration indicators examine the main features of the revenue authority/department.
The following technical note describes the indicator definitions, estimation techniques and sources for each of the tax performance and tax administration indicators. Detailed country notes follow the main portion of the text that provide information on data issues, outliers, and other country specific issues.
Indicator Definitions and Sources Tax Performance
1. Tax Capacity
Definition: Tax capacity is the empirical estimate or predicted value of the potential tax to the Gross National Product (GDP) ratio, taking into account a country's specific macroeconomic, demographic, and institutional features. This indicator provides a benchmark for the maximum amount of tax revenue that could be collected given a country’s socio-economic factors. This indicator is estimated with a Stochastic Frontier estimation approach that allows for time-varying technical inefficiency, as proposed by the Battese and Coelli (1992)1 parametrization of time effects, where the inefficiency term is modeled as a truncated-normal random variable multiplied by a specific function of time. Unlike in the Ordinary Least Squares (OLS) methodology—which assumes that all countries are technically efficient—the Stochastic Frontier approach uses a variable for different levels of inefficiency represented in the formula below by 𝑢𝑢.𝑖𝑖𝑖𝑖𝑖𝑖 , which is a non-negative inefficiency variable associated with country-specific factors resulting in country i in region r not attaining its tax capacity in time t.2
Formula: 𝑙𝑙𝑙𝑙 ( 𝑇𝑇𝑇𝑇𝑇𝑇𝐺𝐺𝐺𝐺𝐺𝐺.𝑖𝑖𝑖𝑖𝑖𝑖
) = 𝛽𝛽0 + 𝛽𝛽1𝑙𝑙𝑙𝑙(𝐺𝐺𝐺𝐺𝑃𝑃𝑃𝑃𝑃𝑃𝑖𝑖𝑖𝑖𝑖𝑖) + 𝛽𝛽2(𝐺𝐺𝐷𝐷𝐷𝐷.𝑖𝑖𝑖𝑖𝑖𝑖 ) + 𝛽𝛽3(𝑇𝑇𝑇𝑇𝑇𝑇𝐺𝐺𝐷𝐷.𝑖𝑖𝑖𝑖𝑖𝑖 ) + 𝛽𝛽4(𝑇𝑇𝐺𝐺𝑇𝑇𝐴𝐴𝑃𝑃.𝑖𝑖𝑖𝑖𝑖𝑖 ) +
𝛽𝛽5𝑙𝑙𝑙𝑙(𝐺𝐺𝐺𝐺𝐺𝐺.𝑖𝑖𝑖𝑖𝑖𝑖 ) + 𝜀𝜀.𝑖𝑖𝑖𝑖𝑖𝑖− 𝑢𝑢.𝑖𝑖𝑖𝑖𝑖𝑖 ,𝑤𝑤ℎ𝑒𝑒𝑒𝑒𝑒𝑒 𝑖𝑖 = 𝑐𝑐𝑐𝑐𝑢𝑢𝑙𝑙𝑖𝑖𝑒𝑒𝑐𝑐; 𝑖𝑖 = 𝑒𝑒𝑒𝑒𝑟𝑟𝑖𝑖𝑐𝑐𝑙𝑙; 𝑎𝑎𝑙𝑙𝑎𝑎 𝑖𝑖 = 𝑐𝑐𝑒𝑒𝑎𝑎𝑒𝑒
This estimation technique follows the approach taken by Fenochietto and Pessino (2013) that uses the Battese Coelli (1992) parametrization of time effects in the context of estimating tax capacity and tax effort using the stochastic frontier method.
Source: The methodology for estimating tax capacity follows Ricardo Fenochietto and Carola Pessino (2013) on the use of Stochastic Frontier approach with explanatory variables following Le, Tuan Minh; 1 http://pages.stern.nyu.edu/~wgreene/FrontierModeling/Reference-Papers/Battese-Coelli-1992.pdf. Battese, G., and Coelli, T., 1992, “Frontier Production Functions, Technical Efficiency and Panel Data: With Application to Paddy Farmers in India,” Journal of Productivity Analysis, 3, pp. 153−69. This model has been used by Fenochietto and Pessino (2013) to estimate tax capacity and tax effort: https://www.imf.org/en/Publications/WP/Issues/2016/12/31/Understanding-Countries-Tax-Effort-41132 2 For a discussion on the stochastic frontier approach, see Collecting Taxes technical paper “Measuring Tax Capacity and Effort Using Stochastic Frontier Analysis”

INTRODUCTION 2
2
Moreno-Dodson, Blanca; Bayraktar, Nihal (2012). Some of the data sources vary as noted below. Tax capacity is calculated using Tax as a percentage of GDP from the IMF World Revenue Longitudinal Data (WoRLD) database or International Centre for Tax and Development (ICTD).3 GDP per capita, in current U.S. dollars is drawn from the World Development Indicators (WDI) or from the International Monetary Fund World Economic Outlook (WEO) database based on the source with more observations.4 Agriculture Value Added (% of GDP), Age Dependency Ratio (ratio of people over younger than 15 and older that 64 to the working age population aged 15 to 64),5 and trade openness (exports plus imports as a percentage of GDP) are drawn from WDI. The Control of Corruption index is drawn from the Worldwide Governance Indicators (WGI) Dataset.6
Data Quality: GDP per capita from the IMF WEO database used in this regression may contain estimates for one or more of the most recent years. Estimates start from different years for different countries. The Control of Corruption index from the WGI does not include any observations for the year 2001. For this reason, estimates of tax capacity for all countries drop in the year 2001. Since the regression utilizes the natural logarithm of the governance index, we have rescaled the Control of Corruption index by a factor of +2 in the regression estimates.
CTD Code # tax_capacity
2. Tax Effort
Definition: This indicator is the ratio between the share of actual tax collection (as a percent of GDP) and the predicted tax capacity jointly obtained with tax capacity using the Stochastic Frontier approach.7 While actual tax revenue as a share of GDP is one of the mostly commonly used measures of tax effort for cross-country tax comparison, this indicator takes into account different country characteristics. A high tax effort is the case when this index is greater than one, implying that the country well utilizes its tax base to increase tax revenues. A low tax effort is the case when the index is below one indicating there is substantial scope to raise tax revenues.
Source: Estimated simultaneously with the CTD indicator tax_capacity using the Stochastic Frontier approach described above for a time variant model.
Data Quality: Tax as a % of GDP values—utilized in the regressions—for resource rich countries are not recorded in a consistent way in either the WoRLD or ICTD database. In some resource rich countries
3 ICTD data for Tax/GDP, CIT/GDP, PIT/GDP, and VAT/GDP are used in lieu of WoRLD for the following countries: Algeria, Aruba, Bangladesh, Belarus, Cuba, Kosovo, Macau, Macedonia, Montenegro, Nigeria, Panama, Romania, San Marino, São Tomé and Principe, Timor-Leste, Trinidad and Tobago, Vanuatu, West Bank and Gaza 4 Data is pulled from either WDI or WEO for the entire series. Data from one source are not substituted for missing values in the other source for the same country. WEO was used for the majority of countries. WDI is used for Andorra; Angola; Armenia; Aruba; Azerbaijan; the Bahamas; Belarus; Bermuda; Bosnia and Herzegovina; Cape Verde; Congo, Dem. Rep.; Congo, Rep.; Cote d'Ivoire; Cuba; Czech Republic; Djibouti; the Gambia; Georgia; Hong Kong, China; Iran, Islamic Rep.; Kazakhstan; Korea, Rep.; Kyrgyz Republic; Laos; Liberia; Liechtenstein; Macau; Macedonia; Malta; Marshall Islands; Micronesia, Fed. Sts.; Nauru; New Caledonia; Palau; Russian Federation; São Tomé and Principe; Serbia; Slovak Republic; South Sudan; Syrian Arab Republic; Tajikistan; Turkmenistan; Tuvalu; Ukraine; Uzbekistan; West Bank and Gaza 5 Le, Tuan Minh; Moreno-Dodson, Blanca; Bayraktar, Nihal (2012) uses growth in the working age population as the demographic variable in the base model and age dependency ratio in the alternate model. We have opted to use the age dependency ratio due to a few country years with extremely high growth in the working age population that was skewing the estimates for those countries in certain years.
6 Le, Tuan Minh; Moreno-Dodson, Blanca; Bayraktar, Nihal (2012) uses the Corruption index from the PRS Group International Country Risk Guide (ICRG) rather than the Control of Corruption index from the Worldwide Governance Indicators. 7 Note that due to the use of a Stochastic Frontier approach model, there may be a small difference between the estimated tax efforts generated by the model and calculated tax efforts using actual tax/GDP ratios. This is because estimates of tax capacity are weighted averages for each country with idiosyncratic errors in addition to the inefficiency in revenue collections. The difference should be small in all cases. If the annual data is averaged then the differences would disappear.

INTRODUCTION 3
3
(i.e. Algeria) resource revenues are included in Tax as percentage of GDP. In other resource rich countries (i.e. Bahrain and Kuwait) natural resource revenues are excluded from this figure. This may lead to outliers for resource rich countries on both the high and low sides, particularly in years where the oil price is high.
CTD Code # tax_effort
3. Tax Buoyancy
Definition: This indicator is a measure of the responsiveness of total taxes to an increase in GDP, i.e. the percent change of tax revenue (%ΔT) divided by the percent change of the tax base or GDP (%ΔY). Generally, a basic goal of the tax system is to have revenues grow at the same, or higher, rate than the economy. Tax buoyancy measures the responsiveness of tax revenues to changes in the tax base due to economic activities, and the impact of discretionary changes in the tax rate and in the tax base. 8 Therefore, tax buoyancy is a measure of both the soundness of the tax bases and the effectiveness of tax changes in terms of revenue collection. The percent changes are measured in real terms. There are several methodologies for estimating tax buoyancy. Measures of tax buoyancy tend to vary from year to year, thus it is more useful to measure buoyancy over a long period. The dataset has a measure of tax buoyancy if data for tax and GDP are both available for at least five of the preceding 10 years. This indicator is calculated by regressing the log of tax revenue on the log of GDP. The coefficient on the log of the base (GDP) is the measure of the tax buoyancy.
Formula: 𝑙𝑙𝑙𝑙 (𝑇𝑇𝑎𝑎𝑇𝑇) = 𝛽𝛽0 + 𝛽𝛽1(𝑙𝑙𝑙𝑙 𝐺𝐺𝐺𝐺𝑃𝑃 ) + 𝜀𝜀
Source: Calculated using the Tax as a % of GDP from WoRLD database or the ICTD database based on the source with a more complete and more recent set of data for a country (see the footnotes on the value added tax (VAT) efficiency ratio) and GDP from the WDI or IMF WEO database (in real terms with 2010 as the base year), based on the source with more complete data for a country.
Data Quality: Statistically insignificant data (i.e. p-value>0.05) must be used with caution and are highlighted in red italics in the dataset. GDP from the IMF WEO database used in this regression may contain estimates for one or more of the most recent years. Estimates start from different years for different countries.
CTD Code # tax_buoy
4. PIT Buoyancy
Definition: This indicator is a measure of the responsiveness of personal income tax (PIT) revenues to an increase in GDP, i.e. the percent change of PIT revenue (%ΔT) divided by the percent change of the tax base or GDP (%ΔY). This indicator is calculated by regressing the log of PIT revenue on the log of GDP. The coefficient on the log of the base (GDP) is the measure of PIT buoyancy. See #tax_buoy for additional information.
Formula: 𝑙𝑙𝑙𝑙 (𝑃𝑃𝐴𝐴𝑇𝑇) = 𝛽𝛽0 + 𝛽𝛽1(𝑙𝑙𝑙𝑙 𝐺𝐺𝐺𝐺𝑃𝑃 ) + 𝜀𝜀
Source: Calculated using the PIT as a percentage of GDP from WoRLD database or the ICTD database based on the source with a more complete and more recent set of data for a country (See the footnotes on the VAT efficiency ratio) and GDP from the WDI or IMF World Economic Outlook database (in real terms with 2010 as the base year), based on the source with more complete data for a country.
8 This indicator is one of two commonly used elasticity measures of a tax system. Tax elasticity measures the natural response of the tax revenue with respect to changes in the tax base without any discretionary changes (e.g. changes in the tax laws and administrative capacity).

INTRODUCTION 4
4
Data Quality: See #tax_buoy
CTD Code # pit_buoy
5. CIT Buoyancy
Definition: This indicator is a measure of the responsiveness of corporate income tax (CIT) revenues to an increase in GDP, i.e. the percent change of CIT revenue (%ΔT) divided by the percent change of the tax base or GDP (%ΔY). This indicator is calculated by regressing the log of CIT revenue on the log of GDP. The coefficient on the log of the base (GDP) is the measure of the CIT buoyancy. See #tax_buoy for additional information.
Formula: 𝑙𝑙𝑙𝑙 (𝑃𝑃𝐴𝐴𝑇𝑇) = 𝛽𝛽0 + 𝛽𝛽1(𝑙𝑙𝑙𝑙 𝐺𝐺𝐺𝐺𝑃𝑃 ) + 𝜀𝜀
Source: Calculated using the CIT as a % of GDP from WoRLD database or the ICTD database based on the source with a more complete and more recent set of data for a country (See the footnotes on the VAT efficiency ratio) and GDP from the WDI or IMF World Economic Outlook database (in real terms with 2010 as the base year), based on the source with more complete data for a country.
Data Quality: See #tax_buoy
CTD Code # cit_buoy
6. VAT Buoyancy
Definition: This indicator is a measure of the responsiveness of VAT revenues to an increase in GDP, i.e. the percent change of CIT revenue (%ΔT) divided by the percent change of the tax base or private consumption (%ΔGDP). This indicator is calculated by regressing the log of VAT revenue on the log of GDP. The coefficient on the log of the base (GDP) is the measure of the VAT buoyancy. See #tax_buoy for additional information.
Formula: 𝑙𝑙𝑙𝑙 (𝑣𝑣𝑎𝑎𝑖𝑖) = 𝛽𝛽0 + 𝛽𝛽1(𝑙𝑙𝑙𝑙 𝐺𝐺𝐺𝐺𝑃𝑃 ) + 𝜀𝜀
Source: Calculated using the VAT as a % of GDP from WoRLD database or the ICTD database based on the source with a more complete and more recent set of data for a country (See the footnotes on the VAT efficiency ratio) and the WDI or IMF World Economic Outlook database (in real terms with 2010 as the base year), based on the source with more complete data for a country.
Data Quality: See #vat_buoy
CTD Code # vat_buoy
7. VAT Efficiency Ratio9
Definition: This indicator is one of three related measures of VAT productivity found in the literature. It is calculated as the ratio of actual VAT collections in the country to the potential revenues that would be derived from applying the standard VAT rate to GDP. In principle, a VAT with no exemptions, a single rate, and full compliance should result in efficiency ratios of close to 100 percent. For example, if actual VAT revenues (as a percent of GDP) are 5% and the general VAT rate is 20%, then the VAT efficiency ratio (vat_eff) is 25 percent. Note: for countries that do not have a VAT (i.e. countries that have a sales tax), this indicator is blank.
9 Revenue productivity or efficiency ratios can be calculated for VAT where it is general practice to have one standard rate, but not for corporate income tax and especially personal income taxes where it is normally the practice to have multiple rates or a progressive rate structure. For CIT and PIT it is difficult to maintain a reliable methodology that is comparable between countries and over time.

INTRODUCTION 5
5
Formula: VAT Efficiency Ratio = 𝑉𝑉𝑉𝑉𝑇𝑇 𝑅𝑅𝑅𝑅𝑅𝑅𝑅𝑅𝑅𝑅𝑅𝑅𝑅𝑅 𝐶𝐶𝐶𝐶𝐶𝐶𝐶𝐶𝑅𝑅𝐶𝐶𝑖𝑖𝑖𝑖𝐶𝐶𝑅𝑅𝑆𝑆𝑖𝑖𝑇𝑇𝑅𝑅𝑆𝑆𝑇𝑇𝑆𝑆𝑆𝑆 𝑉𝑉𝑉𝑉𝑇𝑇 𝑆𝑆𝑇𝑇𝑖𝑖𝑅𝑅 × 𝐺𝐺𝐺𝐺𝐺𝐺
Source: Calculated using VAT as a % of GDP from IMF WoRLD database (http://data.imf.org/?sk=77413F1D-1525-450A-A23A-47AEED40FE78) or the International Centre for Tax and Development (ICTD)10 (http://www.ictd.ac/datasets/the-ictd-government-revenue-dataset)11, and VAT rate collected from KPMG Global (http://www.kpmg.com/GLOBAL/EN/SERVICES/TAX/TAX-TOOLS-AND-RESOURCES/Pages/indirect-tax-rates-table.aspx); PKF Tax Guides (http://www.pkf.com/publications/tax-guides); Deloitte’s Deloitte International Tax Source database (https://www.dits.deloitte.com/#DomesticRatesSubMenu); Ernst and Young Worldwide VAT, GST, and Sales Tax Guide (http://www.ey.com/GL/en/Services/Tax/Global-tax-guide-archive); and various country laws and regulations.
Data Quality: Although efficiency ratios are widely used in evaluating VAT regimes, the ratios can be misleading and do have conceptual weaknesses. In general, a VAT efficiency of 100 percent typically defines a ‘perfect’ VAT efficiency ratio; however, a country can have one that is above or below that mark, and it is better to compare one country over time due to structural differences across countries. A low VAT efficiency ratio is typically taken as evidence of erosion due to zero-ratings, exemptions, or inefficiencies in enforcement. However, in some rare cases, a country’s efficiency ratio can be higher than its neighbors or even above 100, due to inclusion of investment in the VAT base or a break in the VAT chain (resulting in taxation of final and intermediate goods).
CTD Code # vat_eff
8. VAT C-efficiency Ratio
Definition: This indicator is one of three related measures of VAT productivity found in the literature. It is calculated as the ratio of actual VAT collections in the country to the potential revenues that would be derived from applying the standard VAT rate to Total Consumption Expenditure. In principle, a VAT with no exemptions, a single rate, and full compliance should result in efficiency ratios of close to 100 percent. Note: for countries that do not have a VAT (i.e. countries that have a sales tax), this indicator is blank.
Formula: VAT C-Efficiency Ratio = 𝑉𝑉𝑉𝑉𝑇𝑇 𝑅𝑅𝑅𝑅𝑅𝑅𝑅𝑅𝑅𝑅𝑅𝑅𝑅𝑅 𝐶𝐶𝐶𝐶𝐶𝐶𝐶𝐶𝑅𝑅𝐶𝐶𝑖𝑖𝑖𝑖𝐶𝐶𝑅𝑅𝑆𝑆𝑖𝑖𝑇𝑇𝑅𝑅𝑆𝑆𝑇𝑇𝑆𝑆𝑆𝑆 𝑉𝑉𝑉𝑉𝑇𝑇 𝑆𝑆𝑇𝑇𝑖𝑖𝑅𝑅 × 𝑇𝑇𝐶𝐶𝑖𝑖𝑇𝑇𝐶𝐶 𝐶𝐶𝐶𝐶𝑅𝑅𝐶𝐶𝑅𝑅𝐶𝐶𝐶𝐶𝑖𝑖𝑖𝑖𝐶𝐶𝑅𝑅 𝐸𝐸𝑇𝑇𝐶𝐶𝑅𝑅𝑅𝑅𝑆𝑆𝑖𝑖𝑖𝑖𝑅𝑅𝑆𝑆𝑅𝑅
Source: Calculated using the above plus Total Consumption Expenditure (percent of GDP) from World Development Indicators.
Data Quality: See # vat_eff .
CTD Code # vat_c_eff
10 The variable referenced from the ICTD database is the “Taxes on goods and services, of which Taxes on Sales;” data are only pulled for countries that have VAT or a VAT-like GST. 11VAT/GDP data is collected from either WoRLD or ICTD based on the source that has more recent and complete data for the variable in order to maximize the total number of observations. The same source is used for a given country for all years in the series. Data are pulled from WoRLD if WoRLD has a full series of 5 years of VAT/GDP data for the country in the past 5 years. If not, data are pulled from either WoRLD or ICTD if that source has 14 years of data from the 15-year series. If neither source has at least 14 years of data over the past 15 years, data are pulled from the source with more data over the past 5 years. If the two sources have the same number of observations in the past 5 years, the data are pulled from the source with more data over the full 15 years. If the two series have the same overall number of observations, data are pulled from WoRLD. The source selected for Tax/GDP is also used for the following indicators: Tax/GDP, CIT/GDP, and PIT/GDP.
INTRODUCTION 6
6
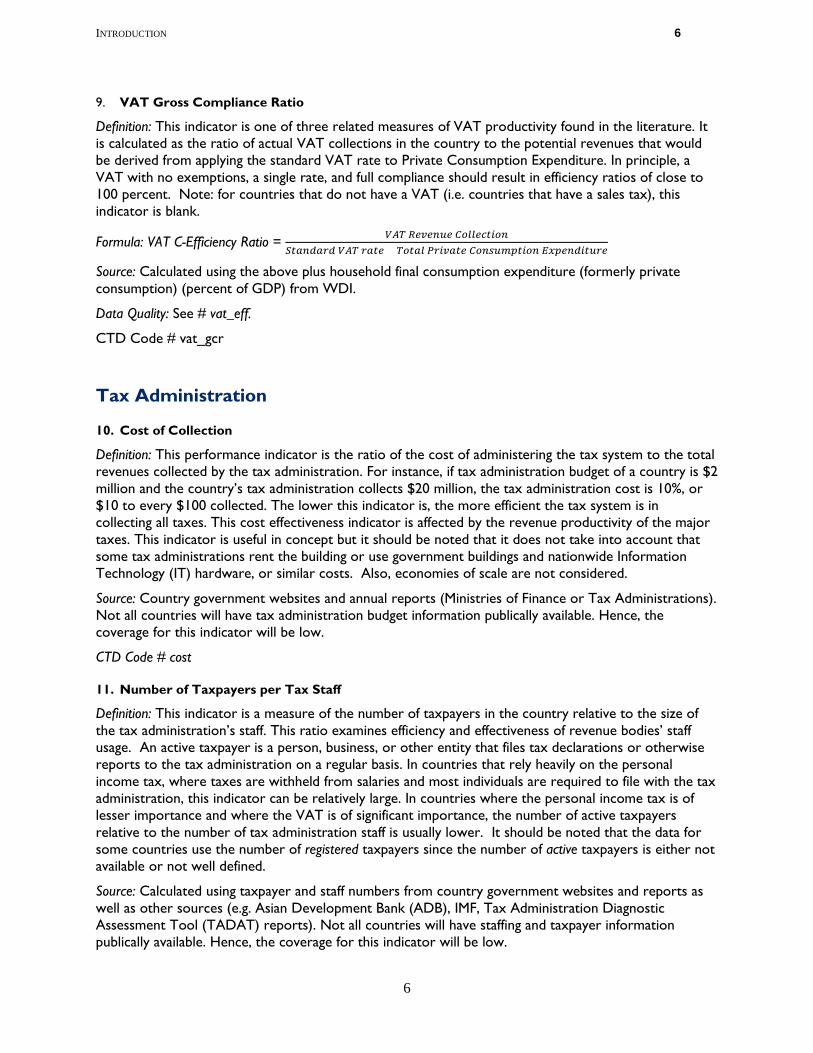
9. VAT Gross Compliance Ratio
Definition: This indicator is one of three related measures of VAT productivity found in the literature. It is calculated as the ratio of actual VAT collections in the country to the potential revenues that would be derived from applying the standard VAT rate to Private Consumption Expenditure. In principle, a VAT with no exemptions, a single rate, and full compliance should result in efficiency ratios of close to 100 percent. Note: for countries that do not have a VAT (i.e. countries that have a sales tax), this indicator is blank.
Formula: VAT C-Efficiency Ratio = 𝑉𝑉𝑉𝑉𝑇𝑇 𝑅𝑅𝑅𝑅𝑅𝑅𝑅𝑅𝑅𝑅𝑅𝑅𝑅𝑅 𝐶𝐶𝐶𝐶𝐶𝐶𝐶𝐶𝑅𝑅𝐶𝐶𝑖𝑖𝑖𝑖𝐶𝐶𝑅𝑅𝑆𝑆𝑖𝑖𝑇𝑇𝑅𝑅𝑆𝑆𝑇𝑇𝑆𝑆𝑆𝑆 𝑉𝑉𝑉𝑉𝑇𝑇 𝑆𝑆𝑇𝑇𝑖𝑖𝑅𝑅 × 𝑇𝑇𝐶𝐶𝑖𝑖𝑇𝑇𝐶𝐶 𝐺𝐺𝑆𝑆𝑖𝑖𝑅𝑅𝑇𝑇𝑖𝑖𝑅𝑅 𝐶𝐶𝐶𝐶𝑅𝑅𝐶𝐶𝑅𝑅𝐶𝐶𝐶𝐶𝑖𝑖𝑖𝑖𝐶𝐶𝑅𝑅 𝐸𝐸𝑇𝑇𝐶𝐶𝑅𝑅𝑅𝑅𝑆𝑆𝑖𝑖𝑖𝑖𝑅𝑅𝑆𝑆𝑅𝑅
Source: Calculated using the above plus household final consumption expenditure (formerly private consumption) (percent of GDP) from WDI.
Data Quality: See # vat_eff.
CTD Code # vat_gcr
Tax Administration
10. Cost of Collection
Definition: This performance indicator is the ratio of the cost of administering the tax system to the total revenues collected by the tax administration. For instance, if tax administration budget of a country is $2 million and the country’s tax administration collects $20 million, the tax administration cost is 10%, or $10 to every $100 collected. The lower this indicator is, the more efficient the tax system is in collecting all taxes. This cost effectiveness indicator is affected by the revenue productivity of the major taxes. This indicator is useful in concept but it should be noted that it does not take into account that some tax administrations rent the building or use government buildings and nationwide Information Technology (IT) hardware, or similar costs. Also, economies of scale are not considered.
Source: Country government websites and annual reports (Ministries of Finance or Tax Administrations). Not all countries will have tax administration budget information publically available. Hence, the coverage for this indicator will be low.
CTD Code # cost
11. Number of Taxpayers per Tax Staff
Definition: This indicator is a measure of the number of taxpayers in the country relative to the size of the tax administration’s staff. This ratio examines efficiency and effectiveness of revenue bodies’ staff usage. An active taxpayer is a person, business, or other entity that files tax declarations or otherwise reports to the tax administration on a regular basis. In countries that rely heavily on the personal income tax, where taxes are withheld from salaries and most individuals are required to file with the tax administration, this indicator can be relatively large. In countries where the personal income tax is of lesser importance and where the VAT is of significant importance, the number of active taxpayers relative to the number of tax administration staff is usually lower. It should be noted that the data for some countries use the number of registered taxpayers since the number of active taxpayers is either not available or not well defined.
Source: Calculated using taxpayer and staff numbers from country government websites and reports as well as other sources (e.g. Asian Development Bank (ADB), IMF, Tax Administration Diagnostic Assessment Tool (TADAT) reports). Not all countries will have staffing and taxpayer information publically available. Hence, the coverage for this indicator will be low.

INTRODUCTION 7
7
CTD Code # payertostaff
12. Population per Tax Staff
Definition: This is a measure of the size of the country’s population relative to the size of the tax administration. Like ‘payer to staff’, this ratio also examines efficiency and effectiveness of revenue bodies’ staff usage. It is total population compared with the total number of staff of the tax administration. For instance, if total population is 1,000,000 persons and the tax administration has 2,000 employees, then the value of this indicator is 500 ( i.e., one tax staff member for every 500 persons in the country).
Source: Calculated using total population from the WDI and staff numbers from government websites and reports, as well as other sources (e.g. ADB, IMF, TADAT reports). Not all countries will have staffing information publically available. Hence, the coverage for this indicator will be low.
CTD Code # poptostaff
13. Labor Force per Tax Staff
Definition: This is a measure of the size of the labor force in a country relative to the size of the tax administration. This indicator also measures the efficiency and effectiveness of revenue bodies’ staff usage. It is total labor force of a country compared with the total number of staff of the tax administration.
Source: Calculated using total labor force from the World Development Indicators and staff numbers from government websites and reports, as well as other sources (e.g. ADB, IMF, TADAT reports). Not all countries will have staffing information publically available. Hence, the coverage for this indicator will be low.
CTD Code # labortostaff
14. Functional Organization
Definition: This is a dummy or binary variable describing the organization of a tax administration. This indicator is “1” where the tax administration is organized by function and a “0” where the tax administration is organized otherwise. In general, tax administrations are either organized by type of tax or by function or a hybrid of the two. Tax-type organizations may have a VAT department, an income tax department, and other tax type department. Tax administrations organized along functional lines, on the other hand, have an audit department, an investigations department, and other departments responsible for a specific function across all taxes. While it is considered better practice to organize the tax administration by function because efficiency and cost savings are made when business processes are streamlined across tax types12, this indicator does not attempt to score tax administrations (is informational only). Also, note that this indicator only reports if the tax administration is organized by function according to the website/organogram, but does not tell us whether it operates this way in practice nor whether the processes are function-based. It can be the case that a country has departments organized by function but within each department, it still operates by tax-type in practice. In other words, this indicator is taken as “1” based on the organogram.
Source: Country government websites or organograms (Ministries of Finance and/or Tax Administrations)
CTD Code # function
12 It is also considered better practice that business processes (within departments) are streamlined across tax-type, and are distinct only for taxpayer segment (large vs. S/M) or by sector (e.g. oil and gas).

INTRODUCTION 8
8
15. Large Taxpayer Unit (LTU)
Definition: This is a dummy or binary variable denoting whether or not a country has a LTU. This indicator is “1” where the tax administration has a unit dedicated solely to tending to the largest taxpayers and “0” where the tax administration does not have such a unit. While it is considered better practice for tax administrations to establish LTUs in order to tailor risk management, control strategies, and business processes to the unique characteristics and compliance issues of large taxpayers, this indicator does not attempt to score a tax administration (it is informational only). It is also important to note that this indicator does not always take into account whether the LTU has been assigned full responsibilities, including tax arrears management, taxpayers assistance, legal affairs, and tax audits.13 This complete authority provides the LTU a more accurate control over large taxpayers, which increases efficiency and effectiveness of a tax administration.
Source: Country government websites or organograms (Ministries of Finance and/or Tax Administrations).
CTD Code # ltu
16. Customs
Definition: This is a dummy or binary variable denoting the type of customs arrangements present in a country. A “1” indicates that tax and customs administration operate as a single, integrated institution. A “0” indicates that this is not the case.
Source: Country government websites or organograms (Ministry of Finance and/or Tax Administration).
CTD Code # customs
17. Autonomy
Definition: This is a dummy or binary variable that indicates the degree to which a tax administration department or agency is able to operate independently from government, in terms of legal form, financial resources, human resources, and administrative practices. This indicator is “1” for countries that have a full or semi-autonomous revenue authority and “0” for those countries in which the tax administration is subordinated to another government body (typically the finance ministry). A revenue authority is considered semi-autonomous when it has been delegated several powers (but not necessarily all) without requiring external approvals (e.g. make tax rulings, hire/dismiss staff, design internal structure, etc.).
Source: Country government websites or organograms (Ministry of Finance and/or Tax Administration).
CTD Code # autonomy
18. e-registration
Definition: This is a dummy or binary variable that describes the existence of e-registration in a country. This indicator is “1” if e-registration exists for at least one core tax and all taxpayers, and “0” if not.14 The E-registration system may or may not be directly linked to services such as e-filing and e-payment.
Source: Country government websites (e-services links).
CTD Code # e_reg
13 In cases where the LTU only covers one function (e.g. tax audit), the country is scored a 0. 14 A number of countries are rolling out e-service systems. A country is assigned a ‘0’ if they are still in pilot phase (e.g. available only to a number of large taxpayers).

INTRODUCTION 9
9
19. e-filing
Definition: This is a dummy or binary variable that describes the availability of e-filing in a country. This indicator is “1” if e-filing system is available for at least one core tax and all taxpayers, and “0” if not.15 See e-registration indicator for more information. Note that this indicator does not measure the functionality or coverage of the e-service, only its availability.
Source: Country government websites (e-services links).
CTD Code # e_file
20. e-payment
Definition: This is a dummy or binary variable that describes the availability of e-payment in a country. This indicator is “1” if e-payment system is available for at least one core tax and all taxpayers, and “0” if not. See e-registration indicator for more information. Note that this indicator does not measure the functionality or coverage of the e-service, only its availability.
Source: Country government websites (e-services links).
CTD Code # e_pay
15 A number of countries are rolling out e-service systems. A country is assigned a ‘0’ if they are still in pilot phase (e.g. available only to a number of large taxpayers).

INTRODUCTION 10
10
Country Notes 1. Afghanistan
Tax Performance Afghanistan appears as a high outlier for CIT buoyancy for 2007-08, when Afghanistan undertook several tax and administration reforms (establishing a LTU in the revenue department, simplifying the CIT and PIT, among others). The estimated CIT buoyancy was 7.43 in 2008. Tax revenues are a small share of GDP because of reliance on external grants. As Afghanistan develops its domestic revenue sources, more businesses are included in the tax system increasing corporate tax revenues. Afghanistan, although not a natural resource producer, scores a very low tax effort of around 15 percent. The country has been in a state of civil war over 20 years. The tax base that can be used for domestic revenue mobilization (DRM) is limited. Grants are still close to half of the government’s budget. Tax Administration The tax revenue used to calculate cost of collection is revenue budgeted for 2016.
2. Albania Tax Administration The tax revenue used to calculate cost of collection is for 2016.
3. Algeria Tax Performance Note that Algeria has tax policies related to its natural resources that are viewed by experts to be an outlier. For this reason, estimates on tax performance variables should be viewed with caution (See footnote on pg. 4 of Le et al (2012)). Algeria has negative PIT buoyancy estimates from 2000-02 and negative, not statistically significant CIT estimates from 2004-05. Poor performance on the PIT can be attributed to reduction in income tax rates in the 1999 budget law, as well as tax evasion due to rumors of a possible tax amnesty anticipated to be granted by the new president. From 2006-07, both the PIT and CIT buoyancy estimates are relatively strong, exceeding 3 in several years for the CIT buoyancies. The improvements in tax buoyancies from 2006 onward correspond with a modernization of the tax administration that contributed to increased collections.
4. Andorra Tax Administration The tax revenue used to calculate cost of collection is in Euros.
5. Angola Tax Performance Note that Angola has tax policies related to its natural resources that are viewed by experts to be an outlier. For this reason, estimates on tax performance variables should be viewed with caution (See footnote on pg. 4 of Le et al (2012)).
6. Antigua and Barbuda Tax Performance A high PIT buoyancy between 2006-2013 was likely driven by its reintroduction in 2005, which saw a significant growth in early years.

INTRODUCTION 11
11
7. Argentina Tax Performance
1999-2001 saw very high PIT buoyancy in part as a result of the introduction of higher PIT rates and other tax measures.
8. Armenia Tax Performance Tax Administration The tax revenue used to calculate cost of collection is for 2016. Staff figures are for calculating Number of Taxpayers per Tax staff are as of 2008.
9. Aruba Tax Performance ICTD data for Tax/GDP, CIT/GDP, PIT/GDP, and VAT/GDP are used in lieu of WoRLD/GFS.
10. Australia Tax Performance Australia scored a tax effort of around 65-70 percent. Similar to New Zealand, Australia reformed its tax system in early 1990s and achieved a highly efficient tax system. Australia utilizes its domestic tax resources. It has a well-functioning VAT with fewer exemptions and an efficient tax administration that guarantees high compliance. In addition, Australia efficiently taxes the mining industry with royalties and resource rent taxes.
11. Austria No notes
12. Azerbaijan Tax Administration The tax revenue used to calculate cost of collection is for 2015 (denominator) and the expenditure on tax is from 2009 (numerator). The number of taxpayers is from 2015.
13. Bahamas, The Tax Performance Bahamas after over 20 years of almost no growth started to reform its tax system, with the introduction of the VAT in 2015. The system was characterized by: (1) low tax buoyancy; (2) dependence on fees and levies that are distortionary and cascading; (3) narrow tax bases through exemptions and concessions; (4) decline in collection efforts in property taxation; (5) over-taxation of goods relative to services; and (6) lack of adaptation to changing market conditions. The high tax buoyancy of 3.71 in 2011 is attributable to higher revenues resulting from increase in tourism and construction (one mega construction project) after the 2009 crisis. The sales tax was eliminated in favour of a VAT in 2014. While only recently introduced, the Bahamas have one of the most productive VATs in the Caribbean – with few exemptions and high compliance rates (in part due to the use of the new DATA TORQUE system). The Bahamas still does not have a corporate and personal income tax.
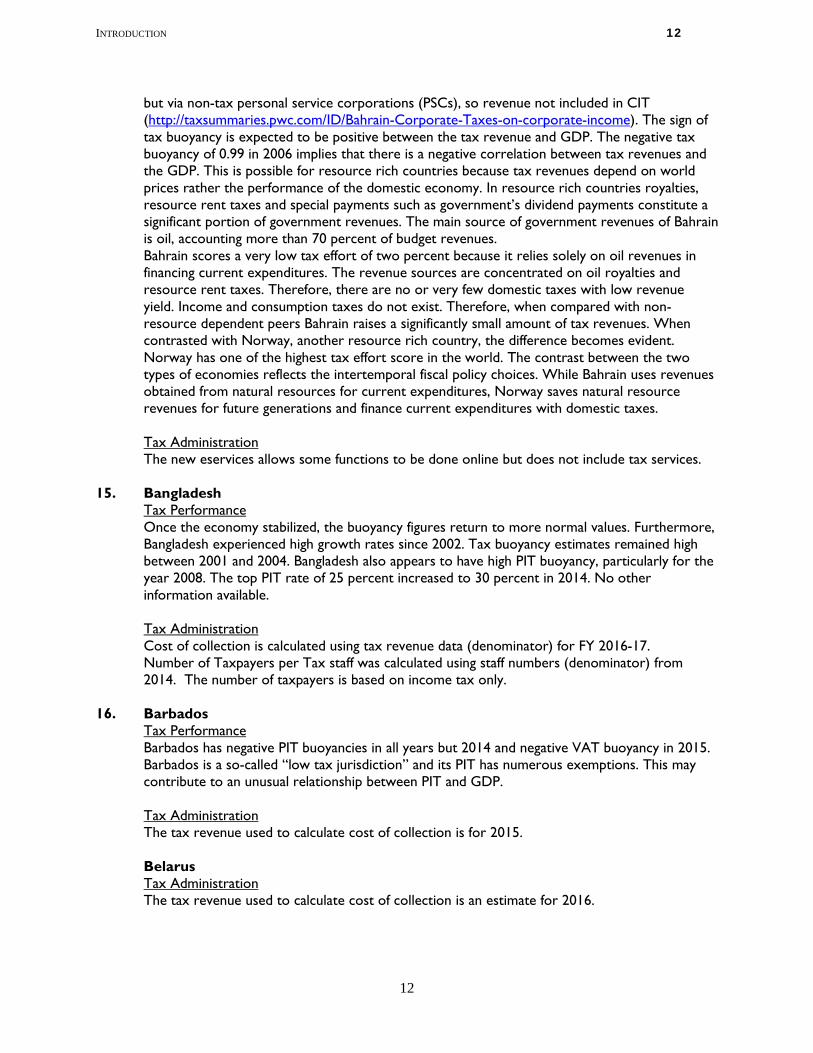
14. Bahrain Tax Performance Note that Bahrain is a resource rich country whose tax data include notable outliers. For this reason, estimates on tax performance variables should be viewed with caution. Country does not have a PIT regime, and the CIT regime is limited. Bahrain only taxes oil and gas corporations
INTRODUCTION 12
12
but via non-tax personal service corporations (PSCs), so revenue not included in CIT (http://taxsummaries.pwc.com/ID/Bahrain-Corporate-Taxes-on-corporate-income). The sign of tax buoyancy is expected to be positive between the tax revenue and GDP. The negative tax buoyancy of 0.99 in 2006 implies that there is a negative correlation between tax revenues and the GDP. This is possible for resource rich countries because tax revenues depend on world prices rather the performance of the domestic economy. In resource rich countries royalties, resource rent taxes and special payments such as government’s dividend payments constitute a significant portion of government revenues. The main source of government revenues of Bahrain is oil, accounting more than 70 percent of budget revenues. Bahrain scores a very low tax effort of two percent because it relies solely on oil revenues in financing current expenditures. The revenue sources are concentrated on oil royalties and resource rent taxes. Therefore, there are no or very few domestic taxes with low revenue yield. Income and consumption taxes do not exist. Therefore, when compared with non-resource dependent peers Bahrain raises a significantly small amount of tax revenues. When contrasted with Norway, another resource rich country, the difference becomes evident. Norway has one of the highest tax effort score in the world. The contrast between the two types of economies reflects the intertemporal fiscal policy choices. While Bahrain uses revenues obtained from natural resources for current expenditures, Norway saves natural resource revenues for future generations and finance current expenditures with domestic taxes. Tax Administration The new eservices allows some functions to be done online but does not include tax services.
15. Bangladesh Tax Performance Once the economy stabilized, the buoyancy figures return to more normal values. Furthermore, Bangladesh experienced high growth rates since 2002. Tax buoyancy estimates remained high between 2001 and 2004. Bangladesh also appears to have high PIT buoyancy, particularly for the year 2008. The top PIT rate of 25 percent increased to 30 percent in 2014. No other information available. Tax Administration Cost of collection is calculated using tax revenue data (denominator) for FY 2016-17. Number of Taxpayers per Tax staff was calculated using staff numbers (denominator) from 2014. The number of taxpayers is based on income tax only.
16. Barbados Tax Performance Barbados has negative PIT buoyancies in all years but 2014 and negative VAT buoyancy in 2015. Barbados is a so-called “low tax jurisdiction” and its PIT has numerous exemptions. This may contribute to an unusual relationship between PIT and GDP. Tax Administration The tax revenue used to calculate cost of collection is for 2015. Belarus Tax Administration The tax revenue used to calculate cost of collection is an estimate for 2016.
INTRODUCTION 13
13
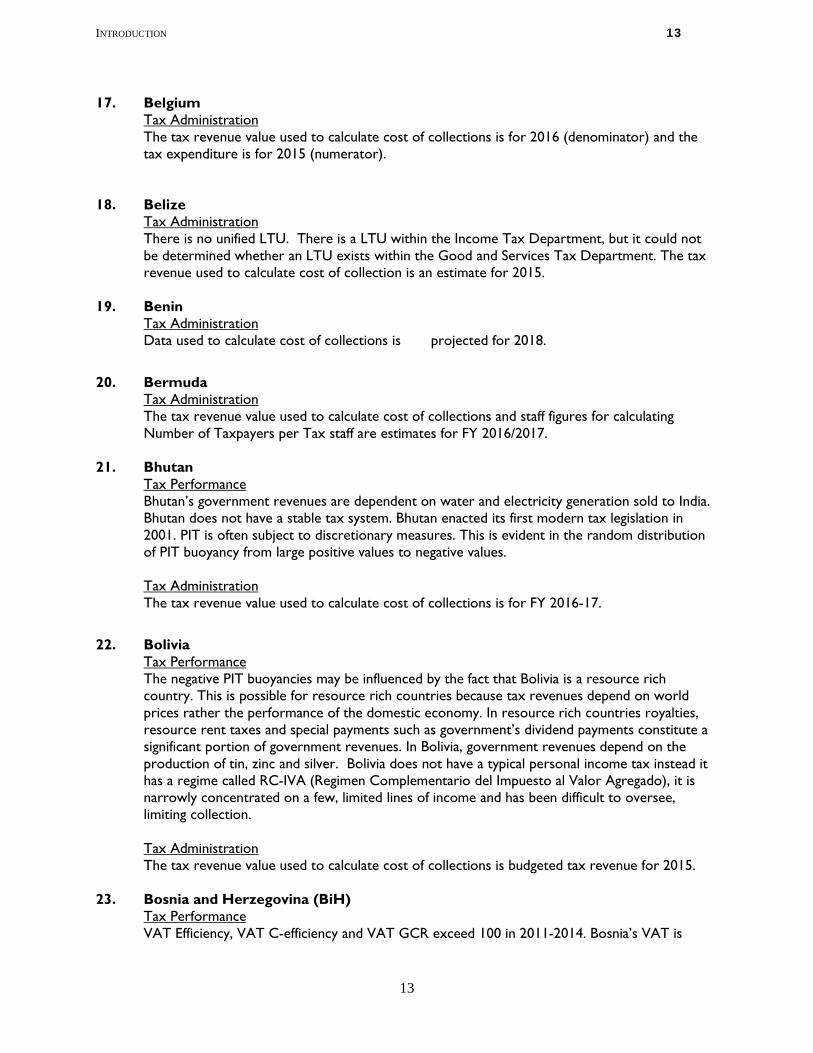
17. Belgium Tax Administration The tax revenue value used to calculate cost of collections is for 2016 (denominator) and the tax expenditure is for 2015 (numerator).
18. Belize
Tax Administration There is no unified LTU. There is a LTU within the Income Tax Department, but it could not be determined whether an LTU exists within the Good and Services Tax Department. The tax revenue used to calculate cost of collection is an estimate for 2015.
19. Benin Tax Administration Data used to calculate cost of collections is projected for 2018.
20. Bermuda
Tax Administration The tax revenue value used to calculate cost of collections and staff figures for calculating Number of Taxpayers per Tax staff are estimates for FY 2016/2017.
21. Bhutan Tax Performance Bhutan’s government revenues are dependent on water and electricity generation sold to India. Bhutan does not have a stable tax system. Bhutan enacted its first modern tax legislation in 2001. PIT is often subject to discretionary measures. This is evident in the random distribution of PIT buoyancy from large positive values to negative values. Tax Administration The tax revenue value used to calculate cost of collections is for FY 2016-17.
22. Bolivia Tax Performance The negative PIT buoyancies may be influenced by the fact that Bolivia is a resource rich country. This is possible for resource rich countries because tax revenues depend on world prices rather the performance of the domestic economy. In resource rich countries royalties, resource rent taxes and special payments such as government’s dividend payments constitute a significant portion of government revenues. In Bolivia, government revenues depend on the production of tin, zinc and silver. Bolivia does not have a typical personal income tax instead it has a regime called RC-IVA (Regimen Complementario del Impuesto al Valor Agregado), it is narrowly concentrated on a few, limited lines of income and has been difficult to oversee, limiting collection. Tax Administration The tax revenue value used to calculate cost of collections is budgeted tax revenue for 2015.
23. Bosnia and Herzegovina (BiH) Tax Performance VAT Efficiency, VAT C-efficiency and VAT GCR exceed 100 in 2011-2014. Bosnia’s VAT is

INTRODUCTION 14
14
viewed to be fairly efficient (per the 2015 IMF Article IV Consultation Staff Report), but these high levels should be taken with caution and may be due to data quality issues. Tax Administration There are three tax administrations: 1) Tax Authority of the Federation of Bosnia and Herzegovina (FBiH), 2) Tax Authority of the Republika Srpska (RS), and 3) Indirect Taxation Authority of BiH (VAT and Customs – State level) due to two main tax jurisdictions (autonomous regions) the FbiH and the RS.
24. Botswana No notes
25. Brazil Tax Performance Brazil scored a tax effort of above 75 percent, which is the combined score of the federal and state governments. Brazil undertook major tax reforms in order to stabilize government finances. It has a relatively well functioning tax system based on domestic and a good tax administration. The main sources of revenues are VAT both at the federal and state level and income taxes. Tax Administration The tax revenue value used to calculate cost of collections is budgeted tax revenue for 2015. Taxpayer figure for calculating Number of Taxpayers per Tax staff are for FY 2012.
26. Brunei Darussalam Tax Performance Note that Brunei Darussalam is a resource (oil and gas) rich country whose tax data include notable outliers. The country has very limited taxes (i.e. the country has CIT, but no PIT or VAT). Ninety percent of government revenues are from oil and gas. For this reason, estimates on tax performance variables should be viewed with caution. This leads, for example, to outlier high estimates of tax buoyancy.
27. Bulgaria Tax Performance Bulgaria has seen a high CIT and overall tax buoyancy (1999), and negative PIT buoyancy (between 2001-2006). The former was potentially the result of repeal of a number of tax incentives (See IMF Article 4 – 1999); the latter the result of significant cuts to taxes in the 2001 budget (including reducing PIT by 2%).
28. Burkina Faso No notes
29. Burundi No notes
30. Cambodia Tax Administration

INTRODUCTION 15
15
Staff figures are for calculating Number of Taxpayers per Tax staff are as of 2013. Taxpayer figure for calculating Number of Taxpayers per Tax staff are for FY 2012.
31. Cameroon
No notes
32. Canada Tax Performance VAT C-efficiency exceeds 100 in 2011-14 and VAT GCR exceed 100 in 2010-14. While Canada may be considered to be a fairly efficient country with respect to VAT collections, these high figures are likely due to the fact that VAT in Canada is collected at both the national and provincial levels. The VAT as a percentage of GDP figures will cover the VAT collected at both levels, while the VAT rate will only account for the VAT collected at the national level. Canada also has a reducing CIT buoyancy for 2003/04, which is the result of changes in the corporate taxes between 2000 and 2004. These changes are a reduction in the corporate tax rate, lower resources taxes and a larger tax credit for mining companies. Tax Administration Taxpayer figure for calculating Number of Taxpayers per Tax staff are for FY 2015.
33. Cape Verde No notes
34. Central African Republic Tax Performance Central African Republic’s low performance on the C-Efficiency and GCR for 2012 corresponds to a period of social unrest in the country.
35. Chad Tax Performance Chad is a small oil-producing country whose tax data include notable outliers. Its tax revenues are subject to the volatility of oil prices. For this reason, estimates on tax performance variables should be viewed with caution. There is also a high tax buoyancy estimate for 2013, which primarily reflects the substantial decline in the share of oil revenues as a share of GDP from 22 percent in 2012 to 14.6 percent in 2013 and 17.2 percent in 2014.
36. Chile Tax Administration Staff figure for calculating Number of Taxpayers per Tax staff are for FY 2015.
37. China Tax Performance China’s tax buoyancy for the year 1999 appears to be a high outlier. There were no significant tax measures taken in 1999. However, a major tax reform was implemented in 1994 and its implementation was phased in over several years. This reform continuously increased the tax-to-GDP ratio from about 7.5 percent in 1994 to 12.5 percent in 1999 and to 20 percent by 2011. The 1994 reform increased the buoyancy of the taxes by replacing some of the distortionary taxes with more income and turnover based taxes. Tax buoyancies were estimated to be high for the years after 1999 as well.

INTRODUCTION 16
16
Tax Administration Staff figure for calculating Number of Taxpayers per Tax staff are for FY 2013. Taxpayer figure for calculating Number of Taxpayers per Tax staff are for FY 2014. Information on e-Filing and e-Payment is as of 2013. Staff figures are for calculating Number of Taxpayers per Tax staff are as of 2011.
38. Colombia Tax Performance In 2006, the personal income tax was reformed and some of the tax expenditures were scaled back.
Tax Administration The tax expenditure value used to calculate cost of collections is for 2015.
39. Comoros Tax Administration The tax administration for Comoros, General Tax and Property Administration (AGID), is semi-function based on 3 local island tax administrations.
40. Congo, Dem. Rep. Tax Performance No data are available for PIT; Incomes other than salaries (PAYE) are not subject to IPR (income tax). Tax Administration The tax revue value used to calculate cost of collections is an estimate for 2017.
41. Congo, Rep.
Tax Performance The Republic of the Congo had negative, non-statistically significant estimates for tax buoyancy and PIT buoyancy from 2000-01. This corresponds with a period of social unrest. The Republic of the Congo also has had negative PIT buoyancies in several years (2005, 2006, 2010). In part due to Republic of Congo’s status as a resource rich country, it has relatively modest PIT collections. The country also had modest, negative VAT buoyancies in several years that are significant in 2006 and 2007.
42. Cook Islands Tax Administration Labor force figures are for calculating Number of Labor force per Tax staff are as of 2011.
43. Costa Rica Tax Administration The tax revenue value used to calculate cost of collections is an estimate for 2018 (denominator) and the tax expenditure is for 2015 (numerator).
Tax Performance
CIT buoyancy estimates for Costa Rica were very high from 2007-13. This corresponds with a period of improved tax administration that promoted better compliance with income taxes.
44. Cote d’Ivoire
INTRODUCTION 17
17
Tax Performance
Cote d’Ivoire’s low performance on the VAT Efficiency, C-Efficiency, and GCR for 2011 corresponds to a period of social unrest in the country. Cote d’Ivoire has a very small, negative, not statistically significant estimates for tax buoyancy in 2003-04 corresponding with a period when real GDP was contracting. Estimates of PIT buoyancy were negative from 2007-12 and CIT buoyancy was slightly negative in 2014. There was also a high negative VAT buoyancy for 2007-08, with smaller negative VAT buoyancies for the next 3 years. 2007-08 corresponds with a period of social unrest.
Tax Administration The tax revenue value used to calculate cost of collections is a projection for 2017.
45. Croatia
Tax Performance A high buoyancy in 1999 could be explained by recession in Croatia, with unusually slow growth in 2001 leading to negative.
46. Cuba Tax Performance ICTD data for Tax/GDP, CIT/GDP, PIT/GDP, and VAT/GDP are used in lieu of WoRLD/GFS. Data are only available in ICTD and cannot be validated against IMF or World Bank sources because neither source has data for Cuba for these years. There are several low outlier observations for Cuba for PIT and CIT buoyancies for 1999 through 2001, which appear to be due to a period of economic contraction following Cuba’s introduction of tax law 73 of 1994 that included a corporate income tax and introduced PIT. Cuba does not have a VAT. It has a sales tax, which reached to 20 percent in 2016. The high tax buoyancy estimate in 2002 is due to an increase in the tax rate. Cuba scored a tax effort of 87 percent. Although Cuba captures 87 percent of its potential tax revenues, it does not do it in the most effective manner. Cuba does not have a modern tax system where a large portion of the tax revenues are generated from consumption taxes, progressive labor income taxes and relatively low taxes on capital income. Instead, the high level of tax revenues are from a cascading sales tax, transaction taxes and high taxes on enterprises. So, the high tax effort score should be viewed with caution.
47. Cyprus Tax Performance The estimated CIT buoyancy was 5.51 in 2000. CIT buoyancies remained high between 1999 and 2003. In general, Cyprus has one of the lowest corporate tax rates in the EU at 10 percent (was 12.5 percent). However, it is the tax benefits that bring a lot of foreign companies to Cyprus. These benefits attracted a lot of corporations to Cyprus before accession to EU. For example, exemption from taxation of dividends, no capital gains tax, treatment of losses, no thin cap rules, no CFC rules make Cyprus an attractive location for corporations. The benefits of locating to Cyprus outweigh the low corporate tax rate by a large margin. Tax Administration The tax revenue value used to calculate cost of collections is for 2016 .
48. Czech Republic

INTRODUCTION 18
18
Tax Performance 1999 saw a significant negative CIT buoyancy, this in part was likely because 1999 was the final year of a significant recession, following from the 1997 currency crisis. Tax Administration Cost of collection is calculated using tax revenue values (denominator) and tax expenditure values (numerator) for 2015. Figures are reported in Czech Koruna (CZK) not Euros.
49. Denmark Tax Performance Denmark scored the highest tax effort of 95 percent, which is expected. Denmark utilizes its domestic tax resources more effectively than any other country. It has a well-functioning tax system and an efficient tax administration that guarantees high compliance. The main sources of revenues are VAT and income taxes. Denmark collects about 95 percent of its potential tax revenue. In 2014 a higher CIT, PIT and overall tax buoyancy was likely the result of large one-off revenues from a change in pension taxation.
Tax Administration Cost of collection is calculated using tax revenue values (denominator) for 2016. Figures are reported in Danish Krone (DKK) not Euros.
50. Djibouti Tax Administration Cost of collection is calculated using tax revenue projections for 2017.
51. Dominica Tax Performance No explanation found for the high VAT buoyancy. Dominica has very generous tax holidays, and other tax incentives.
Tax Administration Cost of collection is calculated using tax revenue projections for 2017.
52. Dominican Republic Tax Performance An increase in the VAT tax rate from 8 percent to 12 percent in 2002 coupled with a high GDP growth rate led to high VAT buoyancy. Tax Administration Cost of collection is calculated using tax revenue projections for 2018.
53. Ecuador Tax Performance Estimated tax buoyancies were high between 2001 and 2004 a period of economic crisis and recovery that ended with dollarization and reforms which contributed to extraordinary jumps in VAT/GDP over the period. Ecuador is a small oil producing country. However, Ecuador managed to implement a number of structural reforms under a Standby Agreement (SBA) with the IMF until 2002. Further revenue measures were necessary in 2003 and 2004. These were base broadening measures that eliminated some of the VAT exemptions on imports which contributed to the large tax buoyancy estimate.

INTRODUCTION 19
19
Note as well that Ecuador has tax policies related to its natural resources that are viewed by experts to be an outlier. For this reason, estimates on tax performance variables should be viewed with caution (See footnote on pg. 4 of Le et al (2012))
54. Egypt Tax Administration Taxpayer figure for calculating Number of Taxpayers per Tax staff are for FY 2004.
55. El Salvador Tax Performance El Salvador has high tax buoyancy for the years 2006-2008. It reformed its tax administration between 2006 and 2010 increasing revenues from large taxpayers. In addition, tax policy measures as part of consolidation in 2006 and 2007 reduced exemptions and increased tax revenues independent of economic activity. However, tax buoyancy declined after the 2009 crisis.
Tax Administration Tax revenue used in cost of collection is reported in U.S. dollars.
56. Equatorial Guinea Tax Performance Note that Equatorial Guinea has tax policies related to its natural resources that are viewed by experts to be an outlier. For this reason, estimates on tax performance variables should be viewed with caution (See footnote on pg. 4 of Le et al (2012)). Equatorial Guinea scores a tax capacity of 32 percent on average, which is on the lower end of spectrum for high and upper middle income countries. It should be noted that tax capacity refers to the potential revenue that can be obtained from an economy. As the GDP grows, tax capacity will also grow. With the discovery of oil in the nineties, GDP growth accelerated and it became one of the richest countries in the world. However, GDP growth was dependent on oil production. So, tax capacity expanded consistent with GDP growth until oil-led growth started to slow down. However, increase in tax capacity did not translate into an increase in tax effort. Equatorial Guinea was able to collect only about three percent of its potential tax revenue. VAT Efficiency, VAT C-efficiency and VAT GCR were relatively weak for Equatorial Guinea. Data was only available for these variables for the period 2007-09, which was just after the introduction of the VAT in the country. Country does not have a PIT regime for individuals, only taxes on inheritance, stamp duties, property, and other taxes. Tax Administration Cost of collection is calculated using tax revenue projections for 2017.
57. Eritrea No notes
58. Estonia Tax Performance Estonia undertook a major reform of corporate taxes in 2001. Estonia switched to a tax system where profits are taxed only when distributed as dividends.

INTRODUCTION 20
20
59. Ethiopia Tax Performance Ethiopia’s low performance on the VAT Efficiency for 2008 and 2010 preceded a major tax reform that addressed, among other issues, weaknesses in VAT collections and a reduction in VAT exemptions per the 2010 IMF Article IV Staff Report.
Tax Administration Cost of collection is calculated using tax revenue for 2015/2016.
60. Fiji No notes
61. Finland Tax Performance Finland’s estimated CIT buoyancy was 7.2 in 2002. The high tax buoyancy is attributable to the changes in the corporate tax system. All years between 1999 and 2004 have high tax buoyancies estimates. The government planned to increase the tax on dividends after 2004. So, corporations accelerated dividend distributions which are taxed at the corporate level. The high tax buoyancy levels were not observed after 2004. Finland scored a tax effort of 70 percent on average. Finland similar to other Scandinavian countries has a highly efficient dual income tax system which taxes capital incomes at lower rate while maintaining a highly progressive tax system on labor income. The main sources of revenues are VAT and income taxes. Tax Administration All figures are as of 2015. E-payment exists but via specified banks; a different set of banks applies for individuals and companies.
62. France Tax Administration Data for the cost of collection is for 2015.
63. Gabon Tax Performance Tax buoyancy estimates for Gabon from 2004 through 2011 are negative. The sign of tax buoyancy is expected to be positive between the tax revenue and GDP. The negative tax buoyancy of 1.08 implies that there is a negative correlation between tax revenues and the GDP. This is possible for resource rich countries because tax revenues depend on world prices rather the performance of the domestic economy. Indeed, the list of countries includes mostly resource-based countries. In resource rich countries, royalties, resource rent taxes and special payments such as government's dividend payments constitute a significant portion of government revenues. Gabon's government revenues depend on price and production of timber and oil.
64. Gambia, The No notes
65. Georgia Tax Performance

INTRODUCTION 21
21
Georgia has a high CIT buoyancy: the year 2006 is one of the top largest CIT buoyancies in the database. The high tax buoyancy is due to a number of tax reforms implemented between 2006 and 2011. In the early stages of the reforms tax procedures were simplified and the number of transaction taxes was reduced. Then, is 2008 corporate tax rate was reduced to 15 percent from 20 percent. Negative buoyancy on PIT prior to 2003 likely reflects ongoing issues with collection. Georgia has a tax capacity level of about 40 percent of GDP on average—one of the highest for a low or lower-middle income countries. Although still a low income country, it has achieved high growth rates since 2008. This resulted in a high tax capacity. However, with reforms, improvements in tax administration and campaign against corruption, it was able to realize 50 percent of the potential tax revenue, higher than many other countries.
66. Germany
No notes 67. Ghana
Tax Performance Ghana’s low performance on the VAT C-Efficiency and GCR for 2001-02 corresponds to a period where the IMF notes particular weaknesses in tax administration, per the 2002 Fourth Review under Ghana’s Poverty Reduction and Growth Facility (Country Report No. 02/38). Ghana had relatively high estimates for tax buoyancy from 2004-07. This was driven by significant reforms to the tax administration, including the introduction of a new large tax payer unit, and an increase in the VAT rate from 12.5% to 15% between 2003 and 2004. Tax Administration The tax revenue used to calculate cost of collection is provisional data for 2015.
68. Greece Tax Performance Greece’s CIT buoyancy estimates were slightly negative in 2008-10, reflecting in part a slight reduction in the CIT rates. Greece also had slightly negative PIT buoyancy estimates from 2012-14. This corresponds with a period of strong economic contraction.
69. Grenada Tax Performance There are several low outlier observations for Grenada for PIT for 1999-2001.There is not sufficient information on PIT in 2001. The tax buoyancy estimates were negatives for years 2000-2004. This is the period when government was reducing the wage bill of public employees. Hurricane Ivan and aftermath coincided with negative buoyancies for CIT (2005-2007). Tax Administration The tax revenue used to calculate cost of collection is provisional data for 2017 and the tax expenditure used is an estimate for 2018.
70. Guatemala Tax Performance Guatemala has a low tax burden on individual even though it has a highly progressive tax rate structure. While GDP was growing at 3 to 5 percent range PIT revenues were growing at over 13 percent annually during the same period. There is not sufficient information on the high growth rate of PIT.

INTRODUCTION 22
22
71. Guinea No notes
72. Guinea Bissau Tax Performance Guinea-Bissau, one of the poorest countries in the world, scores a very low tax effort of 20 percent on average. The country has limited tax base and most government revenues are generated from licensing timber, palm, and fishing. So, there are very few domestic taxes with low revenue yield. Tax Administration The tax revenue used to calculate cost of collection is for 2015.
73. Guyana
No notes
74. Haiti Tax Performance Tax buoyancy estimates for Haiti were estimated to be negative from 2001-05. This corresponds with a tumultuous period of political and economic stability, including a coup in 2004. Conversely, tax buoyancy estimates were very high from 2008-14. The earlier portion of the period corresponds with efforts to improve tax administration. Tax Administration The tax revenue used to calculate cost of collection is for FY 2014/2015.
75. Honduras No notes
76. Hong Kong, China Tax Performance Hong Kong scores a tax capacity of over 52 percent—one of the highest estimates in the database. The high capacity reflects the potential revenue conditional on the economic development, such as trade liberalization, income and the level of economically active population. Hong Kong is a free trade area and has a productive population. But Hong Kong is also a low tax country and can sustain the current level taxation with great ease. As a result, the tax effort remains low while it has a big potential to mobilize its domestic revenue sources.
77. Hungary Tax Performance The high buoyancy in 2013 reflects the revisions and making permanent of a number of sector taxes; these taxes generate substantial revenue (particularly from the financial sector), at around 2 percent of GDP.
78. Iceland Tax Performance After the major financial crisis in 2009, Iceland reformed its tax system scoring a tax effort of 76 percent on average. Iceland's tax system is similar to that of Scandinavian countries where the main sources of revenues are VAT and income taxes.

INTRODUCTION 23
23
Tax Administration Number of taxpayers is as of 2012.
79. India
Tax Administration The tax revenue and expenditure on revenue authority values used to calculate cost of collection are for FY 2016/2017.
80. Indonesia Tax Administration The size of tax staff is as of 2013 and the tax revenue used for cost of collected is a projection for 2017.
81. Iran, Islamic Rep. Tax Performance Note that Iran has tax policies related to its natural resources that are viewed by experts to be an outlier. For this reason, estimates on tax performance variables should be viewed with caution (See footnote on pg. 4 of Le et al (2012)). Iran scores a very low tax effort of 16 percent. The country relies solely on oil revenues in financing current expenditures. The revenue sources are concentrated on oil royalties and resource rent taxes. As a result, there are very few domestic taxes with low revenue yield. Income and consumption taxes are low and in the process of being reformed. Thus, when compared with non-resource dependent peers Iran raises a small amount of domestic tax revenues. When contrasted with Norway, another resource rich country, the difference becomes evident. Norway has one of the highest tax effort score in the world. The contrast between the two types of economies reflects the intertemporal fiscal policy choices. While Iran uses revenues obtained from natural resources for current expenditures, Norway saves natural resource revenues for future generations and finance current expenditures with domestic taxes.
Tax Administration The size of tax staff is as of 2004. The tax revenue for cost of collection is a projection for 2018.
82. Iraq Tax Performance Note that Iraq has tax policies related to its natural resources that are viewed by experts to be an outlier. For this reason, estimates on tax performance variables should be viewed with caution (See footnote on pg. 4 of Le et al (2012))
83. Ireland Tax Performance Ireland is a low tax rate jurisdiction, particularly related to corporate tax rates. Ireland had a negative CIT buoyancy from 2011 through 2013. This corresponds with a period of economic crisis and fiscal consolidation.
84. Israel No notes
85. Italy Tax Performance

INTRODUCTION 24
24
Italy scores a tax effort of 73 percent on average. While Italy is known for wide-scale tax evasion, recent reforms, particularly after the financial crisis in 2009, helped improve revenue productivity and the tax effort. Significant deductions for investment we allowable in 2001/02. Tax Administration The tax administration consists of three agencies: the Revenue Agency, the State Property Agency, and Customs and Monopolies Agency. The tax expenditure for cost of collection and number of taxpayers are as of 2015.
86. Jamaica Tax Performance PIT buoyancies (significantly negative 2004-2014), are in part explained by the ongoing stagnation of PIT revenues (creating a real terms fall). Between 2004 and 2016 the PIT threshold increased by an average of 14% a year (see: https://www.jamaicatax.gov.jm/documents/10181/106853/income+tax+exemption+2002_2016.pdf/db9975eb-db04-45d2-b8dc-783c173adf55), over the same period real GDP growth was around 0.4% on average, and inflation 9.9% on average. Between 2012 and 2014 Jamaica implemented major tax reforms. The tax burden shifted from direct taxes to indirect taxes. As a result, income tax rates declined and an employee tax credit was introduced which lowered the revenue yield on personal income tax. CIT buoyancies are very high through period 2004-2014. Tax Administration Tax revenue for the cost of collection is for FY 2014/15. The number of taxpayers is for FY 2016/2017.
87. Japan Tax Performance Japan has a number of negative tax buoyancy estimates. This may reflect negative GDP growth in 1999. Tax Administration Number of taxpayers only includes income taxpayers.
88. Jordan Tax Administration Tax revenue for the cost of collection is for 2015.
89. Kazakhstan No notes
90. Kenya Tax Administration Data for calculation the cost of collection is for FY 2014/15. Number of tax staff is as of June 2015.
91. Kiribati No notes
92. Korea, Dem. People’s Rep.
INTRODUCTION 25
25
Tax Performance All tax performance variables are listed as “n/a” for North Korea. Officially, taxes were abolished in 1974; however, there is a 'hidden' sales or turnover 'usage fee' (or tax) on products for consumers.
93. Korea, Rep.
Tax Administration Tax expenditure for the cost of collection is as of 2011. Number of tax staff is as of 2013.
94. Kosovo Tax Performance ICTD data for Tax/GDP, CIT/GDP, PIT/GDP, and VAT/GDP are used in lieu of WoRLD/GFS.
95. Kuwait Tax Performance Note that Kuwait has tax policies related to its natural resources that are viewed by experts to be an outlier. For this reason, estimates on tax performance variables should be viewed with caution (See footnote on pg. 4 of Le et al (2012)). Country does not have a PIT regime. No data are available for CIT; CIT only on wholly or partially foreign-owned companies, not wholly owned locals. Kuwait scores a very low tax effort of two percent because it relies solely on oil revenues in financing current expenditures. The revenue sources are concentrated on oil royalties and resource rent taxes. Kuwait has no or very few domestic taxes with low revenue yield. Income and consumption taxes do not exist. When compared with non-resource dependent peers Kuwait raises a significantly small amount of tax revenues. When contrasted with Norway, another resource rich country, the difference becomes evident. Norway has one of the highest tax effort score in the world. The contrast between the two types of economies reflects the intertemporal fiscal policy choices. While Kuwait uses revenues obtained from natural resources for current expenditures, Norway saves natural resource revenues for future generations and finance current expenditures with domestic taxes.
96. Kyrgyz Republic
Tax Administration Tax revenue for the cost of collection is as of 2016.
97. Laos Tax Administration Data on the size of tax staff are as of 2011. Tax revenue for cost of the collection is as of 2014/2015.
98. Latvia Tax Administration Data for calculation the cost of collection is as of 2015. Number of taxpayers is as of 2016.
99. Lebanon No notes
100. Lesotho Tax Performance

INTRODUCTION 26
26
Lesotho’s tax capacity level averages just around 43 percent between 2008 and 2012—a high score for a low or lower middle income country. While it is a poor country, Lesotho's high score is the result of its integration with the South African economy. Its tax capacity levels are close to South Africa. Most of its tax revenues are collected by South Africa. As a result, it also has a very high tax effort. South Africa's tax effort is about half of Lesotho's tax efforts because of collection efforts.
101. Liberia Tax Performance Liberia’s tax capacity estimates are low at 34 on average. Even so, its tax effort estimates are relatively high compared to its peers. Tax Administration Data for calculation the cost of collection are for FY 2016/2017 and both values are in U.S. dollars.
102. Libya Tax Performance Note that Libya has tax policies related to its natural resources that are viewed by experts to be an outlier. For this reason, estimates on tax performance variables should be viewed with caution (See footnote on pg. 4 of Le et al (2012)). Libya scores a very low tax effort of ten percent on average. The country relies solely on oil revenues in financing current expenditures. The revenue sources are concentrated on oil royalties and resource rent taxes. Libya has no or very few domestic taxes with low revenue yield. Income and consumption taxes do not exist. When compared with non-resource dependent peers, Libya raises a significantly small amount of tax revenues. When contrasted with Norway, another resource rich country, the difference becomes evident. Norway has one of the highest tax effort score in the world. The contrast between the two types of economies reflects the intertemporal fiscal policy choices. While Libya uses revenues obtained from natural resources for current expenditures, Norway saves natural resource revenues for future generations and finance current expenditures with domestic taxes.
103. Liechtenstein Tax Administration The tax revenue for cost of collection is as of 2015 and the tax expenditure is as of 2014. Both values are reported in Swiss Francs.
104. Lithuania Tax Administration The tax revenue for cost of collection is a projection for 2017 (denominator) and tax expenditure is as of 2015 (numerator).
105. Luxembourg Tax Performance VAT GCR exceed 100 in 2011-2014. Luxembourg’s VAT is viewed to be fairly efficient. Regardless, these high levels should be taken with caution and may be due to data quality issues.
106. Macau Tax Performance ICTD data for Tax/GDP, CIT/GDP, PIT/GDP, and VAT/GDP are used in lieu of WoRLD/GFS.

INTRODUCTION 27
27
There are several years between 2000 and 2005 when Macau had negative PIT or CIT buoyancy estimates. This was a period of major political transition in the country as Macau was transitioned from being a Portuguese protectorate to being a special administrative region of China. Macau also has an unusual tax structure. The PIT and CIT rates for Macau are low or negative across tax types. Due to the types of taxes levied, some individuals are taxed under the CIT regime, while others are taxed under the PIT regime. Rates are extremely low in general.
107. Macedonia
Tax Performance ICTD data for Tax/GDP, CIT/GDP, PIT/GDP, and VAT/GDP are used in lieu of WoRLD/GFS. Macedonia has a flat 10% tax on personal income, and collection has stagnated for much of the last 10 years as a portion of GDP. There were falls in 2001 falls in PIT/GDP.
108. Madagascar Tax Performance Madagascar had negative estimates for PIT buoyancy from 2004-07. This corresponds with a political crisis in 2002, which contributed to a collapse in tax revenue performance especially for the PIT. In the years following, the country undertook a series of adjustments in tax policy including temporary exemption of capital goods from import taxes from September 2003–August 2005 among others. Madagascar also had slightly negative estimates for VAT buoyancy in 2012-13. A 2015 IMF report notes that VAT underperformance in Madagascar appears to be related to issues in the refund of VAT credits and compliance gaps. Low performance by Madagascar on VAT Efficiency, c-Efficiency, and GCR also corresponds with an increase of the VAT rate and VAT threshold.
109. Malawi Tax Administration Data for calculation the cost of collection are for FY 2016/2017.
110. Malaysia Tax Administration Data used to calculate cost of collection are as of 2016. Number of taxpayers is as of 2013.
111. Maldives Tax Administration Number of taxpayers is as of 2015.
112. Mali No notes
113. Malta Tax Administration Tax revenue data used to calculation cost of collection are for 2015.
114. Marshall Islands Tax Performance No data are available for CIT, but CIT is applied only on local companies. Tax Administration Tax revenue data used to calculation cost of collection are as of 2010.

INTRODUCTION 28
28
115. Mauritania
Tax Performance ICTD data for Tax/GDP, CIT/GDP, PIT/GDP, and VAT/GDP are used in lieu of WoRLD/GFS. Tax Administration All data used to calculate tax administration characteristics are as of 2013.
116. Mauritius Tax Administration Data used for calculation the cost of collection and the number of taxpayers per tax staff are as of 2015.
117. Mexico No notes
118. Micronesia, Fed. Sts. Tax Performance The sign of tax buoyancy is expected to be positive between the tax revenue and GDP. The negative tax buoyancy of 2.37 in 2014 implies that there is a negative correlation between tax revenues and the GDP. This is possible for resource rich countries because tax revenues depend on world prices rather the performance of the domestic economy. Indeed, the list of countries includes mostly resource-based countries. In resource rich countries royalties, resource rent taxes and special payments such as government's dividend payments constitute a significant portion of government revenues. Micronesia's tax revenues primarily depend on fishing licensing and phosphate. Even though GDP growth rate was negative in 2014, tax revenues were higher in Micronesia. Tax Administration Tax revenue data used to calculation cost of collection are estimates for 2013.
119. Moldova Tax Administration Tax revenue data used to calculation cost of collection are for 2016. The number of taxpayers is as of 2014.
120. Mongolia Tax Performance Mongolia a resource-based economy where the copper, coal and molybdenum mining is significant. In 2013, the large increase in VAT revenues relative to GDP growth is due to an increase in threshold and the elimination of some VAT exemptions in the mining industry. 2013 VAT buoyancy is high. High VAT efficiency and C-efficiency values in 2011-2013 are an anomaly as VAT collection is considered inefficient in Mongolia, hence the new VAT law that went into effect in January 1, 2016. Tax Administration Tax expenditure used to calculate the cost of collection is as of 2011 and tax revenue is an estimation for 2017. Staff figures are as of 2013.

INTRODUCTION 29
29
121. Montenegro Tax Performance ICTD data for Tax/GDP, CIT/GDP, PIT/GDP, and VAT/GDP are used in lieu of WoRLD/GFS. Tax Administration Has an LTU but only cover audit function, not other taxpayer services, so not a full-fledged LTU. Number of staff is as of 2014.
122. Morocco Tax Administration Data used for calculation the cost of collection is as of 2015.
123. Mozambique Tax Administration The number of taxpayers is as of 2015.
124. Myanmar Tax Performance Myanmar although not a natural resource producer scores a very low tax effort. The economy consists of subsistence level agriculture, rice production and opium. The tax base that can be used for DRM is limited. Furthermore, Myanmar is undergoing through major economic reforms that will improve the domestic revenue sources. Myanmar’s tax capacity ratio—just around 30 percent—is one of the lowest even for low and lower middle income countries. A fledgling economy which is bolstering its administrative and policy capacity and opening its economy, Myanmar’s tax effort is similarly also on the lower end Tax Administration Tax expenditure for the cost of collection and the data on tax staff used for calculating the number of taxpayers per tax staff are as of 2011.
125. Namibia Tax Performance Namibia scored a tax effort of about 68 percent on average. Namibia's tax system is similar to New Zealand's and Australia's tax system which are considered as good examples of a modern tax system. The main sources of tax revenue are VAT and income taxes. In addition, Namibia efficiently taxes mining companies. Tax Administration The revenue authority is organized along functional lines but does not currently have all functions operational.
126. Nauru
Tax Performance The country does not have a PIT regime. The country only has a flat employment tax on high-income earners.
127. Nepal
Tax Performance Insufficient data on personal income taxes was available. Estimated tax buoyancies have been negative for 2015 and 2016. Nepal regularly uses discretionary measures to affect tax revenues.

INTRODUCTION 30
30
Tax Administration Tax revenue data used for calculation the cost of collection is as of 2016.
128. Netherlands Tax Administration Data used for calculation the cost of collection is as of 2015. Tax Performance Personal income tax was significantly reduced in 2005 and 2006 (e.g. the top rate was reduced by 6½ percentage points in 2005 and by 6 percentage points in 2006).
129. New Caledonia No notes
130. New Zealand Tax Performance New Zealand scored a high tax effort of about 78 percent on average, which is expected. New Zealand has one of the most efficient tax system in the world after major tax reforms at the end of 1980s. New Zealand effectively utilizes its domestic tax resources. It has a well-functioning tax system and an efficient tax administration that guarantees high compliance. The main sources of revenues are VAT and income taxes.
131. Nicaragua Tax Performance Nicaragua had relatively strong VAT buoyancy from 1999-2002. This follows a VAT reform in the country that reduced exemptions to VAT. Tax Administration Data used for calculation the cost of collection is as of 2016.
132. Niger No notes
133. Nigeria Tax Performance Note that Nigeria has tax policies related to its natural resources that are viewed by experts to be an outlier. For this reason, estimates on tax performance variables, especially tax capacity and tax buoyancy, should be viewed with caution (See footnote on pg. 4 of Le et al (2012)). Nigeria’s low VAT efficiencies from 2003-13 are partly due to substantial exemptions as well as compliance issues, as noted in a recent IMF report (CR1585). Tax Administration Tax revenue used for calculation the cost of collection is as of 2015.
134. Norway Tax Performance Norway scored a tax effort of 76 percent on average. While Norway has a highly efficient dual income tax system similar to other Scandinavian countries, it also is one of the largest oil producers in the world. However, oil revenues are used to fund expenditures of future
INTRODUCTION 31
31
generations. Negative CIT buoyancy in 2014 likely reflects the decrease in rates.
135. Oman Tax Performance Oman although not a big oil producer scores a very low tax effort, because it primarily relies on revenues from oil, fishing rights and trade in financing current expenditures. The existing few domestic taxes have low rates and revenue yield. When compared with its non-resource dependent peers Oman raises a significantly small amount of tax revenues. Tax Administration LTU covers audit only, not other functions (collection, enforcement, etc.) Country does not have a PIT regime.
136. Pakistan Tax Performance In 2007-13, Pakistan has high outlier observations for PIT buoyancy, which was at a time of strong tax policy and administration measures according to the 2008 IMF Country Report No. 08/364. Highest PIT buoyancy estimate of 7.59 was in 2010. Personal tax rates varied from 5 percent to 30 percent in Pakistan until 2007. In 2007 top PIT rate was reduced to 20 percent. This occurred at a time of when the economy was slowing. Tax Administration Tax revenue used for calculation the cost of collection is for FY 2015/16.
137. Palau Tax Performance ICTD data for Tax/GDP, CIT/GDP, PIT/GDP, and VAT/GDP are used in lieu of WoRLD/GFS. Tax Administration Tax revenue data used for the cost of collection are as of 2014 and is reported in U.S. dollars. Country does not have a CIT regime.
138. Panama Tax Performance Panama shows a high VAT buoyancy for 2008-14; CIT buoyancy was also relatively strong over that period. There are no major legislative changes to VAT in Panama. However, while the standard VAT rate is 7 percent, hotels are taxed at 10 percent. The high VAT buoyancy may be attributed to the recovery of the tourism industry after 2009. In 2014, the economy achieved its highest revenues from the tourism. VAT buoyancy is also high for years 2010-2013. Tourism revenues started to increase since 2010 gradually. This is also consistent with estimated VAT buoyancies estimated for the period 2010-2013. The period of high VAT buoyancy follows a period of low or negative VAT buoyancy from 2000-03. Tax Administration Tax revenue data used for the cost of collection are as of 2016 and is reported in U.S. dollars.
139. Papua New Guinea Tax Administration Data used for the cost of collection is the budgeted amount for 2018 and the size of tax staff

INTRODUCTION 32
32
used to calculate taxpayers per tax staff is as of 2013.
140. Paraguay Tax Performance Paraguay scores a tax capacity of about 35 percent on average —one of the lowest for a high or upper middle income countries. Paraguay benefits a lot from its free-trade country status. At the same time, it is a low tax country and manages its public policy at the current levels of tax to GDP ratio. As a result, the tax effort remains at a low level of 36 percent on average, while it has a potential to mobilize its domestic revenue sources. The Government introduced the PIT in 2012, yielding substantial growth in early years.
141. Peru Tax Administration Size of tax staff used to calculate taxpayers per tax staff is an estimate for 2015.
142. Philippines Tax Administration The data on the number of taxpayers used to calculate taxpayers per tax staff based on registered taxpayers in 2015. The data on tax staff are as of 2013. Tax revenue data used to calculate the cost of collection are for 2016.
143. Poland Tax Performance Poland was in the process of accession to the European Union (E.U.) until 2004. Between 1998 and 2004 Poland was modifying its VAT law in order to harmonize with the E.U. VAT base was significantly expanded in 1999 by repealing the VAT exemption of agriculture which increased the total VAT revenues. However, Poland was also experiencing a declining trend in GDP growth. CIT buoyancy was negative in 1999, which had an enduring effect on the buoyancy through to 2005, and negative for PIT in 2001-06.
144. Portugal No notes
145. Qatar Tax Performance Qatar scores a very low tax effort of eight percent on average, because it relies solely on oil revenues in financing current expenditures. The revenue sources are concentrated on oil royalties and resource rent taxes. As a result, there are no or very few domestic taxes with low revenue yield. Income and consumption taxes do not exist. Thus, when compared with non-resource dependent peers, Qatar raises a significantly small amount of tax revenues. When contrasted with Norway, another resource rich country, the difference becomes evident. Norway has one of the highest tax effort score in the world. The contrast between the two types of economies reflects the intertemporal fiscal policy choices. While Qatar uses revenues obtained from natural resources for current expenditures, Norway saves natural resource revenues for future generations and finance current expenditures with domestic taxes. Tax Administration Country does not have a PIT regime, and the CIT regime is limited. No data are available for CIT, but CIT is only applied on wholly or partially foreign-owned companies, not wholly owned.

INTRODUCTION 33
33
146. Romania Tax Administration The Customs department is called “general directorate of tax and customs” and is under the Tax Administration.
147. Russian Federation Tax Performance Russia scores a tax effort of 79 percent on average. Russia has reformed its tax system after 2000. It has a flat PIT system and relatively low CIT. It has a well-functioning VAT system. Russia also has effective taxes on its natural resources industries. Russia had very high estimates of CIT and PIT buoyancy from 2000-06. This corresponds with the enactment of a modern tax code for the country, which was phased in from 1998 to 2003. Prior to the enactment of this code taxation in the country, particularly for PIT and CIT, were largely decentralized and collection was very weak. Tax Administration Data on tax revenue collected used to calculate cost of collections are for 2016.
148. Rwanda Tax Performance Estimated tax buoyancy was 2.06 in 2003. The tax buoyancy later returned to expected levels. The high tax buoyancy for Rwanda reflects the tax reforms undertaken between 2001 and 2003. Rwanda had an IMF program between 2001 and 2003. In 2001 VAT was introduced and its revenue effects started to show in 2002 and 2003. In addition, a new income tax code was introduced beginning in 2002. Prior to the IMF program two-thirds of the government revenues were grants. Grants were reduced as domestic revenue sources were increased. Rwanda also increased customs revenues during this period. The large VAT buoyancy of 2.47 estimated in 2013 is due to strong imports and improvements in tax administration such as electronic filing and inclusion of public entities in the VAT system. The VAT buoyancy was also high in 2014. Tax Administration Data on tax revenue collected and expenditures on the tax administration are budgeted figures for FY 2016/17.
149. Samoa Tax Performance Samoa had small, negative and not statistically significant outliers on tax buoyancy in 1999-00, which corresponds with the Asian financial crisis. The country also had small, negative and not statistically significant outliers on VAT buoyancy in 2011-15. ICTD data for Tax/GDP, CIT/GDP, PIT/GDP, and VAT/GDP are used in lieu of WoRLD/GFS.
150. San Marino Tax Administration Data on tax revenue collected are for 2016. Italy handles customs issues for San Marino through their offices.
151. São Tomé and Principe

INTRODUCTION 34
34
No notes
152. Saudi Arabia Tax Performance The sign of tax buoyancy is expected to be positive between the tax revenue and GDP. The negative tax buoyancy of 1.27 in 2003 implies that there is a negative correlation between tax revenues and the GDP. This is possible for resource rich countries because tax revenues depend on world prices rather the performance of the domestic economy. Indeed, the list of countries includes mostly resource-based countries. In resource rich countries royalties, resource rent taxes and special payments such as government's dividend payments constitute a significant portion of government revenues. Budget revenues of Saudi Arabia relies exclusively on oil. Revenues from oil account 92.5 percent of government revenues. There are no taxes in Saudi Arabia other than a tax on foreign corporations. Note that Saudi Arabia has tax policies related to its natural resources that are viewed by experts to be an outlier. For this reason, estimates on tax performance variables should be viewed with caution (See footnote on pg. 4 of Le et al (2012)). No data are available for CIT; only non-Saudi investors are liable for CIT in Saudi Arabia. Country does not have a PIT regime; non-resident individuals are taxed under the corporate tax regime (http://taxsummaries.pwc.com/ID/Saudi-Arabia-Corporate-Taxes-on-corporate-income). Saudi Arabia scores a very low tax effort of 3.5 percent on average. Because it relies solely on oil revenues in financing current expenditures. The revenue sources are concentrated on oil royalties and resource rent taxes. So, there are no or very few domestic taxes with low revenue yield. Income and consumption taxes do not exist. When compared with non-resource dependent peers Saudi Arabia raises a significantly small amount of tax revenues. When contrasted with Norway, another resource rich country, the difference becomes evident. Norway has one of the highest tax effort score in the world. The contrast between the two types of economies reflects the intertemporal fiscal policy choices. While Saudi Arabia uses revenues obtained from natural resources for current expenditures, Norway saves natural resource revenues for future generations and finance current expenditures with domestic taxes.
153. Senegal
Tax Administration Data on tax revenue collected are actual figures for 2015.
154. Serbia Tax Performance From 2001 to 2007 the tax buoyancy estimates exceed 3, this appears to be related to the strong performance of PIT in 2001-03, and strong CIT performance in 2004-07. ICTD data for Tax/GDP, CIT/GDP, PIT/GDP, and VAT/GDP are used in lieu of WoRLD/GFS. Tax Administration Data on tax revenue collected are for 2012.
155. Seychelles Tax Administration The number of tax staff used to calculate taxpayers per tax staff and tax revenue for cost of collection are based on 2013 data. Tax Performance

INTRODUCTION 35
35
2006-2011 saw very high PIT buoyancies, this reflected the PIT actually being introduced during the period, replacing a social security tax.
156. Sierra Leone Tax Administration The estimate of tax revenue for cost of collection is for 2017.
157. Singapore Tax Performance Singapore scores a tax capacity of over 53 percent—one of the highest in the world. As one of the high per capita income countries, Singapore has high potential revenue. But it is also a free trade port and a low tax country. As a result, the tax effort remains at 26 percent of its potential domestic revenue sources. Tax Administration The data on number of active taxpayers used to calculate taxpayers per tax staff is based on 2016 figures. Functional organization is a hybrid of types.
158. Slovak Republic Tax Performance For the Slovak Republic, estimates for CIT buoyancy are moderately large and negative from 2000-05 (statistically significant only 2000-03); PIT buoyancy is small, negative, and not statistically significant from 2005-06. This period was marked by a significant series of macroeconomic reform after a new government assumed office in October 1998. The Slovak Republic enacted a major tax reform in 2003 that abolished most PIT deductions and imposed a flat rate of 19% instead of a progressive rate from 10% to 38%. CIT rates fell from 25% to 19%. Two VAT rates of 14% and 20% were merged into one band of 19%. Tax Administration Tax revenue to calculate the cost of collection is for 2015 and tax expenditure for cost of collection is from 2011.
159. Slovenia No notes
160. Solomon Islands Tax Administration Tax revenue for cost of collection is as of 2016.
161. Somalia Tax Performance All tax performance variables are listed as n/a. Due to on-going civil unrest in Somalia, the Tax Law is not fully-operational and enforceable. ICTD data for Tax/GDP, CIT/GDP, PIT/GDP, and VAT/GDP are used in lieu of WoRLD/GFS. Tax Administration Tax revenue for cost of collection is projected for 2017 and is reported in U.S. dollars.

INTRODUCTION 36
36
162. South Africa No notes
163. South Sudan Tax Administration Tax revenue for cost of collection is projected for 2018.
164. Spain Tax Administration Tax revenue for cost of collection is projected for 2017.
165. Sri Lanka Tax Performance Sri Lanka has enduring negative buoyancies for a number of years potentially as a result of substantial exemptions.
166. St. Kitts and Nevis St. Kitts and Nevis has low, negative CIT buoyancies in several years. The country is a so-called “low tax jurisdiction” and its CIT has numerous exemptions to promote investment. This may contribute to an unusual relationship between CIT and GDP. Tax Administration Tax revenue for cost of collection is projected for 2017.
167. St. Lucia Tax Administration Data for cost of collection and staff figures are for FY 2015/2016.
168. St. Vincent and the Grenadines Tax Administration Tax revenue for cost of collection was estimated by using taxes collected = revenue – sales of goods and services & taxes on international trade (customs).
169. Sudan No notes
170. Suriname Tax Performance Tax buoyancy was very high from 2000-03, and above 1 from 2000 - 2008. Suriname has a resource-based economy, producing bauxite, aluminum oxide and gold. Corporate sector is dominated by mining companies. Lump sum investments and concessionary contracts result in high corporate tax revenues in some years. CIT buoyancy remained high between 2006 and 2012. Tax Administration Tax revenue for cost of collection is for 2016.

INTRODUCTION 37
37
171. Swaziland No notes
172. Sweden Tax Performance Sweden scored a tax effort of 76 percent on average. Sweden has a highly efficient dual income tax system which taxes capital incomes at lower rate while maintaining a highly progressive tax system on labor income. The main sources of revenues are VAT and income taxes.
173. Switzerland
Tax Administration Tax expenditure for cost of collection and staff figures are as of 2015.
174. Syrian Arab Republic No notes
175. Taiwan, Rep. of China No notes
176. Tajikistan Tax Administration Data used for tax expenditure in the cost of collection and information on the size of the tax staff are as of 2011.
177. Tanzania Tax Performance Tax buoyancy was estimated to be negative between 1999 and 2004. Tanzania undertook major administrative and policy reforms in order to improve tax revenues in 2003 and 2004. Administrative measures included expansion of the large taxpayers’ unit and increased audit activity. Furthermore, customs administration introduced a modern processing system that resulted in higher tariff revenues. Policy measures included increase in VAT threshold and limitations on exemption of profits from taxation and investments. Tax Administration Tax revenue for cost of collection is from FY2016/2017.
178. Thailand Tax Administration Data used for tax expenditure in the cost of collection and information on the size of the tax staff are as of 2011.
179. Timor-Leste Tax Administration The value for tax revenue used to calculate the cost of collection is the budgeted amount for 2017 and is reported in U.S. dollars.
180. Togo Tax Performance Tax buoyancy was relatively strong 2005-09, but was above 1 for every year in the series the exception of 2012. CIT buoyancy was negative, however from 2010 to 2014. This appears to

INTRODUCTION 38
38
have been offset by strong performance on PIT and VAT, leading to an overall positive tax buoyancy for those years.
181. Tonga Tax Performance Tonga has a tax capacity score over 36 percent on average—one of the lowest for a high or upper middle income countries. Its economy depends heavily on remittances and subsistence farming. So, even though it may have a relatively high income which supports a high tax potential of over 36 percent, the tax effort remains at 51 percent. Substantial falls in trade taxes in 2011-15 drove a negative tax buoyancy. Tax Administration The data used for cost of collection are projections for FY 2018/2019.
182. Trinidad and Tobago Tax Administration Data for cost of collection is reported in U.S. dollars.
183. Tunisia Tax Administration The tax revenue data for cost of collection is for 2016. E-file and e-payment are mostly for large taxpayers.
184. Turkey Tax Administration Staff figures are as of 2011.
185. Turkmenistan No notes
186. Tuvalu Tax Administration The data used for cost of collection are estimates for 2018.
187. Uganda No notes
188. Ukraine Tax Administration Staff figures are as of 2011. The function is hybrid though by tax type. SFS is a semi-autonomous body under which the tax administration falls.
189. United Arab Emirates Tax Performance Note that UAE has tax policies related to its natural resources that are viewed by experts to be an outlier. For this reason, estimates on tax performance variables should be viewed with caution (See footnote on pg. 4 of Le et al (2012)). Country does not have a PIT regime.

INTRODUCTION 39
39
Tax Administration The tax revenue data for cost of collection is for 2016.
190. United Kingdom Tax Administration Functional Organization is a hybrid between tax-type with department such as personal tax, business tax etc. and function based with functions such as human resources, finance, etc.
191. United States No notes
192. Uruguay Tax Administration The value for tax revenue and expenditure used to calculate the cost of collection is for 2015. The number of active taxpayers is from 2013. Tax Performance The new PIT was introduced in 2007, leading to significant buoyancies in the aftermath.
193. Uzbekistan No notes
194. Vanuatu Tax Performance Country does not have a PIT regime, and the CIT regime is limited. Vanuatu has a business license tax, but does not have taxes on profits, dividends or income; there is no capital gains tax, and no withholding tax. Tax Administration The value for tax revenue used to calculate the cost of collection is the budgeted value for 2018, not actuals.
195. Venezuela Tax Performance Note that Venezuela has tax policies related to its natural resources that are viewed by experts to be an outlier. For this reason, estimates on tax performance variables should be viewed with caution (See footnote on pg. 4 of Le et al (2012)). Tax Administration The value for tax revenue used to calculate the cost of collection is for 2016.
196. Vietnam
Tax Performance The highest PIT buoyancy was estimated at 3.81 in 1999. The top PIT rate was 50 percent and it was increased to 60 percent in 2000. It was then reduced to 40 percent in 2005 and to 35 percent in 2009. The high progressivity of the PIT rate structure is contributing to the PIT buoyancy estimates.
197. West Bank and Gaza
Tax Performance

INTRODUCTION 40
40
ICTD data for Tax/GDP, CIT/GDP, PIT/GDP, and VAT/GDP are used in lieu of WoRLD/GFS.
198. Yemen
Tax Performance Yemen has several high buoyancy outliers in the database, particularly for PIT. The country implemented tax policy and administration measures that increased its tax revenues. These measures were in response to a sharp decline in oil revenues. Yemen introduced a general sales tax (similar to VAT) and eliminated many exemptions granted to imported goods. These measures increased the tax to GDP ratios resulting in high tax buoyancy estimates without any significant change in growth rates. There are also a few low outliers for CIT buoyancy during 2006-12 due to tax and administration reforms which resulted in the elimination of production taxes in 2005-06 and in much higher CIT revenues during a period of economic contraction. Tax buoyancy estimates are not significant throughout the series.
199. Zambia
No notes
200. Zimbabwe Tax Performance ICTD data for Tax/GDP, CIT/GDP, PIT/GDP, and VAT/GDP are used in lieu of WoRLD/GFS. Tax Administration The value for tax revenue used to calculate the cost of collection is projected for 2018 (denominator), and the value for tax expenditure is from 2016 (numerator).