LOWER SNAKE RIVER COMPENSATION PLAN Oregon … · Effort was estimated at 2,401 angler hours for...
29
LOWER SNAKE RIVER COMPENSATION PLAN Oregon Spring Chinook Salmon Harvest Monitoring 2016 Annual Progress Report Oregon Department of Fish and Wildlife Grande Ronde Watershed, East Region Kyle W. Bratcher Jeffrey A. Yanke Timothy D. Bailey
Transcript of LOWER SNAKE RIVER COMPENSATION PLAN Oregon … · Effort was estimated at 2,401 angler hours for...

LOWER SNAKE RIVER COMPENSATION PLAN Oregon Spring Chinook Salmon Harvest Monitoring
2016 Annual Progress Report
Oregon Department of Fish and Wildlife Grande Ronde Watershed, East Region
Kyle W. Bratcher Jeffrey A. Yanke
Timothy D. Bailey

This program receives federal funding assistance from the U.S. Fish and Wildlife Service and prohibits discrimination on the basis of race, color, national origin, age, sex, or disability. If you believe that you have been discriminated against as described in any program, activity, or facility, or if you desire further information, please contact ADA coordinator, Oregon Department of Fish and Wildlife, 4034 Fairview Industrial Drive SE, Salem, OR 97302, 503-947-6000, or write Office for Human Resources, U.S. Fish and Wildlife Service, Department of the Interior, Washington, D.C. 20240. This report is available at: http://www.fws.gov/lsnakecomplan/Reports/ODFWreports.html Front cover photo: Successful Imnaha River anglers. Photo credit Jeff Yanke.
ANNUAL PROGESS REPORT
FISHERIES RESEARCH PROJECT OREGON
PROJECT TITLE: Lower Snake River Compensation Plan: Oregon Spring Chinook Harvest Monitoring
CONTRACT NUMBER: F16AC00030
PROJECT PERIOD: January 1, 2016 through December 31, 2016
PREPARED BY: Kyle W. Bratcher Jeffrey A. Yanke Timothy D. Bailey
January 2017
Oregon Department of Fish and Wildlife 4034 Fairview Industrial Drive SE
Salem, OR 97302
This project was financed by the U.S. Fish and Wildlife Service under the Lower Snake River Compensation Plan

i
CONTENTS
Page CONTENTS ……………………………………………………………………………………………………………………………………………. i LIST OF TABLES …………………………………………………………………………………………………………………………………….. ii LIST OF FIGURES …………………………………………………………………………………………………………………………………... iii LIST OF APPENDIX TABLES …………………………………………………………………………………………………………………….. iv EXECUTIVE SUMMARY..………………………………………………………………………………………………………………………… 1 Objectives ………………………………………………………………………………………………………………………………… 1 Accomplishments and Findings ………………………………………………………………………………………………… 1 INTRODUCTION …………………………………………………………………………………………………………………………………….. 2 METHODS ……………………………………………………………………………………………………………………………………………… 3 RESULTS AND DISCUSSION ……………………………………………………………………………………………………………………. 7 REFERENCES …………………………………………………………………………………………………………………………………………. 10 APPENDICES …………………………………………………………………………………………………………………………………………. 11

ii
LIST OF TABLES
Table Page
1. List of the natural fish populations, “Viable Salmonid Population” thresholds, and associated hatchery stocks in the Imnaha and Grande Ronde River Basins ……………………………….. 11
2. Total collective natural-origin adult harvest/impact rates relative to critical and
minimum abundance threshold (MAT) levels described in Table 1 ……………………………………………. 12
3. Natural-origin adult harvest/impact rates based on existing co-manager agreements, including collective natural-origin mortality rates as described in Table 2 …………………………………. 13
4. Return estimates of spring Chinook salmon to the Imnaha and Grande Ronde Basins in 2016…… 14
5. Estimates of effort, catch, and harvest during the 2016 Lookingglass Creek (28 May to 31 May), Wallowa (2 Jul to 17 Jul), and Imnaha rivers (15 Jun to 3 Jul) fisheries. Ninety-five percent (95%) confidence limits are indicated in parentheses.………………………………….………..……………….…………... 15

iii
LIST OF FIGURES
Figure Page
1. The Lookingglass Creek fishery management area (RM 0 to 2) showing area open to fishing and the location of the access point survey (creel check station) near the confluence with the Grande Ronde River at Palmer Junction, OR ………………………………………………. 16
2. The Wallowa River fishery management area (RM 8 to 25) showing area open
to fishing and creel survey reaches near Wallowa, OR ..………………………………………………………….…. 17
3. The Imnaha River fishery management area (RM 0 to 48) showing descriptions of surveyed reaches (lower RM 5-13, upper RM 20-48), the unsurveyed Box Canyon reach (RM 13-20), major tributaries, and the location of the adult weir and juvenile release facility upstream of the fishery area …………………………………………………………………..…......... 18
iv
LIST OF APPENDIX TABLES
APPENDIX TABLE Page
1. Lookingglass Creek spring Chinook sport fisheries adult (age-4 and 5 only) impact for years 2011 through 2016. The 2013 fishery was limited to retention of jacks only ……………… 19
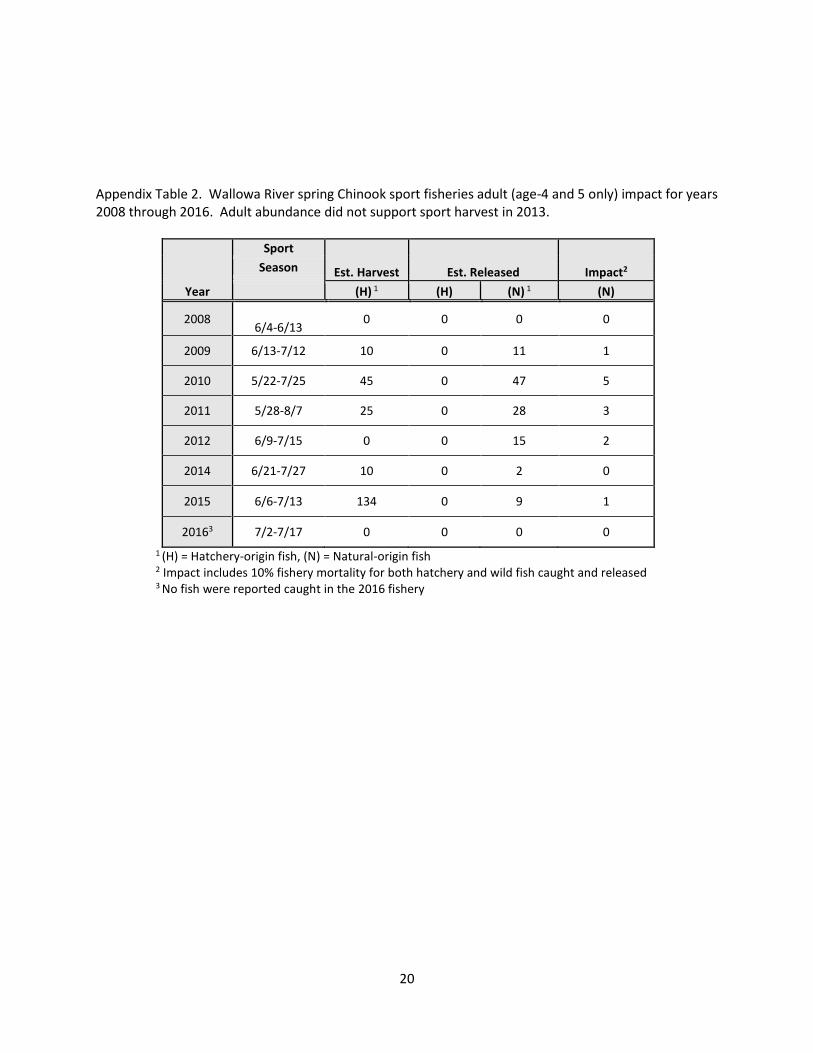
2. Wallowa River spring Chinook sport fisheries adult (age-4 and 5 only) impact for years 2008 through 2016. Adult abundance did not support sport harvest in 2013…………………………………………………………………………………………………………………………………………… 20
3. Imnaha River spring Chinook sport fisheries adult (age-4 and 5 only) impact for
years 2001 through 2016. Adult abundance did not support sport harvest in 2006 and 2007..………………………………………………………………………………………………………………………….. 21
4. Grande Ronde River spring Chinook sport fisheries adult (age-4 and 5 only) impact for years 2014 and 2015. There was no fishery in 2016……………………………………………………………………. 22

1
EXECUTIVE SUMMARY
Objectives
1. Estimate the number of spring/summer Chinook salmon handled or harvested annually, and angler effort, in recreational fisheries in the Imnaha and Grande Ronde basins.
Accomplishments and Findings
The 2016 run year of spring/summer Chinook salmon to Oregon Snake basin tributaries provided recreational (sport) harvest opportunity on Lookingglass Creek, the Wallowa and Imnaha rivers. In recent years the Grande Ronde River was open to spring chinook angling however, due to limited harvest allotments, managers declined to open this fishery in 2016. Daily bag limits for all fisheries were two adipose fin-clipped chinook adults and five adipose fin-clipped jacks per day, with two daily limits in possession. Anglers were required to cease angling if they had retained a daily limit of marked adults.
Lookingglass Creek − The sport fishery on Lookingglass Creek opened 28 May and closed 31 May (4 days). The area open to anglers extended from the mouth at the Moses Creek Lane Bridge upstream to the confluence of Jarboe Creek (RM 2). Angling was restricted to the use of artificial flies and lures to minimize impacts to bull trout. During 4 days of creel surveys, 95 anglers were contacted that had fished a total of 288 hours. Anglers reported an average catch of one adult Chinook for every 9 hours of fishing and one jack for every 144 hours of fishing. Total angler effort was estimated at 854 angler hours for the Lookingglass Creek fishery. Estimates provided from creel surveys indicated that the Lookingglass fishery accessed 66.7% (2 of 3) of allowed natural-origin (N-O) impacts. Total recreational fishery impact resulting from handling and harvest was estimated at 80.0% (44 of 55) of the allowed limit for hatchery-origin (H-O) adults. In addition, we estimated that four H-O jacks were harvested.
Wallowa River − The Wallowa River sport fishery was open from 2 Jul to 17 Jul (16 days) in 2016. The open area extended from Minam State Park (RM 8) upstream to the mouth of the Lostine River (RM 25). During 10 days of creel surveys, we contacted 43 anglers who had fished 82 hours. Effort was estimated at 544 angler hours. No chinook were reported caught during this fishery. Therefore, we estimated that the fishery did not access any allowed H-O harvest nor N-O impacts. Imnaha River − The Imnaha River fishery opened 15 Jun and closed 3 Jul (19 days). The open area extended from the confluence with the Snake River to Summit Creek Bridge (RM 45). During 12 days of creel surveys, we contacted 135 anglers who had fished a total of 1,001 hours. Anglers reported an average catch of one adult Chinook caught for every 17 hours of fishing, and one jack salmon caught for every 362 hours of fishing. Effort was estimated at 2,401 angler hours for the entire Imnaha River fishery. Estimates provided from creel surveys indicated that the fishery accessed 33.33% (3 of 9) of the allowed N-O adult impacts. Total recreational fishery harvest was estimated at 75.3% (113 of 150) of allowed H-O adults; in addition to 11 H-O jacks.
2
INTRODUCTION
The Imnaha and Grande Ronde River spring Chinook hatchery programs are components of the Lower Snake River Compensation Plan (LSRCP), funded through the U.S. Fish and Wildlife Service (USFWS), developed to mitigate for wild fish production lost as a result of construction of the four lower Snake River dams. Hatchery Chinook and steelhead smolts in the Snake River basin are produced at LSRCP hatcheries in Washington, Idaho and Oregon. Subsequent adult returns are meant to provide tribal and recreational (sport) fisheries and, in some cases, enhance natural spawner numbers. The Oregon Department of Fish and Wildlife (ODFW) initiated the Imnaha and Grande Ronde spring Chinook hatchery program in 1982 under the LSRCP. Subsequent program management has been coordinated between ODFW, the Confederated Tribes of the Umatilla Indian Reservation (CTUIR), and the Nez Perce Tribe (NPT).
The Imnaha and Grande Ronde River hatchery programs are comprised of five components, each with smolt acclimation and adult collection facilities located on the Imnaha River, upper Grande Ronde River, Lookingglass and Catherine Creeks, and the Lostine River. The Lostine River program interacts with natural production within the broader Wallowa-Lostine population unit. Other hatchery program components are discrete to specific populations indicated. The Lookingglass Creek portion of the program focuses on reintroduction of spring Chinook to that stream and targets the release of 250,000 smolts, annually. Each of the four remaining program components integrates natural-origin fish returning to each respective tributary into production. Smolt release goals, developed to meet LSRCP mitigation responsibilities; include 490,000 for the Imnaha, 250,000 for the Lostine and upper Grande Ronde rivers, and 150,000 for Catherine Creek.
Fisheries that target returns to the Imnaha and Grande Ronde hatchery programs are guided by Fishery Management and Evaluation Plans (FMEP), approved by NOAA fisheries under limit 4 of the final 4(d) rule of the Endangered Species Act (ODFW 2011, ODFW and WDFW 2012). The objective of the FMEP is to provide recreational fishing opportunities and related benefits derived from harvest of Imnaha and Grande Ronde basin hatchery-origin spring Chinook salmon in Oregon and Washington in a manner that supports the continued survival and future recovery of natural-origin Chinook salmon. Each respective FMEP utilizes a management framework for harvest of adipose-clipped, hatchery-origin Snake River spring/summer Chinook salmon using abundance-based sliding scales to set annual fishery impacts. Fisheries are prescribed maximum impact rates for both direct and incidental mortality of natural-origin adult salmon in sport and tribal fisheries. Impacts are assessed for each population in relation to critical and minimum abundance thresholds (MAT) as described by the Interior Columbia Technical Recovery Team (ICTRT 2007). Population designations for the Imnaha and Grande Ronde Basins are listed in Table 1, and are based upon an analysis of Chinook salmon life history traits, distribution, abundance, and productivity, and geographical and ecological characteristics of the landscape within the Snake River Spring/Summer Chinook Salmon ESU (McElhany et al. 2000). The abundance-based harvest rate schedule for Imnaha and Grande Ronde Basin fisheries to be shared by all fishing entities in the basin as described in Table 2. Harvest is not considered when hatchery run size does not exceed the number of adults identified for broodstock and supplementation needs as described by sliding scale management plans set for each population’s hatchery program. Surplus is generally defined as the adult hatchery run projection less hatchery adults needed for broodstock. This approach limits sport harvest during years when wild fish runs are below MAT and hatchery fish runs are of similar size. In addition, near the lower end of the harvest rate scale, fisheries are not implemented until the allowable hatchery fish harvest exceeds 20 fish due to potential to over harvest within a single week.

3
Fishery impacts to listed Snake River spring/summer Chinook salmon are assessed on a collective basis (i.e., the sum of recreational and tribal fisheries) by NOAA fisheries. However, the coordination of impact amongst states and tribes is a key component of executing conservation-based fisheries in the Imnaha and Grande Ronde Basins. Co-managers within each basin have developed, and implement annually, an impact sharing agreement that is described in Table 3. Within each fishery scenario, this agreement provides tribal fisheries more of the natural-origin impacts to reflect the non-selective nature of traditional fishing techniques. Recreational fisheries are provided a larger portion of the hatchery harvest such that all available impacts (hatchery and natural collectively) are shared equally (Table 3). Recreational fisheries administered by the states limit harvest (retention) of spring/summer Chinook hatchery-origin salmon with a clipped adipose fin (as evidenced by a healed scar). All salmon with an intact adipose fin (natural-origin) must be released back to the water. Therefore, incidental mortality impacts occur from catch and release of unclipped Snake River spring/summer Chinook salmon in fisheries targeting adipose-clipped hatchery Chinook salmon, and/or from the illegal retention of unclipped fish. It is generally assumed throughout the Columbia River Basin that the mortality rate resulting from the catch and release of salmon in fisheries is 10%. However, for Lookingglass Creek co-managers, with concurrence from NOAA fisheries, assume a slightly lower rate of 7.5% (ODFW and WDFW 2012). As stated in the FMEP, fisheries are adjusted or terminated when the total ESA take limit identified in Table 2 and 3 has been reached. Therefore, once fisheries are initiated regular monitoring is required to ensure consistency with co-manager agreements and FMEP requirements. The objective of this LSRCP project was to conduct statistical creel surveys to determine spring Chinook and steelhead ESA impact levels, harvest and release rates, and to inform decisions regarding fishery status in the Imnaha and Grande Ronde Basins in 2016. In this report, we describe creel surveys conducted and estimates of angler effort, catch, and harvest. In addition we compare these estimates in relation to estimates of natural and hatchery-origin returns to each population to assess consistency with prescribed impacts under FMEP guidelines.
METHODS
Lookingglass Creek − The Lookingglass Creek fishery was surveyed using an access point design with a check station located at the point of entry/exit to the fishery (Figure 1). One creel clerk staffed the check station during all four days of the fishery. Typically the creel survey is stratified by weekends and weekdays, and survey dates were weighted to sample weekends at a higher rate than weekdays (both weekend days and two randomly-selected weekdays per week). However, due to the short nature of the 2016 fishery, all four days were surveyed and combined into a single strata. An approximate 8-hour shift was applied each day. AM shifts began at 0530 hours before and ended at 1330 hours. PM shifts began at 1330 hours and ended at 2130 hours. Shifts were selected randomly.
All anglers leaving the fishery area during survey shifts were interviewed by the creel clerk. Each interview determined: whether the angler (or anglers) completed fishing for the day, whether they were targeting Chinook salmon, their place of origin, the predominant gear type used, and how many hours the anglers spent actively fishing. Total angler hours for each party were determined by multiplying the number of anglers in the party with the number of hours spent fishing.
Catch information was also determined from interviews and/or visual inspection of harvested fish. Jack and adult salmon were differentiated by length, whereby jacks were considered equal to or less than 61 cm (24 inches) and adults exceeded 61 cm (24 inches). Total catch of adult and jack salmon were

4
determined through angler interviews for each survey day. Adult and jack salmon harvested in the fishery were inspected by the creel clerk, measured for length, and scanned for the presence of a coded wire tag. If a coded wire tag was present, the snout was removed with the angler’s consent. At the end of the season, snouts were forwarded to the ODFW laboratory in Clackamas, OR for tag retrieval.
Wallowa and Imnaha rivers – The Wallowa and Imnaha fisheries were surveyed using a roving survey design that was stratified into two sections on each river. The lower section on the Wallowa River extended from the downstream end of Minam State Park (RM 8) to the confluence with the Minam River (RM 10). The upper section extended from the Minam River upstream to the confluence with the Lostine River (RM 25, Figure 3).
For the Imnaha River, the lower survey section extended from the FR 4260 bridge (Cow Creek Bridge) at RM 5 upstream to Horse Creek at RM 13. The upper section extended from Fence Creek (RM 20) upstream to the terminus of the fishery area at Summit Creek (RM 48). A seven-mile section between Horse Creek and Fence Creek was not surveyed (Figure 4). Referred to as the ‘Box Canyon’ this section is very remote, mostly privately owned, and generally receives a negligible amount of fishing effort. In addition, the section downstream of the Cow Creek Bridge to the Imnaha River’s confluence with the Snake River (lower terminus of the fishery area) is accessed only by foot and was not regularly surveyed. We describe methods used to incorporate this reach into the creel estimates below.
For both the Wallowa and Imnaha rivers, each reach was surveyed four days per week during the fishery. Creel surveys were stratified by weekends and weekdays, and survey dates were weighted to sample weekends at a higher rate than weekdays (both weekend days and two randomly-selected weekdays per week). An approximate 10-hour shift was applied each day that included drive time. Shifts were stratified into morning (AM) and evening (PM) shifts to capture variability in angling effort and catch rates. AM shifts began at 0500 or 0600 hours, and PM shifts began at 1300 or 1400 hours. Shifts were selected randomly within strata.
Roving surveys consisted of pressure counts and angler interviews. Three pressure counts were conducted every survey day, each beginning at two-hour intervals from the designated start time. Pressure counts consisted of driving along the river and counting anglers that were actively fishing (i.e., not those at their vehicles or walking to and from the river). Tying knots and baiting hooks counted as actively fishing. The starting location (either the upstream or downstream end of the fishery) of each day’s first pressure count was selected at random, and subsequent counts alternated the direction of travel with the exception of the upper Imnaha River. Creel direction was not alternated here due to drive time restrictions that greatly reduced the creel clerk’s ability to conduct interviews. Creel clerks were instructed to spend the same amount of time on each pressure count (i.e. travelling at the same rate of speed and stopping at the same vantage points) to equalize effort among counts.
Angler interviews were conducted between pressure counts, and clerks placed emphasis after counts were completed to record as many completed angler trips each day. Each interview determined: whether the angler (or anglers) completed fishing for the day, whether they were targeting Chinook salmon, the place of origin, the predominant gear type used, and how many hours the anglers spent actively fishing. Total angler hours for each party were determined by multiplying the number of anglers in the party by the number of hours spent fishing.
Catch information was determined by identical methods described above for the Lookingglass fishery.
Lookingglass Fishery Data Analysis – Total effort (��), angler hours (𝑒𝑖), catch (fish landed; ��), and
harvest (fish kept; ��) were estimated using methods described by Pollock et al. (1994) for access point creel designs. Estimates were conducted within survey weeks and weekday/weekend strata, and summed across weeks during the fishery. Total effort was estimated for each stratum as follows:

5
)/(ˆ
1
n
i
iieE
where: E = Total effort, ie = angler hours for the ith sample day, and i = probability of encountering
an angler on the ith sampling day. Angler-hours (𝑒𝑖) were estimated for each stratum as:
))((1
n
i
iii tme
where: ie = angler hours for the ith sample day, im = number of anglers on the ith sampling day, it =
time spent fishing on the ith sampling day. Total catch or harvest (��) for each stratum was estimated by:
)/(ˆ
1
n
i
iicC
where: C = Total catch; ic = catch for the ith sample day, i = probability of encountering an angler on
the ith sampling day. Consistent with guidelines established in the Grande Ronde Basin FMEP, a handling mortality rate of 7.5% was applied to the estimated catch (fish landed and released) of natural and hatchery-origin adults to estimate fishery impacts.
Within strata variance estimates for catch and effort estimates (v(𝜃𝑖)) were derived using methods described by Pollock et al. (1994):
𝑣(𝜃𝑖) = 𝑁2
𝑛
∑ (𝜃𝑗 − ��)2𝑛𝑗=1
𝑛 − 1
Where N is the number of days in the strata, and n is the number of days surveyed. Season variance
(𝑣(𝜃)) was estimated as the sum of the strata variance estimates. Ninety-five percent confidence intervals were estimated as (Cochran 1977):
𝜃 ± 1.96 × √𝑣(𝜃).
Estimates of catch and variance were conducted separately for each species, adults and jacks, and fish that were harvested and released. Note: The 2016 Lookingglass Fishery consisted of only 4 days of open fishing, all of which were surveyed for creel. Therefore, all four days were combined into a single stratum.
Wallowa and Imnaha Fishery Data Analysis – Total angler effort (��), catch and harvest (fish landed or
kept, respectively, ��) were estimated using methods described by Scheaffer et al. (1979) for stratified cluster sampling. A three-stage method was used to stratify the temporal and spatial sample frame. Days were initially stratified by week of the season, then by day type (i.e., weekday, weekend day) and section. The lower survey section on the Imnaha River incorporates a five-mile river section accessed only by foot between the FR 4260 Bridge (Cow Creek Bridge) and the Imnaha River mouth. Due to the remote nature, regular pressure counts could not be conducted in this reach. In addition, the upper section of

6
the Wallowa River fishery also includes a 0.4 mile public access area near the confluence with the Lostine River that is difficult to access from the road. Therefore, regular pressure counts are not conducted in either of these reaches. To adjust pressure counts for anglers fishing in these areas, vehicles were counted at the parking areas used to access these stretches of river as a surrogate. Information collected during previous years suggested that each vehicle represented 1.6 anglers in these sections. Therefore, adjusted angler counts in the lower survey section were calculated as:
��𝑖 = 𝑚𝑖 + 1.6𝑣𝑖 where: ��𝑖 = estimated number of anglers in the lower Imnaha and upper Wallowa survey reaches on the ith day, 𝑚𝑖 = number of anglers observed during pressure counts on the ith day, and 𝑣𝑖 = number of vehicles observed at the lower Imnaha trailhead on the ith day. For all other sections on the Wallowa and Imnaha rivers; 𝑚𝑖 was not adjusted. Total angler effort (in hours) was estimated for each stratum as:
�� = �� × 𝑑 × ℎ where: �� = the mean angler count during the stratum (as a function of 𝑚𝑖 for the unadjusted reaches, and ��𝑖 for adjusted reaches as described above), 𝑑 = the number of survey days during the stratum, and ℎ = hours of daylight for each survey day during the strata, assumed to be 16 hours during the fishery. Mean adjusted angler count during the stratum (��) was calculated as:
�� =∑ 𝑚𝑖
∑ 𝑝𝑖
where: 𝑚𝑖= number of anglers counted during the ith sample day (or ��𝑖for adjusted sections, as described above), and 𝑝𝑖 = total of all counts made on the ith sample day.
Total catch or harvest (��) for each stratum was estimated as:
�� = �� × ��
where: �� = total estimated angler hours during the stratum, and �� = the mean catch or harvest rate during the stratum. Mean catch or harvest rate (fish/angler hour) for the stratum was estimated as:
�� =∑ 𝑥𝑖
∑ 𝑤𝑖
where: 𝑥𝑖 = the reported catch and/or harvest for the ith party interviewed, and 𝑤𝑖 = total angler hours expended by the ith party when interviewed. Consistent with guidelines established in the Imnaha Basin FMEP, a handling mortality rate of 10.0% was applied to the estimated catch (fish landed and released) of natural and hatchery-origin adults to estimate fishery impacts.
Within-strata variance estimates for catch and effort estimates (v(𝜃𝑖)), season variance (𝑣(𝜃)) and Ninety-five percent confidence intervals were derived using methods described above (see: Lookingglass Fishery Data Analysis).
N-O adult estimates – Run projections for N-O adults in the Lostine River were provided during the LSRCP annual operating plan process by ODFW and NPT research staff (LSRCP 2016).

7
Since the Wallowa fishery is mixed-stock, estimates of N-O adults are required to determine fishery quotas for both stocks that may be intercepted. Estimates for N-O adults from the upper Wallowa Basin were derived based on the average proportion of total redds counted in the Lostine River, upper Wallowa River, Bear Creek and Hurricane Creek, and N-O estimates for the Lostine River. These estimates assume that N-O returns to the Lostine River are proportional to redd counts throughout the basin. Based on redd counts from 2001-2015, the amount of N-O adults returning to the Wallowa River Basin (outside the Lostine) was equivalent to 41% of the estimated Lostine River return. We estimate that N-O adults returning the Minam River were equivalent to 74% of the estimated Lostine River return.
The Wallowa River fishery was broken up into two creel sections, upstream and downstream of the Minam River confluence (Figure 3). The upper section is assumed to only intercept N-O and H-O adults from the Wallowa-Lostine stock. However, the lower section has potential to intercept N-O adults from the Wallowa-Lostine and Minam stocks. Therefore, catch of N-O adults was allocated proportionally based on return estimate of Wallowa-Lostine and Minam N-O adults in this fishery section.
RESULTS AND DISCUSSION Lookingglass Creek − In-season return estimates based on PIT tag recoveries at Bonneville Dam indicated a limited return of adult Chinook to Lookingglass Creek in 2016. State and Tribal co-managers agreed to manage fisheries in Lookingglass Creek on a total estimated return of 151 N-O and 345 H-O adults (Table 4). The 2016 Lookingglass sport fishery was managed within two constraints: 1) the allowable number of N-O adults handled in the fishery, and 2) the allowable number of H-O adults harvested in the fishery. Given run estimates, FMEP guidelines allowed for a sport fishery impact of 3 natural fish (1.9% of the run) and an allowable harvest and/or incidental mortality of 55 adult H-O salmon (15.9% of the run). By applying a handling mortality rate of 7.5%; we determined sport anglers could not handle more than 40 N-O adult salmon before exceeding ESA impact limits. The sport fishery on Lookingglass Creek opened 28 May and closed on 31 May (4 days). The area open to anglers extended from the mouth of Lookingglass Creek at the Moses Creek Lane Bridge upstream to the confluence of Jarboe Creek (RM 2). Daily bag limits for the Lookingglass Creek fishery was limited two adipose fin-clipped chinook adults and five adipose fin-clipped jacks per day. Anglers were required to cease angling if they had retained a daily limit of marked adults. Angling was restricted to the use of artificial flies and lures only to minimize impact on bull trout. Creel surveys were conducted on all four days of the fishery. During the surveys, 95 anglers were contacted who had fished a total of 288 hours. Anglers reported an average catch of one adult Chinook (N-O and H-O combined) for every 9 hours of fishing and one jack for every 144 hours of fishing. Total effort was estimated at 854 (95% CI = 550-1,158) angler hours for the Lookingglass fishery (Table 5). We estimated 22 (95% CI = 0-55) unmarked N-O adults and two (95% CI = 0-6) marked H-O adults were caught and released in the Lookingglass fishery in 2016 (Table 5). Assuming a handling mortality rate of 7.5%, we estimated an incidental mortality of two N-O and zero H-O adult salmon. We estimated that sport anglers harvested 44 (95% CI = 0-109) H-O adults in the 2016 Lookingglass fishery (Table 5). Finally, we estimated that anglers handled 16 (95% CI = 0-28) bull trout during the fishery.
Based on creel surveys, the 2016 Lookingglass fishery was managed within predetermined ESA impact limits and harvest sharing agreements. Estimates provided from the creel survey indicated that 66.7%

8
(2 incidental mortalities of 3 allowed) of the N-O impacts and 80.0% (44 harvest/impact of 55 allowed) of the H-O harvest quota were used in the fishery. Wallowa River – In-season return estimates based on PIT tag recoveries at mainstem dams indicated a modest return of adult Chinook to the Wallowa River in 2016. Run projections of N-O adults were 560 and 570 for the Wallowa-Lostine and Minam, respectively (Table 4). Based on FMEP guidelines, these run estimates allow for a sport fishery impact of eight (1.4% of the run) for the Wallowa-Lostine population and six (1.1% of the run) for the Minam River population. The H-O adult return estimate was 700 for the Lostine River. Based on this estimate, co-managers agreed to manage the Wallowa fishery on allowable harvest and/or incidental mortality of 100 (14.3% of the run) H-O adults for the Lostine River stock. The 2016 Wallowa sport fishery was managed within two constraints: 1) the allowable number of N-O adults handled for the Wallowa-Lostine and Minam stocks, and 2) the cumulative number of H-O adult harvest and incidental mortality from the Wallowa-Lostine stock. Given N-O adult run estimates, FMEP guidance, and an applied handling mortality of 10.0%; the amount of N-O adult salmon handled in the sport fisheries could not exceed 80 or 60 for the Wallowa-Lostine and Minam stocks, respectively. The Wallowa River fishery opened on 2 Jul and closed on 17 Jul (16 days). The area open to salmon angling extended from the downstream end of Minam State Park (RM 8) upstream to the confluence with the Lostine River (RM 25). The daily bag limit included two adult adipose fin-clipped Chinook per day and five fin-clipped jacks and anglers were required to cease angling if they had retained a daily limit of marked adults.
Creel surveys were conducted on 10 days of the Wallowa River fishery. During the survey 43 anglers were contacted that fished a total of 82 hours. Total effort was estimated at 544 (95% CI = 324-764) angler hours (Table 5). No fish were reported caught in the Wallowa River fishery. Therefore, catch estimates for both N-O and H-O chinook, and bull trout is zero.
Based on these creel surveys, the 2016 Wallowa fishery were managed within predetermined ESA impact limits and harvest sharing agreements Imnaha River − In-season return estimates based on PIT tag recoveries at mainstem dams indicated a modest return of adult Chinook to the Imnaha River in 2016. State and Tribal co-managers agreed to manage fisheries in the Imnaha River based on a total estimated return of 600 N-O adults and 1,000 H-O adults. Using these run estimates, FMEP guidelines allowed for a sport fishery impact of 9 N-O adults (1.5% of the run) and an allowable harvest of 150 adult H-O salmon (15.0% of the run). The 2016 Imnaha sport fishery was managed within two constraints: 1) the allowable number of N-O adults handled in the fishery and 2) and the combined number of H-O adult harvest and incidental mortality in the fishery. Given the run estimates, FMEP guidance, and an applied handling mortality of 10.0%; sport anglers were limited to handling less than 90 N-O adult salmon. Combined H-O adult harvest and/or incidental mortality could not exceed 150 fish. The sport fishery on the Imnaha River opened 15 Jun and closed 3 Jul (19 days). The area open to anglers extended from the confluence with the Snake River to Summit Creek Bridge (RM 45) on the Imnaha River. Daily bag limits were limited to two adult adipose fin-clipped Chinook per day and five fin-clipped jacks. Anglers were required to cease angling if they had retained a daily limit of marked adults.

9
Creel surveys were conducted on 12 days of the Imnaha River fishery. During the survey 135 anglers were contacted that fished a total of 1,001 hours. Anglers reported an average catch of one adult Chinook (N-O and H-O combined) for every 17 hours of fishing and one jack for every 362 hours of fishing. Total effort was estimated at 2,401 (95% CI = 1,843-2,959) angler hours for the Imnaha fishery (Table 5). We estimated 26 (95% CI = 15-37) N-O adults were caught and released in the fishery (Table 5). We estimated anglers harvested 113 (95% CI = 42-184) H-O adults and 11 (95% CI = 0-25) H-O jacks (Table 5). Applying a handling mortality rate of 10.0%, we estimated an incidental mortality of 3 (0.5% of the run) N-O adult salmon, respectively. Finally, we estimated that 5 (95% CI = 0-15) and 59 (95% CI = 44-74) N-O jacks and bull trout were handled, respectively. Based on these creel surveys, the 2016 Imnaha fishery was managed within predetermined ESA impact limits and harvest sharing agreements. Estimates provided from the creel survey indicated that 33.3% (3 incidental mortality of 9 allowed) of the N-O impacts and 75.3% (113 harvested of 150 allowed) of the H-O harvest quota were used in the fishery.

10
REFERENCES
Cochran, W. G. 1977. Sampling techniques, 3rd edition edition. Wiley, New York. ICTRT (Interior Columbia Technical Recovery Team). 2007. Current ICTRT draft population status reports. Memorandum to C. Toole, National Marine Fisheries Service, from T. Cooney, National Marine Fisheries Service, Northwest Fisheries Science Center, Seattle, Washington. LSRCP (Lower Snake River Compensation Plan), 2016. Lower Snake River fish and wildlife compensation plan Grande Ronde and Imnaha basins annual operation plan 2016. McElhany, P., M.H. Ruckelshaus, M.J. Ford, T.C. Wainwright, and E.P. Bjorkstedt. 2000. Viable salmonid populations and the recovery of Evolutionarily Significant Units. U.S. Dept. of Commerce, NOAA Tech. Memo., NMFS-NWFSC-42, 156p. Oregon Department of Fish and Wildlife (ODFW). 2011. Fisheries Management and Evaluation Plan for Snake River Spring/Summer Chinook – Imnaha Subbasin. Oregon Department of Fish and Wildlife (ODFW) and Washington Department of Fish and Wildlife (WDFW). 2012. Fisheries Management and Evaluation Plan for Snake River Spring/Summer Chinook – Grande Ronde Subbasin. Pollock, K. H., C. M. Jones, and T. L. Brown. 1994. Angler survey methods and their applications in fisheries management. American Fisheries Society Special Publication 25, Bethesda, Maryland Scheaffer, R. L., W. Mendenhall, and L. Ott. 1979. Elementary survey sampling. Duxbury, North Sciuate, Massachusetts.

11
APPENDICES Table 1. List of the natural fish populations, “Viable Salmonid Population” thresholds, and associated hatchery stocks in the Imnaha and Grande Ronde River Basins.
Natural Populations (or Management
Units
Critical Threshold
Minimum Abundance Threshold
(MAT)
Associated hatchery stock(s)
Hatchery stock
essential for recovery?
Imnaha R (inc. Big Sheep Cr)
Abundance: 300 adults/yr Productivity: short term
avg. replacement rate <0.7
Abundance:1000 adults/yr Productivity: long term
avg. replacement rate =1
Lookingglass Hatchery
Imnaha stock Y
Wallowa/ Lostine R
Abundance: 300 adults/yr Productivity: short term
avg. replacement rate <0.7
Abundance:1000 adults/yr Productivity: long term
avg. replacement rate =1
Lookingglass Hatchery
Lostine stock Y
Catherine/Indian Cr1
Abundance: 300 adults/yr Productivity: short term
avg. replacement rate <0.7
Abundance:1000 adults/yr Productivity: long term
avg. replacement rate =1
Lookingglass Hatchery Catherine
Creek stock
Y
Upper Grande Ronde R
Abundance: 300 adults/yr Productivity: short term
avg. replacement rate <0.7
Abundance:1000 adults/yr Productivity: long term
avg. replacement rate =1
Lookingglass Hatchery U. Grande
Ronde stock
Y
Wenaha R Abundance: 225 adults/yr Productivity: short term
avg. replacement rate <0.7
Abundance: 750 adults/yr Productivity: long term
avg. replacement rate =1 None N/A
Minam R Abundance: 225 adults/yr Productivity: short term
avg. replacement rate <0.7
Abundance: 750 adults/yr Productivity: long term
avg. replacement rate =1 None N/A
Lookingglass Cr Abundance: 150 adults/yr Productivity: short term
avg. replacement rate <0.7
Abundance: 500 adults/yr Productivity: long term
avg. replacement rate =1
Lookingglass Hatchery Catherine
Creek stock
N
1 When fisheries target only the Catherine Creek portion of the Catherine/Indian Population, then the fisheries will be managed based on a Critical Threshold of 225 with a MAT of 750 as for an Intermediate-sized population.

12
Table 2. Total collective natural-origin adult harvest/impact rates relative to critical and minimum abundance threshold (MAT) levels described in Table 1.
Fishery Scenario Expected return of natural-origin
fish Total collective natural-origin
mortality
A Below Critical Threshold 1%*
B Critical to MAT A + 11% of margin above A*
C MAT to 1.5X MAT B + 22% of margin above B
D 1.5X MAT to 2X MAT C + 25% of margin above C
E Greater than 2X MAT D + 40% of margin above D
* For Lookingglass Creek fisheries will be managed more liberally under fishery scenarios A & B: A = 10% total harvest
(tribal 8% and sport 2%); B = A + 16% of margin above critical (tribal 12% and sport 4%).

13
Table 3. Natural-origin adult harvest/impact rates based on existing co-manager agreements, including collective natural-origin mortality rates as described in Table 2.
Fishery Scenario
Number of Natural Origin Fish
Annual natural-origin mortality based on co-manager agreements
Total Collective Natural-Origin
Mortality (All Fisheries) Tribal State
A
Below Critical Threshold
1%* 0%* 1%*
B Critical
To MAT
A + 8% of margin above critical*
A + 3% of margin above critical*
A + 11% of margin above critical*
C MAT To
1.5X MAT
B + 16% of margin above MAT
B + 6% of margin above MAT
B + 22% of margin above MAT
D 1.5X MAT
To 2X MAT
C + 19% of margin above 1.5X MAT
C + 6% of margin above MAT
C + 25% of margin above MAT
E Greater than
2X MAT D + 28% of margin
above 2X MAT D + 12% of margin
above 2X MAT D + 40% of margin
above 2X MAT
* For Lookingglass Creek fisheries will be managed more liberally under fishery scenarios A & B: A = 10% total harvest (tribal 8% and sport 2%); B = A + 16% of margin above critical (tribal 12% and sport 4%).

14
Table 4. Return estimates of spring Chinook salmon to the Imnaha and Grande Ronde Basins in 2016.
Population
Projected Run Size
Natural Hatchery Total
Imnaha Basin Imnaha River a 600 1000 1,600 Grande Ronde Basin Lookingglass Creek a 151 345 496 Wallowa-Lostine River a,b 560 700 1,100 Minam River b,c 570 − 570
a Estimates based on in-season projections utilizing PIT tag detections at mainstem dams in mid-Jun 2016 b Natural-origin returns a function of projected returns to the Lostine River plus added natural production to the
Wallowa Basin. Redd counts suggest that total returns to the Wallowa-Lostine population are 1.4X estimated returns to the Lostine River.
c Managed for natural production only, no hatchery returns are projected (outside of strays) for the basins.

15
Table 5. Estimates of effort, catch, and harvest during the 2016 Lookingglass Creek (28 May to 31 May), Wallowa (2 Jul to 17 Jul), and Imnaha rivers (15 Jun to 3 Jul) fisheries. Ninety-five percent (95%) confidence limits are indicated in parentheses.
Fishery Parameter Lookingglass Creek
(95% CI) Imnaha River
(95% CI) Wallowa River
(95% CI)
Fishery Days 4 19 16
Total Estimated Angler Hours
854 (550-1158) 2401 (1843-2959) 544 (324-764)
Marked Adults Harvested 44 (0-55) 113 (42-184) 0 (N/A)
Marked Jacks Harvested 4 (0-9) 11 (0-25) 0 (N/A)
Unmarked Adults Released 22 (0-55) 26 (15-37) 0 (N/A)
Unmarked Jacks Released 0 (N/A) 5 (0-15) 0 (N/A)
Marked Adults Released 2 (0-6) 0 (N/A) 0 (N/A)
Bull Trout Released 16 (0-28) 59 (44-74) 0 (N/A)

16
Figure 1. The Lookingglass Creek fishery management area (RM 0 to 2) showing area open to fishing and
the location of the access point survey (creel check station) near the confluence with the Grande Ronde
River at Palmer Junction, OR.

17
Figure 2. The Wallowa River fishery management area (RM 8 to 25) showing area open to fishing and creel survey reaches near Wallowa, OR.

18
Figure 3. The Imnaha River fishery management area (RM 0 to 48) showing descriptions of surveyed reaches (lower RM 5-13, upper RM 20-48), the unsurveyed Box Canyon reach (RM 13-20), major tributaries, and the location of the adult weir and juvenile release facility upstream of the fishery area.

19
APPENDIX TABLES
Appendix Table 1. Lookingglass Creek spring Chinook sport fisheries adult (age-4 and 5 only) impact for years 2011 through 2016.
Year Sport
Season
Harvest Released Impact2
(H) 1 (H) (N) 1 (N)
2011 5/28-7/15 141 4 38 3
2012 5/26-6/12 6/22-6/25
464 20 26 4
20133 6/1-6/21 0 40 16 1
2014 5/31-6/18 197 5 53 4
2015 5/23-6/30 124 23 30 2
2016 5/28-5/31 44 2 22 2
1 (H) = Hatchery-origin fish, (N) = Natural-origin fish 2 Impact includes 7.5% fishery mortality for both hatchery and wild fish caught and released 3 The 2013 fishery was limited to retention of jacks only.
20
Appendix Table 2. Wallowa River spring Chinook sport fisheries adult (age-4 and 5 only) impact for years 2008 through 2016. Adult abundance did not support sport harvest in 2013.
Year
Sport
Est. Harvest Est. Released Impact2 Season
(H) 1 (H) (N) 1 (N)
2008 6/4-6/13
0 0 0 0
2009 6/13-7/12 10 0 11 1
2010 5/22-7/25 45 0 47 5
2011 5/28-8/7 25 0 28 3
2012 6/9-7/15 0 0 15 2
2014 6/21-7/27 10 0 2 0
2015 6/6-7/13 134 0 9 1
20163 7/2-7/17 0 0 0 0
1 (H) = Hatchery-origin fish, (N) = Natural-origin fish 2 Impact includes 10% fishery mortality for both hatchery and wild fish caught and released 3 No fish were reported caught in the 2016 fishery

21
Appendix Table 3. Imnaha River spring Chinook sport fisheries adult (age-4 and 5 only) impact for years 2001 through 2016. Adult abundance did not support sport harvest in 2006 and 2007.
Year Sport
Season
Est. Harvest Est. Released Impact3
(H) 1 (H) (N) 1 (N)
2001 6/2-6/21 302 21 433 43
2002 6/1-6/30 152 9 15 2
2003 6/7-7/1 125 22 83 8
2004 6/19-7/5 192 21 29 3
2005 6/25-7/4 22 54 22 2
2008 7/4-7/15 64 0 17 2
2009 6/13-7/12 197 0 50 5
2010 5/22-7/25 336 48 108 11
2011 5/28-7/23 519 0 153 15
2012 6/9-6/27 203 0 62 6
2013 7/5-7/19 30 0 11 1
2014 7/5-7/27 33 4 6 1
2015 6/6-7/13 73 0 14 1
2016 6/15-7/3 113 0 26 3
1 (H) = Hatchery-origin fish, (N) = Natural-origin fish 2 Impact includes 10% fishery mortality for both hatchery and wild fish caught and released

22
Appendix Table 4. Grande Ronde River spring Chinook sport fisheries adult (age-4 and 5 only) impact for years 2014 and 2015. There was no fishery in 2016.
Year Sport
Season
Est. Harvest Est. Released Impact3
(H) 1 (H) (N) 1 (N)
2014 6/27-6/30
9 0 7 1 7/5-7/7
2015 6/6-7/6 0 0 0 0
1 (H) = Hatchery-origin fish, (N) = Natural-origin fish 2 Impact includes 10% fishery mortality for both hatchery and wild fish caught and released


![Supplementary Information 1[1] - NatureSupplementary Information 1 Samples For field details of Steens basalt samples, see Johnson et al (1998). For field details of Imnaha, Grande](https://static.fdocuments.us/doc/165x107/5ece705c565c1910a43bafa9/supplementary-information-11-nature-supplementary-information-1-samples-for.jpg)