
Bongiovanni Family Baptismal Gown Handcrafted by Donna Bongiovanni
Upload
stewart-rogersCategory
view
220download
0
Lowenberg-DeBoer, Lambert, Bongiovanni
1
Appropriate On-Farm Trial Appropriate On-Farm Trial Designs for Precision FarmingDesigns for Precision Farming
J. Lowenberg-DeBoerJ. Lowenberg-DeBoer11, D. Lambert, D. Lambert11, , R. BongiovanniR. Bongiovanni22
11Purdue University, Site-Specific Management Center, Department of Agricultural Purdue University, Site-Specific Management Center, Department of Agricultural Economics, Purdue University, West Lafayette, IndianaEconomics, Purdue University, West Lafayette, Indiana
22Precision Agriculture Project, National Institute for Agricultural Technology (INTA), Precision Agriculture Project, National Institute for Agricultural Technology (INTA), Manfredi, Córdoba, ArgentinaManfredi, Córdoba, Argentina
[email protected]@purdue.edu
Lowenberg-DeBoer, Lambert, Bongiovanni
2
• Objective of on-farm trials is different from Objective of on-farm trials is different from research trialsresearch trials
• Farmers want to make the best economic Farmers want to make the best economic decisions for their operationdecisions for their operation
• Most farmers do not care about underlying Most farmers do not care about underlying mechanisms or whether results are generalizablemechanisms or whether results are generalizable
• For on-farm trials we need to shift focus away For on-farm trials we need to shift focus away from research to farm management decision from research to farm management decision makingmaking
MotivationMotivation
Photo: Farmphotos.com
Lowenberg-DeBoer, Lambert, Bongiovanni
3
Feedback from US FarmersFeedback from US Farmers• For hybrid and variety trials, filling planters with For hybrid and variety trials, filling planters with
small quantities of seed and cleaning boxes for the small quantities of seed and cleaning boxes for the next hybrid or variety takes too much time.next hybrid or variety takes too much time.
• In larger operations, seed is often purchased in bulk. In larger operations, seed is often purchased in bulk. This makes it difficult to fill the planter with small This makes it difficult to fill the planter with small quantities. Hybrid and variety strip trials work better quantities. Hybrid and variety strip trials work better with seed in bags.with seed in bags.
• Split planter trials are convenient only if your Split planter trials are convenient only if your combine head is exactly half the width of the planter. combine head is exactly half the width of the planter. That is not always the case.That is not always the case.
• For narrow row soybeans, many producers prefer to For narrow row soybeans, many producers prefer to harvest at a diagonal to the rows. This makes it harvest at a diagonal to the rows. This makes it impossible to detect narrow strips on the yield maps.impossible to detect narrow strips on the yield maps.
Lowenberg-DeBoer, Lambert, Bongiovanni
4
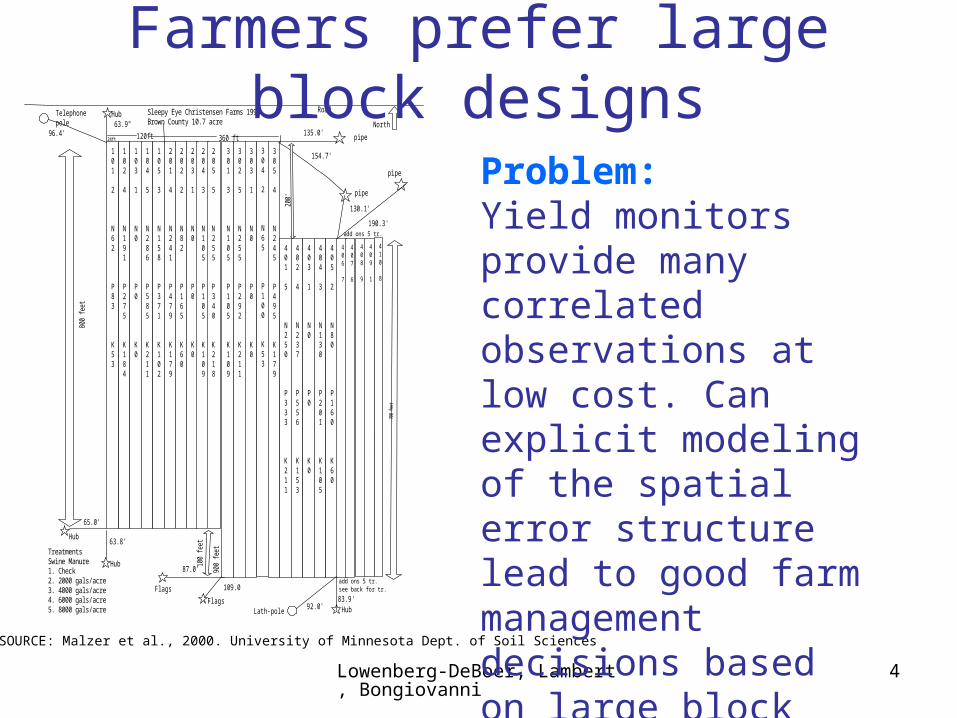
SOURCE: Malzer et al., 2000. University of Minnesota Dept. of Soil Sciences
102
4
N191
P275
K184
103
1
N0
P0
K0
104
5
N286
P585
K211
105
3
N158
P371
K102
201
4
N241
P479
K179
202
2
N82
P165
K60
203
1
N0
P0
K0
204
3
N105
P105
K109
205
5
N255
P340
K218
301
3
N105
P105
K109
302
5
N255
P292
K211
303
1
N0
P0
K0
304
2
N65
P100
K53
305
4
N245
P495
K179
401
5
N250
P333
K211
402
4
N237
P556
K153
403
1
N0
P0
K0
404
3
N130
P201
K105
405
2
N80
P160
K60
HubTelephonepole
Road
96.4'63.9"
Hub
Hub
HubLath-pole
Flags
Flags
65.0'
63.8'
87.0'
109.0
92.0'83.9'
Sleepy Eye Christensen Farms 1999Brown County 10.7 acre North
190.3'
130.1'
154.7'
135.0'
200'
120ft pipe
pipe
pipe
800
feet
700
fee t
700
feet
100
feet
900
feet
360 ft24ft
TreatmentsSwine Manure1. Check2. 2000 gals/acre3. 4000 gals/acre4. 6000 gals/acre5. 8000 gals/acre
101
2
N62
P83
K53
406
7
407
6
408
9
410
8
409
1
add ons 5 tr.see back for tr.
add ons 5 tr.
Problem:Yield monitors provide many correlated observations at low cost. Can explicit modeling of the spatial error structure lead to good farm management decisions based on large block designs and fewer repetitions?
Farmers prefer large block designs
Lowenberg-DeBoer, Lambert, Bongiovanni
5
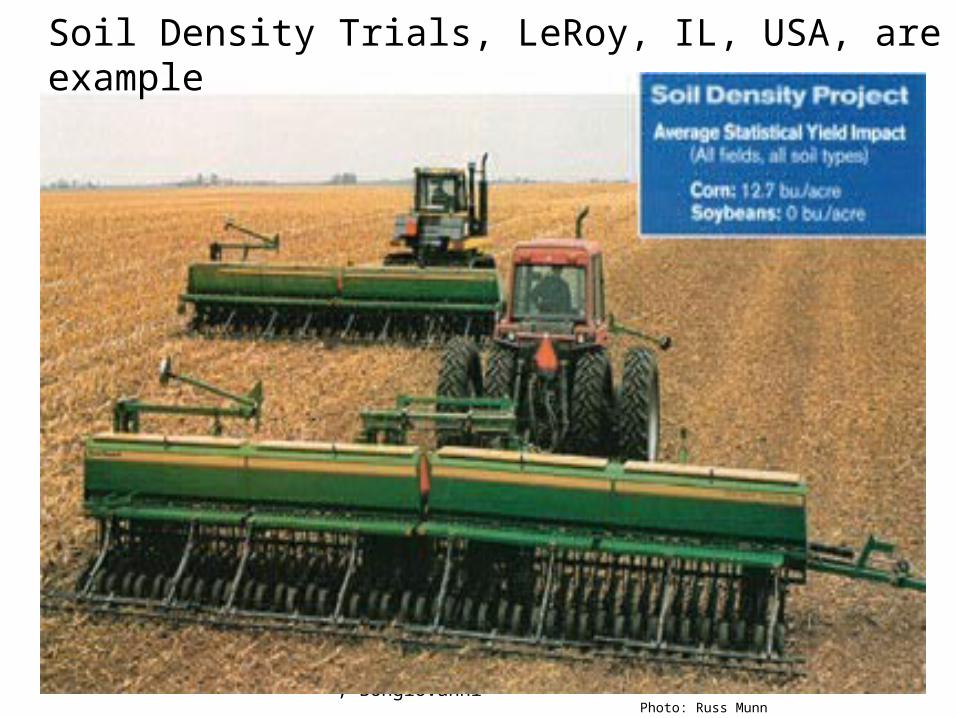
Soil Density Trials, LeRoy, IL, USA, are an example
Photo: Russ Munn
Lowenberg-DeBoer, Lambert, Bongiovanni
6
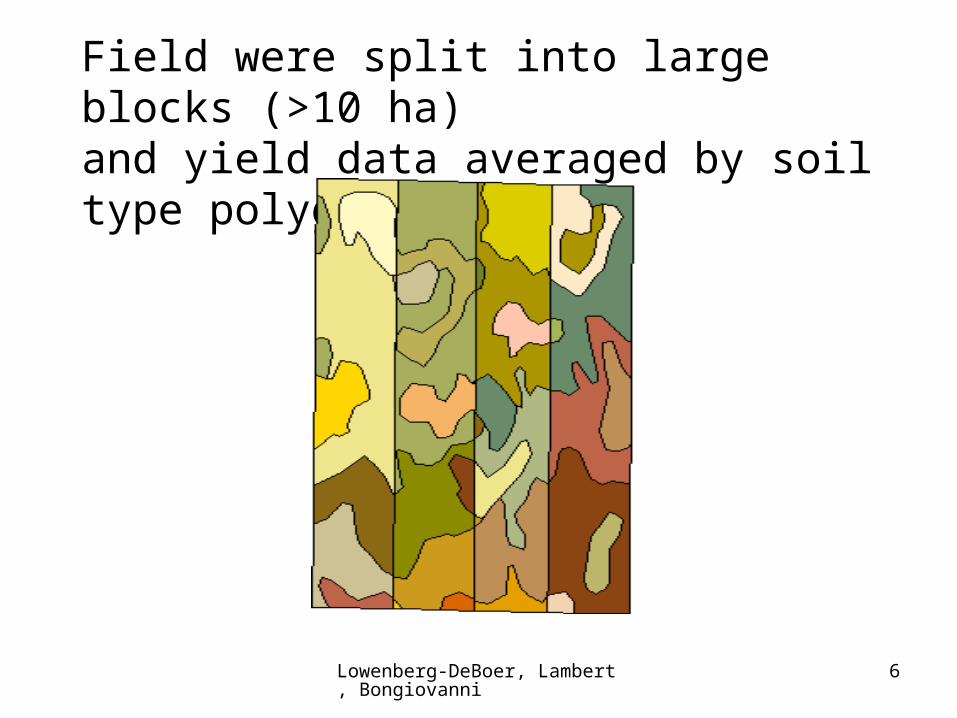
Field were split into large blocks (>10 ha)and yield data averaged by soil type polygon
Lowenberg-DeBoer, Lambert, Bongiovanni
7
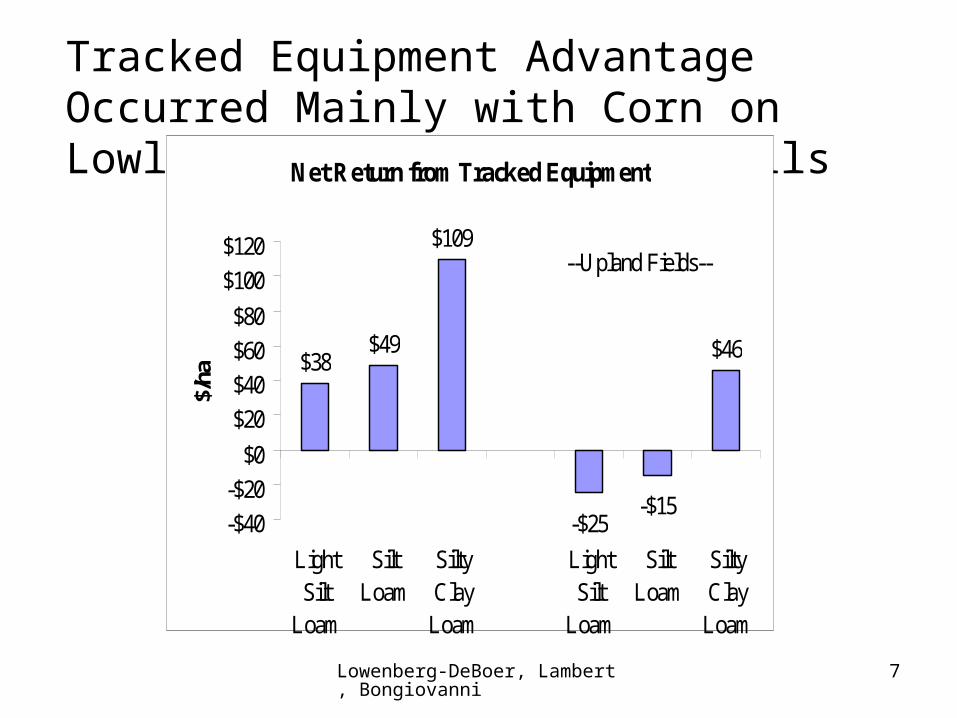
Tracked Equipment Advantage Occurred Mainly with Corn on Lowland Fields with Clay Soils
Net Return from Tracked Equipment
$38$49
$109
-$25-$15
$46
-$40
-$20
$0
$20
$40
$60
$80
$100
$120
LightSilt
Loam
SiltLoam
SiltyClay
Loam
LightSilt
Loam
SiltLoam
SiltyClay
Loam
$/ha
--Upland Fields----Lowlands--
Lowenberg-DeBoer, Lambert, Bongiovanni
8
On-farm trials provide experience with different designs, but do not tell us
which is best.

Lowenberg-DeBoer, Lambert, Bongiovanni
9
Why use a Monte Carlo Simulation in developing alternative trial designs?
• It is cheaper to narrow the range of alternative designs with simulation before doing expensive field testing
• With spatial heterogeneity field testing cannot entirely answer the question since one can only do one trial in one place in a given year
• Simulation allows us to test different designs on the same set of spatial characteristics with the same weather years
Lowenberg-DeBoer, Lambert, Bongiovanni
10
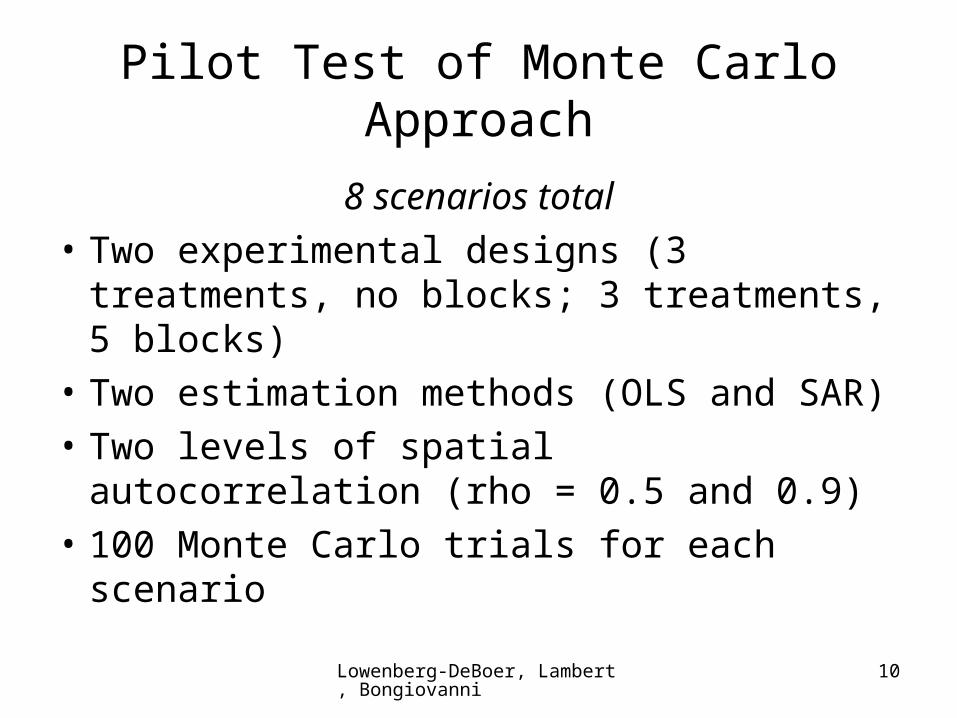
Pilot Test of Monte Carlo Approach
8 scenarios total
• Two experimental designs (3 treatments, no blocks; 3 treatments, 5 blocks)
• Two estimation methods (OLS and SAR)
• Two levels of spatial autocorrelation (rho = 0.5 and 0.9)
• 100 Monte Carlo trials for each scenario
Lowenberg-DeBoer, Lambert, Bongiovanni
11
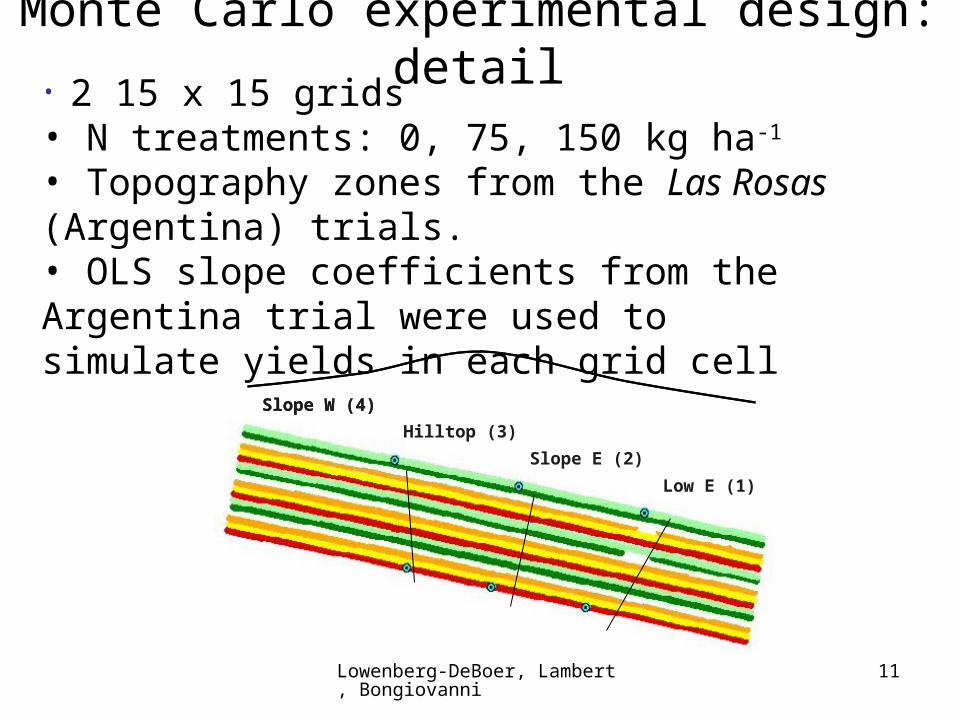
Monte Carlo experimental design: detail• 2 15 x 15 grids • N treatments: 0, 75, 150 kg ha-1
• Topography zones from the Las Rosas (Argentina) trials.• OLS slope coefficients from the Argentina trial were used to simulate yields in each grid cell
Hilltop (3)
Slope W (4)
Slope E (2)
Low E (1)
132 kg/ha
Hilltop (3)
Slope W (4)
Slope E (2)
Low E (1)
Lowenberg-DeBoer, Lambert, Bongiovanni
12
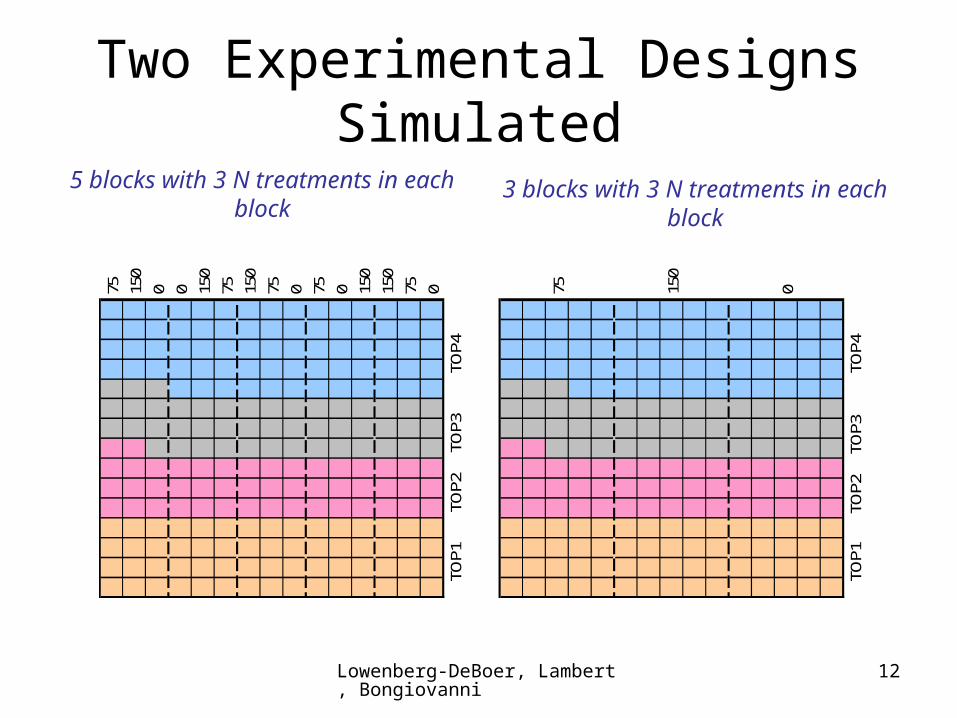
Two Experimental Designs Simulated
150
0
TOP1
TOP2
TOP3
TOP4
0150
75 750
TOP1
TOP2
TOP3
TOP4
75150
75150
150
0750 075150
5 blocks with 3 N treatments in each block
3 blocks with 3 N treatments in each block
Lowenberg-DeBoer, Lambert, Bongiovanni
13
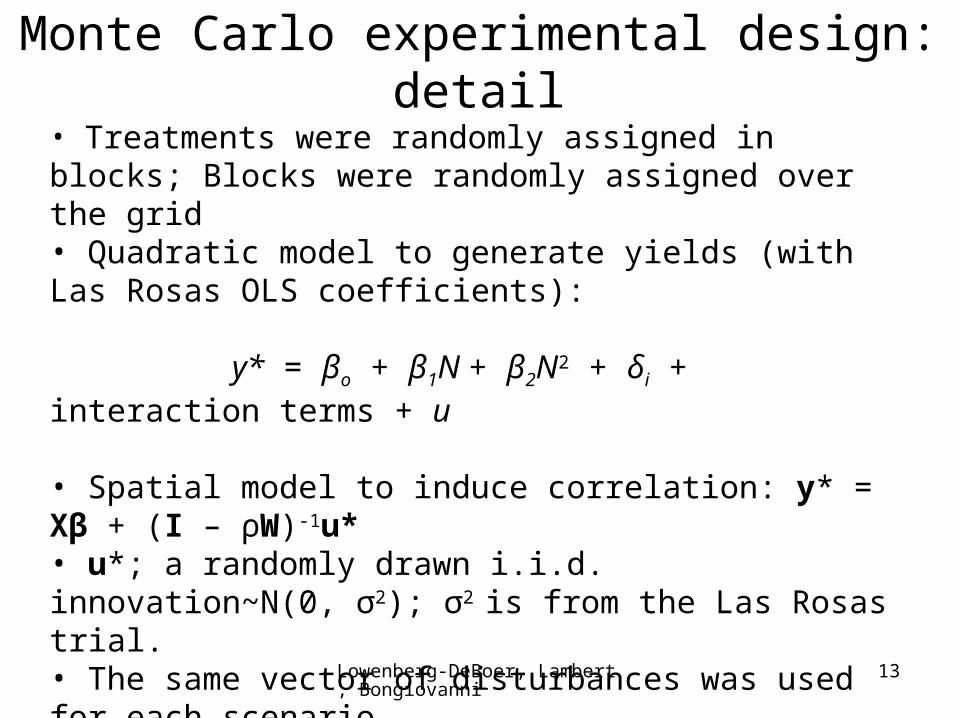
• Treatments were randomly assigned in blocks; Blocks were randomly assigned over the grid• Quadratic model to generate yields (with Las Rosas OLS coefficients):
y* = βo + β1N + β2N2 + δi + interaction terms + u
• Spatial model to induce correlation: y* = Xβ + (I – ρW)-1u*• u*; a randomly drawn i.i.d. innovation~N(0, σ2); σ2 is from the Las Rosas trial.• The same vector of disturbances was used for each scenario. • W is an n x n matrix defining a neighborhoods of observations.• Two levels of ρ were used to induce correlation between grid cells: 0.5 and 0.9.
Monte Carlo experimental design: detail

Lowenberg-DeBoer, Lambert, Bongiovanni
14
Returns above fertilizer cost ($ ha-1) = NPNNP Niioici
i
221
4
1
where: Pc = Price of corn ($6.85 q-1); i = Topography zone (1=Low E, 2= Slope E, 3=Hilltop, 4=Slope W); N = N rate (profit max N* rate for VRT computations); PN = Price of N fertilizer ($0.435 kg-1), plus interest for 6 months at
15% annual interest rate; ωi = % of landscape represented by topography zone i.
Partial Budgeting for the experiment
Profit is maximized when the value of the increased yield from added N equals the cost of applying an additional unit; or when the marginal value product equals the marginal factor cost.
Lowenberg-DeBoer, Lambert, Bongiovanni
15
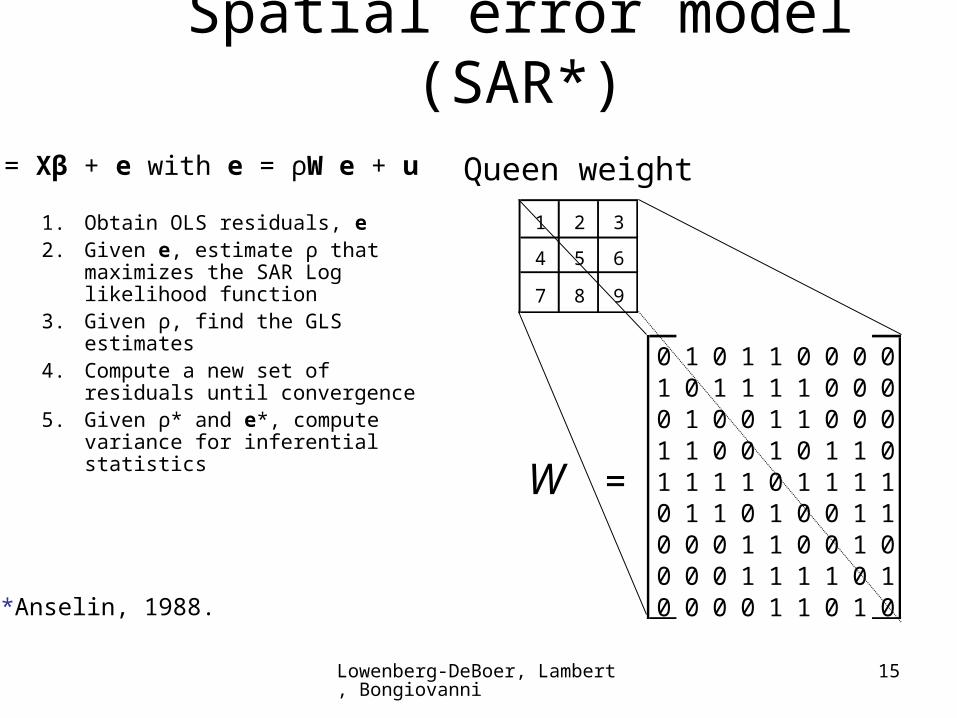
Spatial error model (SAR*)
1. Obtain OLS residuals, e2. Given e, estimate ρ that
maximizes the SAR Log likelihood function
3. Given ρ, find the GLS estimates4. Compute a new set of residuals
until convergence5. Given ρ* and e*, compute
variance for inferential statistics
0 1 0 1 1 0 0 0 01 0 1 1 1 1 0 0 00 1 0 0 1 1 0 0 01 1 0 0 1 0 1 1 01 1 1 1 0 1 1 1 10 1 1 0 1 0 0 1 10 0 0 1 1 0 0 1 00 0 0 1 1 1 1 0 10 0 0 0 1 1 0 1 0
1 2 3
4 5 6
7 8 9
W =
Queen weighty = Xβ + e with e = ρW e + u
*Anselin, 1988.
Lowenberg-DeBoer, Lambert, Bongiovanni
16
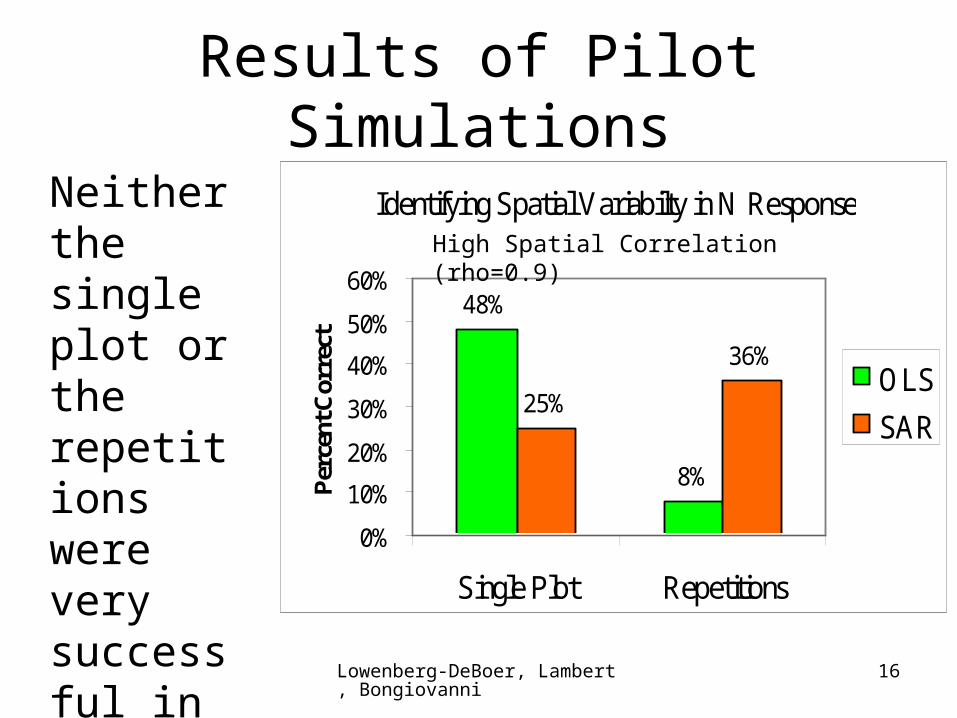
Results of Pilot Simulations
Neither the single plot or the repetitions were very successful in correctly identifying spatial variability
Identifying Spatial Variabilty in N Response
48%
8%
25%
36%
0%
10%
20%
30%
40%
50%
60%
Single Plot Repetitions
Per
cent
Cor
rect
OLS
SAR
High Spatial Correlation (rho=0.9)
Lowenberg-DeBoer, Lambert, Bongiovanni
17
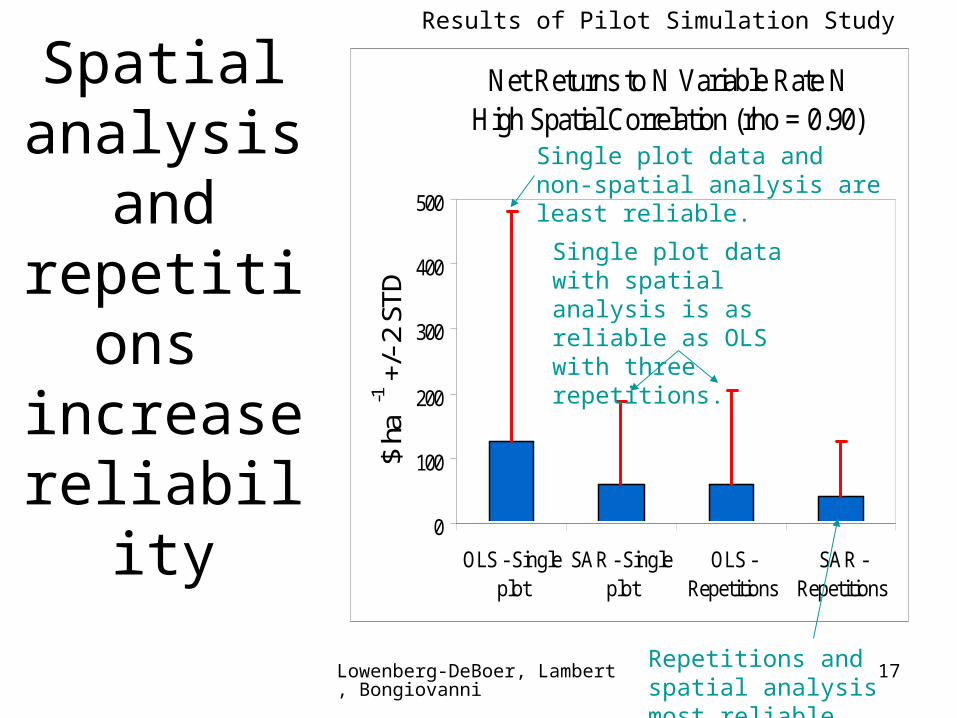
Spatial analysis and repetitions
increase reliability
Net Returns to N Variable Rate NHigh Spatial Correlation (rho = 0.90)
0
100
200
300
400
500
OLS - Singleplot
SAR - Singleplot
OLS -Repetitions
SAR -Repetitions
$ ha
-1 +/
- 2 S
TD
Single plot data and non-spatial analysis are least reliable.
Single plot data with spatial analysis is as reliable as OLS with three repetitions.
Results of Pilot Simulation Study
Repetitions and spatial analysis most reliable
Lowenberg-DeBoer, Lambert, Bongiovanni
18
Results from Pilot Simulations:
Neither experimental design is particularly successful in identifying spatially variable response to nitrogen
Single plot design was often as successful at identifying spatial variability of response as the traditional randomised block design
Traditional design usually results in a more reliable decision than the single plot design, in the sense that the range and standard deviation of returns is smaller
Lowenberg-DeBoer, Lambert, Bongiovanni
19
Summary With rapid technology change farmers need
more on-farm information to make good decisions
Farmers often shy away from rigorous on-farm comparisons because of logistical problems
Precision Ag technology facilitates data gathering, but classic on-farm trial designs are still often too time consuming
Simulation provides a practical way to narrow the range of alternative designs before on-farm testing
Lowenberg-DeBoer, Lambert, Bongiovanni
20
Further research
Alternative statistical models (e.g. Nearest Neighbor, Cressie’s REML-geostatistic approach)
Continuous spatial process assumption vs. discrete approach
More Monte Carlo trials: the unexpectedly small success rate (large Type II error rate) in correctly identifying spatial variation of N response may in part be due to too few simulation runs
Different designs: this preliminary run looked at only a single plot and five blocks

Lowenberg-DeBoer, Lambert, Bongiovanni
21
Questions or Comments?