Low velocity impact damage evaluation in fiber glass ...
34
Accepted Manuscript Low velocity impact damage evaluation in fiber glass composite plates using pzt sensors M.J. Santos, J.B. Santos, A.M. Amaro, M.A. Neto PII: S1359-8368(13)00347-8 DOI: http://dx.doi.org/10.1016/j.compositesb.2013.06.036 Reference: JCOMB 2495 To appear in: Composites: Part B Received Date: 4 December 2012 Revised Date: 31 January 2013 Accepted Date: 14 June 2013 Please cite this article as: Santos, M.J., Santos, J.B., Amaro, A.M., Neto, M.A., Low velocity impact damage evaluation in fiber glass composite plates using pzt sensors, Composites: Part B (2013), doi: http://dx.doi.org/ 10.1016/j.compositesb.2013.06.036 This is a PDF file of an unedited manuscript that has been accepted for publication. As a service to our customers we are providing this early version of the manuscript. The manuscript will undergo copyediting, typesetting, and review of the resulting proof before it is published in its final form. Please note that during the production process errors may be discovered which could affect the content, and all legal disclaimers that apply to the journal pertain.
Transcript of Low velocity impact damage evaluation in fiber glass ...

Accepted Manuscript
Low velocity impact damage evaluation in fiber glass composite plates using
pzt sensors
M.J. Santos, J.B. Santos, A.M. Amaro, M.A. Neto
PII: S1359-8368(13)00347-8
DOI: http://dx.doi.org/10.1016/j.compositesb.2013.06.036
Reference: JCOMB 2495
To appear in: Composites: Part B
Received Date: 4 December 2012
Revised Date: 31 January 2013
Accepted Date: 14 June 2013
Please cite this article as: Santos, M.J., Santos, J.B., Amaro, A.M., Neto, M.A., Low velocity impact damage
evaluation in fiber glass composite plates using pzt sensors, Composites: Part B (2013), doi: http://dx.doi.org/
10.1016/j.compositesb.2013.06.036
This is a PDF file of an unedited manuscript that has been accepted for publication. As a service to our customers
we are providing this early version of the manuscript. The manuscript will undergo copyediting, typesetting, and
review of the resulting proof before it is published in its final form. Please note that during the production process
errors may be discovered which could affect the content, and all legal disclaimers that apply to the journal pertain.
1
LOW VELOCITY IMPACT DAMAGE EVALUATION IN FIBER GLASS COMPOSITE PLATES
USING PZT SENSORS
M J Santosa,*, J B Santosa, A M Amarob, M A Netob
aCEMUC, Department of Electrical and Computers Engineering, University of Coimbra, Polo II, Portugal
bCEMUC, Department of Mechanical Engineering, University of Coimbra, Polo II, Portugal
*Corresponding author. Tel.: +351 239 796266; fax: +351 239 796247. E-mail: [email protected] (M J
Santos)
ABSTRACT
In this work PZT sensors are proposed to characterize the impact effects in fiber glass composite plates. To
provide effective and reliable results the analysis was accomplished on samples submitted to multiple
impacts, then guaranteeing the same testing conditions for different impact levels. The analysis of the
impact effect has been made by two parameters; amplitude response and time shift. PZT sensors have been
bonded to the samples in a pitch-and-catch configuration and the Lamb wave symmetrical mode (S0) signal
was used. The results demonstrate that the two evaluated parameters are able to characterise the different
damage types occurring in these composites, as well as to evaluate their severity. It was also observed that
amplitude predict well the defect size, whenever fiber-breakage occurs.
Keywords: A. Polymer-matrix Composites (PMCs); B. Defects; Impact behaviour; D. Ultrasonics.
1. Introduction
Fiber reinforced composite materials have been utilized for nearly four decades owing to their beneficial
characteristics, such as stability, light weight and high stiffness. Particularly, in the automotive and
aerospace industries the use of composites is justified by reducing structural weight with consequent fuel
saving and improving performance [1]. During the service life, a composite structure is subjected to
various loading conditions, which can give rise to various defects. The detection and quantification of

2
damage induced by low velocity impacts can be a difficult task because most damages are not visible on
the external surface. In fact, the impact energy is absorbed through remarkable internal damage
mechanisms without exterior signs detectable by visual inspection. Various types of damages, like
delaminations, fiber-breakage, matrix cracking and fiber-matrix interfacial debonding can occur, leading to
structural failure. The impact damage is considered as the primary cause of in service damage composites
and can reduce the compressive residual strength up to 60%. [2-5]. The flexural strength can also be
significantly reduced [6]. Delaminations are prone to occur at interfaces between different oriented layers
due to mismatch bending that lead to development of interlaminar shear stresses at those interfaces [7].
Under tensile loading the existence of the delamination promotes a drop of strength [8-11], but its size does
not influence significantly the value of tensile strength [11]. The poor tolerance to accidental low velocity
impacts of the composite laminates is yet a limitation to their use in many applications in some industries
[12]. The reduced compressive strength due to impact is believed to be the result of multiple delaminations
presence. Suemasu et al [13] concluded that the load carrying capability of the delaminated plate is reduced
by the delamination propagation, and the strength of the damaged plate is strongly dominated by the
beginning of the delamination growth. On the other hand, during the manufacturing process, routine
maintenance operations or in-service conditions, some components can be subjected to repeated impacts at
localized positions [14,15]. Sevkat et al [15] studied the effect of repeated impacts on the response of
composites and concluded that the lay-up sequence has significant effect on the repeated impact response
of the hybrid composites, and that repeated impacts can caused very quick damage accumulation and
promotes a progression of the damage. When the load reaches a critical level, the crack will extend and the
failure occurs.
Recently, damage detection through ultrasonic guided waves, such as Lamb waves, has been gained
increasing importance due to the possibility of inspecting large composite structures. Once excited, the
Lamb waves can propagate all over considerable distances. Thus, a receiver positioned on the structure at a
remote position can collect the propagation signals over the path between transmitter and receiver,
providing information about eventual surface defects or internal cracks. Several studies using Lamb waves
for damage detection in composite materials have been reported in literature. Valdes at al [16] used the
Lamb wave time of flight to locate a delamination in a composite beam. Zang et al [17] employed also time
domain analysis and artificial neural networks (ANN) to detect structural damages. Short-time Fourier
3
transform (STFT) were used by Kim et al [18] for damage detection in rolling bearings. With the aid of
Wavelet transform, Lemistre el al [19] and Su et al [20] located delamination in carbon fiber composite
plates. Paget et al [21] developed a new wavelet transform for energy impact prediction in a composite
panel.
The generation of Lamb waves by conventional transducers has some limitations because they are
relatively large and expensive. An emerging technique based on piezoelectric lead zirconate titanate (PZT)
sensors has the potential to improve significantly the structural health monitoring (SHM). These sensors
are small, lightweight, inexpensive, and can be produced in different geometries. They can be bonded on
the structures surface, mounted inside built-in structures and can even be embedded between the structural
and non-structural layers of a complete construction [22]. Banks et al. [23] were probably the first ones to
evaluate damages with PZT sensors. Since then, several authors have studied the applicability of these
sensors in different fields, namely in damage detection [24], defects location using distributed sensors
[25,26] and wavelet signal processing [26], delamination evaluation based in the ratio of the power
spectrum densities for different propagation modes [27] and by analysing modal frequencies [28] or
detection of transverse crack and delamination in cross-ply laminates [29]. More recently, localization and
monitoring of damages in honeycomb structures using PZT arrays [30], instantaneous delamination
detection by comparing time delays of A0 mode [31] and diagnosis of damage using in a modified time
reversal method [32], are examples of potential practical applications of the PZT sensors.
This work aims to evaluate the severity of defects caused by multiple impacts in fiber glass composites by
measuring some parameters, like signal amplitude and propagation time shift. The main contribution of this
paper deals with the use of guided waves (Lamb waves) to characterize the effects of multiple impacts in
laminate composites that to the best of our knowledge, there have no previous attempts.
2. Theory
Many authors have considered the use of Lamb waves for non-destructive testing. Rose [33], summarized
the potential of these waves for damage detection and characterization in terms of the possibility of
inspection an entire cross sectional area with a single direction displacement, inspection of large insulated
or coated structures, no requiring complex motion devices, good sensitivity, low energy consumption and
low cost. However, the use of those guided waves can be troublesome due to the propagation of multiple
4
modes, the dispersive character of the modes, and also the waves reflected in boundaries that can mask the
signal of interest. Normally, the fundamental symmetric (S0) and anti-symmetric (A0) modes are selected to
be used in practice due to their better time discrimination when compared with higher order modes.
PZT ceramics provide excellent performance in Lamb wave generation and acquisition. They are called
active sensors due to its dual sensing and excitation characteristics. Typically, working in the kHz range, it
is possible to obtain a few hundreds of mV in sensing, using a tone burst excitation signal of 10 V.
The strain ε(x) induced by a plate-mounted PZT perfectly bonded to the structural surface has a response
given by [22]
( ) ( )( ) ( )tkxia ekLix ωεε −= 2/sin (1)
where εa is the induced strain over the PZT length L and k is the wavenumber of the propagation mode in
the plate. The response follows a sinusoidal variation with respect to the parameter 2/Lk and the
response peaks are observed at odd multiples of π/2.
The optimal excitation frequencies can be obtained by
,...)2,1,0(21 =⎟
⎠⎞⎜
⎝⎛ += nn
L
vf
(2)
where v is the Lamb wave velocity of the propagating mode in the material. The thickness selection has to
take into account the maximum voltage allowed by the PZT without depolarising, that is around 250-300
V/mm [34].
Velocity measurements and consequent identification of ultrasound bulk waves are usually possible using
the time of flight method. Considering the time difference between nth peaks of the signal for two different
locations, the propagation velocity can be easily calculated, if the shape of the signal remains the same. In
the presence of dispersive waves like Lamb waves, frequency domain techniques are demanded for correct
velocity evaluation and respective mode identification. Using the phase spectrum method [35] the phase
velocity is given by
ϕπΔ
= Dfvp
2 (3)
where Δϕ is the difference in the phase spectrum of two signals collected for a distance between them of D
and f is the frequency.
5
3. Materials and experimental procedure
3.1 Composite laminates and mechanical properties
The laminates are composed of glass fiber Prepreg TEXIPREG® ET443 (EE190 ET443 Glass Fabric
PREPREG from SEAL, Legnano, Italy) and have been processed in agreement with the manufacturer
recommendations, using the autoclave/vacuum-bag moulding process. That processing consists of several
steps: make the hermetic bag and apply 0.05 MPa vacuum; heat up to 125ºC at a 3–5ºC/min rate; apply a
pressure of 0.5 MPa when the temperature of 120–125ºC is reached. Then, the pressure and temperature
are maintaining for 60 min, and finally cool down to room temperature maintaining the pressure. The
laminates were fabricated on the four stacking sequences referred in Table 1, having a useful square shape
of 300×300×t [mm] (where t is the thickness). Three specimens of each stacking type have been used for
testing. The mechanical properties of the glass/epoxy unidirectional composite laminates were obtained
according the standards ASTM D3039; ASTM D3518 and ASTM D4255, and are presented in Table 2.
Five specimens with 16 unidirectional plies [0]16 were analyzed, making use of an electromechanical
tensile testing machine (INSTRON 4206) of 50 kN load capacity. The tensile load was applied under
stroke control with strain rates of 1.5 mm/min and 2 mm/min for the shear modulus and the other
parameters, respectively.
3.2 Lamb waves in composite laminates
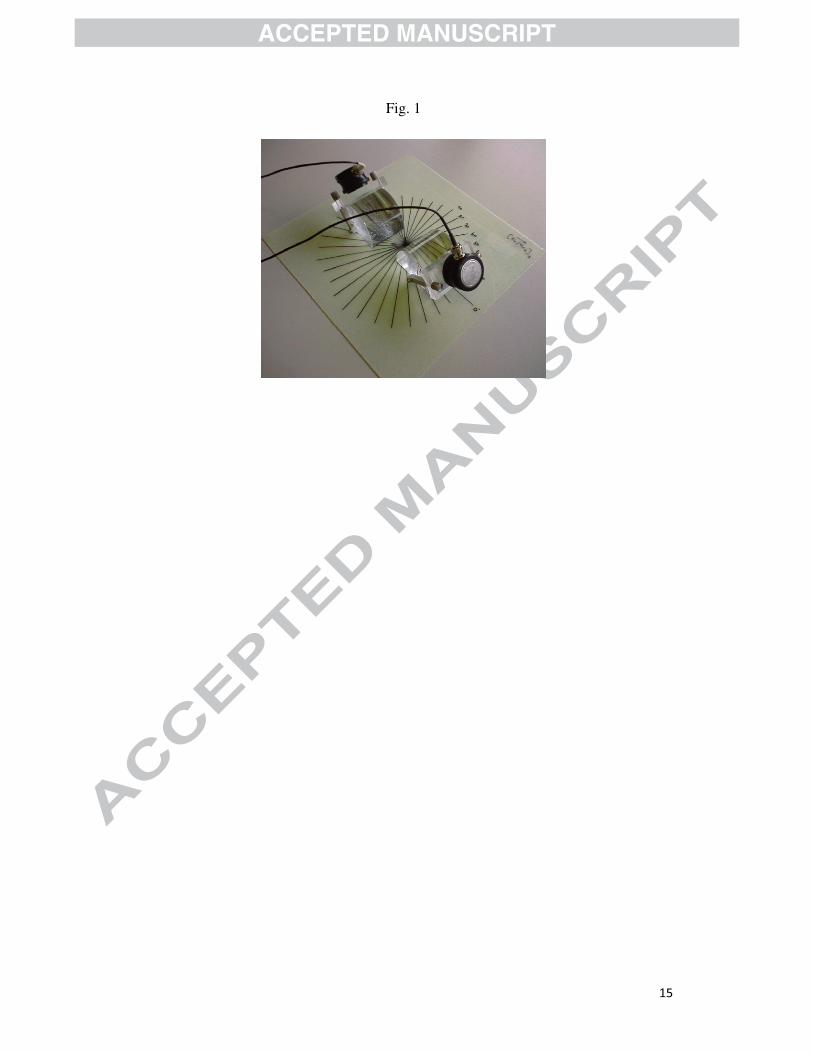
For detection and identification of the Lamb waves in the laminates the setup shown in Fig.1 has been
used. Two Panametrics transducers with central frequency of 500 kHz were coupled to the laminate plates
by plexiglas blocks with variable inclination. The transducers were glued to the blocks and coupling gel
was utilized between blocks and the laminate plates. A Panametrics pulser/receiver generated the signals
and a digital oscilloscope was used to visualize them after propagation on the plate. Then, the signals were
transferred via a USB port to the computer for processing.
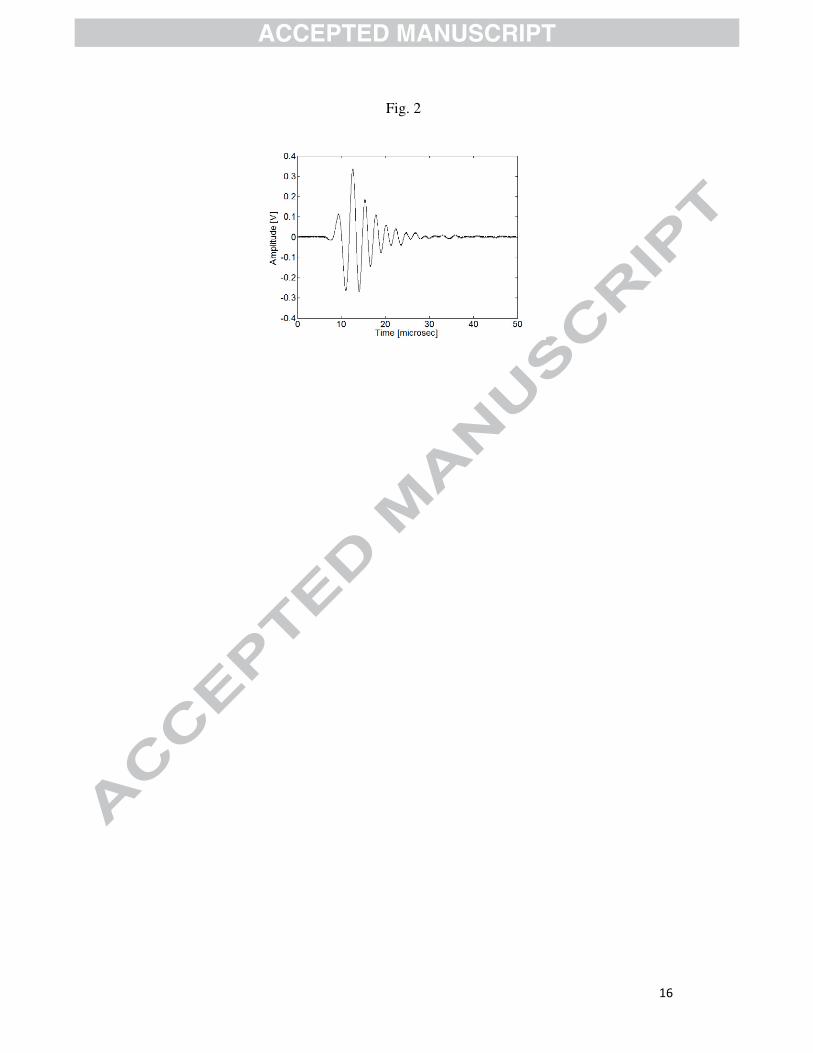
The symmetrical S0 mode was selected, because the excitation of A0 mode is not possible according to the
co-incidence principle [36]. A typical collected signal is presented in Fig. 2.
The correct inclination for the blocks was obtained maximizing the amplitude of the collected signals. For
the selected A sample the inclination was around 40º, which is according to the co-incident principle. The
phase velocity presented in Fig. 3, was obtained using the phase spectrum method for two signals collected

6
5 cm apart in 0º direction. The considered frequency range for the spectrum was 200 to 500 kHz due to the
downshift frequency related to the filtering effect of the laminate composites. The small decreasing
behaviour of the phase velocity is expected according to the theory in the low frequency regime.
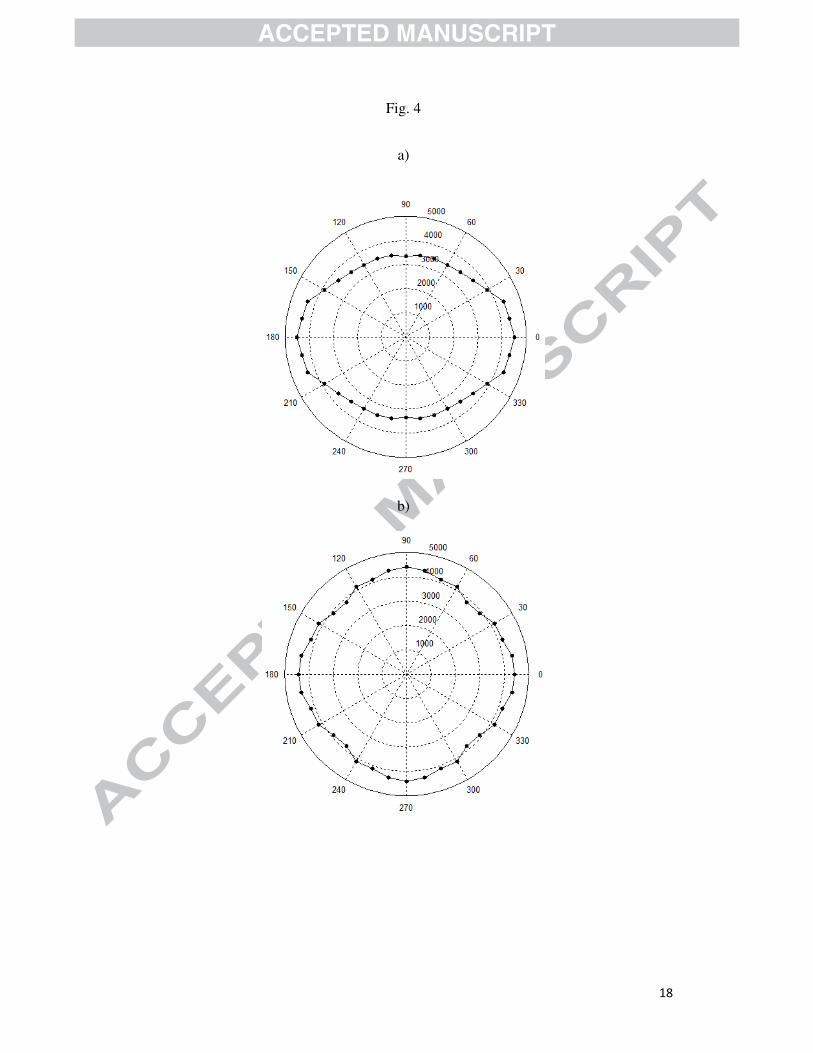
Using the previous set-up described in Fig.1 and proceeding with a rotation increment of 10º between each
measurement, the wave propagation directivity patterns for S0 mode were obtained for all analysed
samples. For comparison purposes, an additional unidirectional fiber sample was tested, having a [0]16
stacking sequence and 2.1 mm in thickness. Fig.4 illustrates the results for samples A and the [0]16 one. As
expected, for the unidirectional sample, the velocity for 0º direction is higher than the corresponding one
for 90º direction, while for samples A the velocity is roughly the same in the cross directions. The results
for the B, C and D samples were found to be similar to samples A.
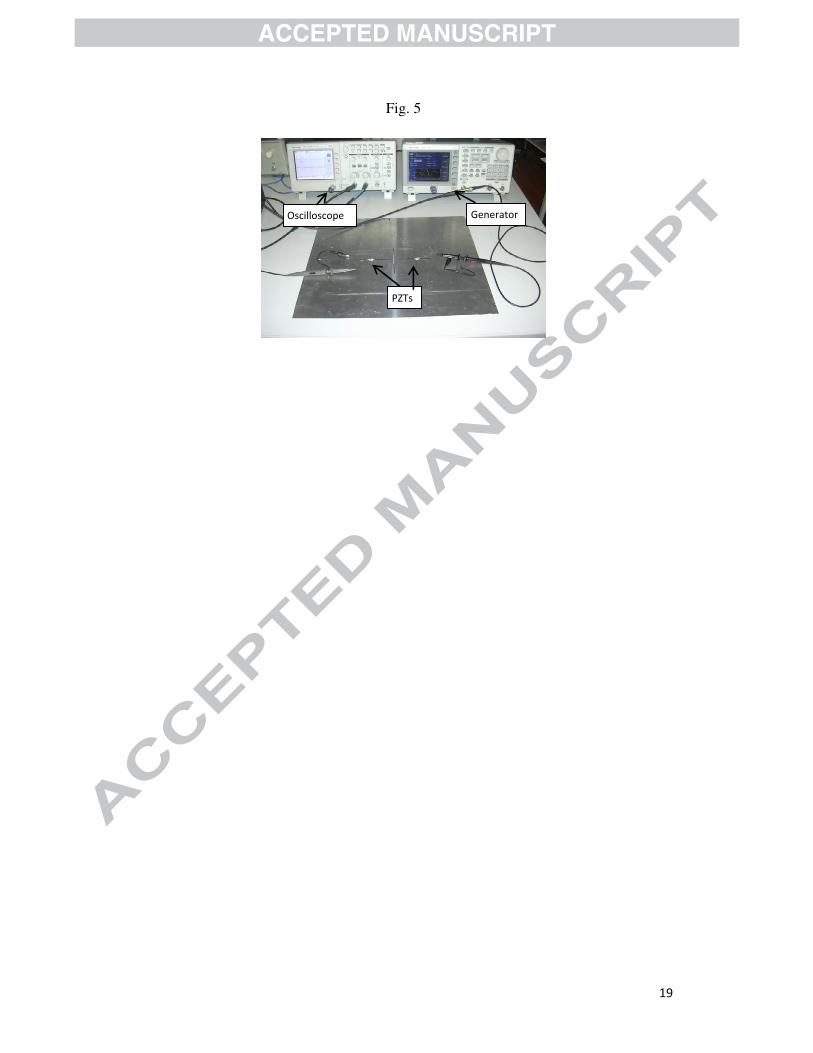
3.3 Guided wave propagation with PZTs
For Lamb waves generation the used PZT sensors were cut in square pieces of 7×7 mm from a PZ29 bar of
0.4 mm in thickness. For excitation, an arbitrary waveform generator (Tektronix AFG3022) was used to
produce a 3-cycle toneburst with a Hanning window that was previous synthesized in Matlab. This
windowing technique is used to narrow the signal bandwidth and to concentrate the maximum amount of
energy into the desired frequency with a minimum spreading to neighbor frequencies. The signal was 10 V
in amplitude. The PZT sensors were mounted in a pitch and catch configuration and the signals were
collected as mentioned in section 3.2. The complete setup using a 1 mm thickness aluminium plate is
presented in Fig. 5.
Fig. 6 shows the behaviour of the experimental normalized voltage amplitude at the receiver for a
frequency sweeping from 100 kHz to 500 kHz as well as the theoretical values obtained from equation (1).
The difference between the traces is related specifically to the imperfect coupling between the PZT and the
plate, and also to the small discrepancies in PZT length. Nevertheless, if optimal resonance frequency is
desired, which is mostly the case; the method could be used with reasonable accuracy. Similar results are
reported by Giurgiutiu [22] that mentions the necessity of an effective PZT length adjustment to about 90%
of its real length.
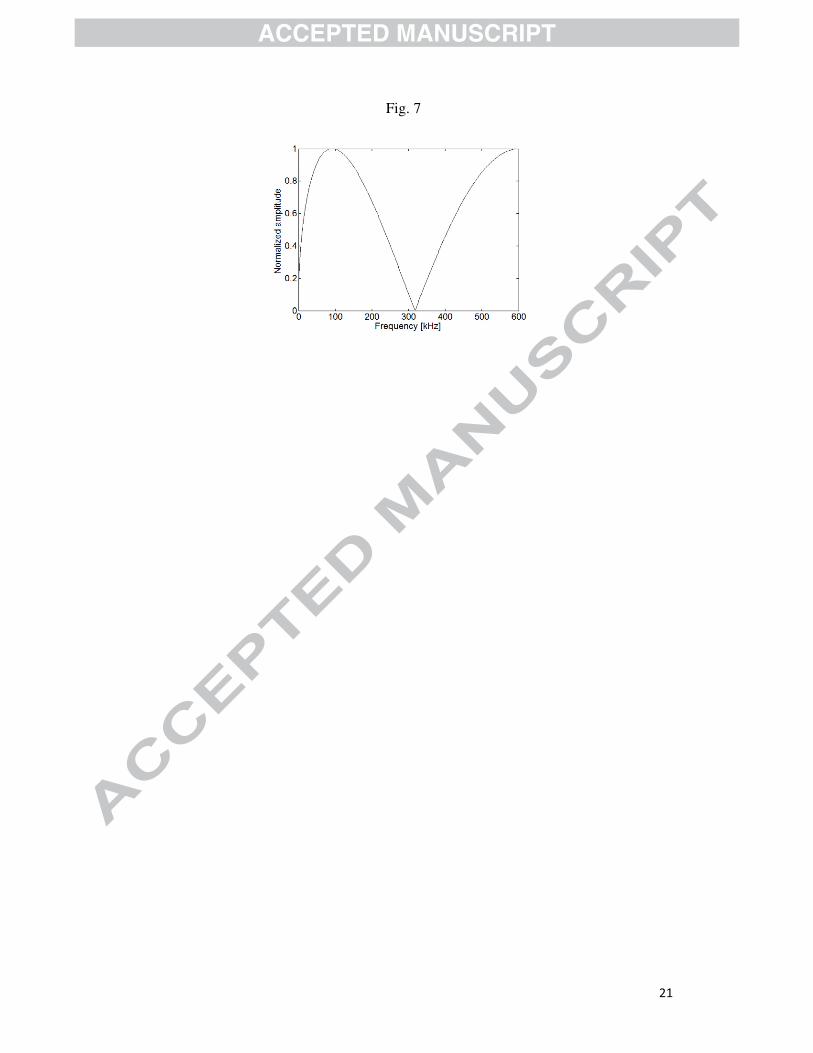
For the considered aluminium plate, the A0 mode has the predicted response shown in Fig.7.
Experimentally, it was not possible detecting this mode, as expected. The reason for that is probably related
to the coupling medium used between the PZT and the plate.
7
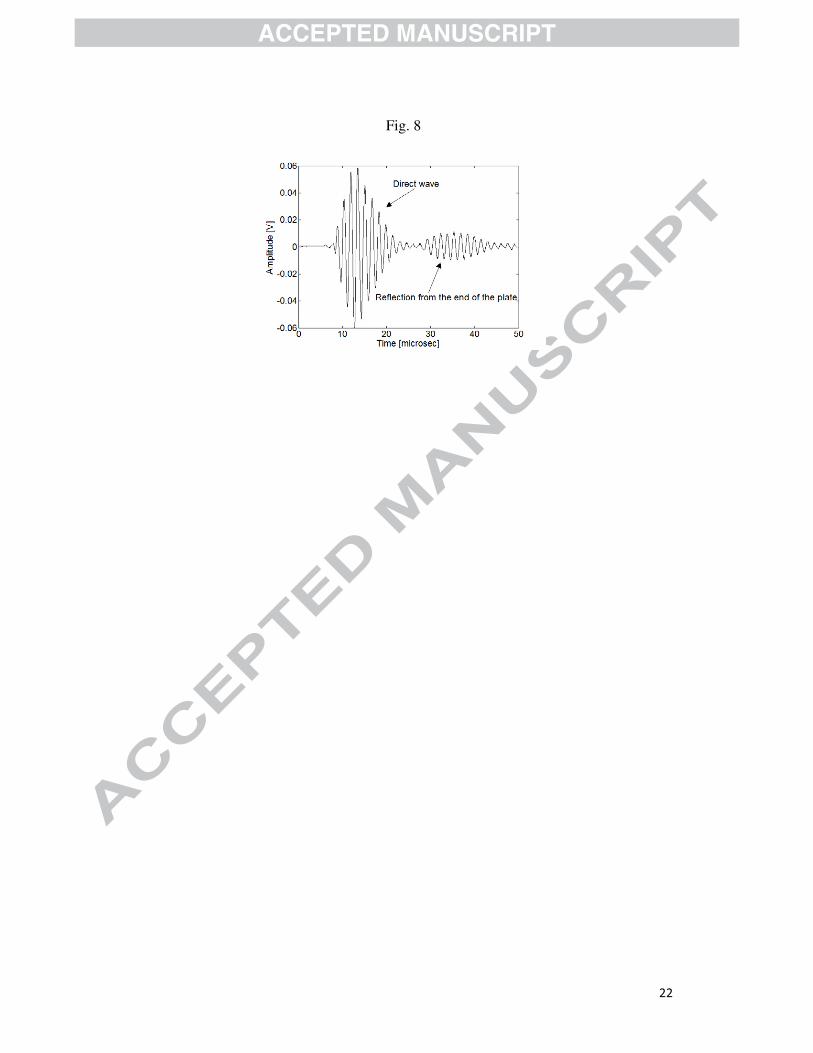
For the composite plate, the PZT sensors were mounted 100 mm apart on the surface using conductive
glue. A frequency sweep allowed verifying that the maximum signal in the receiver was obtained at 320
kHz. Using time of flight, it has easily been proved that the signal corresponded to the fundamental
symmetrical mode S0. A typical signal propagating in a composite plate is presented in Fig. 8, showing the
direct signal and the reflection from the plate edge.
4. Results and discussion
4.1 Impact tests analysis
Low velocity impact tests were produced using a drop-weight testing machine Instron-Ceast 9340 with a
hemispherical impactor of 10 mm in diameter and a mass of 3.4 kg. The specimens were centrally
supported. Fig. 9 represents the typical energy versus time curves obtained for samples A. The beginning
of the curve plateau energy coincides with the loss of contact between the striker and the specimen, and
this energy level corresponds to the absorbed one by the specimen [37]. In this context the dissipated
energy is calculated as the difference between the absorbed energy and the energy at the peak load.
As the used glass plates are translucent the damage images were obtained by photography collected from
the opposite side of the impact (back face). Images for the A, B, C and D samples showing the damages
after suffering the last impact are shown in Fig. 10. The different damage shapes and sizes are essentially
due to the stacking sequences, thicknesses and used energies. Fig. 10 (a) and (b) show a damage, which
shape presents two lobes oriented on the fibers direction of the adjacent lower ply (0º), while samples in (c)
and (d) do not reveal those two lobed shape because of the presence of multiple superposed delaminations
at the several interfaces among the different oriented layers.
According to Sevkat et al [15], when the energy absorbed by the composite is small, the impactor bounced
back and the damage area is also small. If a major energy of impactor is absorbed by the composite various
modes of damage can appear with the consequent increase in size. Such is demonstrated by the graphical
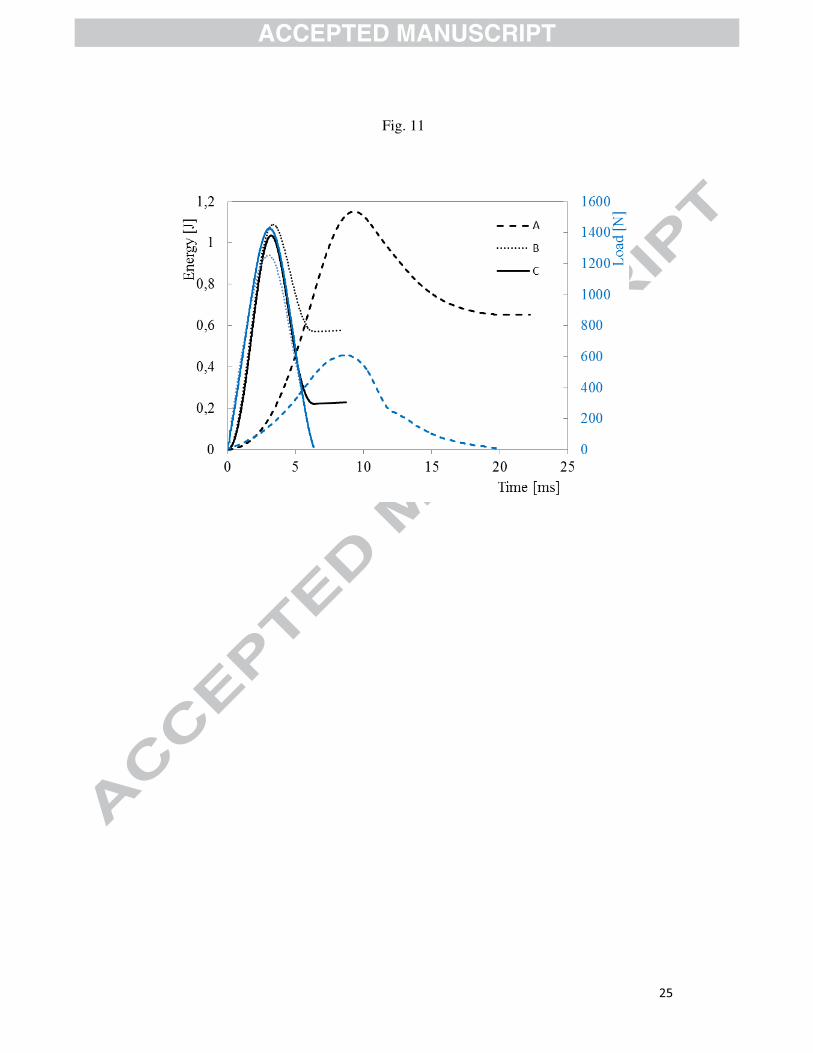
results outlined in Fig. 11 and 12. Fig. 11 shows the typical energy-time and load-time curves for the 15th
impact carried out with energy of 1 J for samples A, B and C. It can be observed the higher load is obtained
for the specimen C corresponding to the lower absorbed energy. On the other hand, the specimen A shows
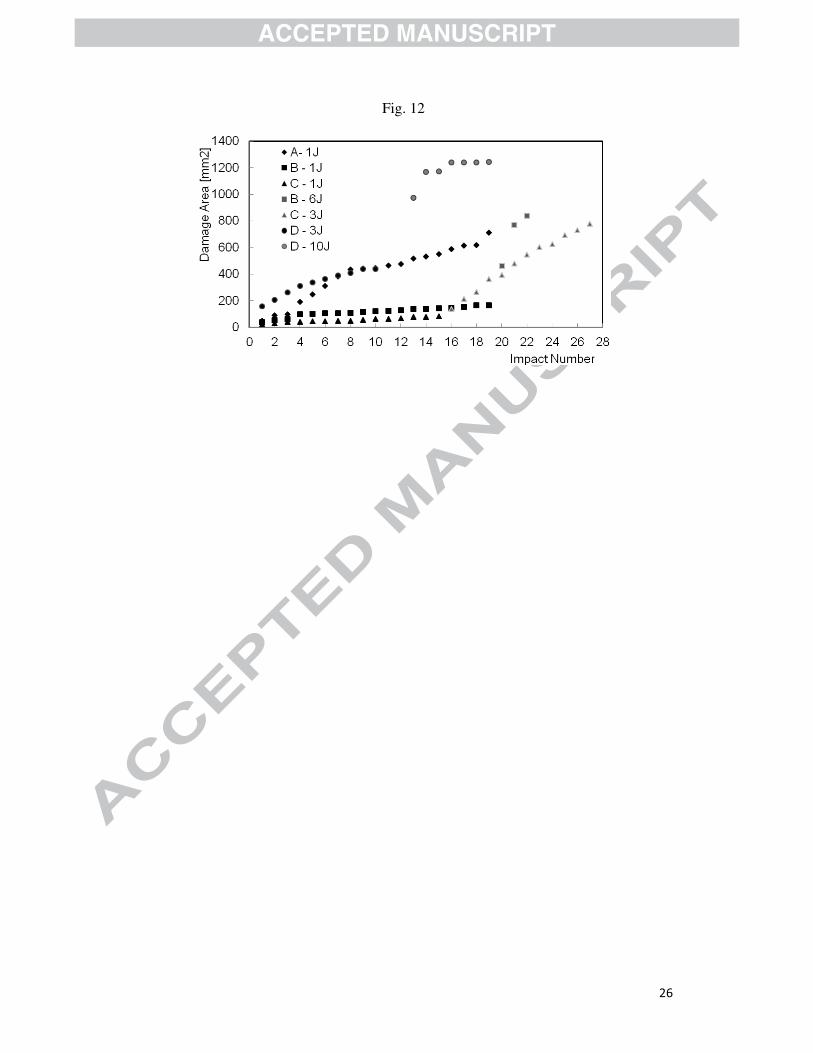
a higher absorbed energy and a lower load. The curves for the other impact numbers are similar. In Fig. 12
is presented the relation between the damage area and the number of impacts for all tested samples. For all
kind of samples it is observed a damage area increasing with the number of impacts. However, that

8
increasing is more pronounced for the samples A than for samples B and C, considering the same impact
energy (1 J), due to the lower thickness presented by the A ones. Also, samples B, C and D were submitted
to higher energies, ranging from 3 to 10 J, leading to a jump in the damage area. The observed damage area
variations, for all tested samples, agree with the higher absorbed energy with the impacts number according
to the results shown in Fig. 9 and 11.
In order to observe changes in the morphological composition of the composites after impacts, namely
fibers-breakage, a metallographic analysis was performed using optical microscopy in Zeiss HD100
equipment. The results showed that fibers-breakage appear after the 1st impact for samples A, 21st impact
for samples B, 3rd for samples C, and 14th impact for samples D.
4.2 Pitch and catch evaluation of the multiple impacts
For evaluation of the impact effects in the fiber composite plates it was used the methodology presented in
section 3.3. A pair of PZT sensors was previously bonded on each plate and after each impact the signals
were acquire and processed. Next, the damage area was correlated with ultrasound parameters, like the
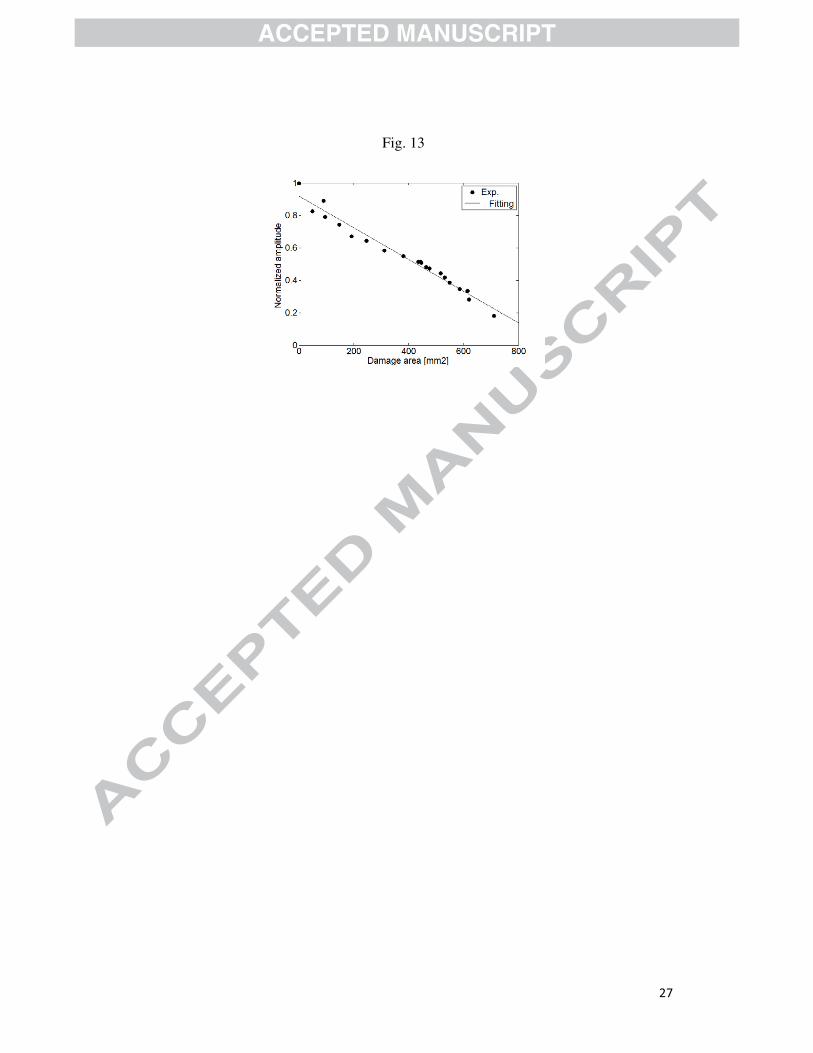
amplitude and time shift as they provided the best results. The normalized peak to peak amplitude versus
damage area for samples A is illustrated in Fig. 13. A high linear correlation between these two parameters
(R2=0.968) was obtained. Concerning to samples C, a high correlation was also observed. Unlike, samples
B and D presented very low correlation values. As samples A and C present broken fibers from the
beginning of the tests and samples B and D only for the last impacts, it can be inferred that the broken
fibers influence greatly the amplitude parameter.
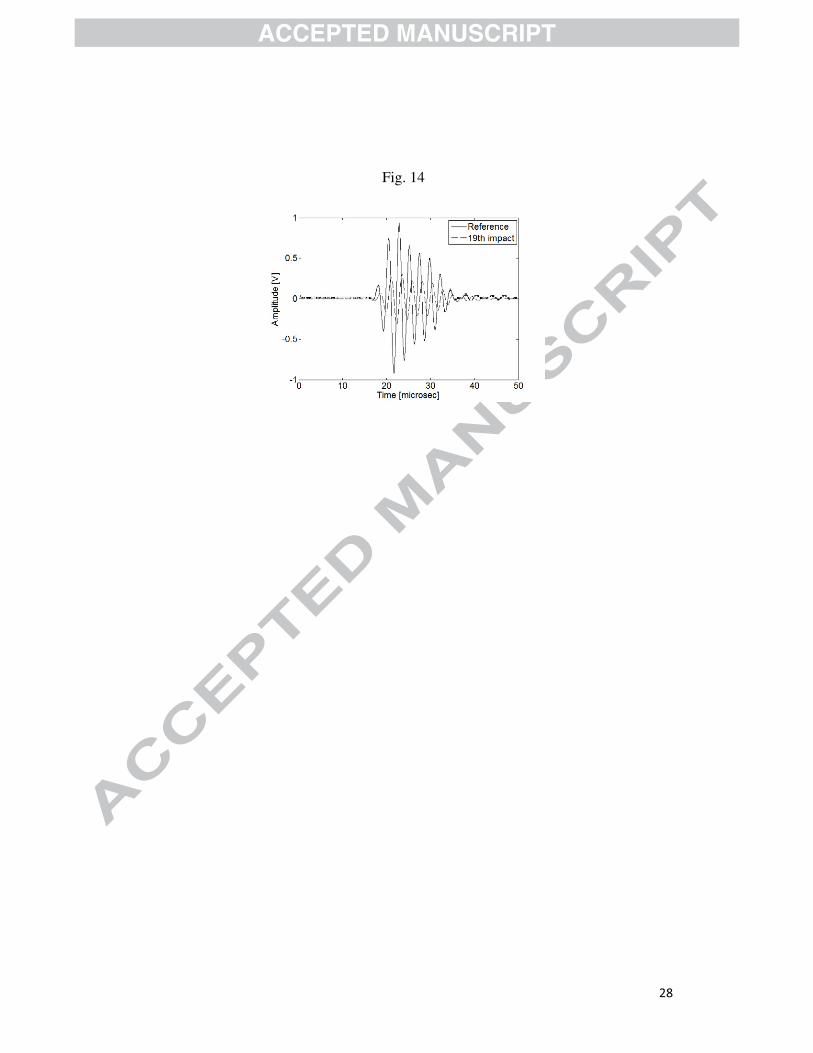
The time shift parameter was measured correlating the received signal with a benchmark signal (obtained
from a reference plate without damage). For this purpose, a cross-correlation processing technique was
used in order to improve the time resolution and also due to the slightly dispersive behaviour of the S0
Lamb wave mode. This technique, widely used in signal processing [38,39], measures the similarity
between two waveforms as a function of the time-lag applied to one of them. The discrete cross-
correlation function between two signals y1(i) and y2(i) is given by
∑∑
∑
==
=
+
+=
N
i
N
i
N
i
siyiy
siyiysR
1
22
1
21
121
)()(
)()()( (4)
9
where s is the time shift between signals and N is the number of samples. The time shift s is obtained for
the maximization of the function R(s). Fig. 14 depicts the time shift between the reference signal and the
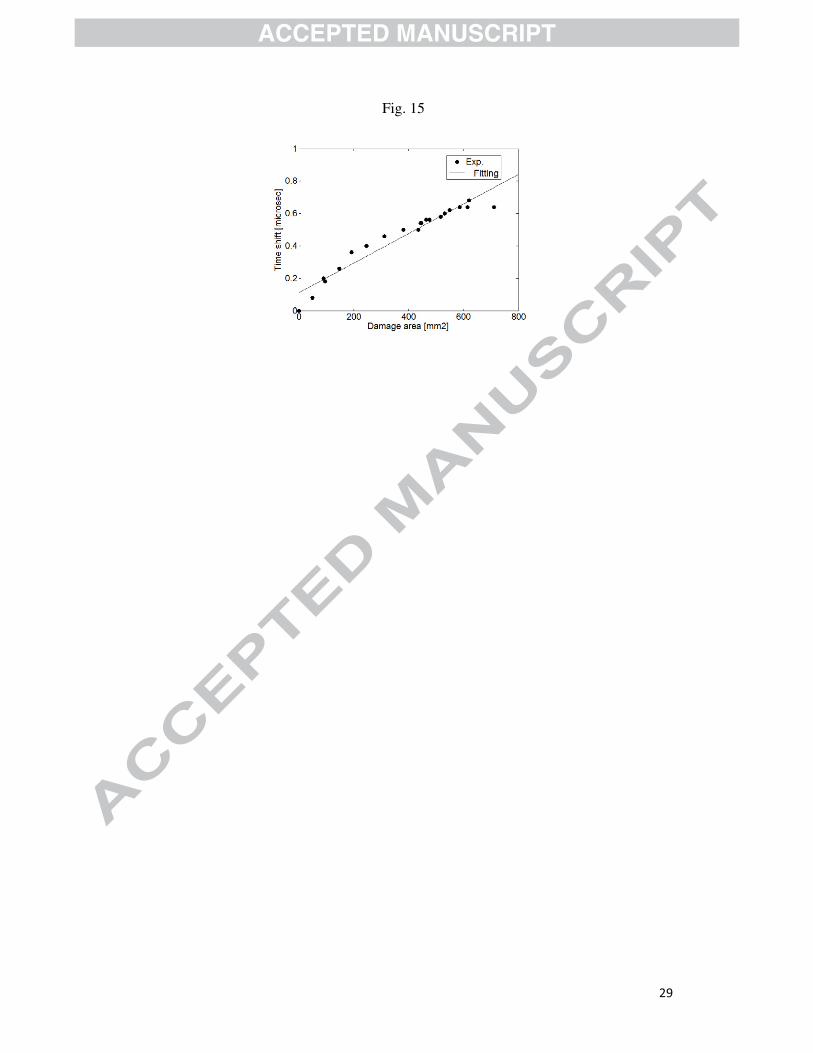
signal after the 19th impact carried out on a selected A sample. The damage area versus time shift is shown
in Fig. 15. It is observed an increase of the time shift with the damage severity, which is a consequence of a
plate deformation that changes the ultrasound wave propagation path. The time shift approach was also
applied to the other ones. For samples A, C and D a high linear correlation between the time shift and
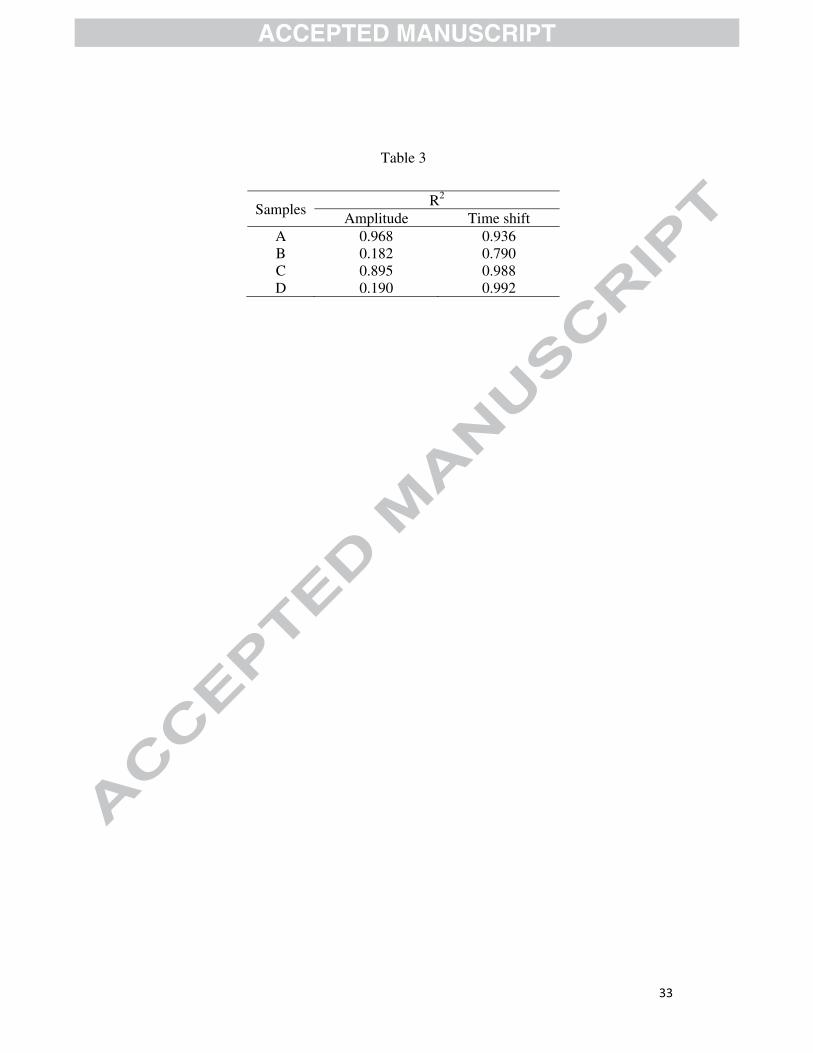
defect size was observed. For samples B, that correlation is lower. The results for amplitude and time shift
parameters are summarized in Table 3.
Concerning the fibers-breakage, the amplitude appears as a useful parameter to predict its occurrence. In
fact, for the samples A and C where the fibers-breakage was observed after the 1st a 3rd impacts,
respectively, the correlations between the damage area and amplitude are high. On the contrary, for
samples B and D where the fibers-breakage happened only for a higher impacts number, the correlations
are low.
Considering the results for the time shift (see table 3), good correlation is always possible for damage size
(moderated for samples B) independent of fibers-breakage occurrence.
5. Conclusions
The presented work demonstrates the suitability of PZT sensors for impact defects evaluation in fiber glass
composite plates.
Experiments using conventional ultrasonic transducers with variable inclination, together with phase
spectrum method allowed identifying S0 Lamb wave mode in low frequency regime. The obtained
directivity patterns are according to expectations. An appropriate setup was used for S0 mode tuning of
PZT sensors bonded in aluminium and fiber glass plates giving results according to the theory. Different
types of samples fabricated with different stacking sequences were impacted using a pressure-assisted
drop-weight testing machine. It was observed that the absorbed energy increases with the number of
impacts with the consequent increase in the damage area. The stacking sequence influences the damage
area due to the increased number of interfaces between layers with different orientations, which can
promote the appearing and propagation of damages.
10
Multiple impacts were performed in each fiber glass composite samples to guarantee the same test
conditions for different impact levels. After each impact, amplitude and time shift were measured. A high
accuracy technique based on cross-correlation function was used to the time shift evaluation. Amplitude
measuring shows high linear correlation with defect size only when fiber-breakage exists. On the other
hand, time shift seems to be a better parameter for defect size estimation. This work proved that the
amplitude and time shift parameters can usefully be used to estimate the damage areas and to predict the
existence of fibers-breakage in laminates. Future work will be developed using others stacking sequence
and different composite materials as the CFRP in order to evaluate the practicability of the used parameters
for damage characterization.
References
1. Shimokawa T, Hamaguchi Y. Distributions of Fatigue Life and Fatigue Strength in Notched Specimens
of a Carbon Eight-Harness-Satin Laminate. J Compos Mater 1983;17: 64-76.
2. Amaro AM, Reis PNB, Moura MFSF, Santos JB. Damage Detection on Laminated Composite Materials
Using Several NDT Techniques. Insight 2012;54:14-20.
3. Abrate S. Impact on Laminated Composite Materials. Appl Mech Rev 1991;44:155-191.
4. Cantwell WJ, Morton J. Comparison of the low and high velocity impact response of CFRP. Composites
1989;20:545-551.
5. de Moura MF, Marques AT. Prediction of low velocity impact damage in carbon–epoxy laminates.
Compos Part A: Appl S 2002;33:361-368.
6. Amaro AM, de Moura MF, Reis PB. Residual Strength after Low Velocity Impact in Carbon-Epoxy
Laminates Mater Sci Forum 2006;624:514-516.
7. Moura MFSF, Gonçalves JPM. Modelling the Interaction between Matrix Cracking and Delamination in
Carbon-epoxy Laminates under Low Velocity Impact. Compos Sci Technol 2004; 64: 1021-1027.
8. Reis PNB, Ferreira JAM, Antunes FV, Richardson MOW. Effect of Interlayer Dalamination on
Mechanical Behavior of Carbon/Epoxy Laminates. J Compos Mater 2009; 43: 2609-2621.
9. Mittelman A, Roman I. Tensile Properties of Real Unidirectional Kevlar/Epoxy Composites.
Composites 1990; 21: 63-69.
11
10. Ryder JT, Crossman FM. A Study of Stiffness, Residual Strength and Fatigue Life Relationships for
Composite Laminates. NASA CR-172211, 1983.
11. O’Brien TK, Rigamonti M, Zanotti C. Tension Fatigue Analysis and Life Prediction for Composite
Laminates. Int J Fatigue 1989; 11: 379-393.
12. Collombet F, Bonini J, Lataillade JL. A Three-dimensional modelling of low velocity impact damage
in composite laminates. Int. J Numer Meth Eng 1996; 39:1491-1516.
13. Suemasu H, Sasaki W, Ishikawa T, Aoki Y. A numerical study on compressive behavior of composite
plates with multiple circular delaminations considering delamination propagation. Compos Science and
Technology 2008;68(12):2562-2567.
14. Icten BM. Repeated impact behavior of glass/epoxy laminates. Polym Compos 2009;30:1562-1569.
15. Sevkat E, Liaw B, Delale F, Raju B. Effect of Repeated Impacts on the Response of Plain-Woven
Hybrid Composites. Compos Part B: Eng 2010;41:403-413.
16. Valdes SH, Soutis C. A structural health monitoring system for laminated composites. In: Proceedings
of DETC. Pittsburgh, PA, USA, 2001. p. 2013–2021.
17. Zang C, Friswell MI, Imregun, M. Structural damage detection using independent component analysis.
Structural Health Monitoring: An International Journal 2004; 3(1):69–83.
18. Kim YY, Kim EH. Effectiveness of the continuous wavelet transform in the analysis of some
dispersive elastic waves, J Acoust Soc Am 2001;110(1):1–9.
19. Lemistre M, Balageas DL. Structural health monitoring system based on diffracted Lamb wave analysis
by multiresolution processing. Smart Mater Struct 2001;10;504–511.
20. Su Z, Ye L, Bu X. A damage identification technique for CF/EP composite laminates using distributed
piezoelectric transducers. Compos Struct 2002;57:465–471.
21. Paget CA, Grondel S, Levin K, Delebarre C, Damage assessment in composites by Lamb waves and
wavelet coefficients, Smart Mater Struct 2003;12:393–402.
22. Giurgiutiu V. Structural Health Monitoring with Piezoelectric Wafer Active Sensors. Academic Press,
2008.
23. Banks HT, Smith RC, Wang Y. Smart material structures: Modeling, estimation and control. Masson,
Paris: John Wiley & Sons, 1996.
12
24. Kessler SS, Spearing SM, Soutis C. Damage detection in composite materials using Lamb wave
methods. Smart Mater Struct 2002; 11: 269–278.
25. Diamanti K, Hodgkinson, JM, Soutis C. Detection of low-velocity impact damage in composite plates
using Lamb waves. Struct Health Monit 2004; 3: 33-41.
26. Su Z, Ye L, Bu X., A damage identification technique for CF/EP composite laminates using distributed
piezoelectric transducers. Compos Struct 2002;57:465–471.
27. Kim YH, Kim DH, Han JH, Kim CG. Damage assessment in layered composites using spectral
analysis and Lamb wave. Compos: Part B 2007;38:800–809.
28. Valdes SHD, Soutis C. Delamination detection in composite laminates from variations of their modal
characteristics. J. Sound Vib. 1999;228:1-9.
29. Toyama N, Noda J, Okabe T. Quantitative damage detection in cross-ply laminates using Lamb wave
method. Compos Sci Tech 2003;63:1473–1479.
30. Chakraborty N, Rathod VT, Mahapatra DR, Gopalakrishnan S. Guided wave based detection of
damage in honeycomb core sandwich structures. NDT Int 2012;49:27-33.
31. Yeum CM, Sohn H, Ihn JB, Lim HJ. Instantaneous delamination detection in a composite plate using a
dual piezoelectric transducer network. Compos Struct 2012; 94:3490-3499.
32. Watkins R, Jha R. A modified time reversal method for Lamb wave based diagnostics of composite
structures. Mech Syst Signal Pr 2012;3:345-354.
33. Rose JL. A vision of ultrasonic guided wave inspection potential. In: Proceedings of the Seventh
ASME NDE Topical Conference NDE-Vol. 20 2001. p. 1–5.
34. Su Z, Ye L, Su YL. Guided Lamb waves for identification of damage in composite structures: A
review. J Sound Vib 2006; 295:753-780.
35. Sachse W, Pao YH. On determination of phase and group velocity of dispersive waves in solids. J
Acoust Soc Am 1978;49(8):4320-4327.
36. Santos M, Ferreira A, Perdigão J. Practical considerations on ultrasonic guided wave propagation:
immersion and contact methods. Mater Eval 2004;62(4):443-449.
37. Río TG, Zaer R, Barbero E, Navarro C. Damage in CFRPs due to low velocity impact at low
temperature. Compos Part B-Eng 2005; 36: 41-50.

13
38. Foster SG, Embree PM, O'Brien WD. Flow Velocity Profile via Time-Domain Correlation: Error
Analysis and Computer Simulation. IEEE Trans Ultrason Ferroelect Freq Contr 1990;37(3):164-175.
39. Hein IA, O’Brien WD, A Real-Time Ultrasound Time-Domain Correlation Blood Flowmeter: Part II.
IEEE Trans Ultrason Ferroelect Freq Contr 1990;40(6):776-785.
14
Figures caption Fig. 1. Experimental setup for Lamb wave detection and identification.
Fig. 2. Typical collected signal for the laminate composite plate.
Fig.3. Experimental S0 phase velocity for samples A.
Fig. 4. S0 wave propagation directivity patterns for samples: (a) [0]16; (b) A.
Fig. 5. Experimental setup using an aluminium plate.
Fig. 6. Normalized S0 Lamb wave tuning for a 7 mm length PZT placed on 1 mm thickness aluminium plate.
Fig. 7. Normalized A0 Lamb wave tuning for a 7 mm length PZT placed on 1 mm thickness aluminium plate.
Fig. 8. Fundamental symmetrical S0 mode in the composite plate.
Fig. 9. Typical energy versus time curves for samples A.
Fig. 10. Damages occurred after the last impact for samples: (a) A (19th); (b) B (22nd); (c) C (27th); (d) D (19th).
Fig. 11. Typical load-time and energy-time curves for laminates impacted at 1 J, after the 15th impact.
Fig. 12. Damage area versus number of impacts for all studied samples.
Fig. 13. Signal amplitude versus damage area for samples A.
Fig. 14. Signals for a reference selected sample A and after 19th impact.
Fig. 15. Time shift versus damage area for samples A
15
Fig. 1
16
Fig. 2

17
Fig. 3
18
Fig. 4
a)
b)
19
Fig. 5
Oscilloscope Generator
PZTs

20
Fig. 6
21
Fig. 7
22
Fig. 8

23
Fig. 9

24
Fig. 10
(a)
(b)
(c)
(d)
25
Fig. 11
26
Fig. 12
27
Fig. 13
28
Fig. 14
29
Fig. 15

30
Table caption Table 1 - Composite laminated samples.
Table 2 - Mechanical properties from unidirectional glass/epoxy laminate.
Table 3 - Values of R2 for all samples.

31
Table 1
Samples Stacking sequences Thickness [mm] A [02,902]s 1 B [02,902]2s 2.1 C [0,90,0,90]2s 2.1 D [452,902,-452,02]2s 4.2

32
Table 2
E1 [GPa] E2=E3 [GPa] G12 = G13 [GPa] G23 [GPa] υ12 35.22 6.04 2.31 2.79 0.26
SD [%] 2.15 5.30 1.11 4.19 6.15
33
Table 3
Samples R2
Amplitude Time shift A 0.968 0.936 B 0.182 0.790 C 0.895 0.988 D 0.190 0.992