LOW SPEED vs HIGH SPEED TESTING OF LP TURBINE … fileLOW SPEED vs HIGH SPEED TESTING OF LP TURBINE...
12
LOW SPEED vs HIGH SPEED TESTING OF LP TURBINE BLADE WAKE INTERACTION M.Vera and H.P.Hodson Whittle Laboratory University of Cambridge U.K. Sponsored by ITP
Transcript of LOW SPEED vs HIGH SPEED TESTING OF LP TURBINE … fileLOW SPEED vs HIGH SPEED TESTING OF LP TURBINE...
LOW SPEED vs HIGH SPEED TESTING OF LP TURBINE BLADE WAKE
INTERACTION
M.Vera and H.P.HodsonWhittle Laboratory
University of CambridgeU.K.
Sponsored by ITP
Contents
Introduction
High speed vs. Low speed
Facilities
Results
Conclusions
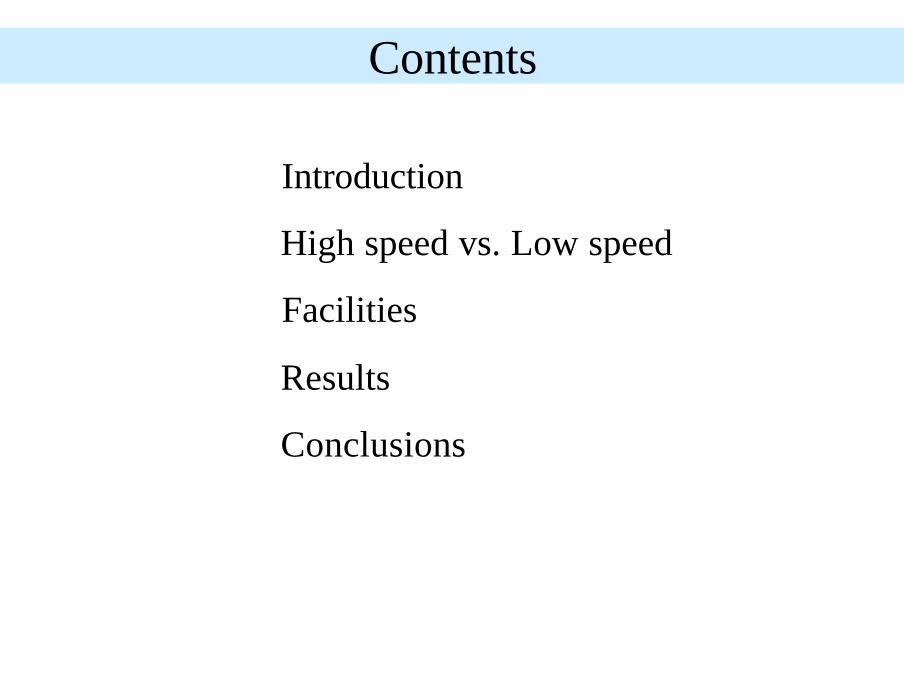
Introduction
• Experiments simulating blade wake interaction at high Mach numbers are needed
BUT
• Only IF they are worth it
This seminar presents
• Techniques for testing of low and high speed LPT cascades
• The extent to which results from low speed are meaningful
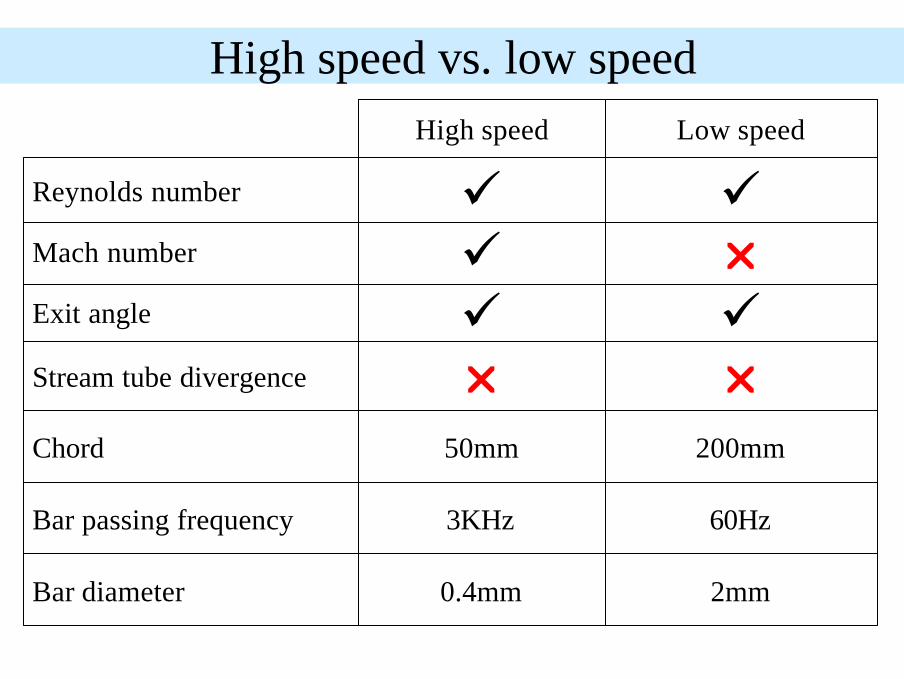
High speed vs. low speed
200mm50mmChord
rrStream tube divergence
üüExit angle
rüMach number
üüReynolds number
Low speedHigh speed
60Hz3KHzBar passing frequency
2mm0.4mmBar diameter
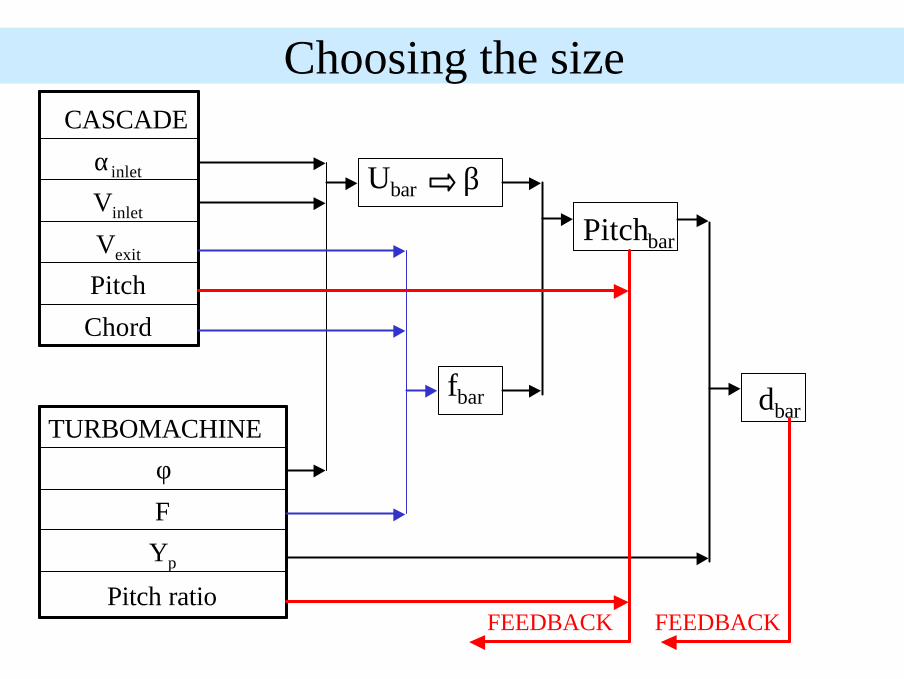
Choosing the size
Chord
PitchVexit
Vinlet
αinlet
TURBOMACHINE
Pitch ratio
Yp
F
φ
Ubar
fbar
β
Pitchbar
dbar
FEEDBACK FEEDBACK
CASCADE
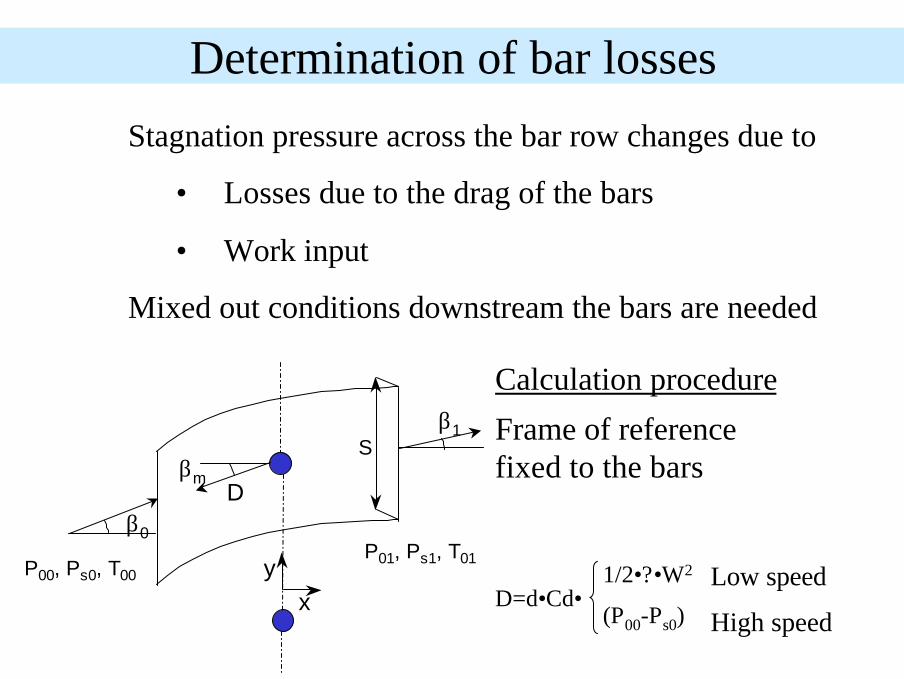
Determination of bar losses
Stagnation pressure across the bar row changes due to
• Losses due to the drag of the bars
• Work input
Mixed out conditions downstream the bars are needed
β0
β1
βmD
xy
S
P00, Ps0, T00P01, Ps1, T01
D=d•Cd•(P00-Ps0)
1/2•?•W2 Low speed
High speed
Frame of reference fixed to the bars
Calculation procedure
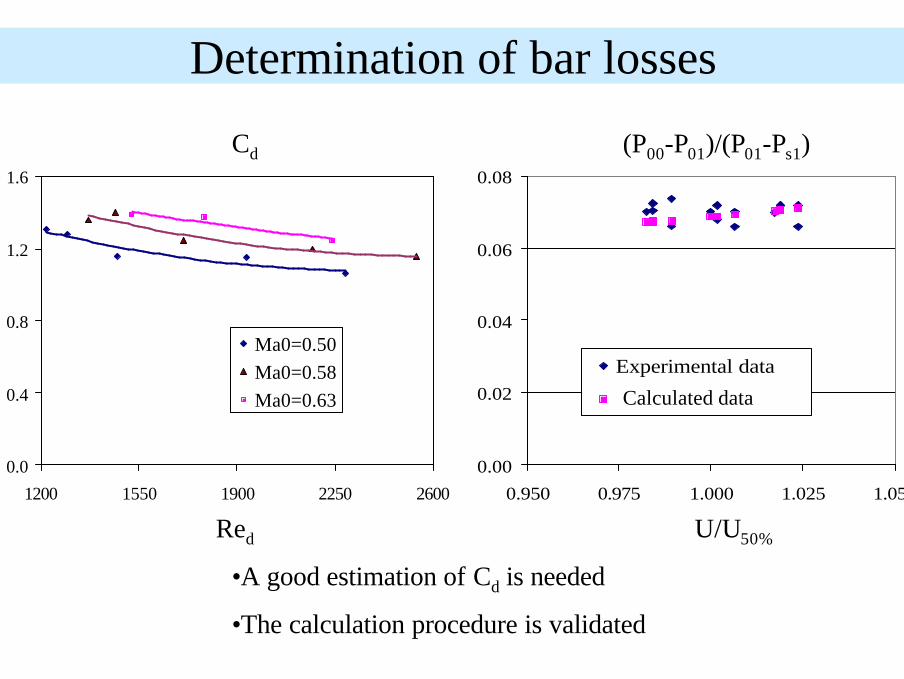
Determination of bar losses
Red
0.0
0.4
0.8
1.2
1.6
1200 1550 1900 2250 2600
Ma0=0.50Ma0=0.58Ma0=0.63
U/U50%
(P00-P01)/(P01-Ps1)Cd
•A good estimation of Cd is needed
•The calculation procedure is validated
0.00
0.02
0.04
0.06
0.08
0.950 0.975 1.000 1.025 1.050
Experimental data
Numerical procedureCalculated data
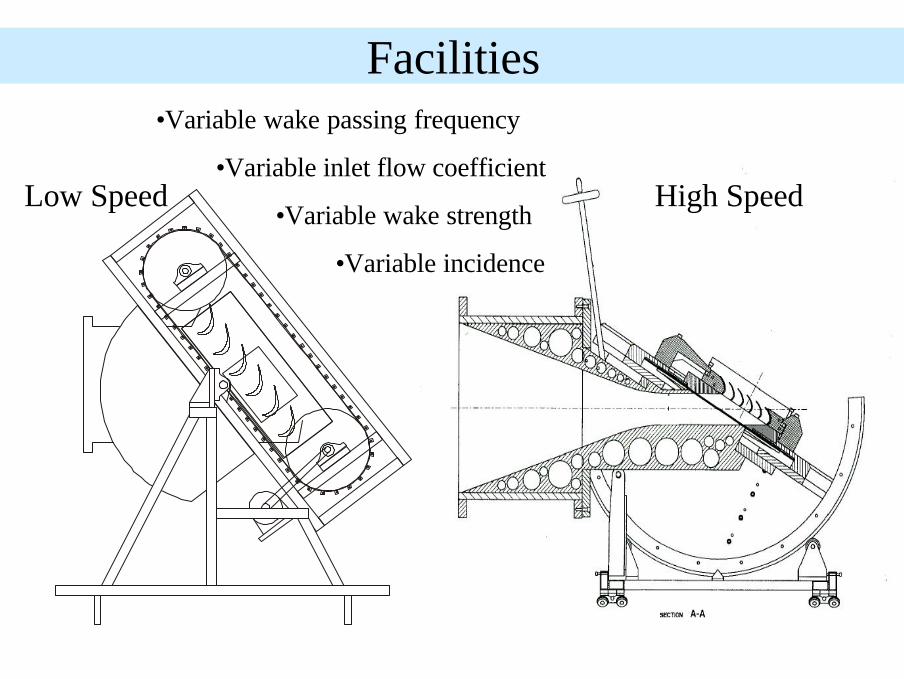
Facilities•Variable wake passing frequency
•Variable inlet flow coefficient
•Variable wake strength
•Variable incidence
High SpeedLow Speed
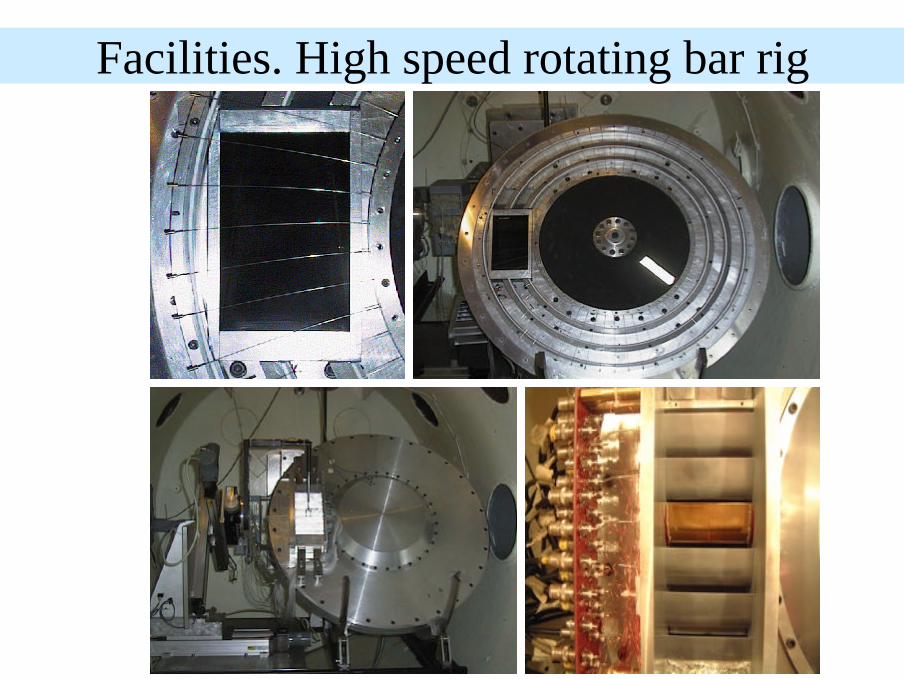
Facilities. High speed rotating bar rig
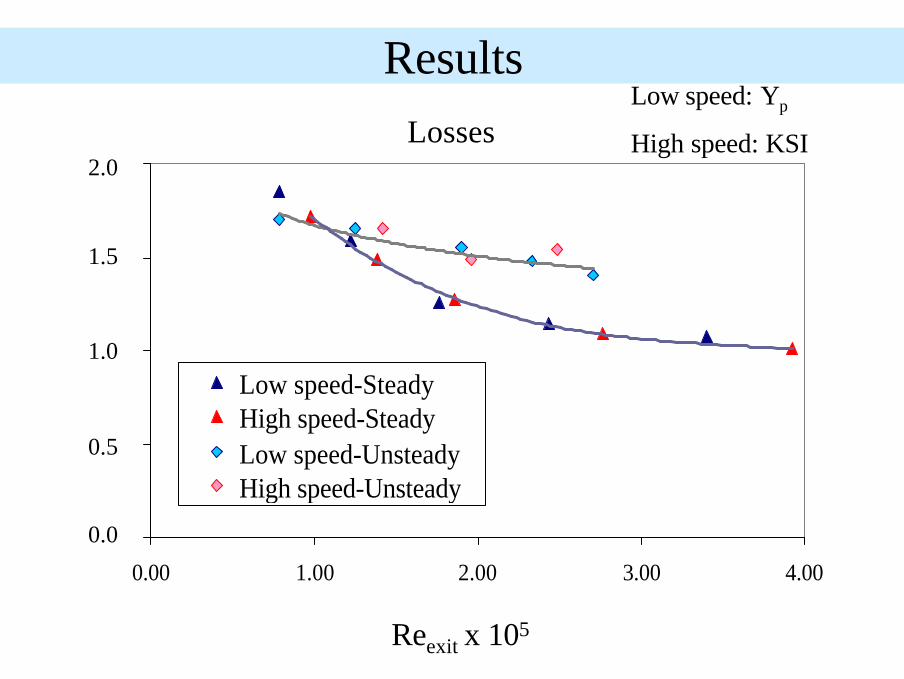
Results
Reexit x 105
LossesLow speed: Yp
High speed: KSI
0
0.01
0.02
0.03
0.04
0.00 1.00 2.00 3.00 4.00
Low speed-Steady High speed-Steady Low speed-Unsteady High speed-Unsteady
0.5
1.0
1.5
2.0
0.0
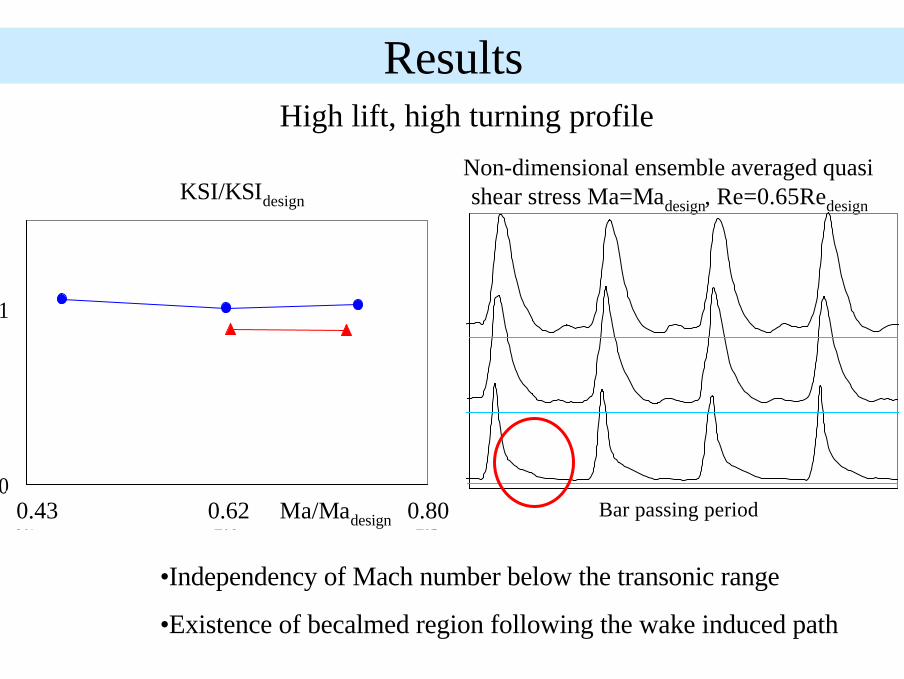
Results
Non-dimensional ensemble averaged quasi shear stress Ma=Madesign, Re=0.65Redesign
Bar passing periodMa/Madesign
KSI/KSIdesign
•Independency of Mach number below the transonic range
•Existence of becalmed region following the wake induced path
High lift, high turning profile
0
1
0.7 1.0 1.30.43 0.62 0.80
Conclusions
High speed testing presents greater challenges.
At all speeds below transonic:
• Same quantitative results are obtained for loss
• Same wake interaction phenomena are found
Low speed approach is valid below the transonic range
and it is EASIER
ACKNOLEDGEMENTS:ITP for the funding and the permission to publish this work