
Low Energy Monitoring Research Report - BC Housing
55
Low Energy Monitoring Research Report North Park Passive House, Victoria, B.C.
Transcript of Low Energy Monitoring Research Report - BC Housing
Low Energy Monitoring Research ReportNorth Park Passive House, Victoria, B.C.


Acknowledgements
BC Housing gratefully acknowledges the support and funding of Canada Mortgage and Housing
Corporation, Natural Resources Canada (NRCan) through their Program for Energy Research and
Development (PERD), and FPInnovations. Thanks to RDH Building Science for carrying out the research
and preparing the report, and to the builder Bernhardt Contracting, who facilitated the installation of the
monitoring equipment and provided generous access to their construction site, Passive House model,
project costs and shared experience in completing the project. We also acknowledge the contribution
of Synergy Sustainability Institute, who completed the qualitative interviews with occupants, and
HCMA Architecture and Design, who designed the building.
Disclaimer
This project was funded by BC Housing, Canada Mortgage and Housing Corporation (CMHC) and Natural Resources Canada (NRCan) through their Program for Energy Research and Development (PERD), and FPInnovations. The content, views, and editorial quality expressed in this report are those exclusively of the authors. BC Housing, CMHC, NRCan and FPInnovations assume no responsibility of any kind in connection with the readers use of the information, materials and techniques described herein. Readers are advised to evaluate the information, material and techniques cautiously for themselves and to consult appropriate professional resources to determine whether the information, materials and techniques are suitable in their case. Project and site specific factors of climate cost, aesthetics, and so on, must be taken into consideration.
Low Energy Monitoring Research Report © BC Housing

Page ii
Executive Summary
The Passive House concept provides a framework for high-performance buildings that is
growing in popularity in Canada, and particularly on the west coast. Certification to the
Passive House label requires its buildings to achieve specific performance values for
heating energy use intensity, total energy use intensity, spatial temperature variation,
ventilation performance and air leakage rate. The promised co-benefits of Passive Houses
include thermal comfort and indoor air quality.
Passive House performance requirements are being mandated in several European Union
countries and the adoption of Passive House is growing in popularity worldwide. However,
the potential benefits of Passive House and other low energy design approaches are not
as well understood in Canada, and there are limited data on the actual performance of low
energy residential buildings in various Canadian climates.
The goal of this research project was to rigorously evaluate the real-world performance of
a multi-family Passive House1 building in British Columbia’s coastal region. The main
aspects that were evaluated include:
� Moisture durability and thermal performance of the high-R-value enclosure using
heat and moisture sensors;
� Occupant comfort through both quantitative and qualitative evaluation;
� Energy and water use;
� Financial analysis based on utility and capital costs, and
� Theoretical performance of the same building in representative climates across
Canada.
This assessment was completed for a new spec-built, six-unit Passive House complex
located in Victoria, BC, known as the North Park Passive House (North Park). The building
was constructed in 2014/2015, and has been occupied since September 2015.
Enclosure Performance
This aspect of the research was intended to evaluate the hygrothermal performance of the
deep-stud wall assembly with interior service wall. Primarily, the moisture durability of the
exterior sheathing was of principle interest, followed by other parameters such as the
impact of solar heating and inward driven moisture.
The monitoring and analysis indicates that the north facing exposures were generally
wetter than the south facing ones, but all monitored locations showed drying over time,
with a low risk of long term mould growth.
1 While the Passive House Institute U.S. (PHIUS) has developed a version of Passive House adapted for
US climates, many projects in North America still follow the German-developed Passive House International (PHI) certification protocol. The project evaluated in this study was designed and certified under PHI.

Page iii
Thermal Comfort and Air Quality
Interior temperatures were generally within a comfortable range throughout the
monitoring period. However, one suite experienced 13% of hours greater than 25° C
during warm periods in the summer, and some temperatures lower than 17.5° C in the
winter. Indications supported by the occupant interviews suggest that some occupants are
still learning how to best operate the heating and ventilation systems, as well as when to
open windows and use operable shades. This feedback indicates an opportunity to further
improve both comfort conditions and energy consumption in the building.
Relative humidity was well managed at all monitored locations throughout the year.
CO2 levels are generally very good, and occupants reported either good perceived air
quality, or made no comment about air quality, suggesting that the HRV was providing
acceptable air exchanges. Some spikes and variation between suites were observed, likely
due to different occupancy patterns, activity levels and pet ownership.
Qualitative interviews indicated that all participating occupants were satisfied with their
experience living at North Park, but learning opportunities likely still exist to improve
operation and comfort.
Energy and Water Consumption
The measured, normalized annual energy consumption of the whole building was found
to be 33,570 kWh, or 72 kWh/m2·yr.
The modeled annual energy consumption predicted a value of 43 kWh/m2·yr for the
whole building for a typical weather year. The measured, normalized consumption was
therefore found to be 66% higher than the model predicted. Also, the analysis showed
that the actual heating demand was close to the PHPP modeled demand, indicating that
the source of divergence is in base loads (plug loads, domestic hot water, etc). In other
words, occupant preferences and behaviours have a significant impact on the final energy
consumption. Suite level utility data suggests a broad range in consumption between
suites, further supporting this observation.
Table 0.1 below summarizes the breakdown results.
TABLE 0.1: SUMMARY OF END-USE ENERGY BREAKDOWN
PHPP Modeled Energy Actual Energy (kWh/m2·yr)
kWh kWh/m2·yr kWh kWh/m2·yr
Heating 4,130 8.8 4,690 10.0
Baseline 16,040 34.2 28,880 61.6
TOTAL 20,170 43 33,570 72
The overall building water consumption for 2016 was found to be approximately 669,000
litres. The annual usage based on the building’s GFA is 1,426 litres/m2. This includes all
six suites and common areas. Water usage is also typically expressed in litres per person
per day. Based on occupant interviews, it is estimated that there were 10 occupants in the
building during 2016, resulting in an average daily water use of 183 litres per person.

Page iv
The building was not specifically designed to be water efficient beyond good standard
practice. However, water consumption is lower than the average per person consumption
in Canada, which was 251 L/person in 20112. This likely reflects current code
requirements for low flow plumbing fixtures, in combination with a small landscaped area
and minimal irrigation needs at the building.
Financial Analysis
The estimated incremental cost to upgrade a building of comparable quality to Passive
House was 4.2%. Annual energy savings over a typical code compliant building were
estimated to be 28,370 kWh per year, or 60 kWh/m2.
The financial analysis suggests that based on the factors considered, the additional
incremental capital cost is marginally cost effective. The NPV is slightly negative; the IRR
is close to the assumed discount rate, and the discounted payback period is between 11
and 20 years. Consistent with the theoretical analysis completed previously, energy cost
savings alone are therefore not sufficient to offset the additional upfront investment in
the shorter term.
However, this basic financial analysis paints only part of the picture. There are several
financial components that were not included in this analysis, including a perceived
competitive sales price and resale value; cost offset of net metering, and ongoing savings
realized after the analysis period.
This research also documented several non-monetary benefits to living at the North Park
Passive House, including a high level of occupant comfort, perceived building durability,
improved air quality, and the ability to live in a home that reflects one’s personal values.
2 https://www.ec.gc.ca/indicateurs-indicators/default.asp?lang=en&n=7E808512-1

Page 1
Acknowledgements and Disclaimer i
Executive Summary ii
Enclosure Performance ii
Thermal Comfort and Air Quality iii
Energy and Water Consumption iii
Financial Analysis iv
1 Project Introduction 1
2 Design 2
2.1 Form and Layout 2
2.2 Enclosure Elements 3
2.3 Heating, Ventilation, and Solar PV Systems 6
2.4 Plumbing and Domestic Hot Water System 7
3 Enclosure Performance 8
3.1 Methodology 8
3.2 Results 14
3.3 Discussion 18
4 Occupant Comfort and Air Quality 22
4.1 Quantitative Evaluation 22
4.2 Qualitative Evaluation – Occupant Surveys 31
5 Energy and Water Consumption 35
5.1 Methodology 35
5.2 Results 35
5.3 Discussion 39
6 Financial Analysis 41
6.1 Construction Cost 41
6.2 Energy Cost 41
6.3 Financial Analysis 42
7 Conclusions 44
7.1 Enclosure Performance 44
7.2 Thermal Comfort and Air Quality 44

Page 2
7.3 Energy and Water Consumption 44
7.4 Financial Analysis 44
7.5 Lessons Learned 45
APPENDIX A: Occupant Interview Protocol and Questions 46

8820.003 RDH Building Science Inc. Page 1
1 Project Introduction
The Passive House concept provides a framework for high-performance building that is
growing in popularity in Canada, and particularly on the west coast. Certification to the
Passive House label requires its buildings to achieve specific performance values for
heating energy use intensity, total energy use intensity, spatial temperature variation,
ventilation performance and air leakage rate. The promised co-benefits of Passive Houses
include superior thermal comfort and indoor air quality.
Passive House performance requirements are being mandated in several European Union
countries and the adoption of Passive House is growing in popularity worldwide. However,
the potential benefits of Passive House and other low energy design approaches are not
as well understood in Canada, and there are limited data on the actual performance of low
energy residential buildings in various Canadian climates.
The goal of this research project was to rigorously evaluate the real-world performance of
a multi-family Passive House3 building in British Columbia’s coastal region. The main
aspects that were evaluated include:
� Moisture durability and thermal performance of the high-R-value enclosure using
heat and moisture sensors;
� Occupant comfort through both quantitative and qualitative evaluation;
� Energy and water use;
� Financial analysis based on utility and capital costs, and
� Theoretical performance of the same building in representative climates across
Canada.
This assessment was completed for a new spec-built, six-unit Passive House complex
located in Victoria, BC, known as the North Park Passive House (North Park). The building
was constructed in 2014/2015, and has been occupied since September 2015.
3 While the Passive House Institute U.S. (PHIUS) has developed a version of Passive House adapted for US climates, many projects in North America still follow the German-developed Passive House International (PHI) certification protocol. The project evaluated in this study was designed and certified under PHI.

Page 2 RDH Building Science Inc. 8820.003
2 Design
The North Park Passive House was developer-built on a small urban infill site within
walking distance of downtown Victoria. The developer/builder’s intention was to build a
Passive House at a market-competitive price point in a desirable location.
2.1 Form and Layout
The building was constructed on a constrained urban site with a south facing entry. The
six units are stacked on three levels side-by-side with exterior entries for all suites. As
such, all suites have a south exposure at the front, a north exposure at the rear, and
either west or east exposure on their long side.
Total (conditioned) floor area is 424 m2 (4,560 ft2). Gross Floor Area (GFA) including
exterior walls is 469 m2 (5,050 ft2).4 The floor plate is a simple rectangular shape, with
one cut-out in the rear, as shown in Figure 2-1 below.
Figure 2-1: Typical floor layout
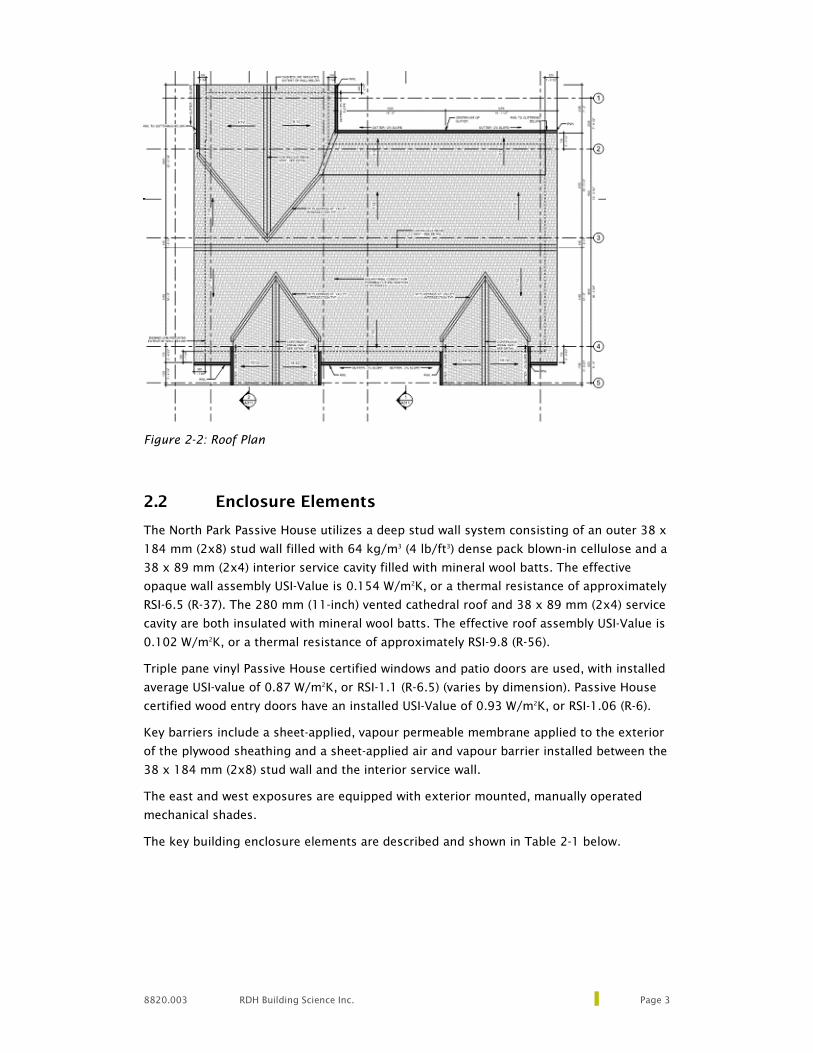
Figure 2-2 below shows the roof layout. The design is complex, with dormers added in
response to neighbours’ preference for a “traditional” design. The complex roof shape
added significant cost to the project, as well as significant heat loss. The builder reported
that two-thirds of the construction cost and two-thirds of the energy losses were
concentrated on the upper one-third of the building. Based on this experience, the builder
has implemented simpler roof shapes on subsequent projects.
4 “Total (conditioned) floor area” refers to the sum of the areas of all floors, measured from the
interior face of the exterior walls. Definition excerpted from City of Victoria Schedule A – Definitions. Gross Floor Area is typically measured to include exterior walls.
8820.003 RDH Building Science Inc. Page 3
Figure 2-2: Roof Plan
2.2 Enclosure Elements
The North Park Passive House utilizes a deep stud wall system consisting of an outer 38 x
184 mm (2x8) stud wall filled with 64 kg/m3 (4 lb/ft3) dense pack blown-in cellulose and a
38 x 89 mm (2x4) interior service cavity filled with mineral wool batts. The effective
opaque wall assembly USI-Value is 0.154 W/m2K, or a thermal resistance of approximately
RSI-6.5 (R-37). The 280 mm (11-inch) vented cathedral roof and 38 x 89 mm (2x4) service
cavity are both insulated with mineral wool batts. The effective roof assembly USI-Value is
0.102 W/m2K, or a thermal resistance of approximately RSI-9.8 (R-56).
Triple pane vinyl Passive House certified windows and patio doors are used, with installed
average USI-value of 0.87 W/m2K, or RSI-1.1 (R-6.5) (varies by dimension). Passive House
certified wood entry doors have an installed USI-Value of 0.93 W/m2K, or RSI-1.06 (R-6).
Key barriers include a sheet-applied, vapour permeable membrane applied to the exterior
of the plywood sheathing and a sheet-applied air and vapour barrier installed between the
38 x 184 mm (2x8) stud wall and the interior service wall.
The east and west exposures are equipped with exterior mounted, manually operated
mechanical shades.
The key building enclosure elements are described and shown in Table 2-1 below.
Page 4 RDH Building Science Inc. 8820.003
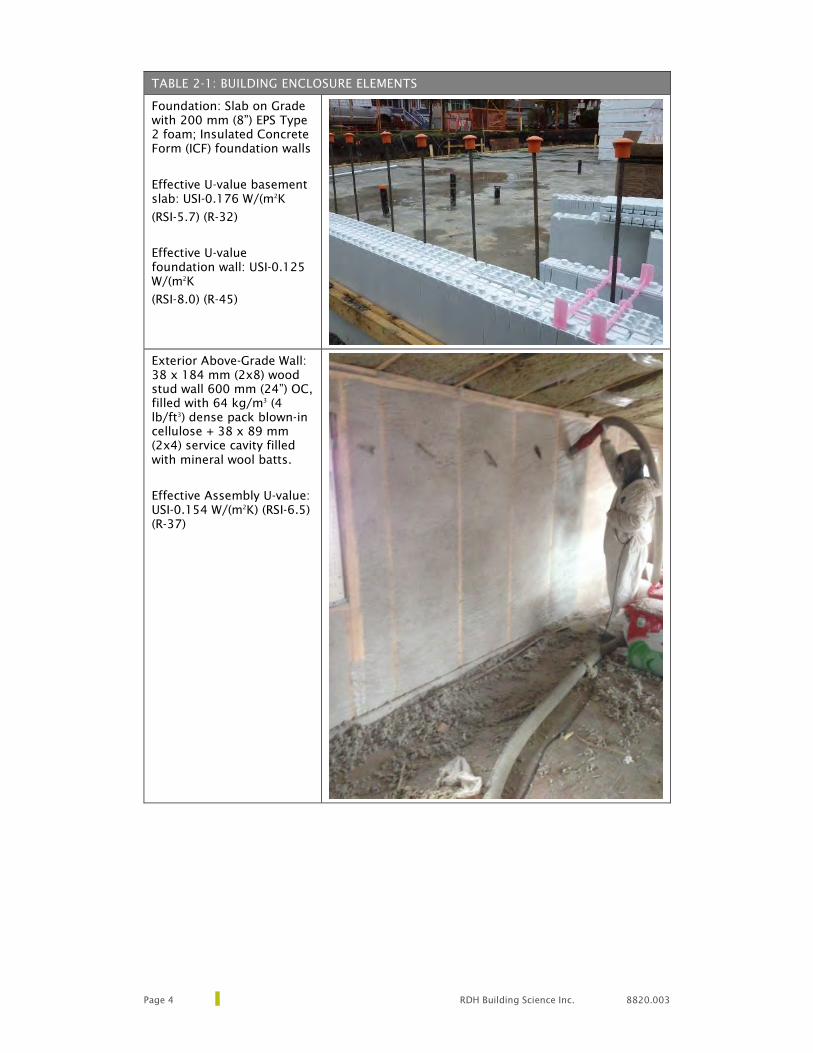
TABLE 2-1: BUILDING ENCLOSURE ELEMENTS
Foundation: Slab on Grade with 200 mm (8”) EPS Type 2 foam; Insulated Concrete Form (ICF) foundation walls
Effective U-value basement slab: USI-0.176 W/(m2K
(RSI-5.7) (R-32)
Effective U-value foundation wall: USI-0.125 W/(m2K
(RSI-8.0) (R-45)
Exterior Above-Grade Wall: 38 x 184 mm (2x8) wood stud wall 600 mm (24”) OC, filled with 64 kg/m3 (4 lb/ft3) dense pack blown-in cellulose + 38 x 89 mm (2x4) service cavity filled with mineral wool batts.
Effective Assembly U-value: USI-0.154 W/(m2K) (RSI-6.5) (R-37)
8820.003 RDH Building Science Inc. Page 5
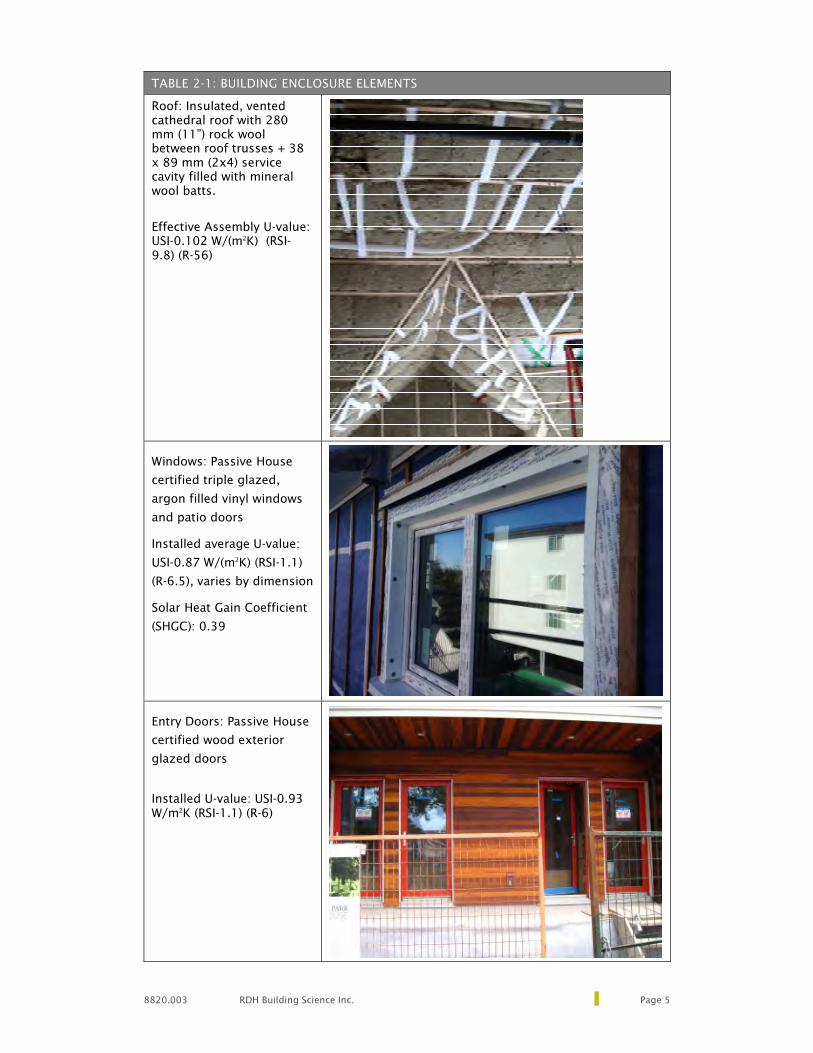
TABLE 2-1: BUILDING ENCLOSURE ELEMENTS
Roof: Insulated, vented cathedral roof with 280 mm (11”) rock wool between roof trusses + 38 x 89 mm (2x4) service cavity filled with mineral wool batts.
Effective Assembly U-value: USI-0.102 W/(m2K) (RSI-9.8) (R-56)
Windows: Passive House
certified triple glazed,
argon filled vinyl windows
and patio doors
Installed average U-value:
USI-0.87 W/(m2K) (RSI-1.1)
(R-6.5), varies by dimension
Solar Heat Gain Coefficient
(SHGC): 0.39
Entry Doors: Passive House
certified wood exterior
glazed doors
Installed U-value: USI-0.93 W/m2K (RSI-1.1) (R-6)

Page 6 RDH Building Science Inc. 8820.003
TABLE 2-1: BUILDING ENCLOSURE ELEMENTS
Air & Vapour Barrier: SIGA Majpell on interior of deep stud wall and on interior truss framing in roof. All transitions taped with SIGA Rissan.
2.3 Heating, Ventilation, and Solar PV Systems
The building is all-electric and is heated by in-floor electric resistance heat at each suite’s
entry and bath. Heating is controlled by the occupants via wall-mounted thermostats.
Ventilation is provided by a Zehnder ComfoAir 200 Heat Recovery Ventilator (HRV) in each
suite. The HRVs have three operating modes (low, medium, high) that are controlled
manually by the occupant. There is one main HRV control panel for the suite, plus a
“boost” mode switch in the bathroom that manually boosts the fan into “high” mode for a
selected time period.
Supply air is ducted from the HRV to the living room and bedrooms, and returned to the
HRV from the bathroom, kitchen, and laundry closet. The range hood is recirculating and
equipped with a grease and charcoal filter. Total outdoor supply air volumes to each suite,
as documented in the HRV commissioning report, are generally between 0.85 m3/min and
1.1 m3/min (30 and 40 CFM) in low mode and up to 2.8 m3/min (100 CFM) in high mode.
The air supply has neither a pre- nor post-heater.
A 7 kW photovoltaic solar array is installed on the south facing roof, and equipped to feed
into BC Hydro’s grid for net metering.
The key mechanical system elements are described and shown in Table 2-2 below.

8820.003 RDH Building Science Inc. Page 7
TABLE 2-2: HEATING, VENTILATION AND SOLAR PV ELEMENTS
Passive House certified HRV; one Zehnder ComfoAir 200 unit per suite:
Nominal efficiency: 92%
7 kW rooftop photovoltaic solar array on the south facing roof, with net metering to BC Hydro
2.4 Plumbing and Domestic Hot Water System
Each suite has its own 3kW of a 114-liter (30 gallons) domestic hot water heater/tank.
Plumbing fixtures are as follows:
� Toilets: American Standard “Studio” LXP Dual Flush toilet, 6 LPF/4.1 LPF.
� Showerheads: Moen Rizon with 9.5 liters/min (2.5 gallons/min) flow rate
� Bath and Kitchen Sink faucets: Moen Rizon/Align with 5.7 liters/min (1.5
gallons/min) max flow rate
In-suite appliances include a dishwasher, clothes washer and ventless condensing dryer.

Page 8 RDH Building Science Inc. 8820.003
3 Enclosure Performance
A highly insulated enclosure is a requirement for a high-performance building such as a
Passive House. The assembly type, choice of materials and their position within the
assembly can all affect the long-term performance of the enclosure.
This aspect of the research was intended to evaluate the hygrothermal performance of the
deep-stud wall assembly with interior service wall. Primarily, the moisture durability of the
sheathing was of principle interest, followed by other parameters such as the impact of
solar heating and inward driven moisture. The following factors were evaluated:
� Durability of the exterior sheathing
� Hygric buffering capacity of the densepack cellulose
� Impacts of solar radiation on the hygric profiles through the assembly
� Interior surface temperature impacts on mean radiant temperatures
3.1 Methodology
The critical layers of the enclosure were monitored for heat and moisture (both relative
humidity and moisture content) and compared with known durability metrics and
empirical models.
Details on the instrumentation plan and sensor locations within the building are provided
below.
3.1.1 Instrumentation Plan
The wall assemblies were monitored using relative humidity sensors, electrical resistance
moisture content sensors, and temperature sensors5, as summarized in Table 3-1 below.
TABLE 3-1 – SENSOR DESCRIPTIONS AND DATA- ENCLOSURE PERFORMANCE
Sensor Type Description Accuracy
RELA
TIV
E H
UM
IDIT
Y S
EN
SO
R Thermoset polymer capacitive
sensor with onboard signal conditioning
±3.5%, from 10%–90% RH
5 The sensors were provided by Building Science Laboratories (BSL). The data acquisition system is a laboratory research grade CR1000 data logger system provided by Campbell Scientific Instruments (CSI). BSL has extensive experience designing and providing sensor packages that work well with the CSI equipment (Schumacher, Straube, 2005).
8820.003 RDH Building Science Inc. Page 9
TEM
PER
AT
UR
E S
EN
SO
R
10k NTC glass-encapsulated thermistor, including aluminum foil spatial heat sink (RH sensor in background).
±0.2 °C
MO
IST
UR
E C
ON
TEN
T S
EN
SO
R In-situ electrical-based resistance
measurements between corrosion-resistance and electrically insulated pins, including 10k NTC thermistor
± 3%, with temperature and wood species correction.
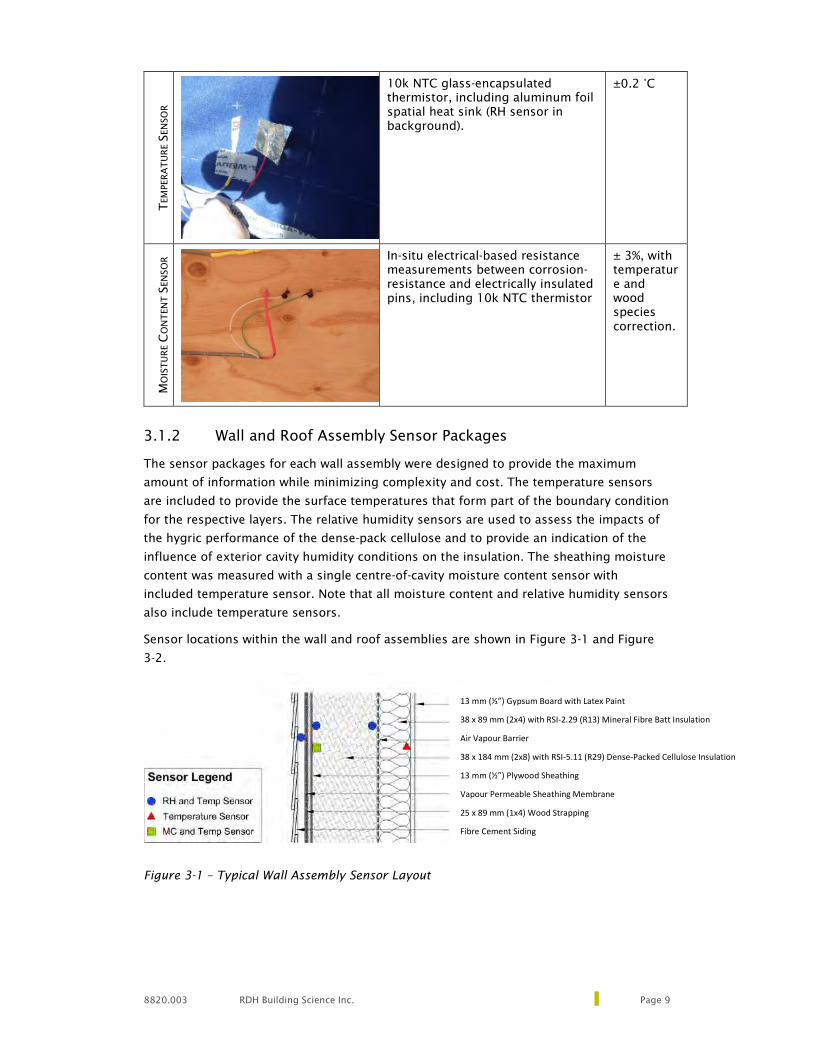
3.1.2 Wall and Roof Assembly Sensor Packages
The sensor packages for each wall assembly were designed to provide the maximum
amount of information while minimizing complexity and cost. The temperature sensors
are included to provide the surface temperatures that form part of the boundary condition
for the respective layers. The relative humidity sensors are used to assess the impacts of
the hygric performance of the dense-pack cellulose and to provide an indication of the
influence of exterior cavity humidity conditions on the insulation. The sheathing moisture
content was measured with a single centre-of-cavity moisture content sensor with
included temperature sensor. Note that all moisture content and relative humidity sensors
also include temperature sensors.
Sensor locations within the wall and roof assemblies are shown in Figure 3-1 and Figure
3-2.
Figure 3-1 – Typical Wall Assembly Sensor Layout
13 mm (½”) Gypsum Board with Latex Paint
38 x 89 mm (2x4) with RSI-2.29 (R13) Mineral Fibre Batt Insulation
Air Vapour Barrier
38 x 184 mm (2x8) with RSI-5.11 (R29) Dense-Packed Cellulose Insulation
13 mm (½”) Plywood Sheathing
Vapour Permeable Sheathing Membrane
25 x 89 mm (1x4) Wood Strapping
Fibre Cement Siding
Page 10 RDH Building Science Inc. 8820.003
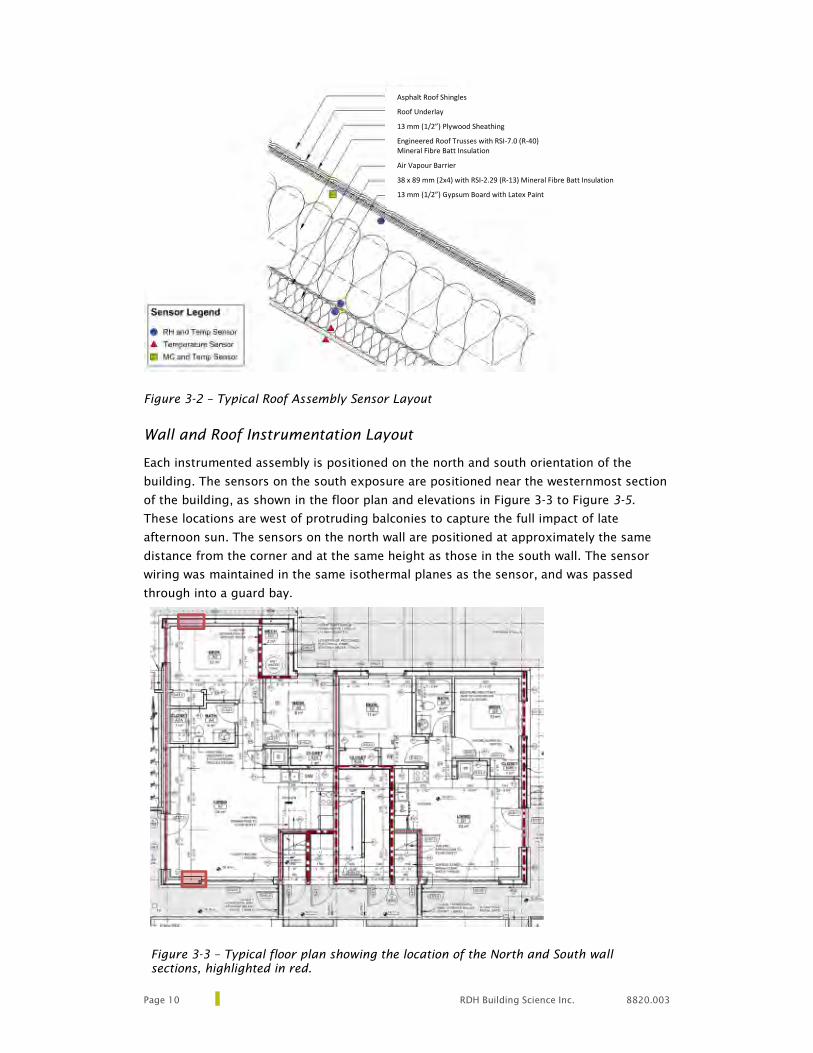
Figure 3-2 – Typical Roof Assembly Sensor Layout
Wall and Roof Instrumentation Layout
Each instrumented assembly is positioned on the north and south orientation of the
building. The sensors on the south exposure are positioned near the westernmost section
of the building, as shown in the floor plan and elevations in Figure 3-3 to Figure 3-5.
These locations are west of protruding balconies to capture the full impact of late
afternoon sun. The sensors on the north wall are positioned at approximately the same
distance from the corner and at the same height as those in the south wall. The sensor
wiring was maintained in the same isothermal planes as the sensor, and was passed
through into a guard bay.
Figure 3-3 – Typical floor plan showing the location of the North and South wall sections, highlighted in red.
Asphalt Roof Shingles
Roof Underlay
13 mm (1/2”) Plywood Sheathing
Engineered Roof Trusses with RSI-7.0 (R-40)
Mineral Fibre Batt Insulation
Air Vapour Barrier
38 x 89 mm (2x4) with RSI-2.29 (R-13) Mineral Fibre Batt Insulation
13 mm (1/2”) Gypsum Board with Latex Paint

8820.003 RDH Building Science Inc. Page 11
Figure 3-4– North and South elevations showing approximate locations for the instrumented enclosure sections.6
6 The nomenclature for the assemblies follows the orientations (N or S) for the walls, followed by the floor level (2 or 3). The roofs are identified by an R and the orientation (N or S). The data acquisition system is positioned in the ground floor and is lettered by a D.
S 3
S 2
R S
D
N3
N2
R N
D

Page 12 RDH Building Science Inc. 8820.003
Figure 3-5 – West Elevation
A photograph of the phased sensor installation is provided in Figure 3-6.
Figure 3-6 – S2 interior relative humidity and thermistor in partial installation (awaiting insulation).
N3
N2
S 3
S 2
8820.003 RDH Building Science Inc. Page 13
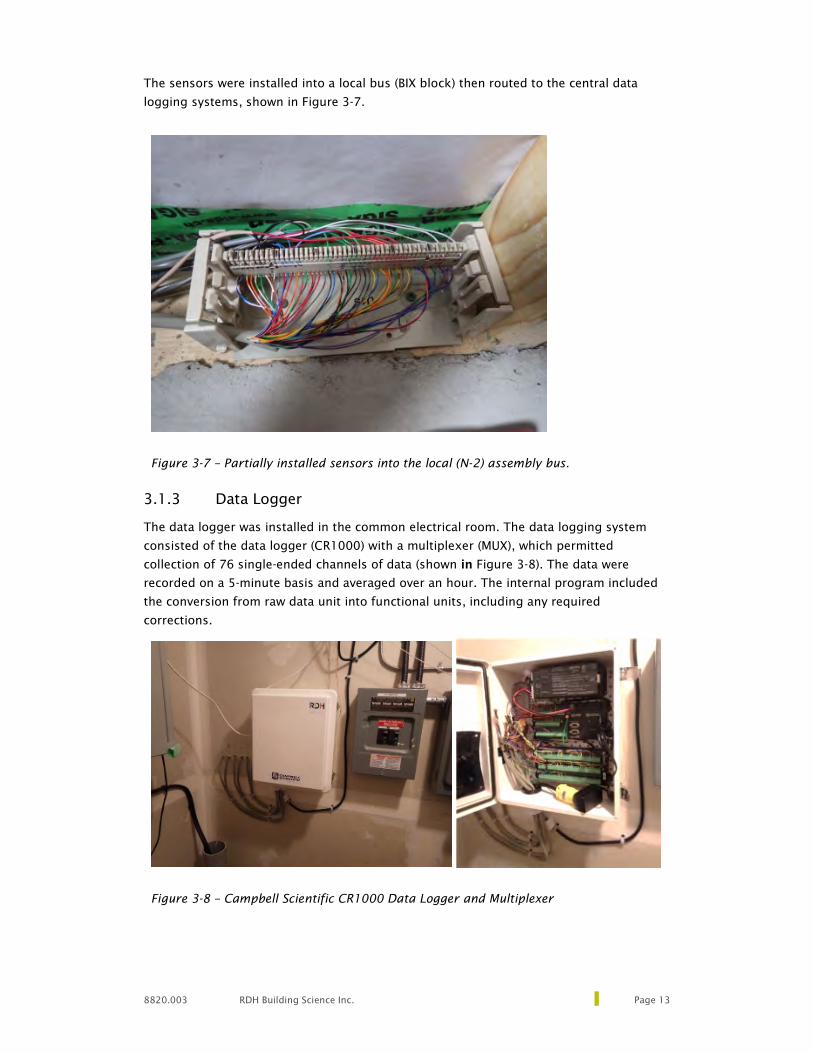
The sensors were installed into a local bus (BIX block) then routed to the central data
logging systems, shown in Figure 3-7.
Figure 3-7 – Partially installed sensors into the local (N-2) assembly bus.
3.1.3 Data Logger
The data logger was installed in the common electrical room. The data logging system
consisted of the data logger (CR1000) with a multiplexer (MUX), which permitted
collection of 76 single-ended channels of data (shown in Figure 3-8). The data were
recorded on a 5-minute basis and averaged over an hour. The internal program included
the conversion from raw data unit into functional units, including any required
corrections.
Figure 3-8 – Campbell Scientific CR1000 Data Logger and Multiplexer

Page 14 RDH Building Science Inc. 8820.003
3.2 Results
The results were aggregated into the respective study locations (N2, S2, etc) and reviewed
for broad level performance behaviour. A ‘study year’ from January 1, 2016, to December
31st, 2016 was selected for all assessments. The critical relative humidity and temperature
profiles for the four analyzed wall segments are provided in Figure 3-9 to Figure 3-12. The
sheathing temperature, vapour barrier temperature, and interior drywall temperatures
provide the through-wall temperature profile, and correlate proportionally to the level of
insulation. The indoor dew-point can be compared to the vapour barrier and the sheathing
temperatures to assess relative risk of concealed condensation and potential moisture
damage. The exterior and interior relative humidity across the deep-stud wall provides a
general indicator to the risk of moisture related damage. Most bacteria and fungi are
unable to grow at a relative humidity below 80%.
Figure 3-9 – S2 wall data for Sheathing, Vapour Barrier (VB) and Drywall temperatures, including indoor air dewpoint temperature, and the relative humidity for the outer and inner cellulose fibre insulation (CFI), from January to December 2016.
0
10
20
30
40
50
60
70
80
90
100
Jan Feb Mar Apr May Jun Jul Aug Sep Oct Nov Dec
Te
mp
era
ture
(°C
) a
nd
RH
(%
)
Sheathing T VB T Drywall T
Int. Dew Point Exterior CFI RH Interior CFI RH
8820.003 RDH Building Science Inc. Page 15
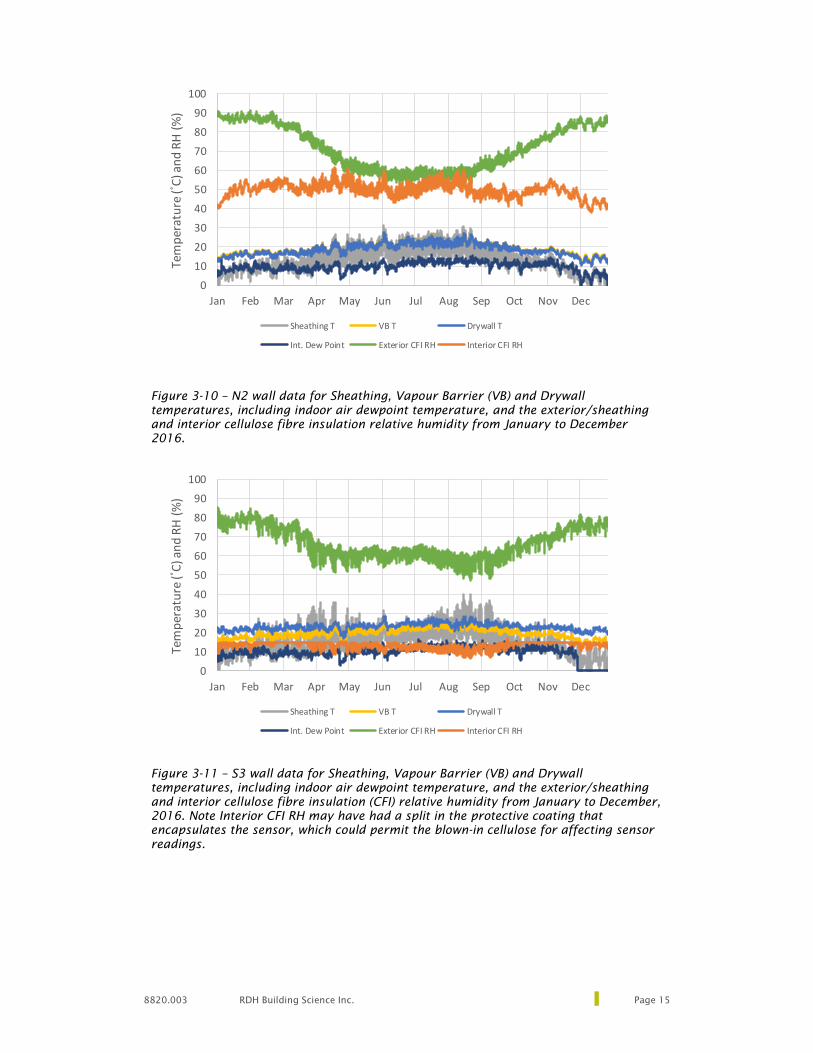
Figure 3-10 – N2 wall data for Sheathing, Vapour Barrier (VB) and Drywall temperatures, including indoor air dewpoint temperature, and the exterior/sheathing and interior cellulose fibre insulation relative humidity from January to December 2016.
Figure 3-11 – S3 wall data for Sheathing, Vapour Barrier (VB) and Drywall temperatures, including indoor air dewpoint temperature, and the exterior/sheathing and interior cellulose fibre insulation (CFI) relative humidity from January to December, 2016. Note Interior CFI RH may have had a split in the protective coating that encapsulates the sensor, which could permit the blown-in cellulose for affecting sensor readings.
0
10
20
30
40
50
60
70
80
90
100
Jan Feb Mar Apr May Jun Jul Aug Sep Oct Nov Dec
Te
mp
era
ture
(°C
) a
nd
RH
(%
)
Sheathing T VB T Drywall T
Int. Dew Point Exterior CFI RH Interior CFI RH
0
10
20
30
40
50
60
70
80
90
100
Jan Feb Mar Apr May Jun Jul Aug Sep Oct Nov Dec
Te
mp
era
ture
(°C
) a
nd
RH
(%
)
Sheathing T VB T Drywall T
Int. Dew Point Exterior CFI RH Interior CFI RH
Page 16 RDH Building Science Inc. 8820.003
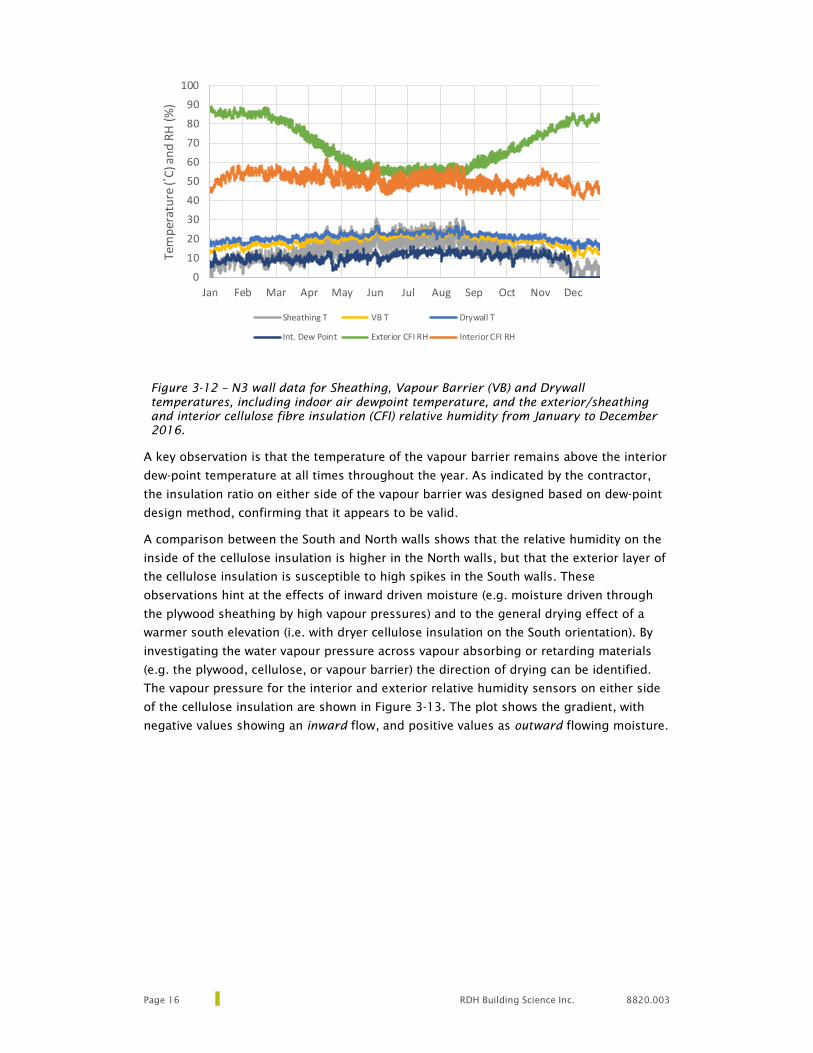
Figure 3-12 – N3 wall data for Sheathing, Vapour Barrier (VB) and Drywall temperatures, including indoor air dewpoint temperature, and the exterior/sheathing and interior cellulose fibre insulation (CFI) relative humidity from January to December 2016.
A key observation is that the temperature of the vapour barrier remains above the interior
dew-point temperature at all times throughout the year. As indicated by the contractor,
the insulation ratio on either side of the vapour barrier was designed based on dew-point
design method, confirming that it appears to be valid.
A comparison between the South and North walls shows that the relative humidity on the
inside of the cellulose insulation is higher in the North walls, but that the exterior layer of
the cellulose insulation is susceptible to high spikes in the South walls. These
observations hint at the effects of inward driven moisture (e.g. moisture driven through
the plywood sheathing by high vapour pressures) and to the general drying effect of a
warmer south elevation (i.e. with dryer cellulose insulation on the South orientation). By
investigating the water vapour pressure across vapour absorbing or retarding materials
(e.g. the plywood, cellulose, or vapour barrier) the direction of drying can be identified.
The vapour pressure for the interior and exterior relative humidity sensors on either side
of the cellulose insulation are shown in Figure 3-13. The plot shows the gradient, with
negative values showing an inward flow, and positive values as outward flowing moisture.
0
10
20
30
40
50
60
70
80
90
100
Jan Feb Mar Apr May Jun Jul Aug Sep Oct Nov Dec
Te
mp
era
ture
(°C
) a
nd
RH
(%
)
Sheathing T VB T Drywall T
Int. Dew Point Exterior CFI RH Interior CFI RH

8820.003 RDH Building Science Inc. Page 17
Figure 3-13 – Cellulose Insulation Vapour Pressure and Vapour Pressure Gradients, for
North and South Walls on Level 2.
The south walls experience significantly higher vapour pressure peaks than do the north
walls. This also translates to higher peak vapour pressures on the interior side of the
cellulose insulation, though appreciably abated by the moisture storing capacity of the
insulation. Review of the pressure gradients provides an indication of direction of drying.
In the winter, the south orientation appears to have strong inward vapour gradients.
These correspond to wetting events followed by sunny periods, which create high vapour
pressure differentials forcing water through the sheathing and into the cellulose
insulation. The North elevation also tends to a neutral pressure gradient, with a slight
diurnal variation likely caused by temperature differences. These drying and wetting
patterns affect the plywood sheathing moisture levels, and consequently the durability of
the assembly.
A review of the sheathing temperature shows similar behaviour as previously identified:
higher average and peak temperatures on the South elevation than on the North. Local
temperature and relative humidity can have an appreciable impact on the sheathing
moisture content, and thus its inherent durability. A plot of the sheathing moisture
content for both the North and South orientation is provided in Figure 3-14.
-1500.0
-1000.0
-500.0
0.0
500.0
1000.0
1500.0
500
750
1000
1250
1500
1750
2000
2250
2500
Jan Feb Mar Apr May Jun Jul Aug Sep Oct Nov Dec
Va
po
ur
Pre
ssu
re (P
a)
Va
po
ur
Pre
ssu
re (P
a)
S2- Exterior S2- Interior N2- Exterior N2- Interior
-1500
-1000
-500
0
500
1000
1500
500750
1000125015001750200022502500
Jan Feb Mar Apr May Jun Jul Aug Sep Oct Nov Dec
∆P
ress
ure
(P
a)
Va
po
ur
Pre
ssu
re (P
a)
S2- Differential N2- DifferentialS2- Exterior S2- Interior N2- Exterior
N2- Interior S2- Differential N2- Differential
Page 18 RDH Building Science Inc. 8820.003
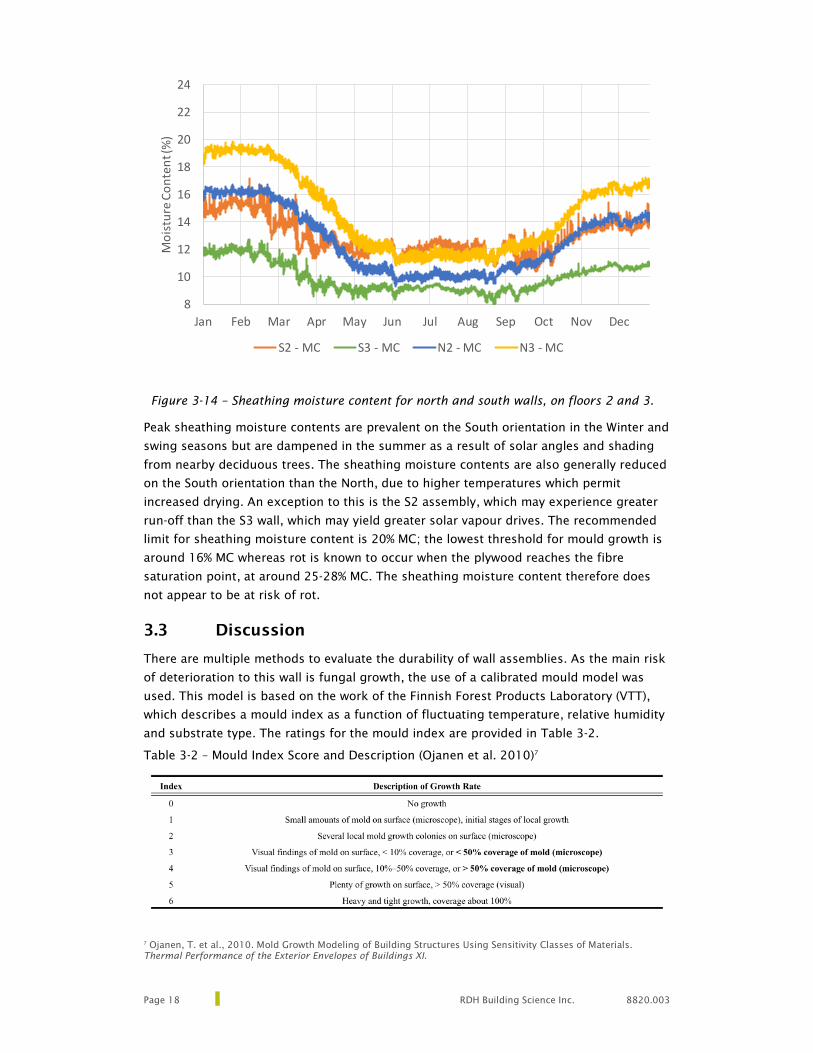
Figure 3-14 – Sheathing moisture content for north and south walls, on floors 2 and 3.
Peak sheathing moisture contents are prevalent on the South orientation in the Winter and
swing seasons but are dampened in the summer as a result of solar angles and shading
from nearby deciduous trees. The sheathing moisture contents are also generally reduced
on the South orientation than the North, due to higher temperatures which permit
increased drying. An exception to this is the S2 assembly, which may experience greater
run-off than the S3 wall, which may yield greater solar vapour drives. The recommended
limit for sheathing moisture content is 20% MC; the lowest threshold for mould growth is
around 16% MC whereas rot is known to occur when the plywood reaches the fibre
saturation point, at around 25-28% MC. The sheathing moisture content therefore does
not appear to be at risk of rot.
3.3 Discussion
There are multiple methods to evaluate the durability of wall assemblies. As the main risk
of deterioration to this wall is fungal growth, the use of a calibrated mould model was
used. This model is based on the work of the Finnish Forest Products Laboratory (VTT),
which describes a mould index as a function of fluctuating temperature, relative humidity
and substrate type. The ratings for the mould index are provided in Table 3-2.
Table 3-2 – Mould Index Score and Description (Ojanen et al. 2010)7
7 Ojanen, T. et al., 2010. Mold Growth Modeling of Building Structures Using Sensitivity Classes of Materials. Thermal Performance of the Exterior Envelopes of Buildings XI.
8
10
12
14
16
18
20
22
24
Jan Feb Mar Apr May Jun Jul Aug Sep Oct Nov Dec
Mo
istu
re C
on
ten
t (%
)
S2 - MC S3 - MC N2 - MC N3 - MC

8820.003 RDH Building Science Inc. Page 19
A mould index of less than 1 would therefore be deemed acceptable, as this constitutes
only microscopic levels of mould which are not likely to generate spores that can affect
human health. By incorporating the temperature and relative humidity data and assuming
pristine plywood (mould growth index of 0), Figure 3-15 was produced.
Figure 3-15 – VTT Mould Index for N2, N3, S2, and S3 walls
Both the 2nd and 3rd storey south walls were unable to grow any mould from a lack of
moisture. However, the North walls were sufficiently cool and humid that in theory,
microscopic mould growth could occur. Over the 1 year monitoring period, a slight
increase in predicted microscopic growth was calculated in the spring season as the
humidity increased concurrently with temperatures suitable for mould growth. Despite the
N3 wall having a higher moisture content, the combination of temperature and cellulose
relative humidity were sufficiently high that the N3 wall appears to have a marginally
higher mould index. The summers were sufficiently dry that the plywood sheathing dried
out and the mould went into stasis in both northern wall assemblies. This simulation
assumes that the original mould growth is zero, so to determine the maximum mould
growth condition, the model was run iteratively until the starting and final mould indices
for the modeled year were approximately equal. The results, including the number of
iterations (i.e. years), are provided in Figure 3-16.
0
0.5
1
1.5
2
2.5
3
Jan Feb Mar Apr May Jun Jul Aug Sep Oct Nov Dec
Mo
uld
Ind
ex
N2 N3 S2 S3
Page 20 RDH Building Science Inc. 8820.003
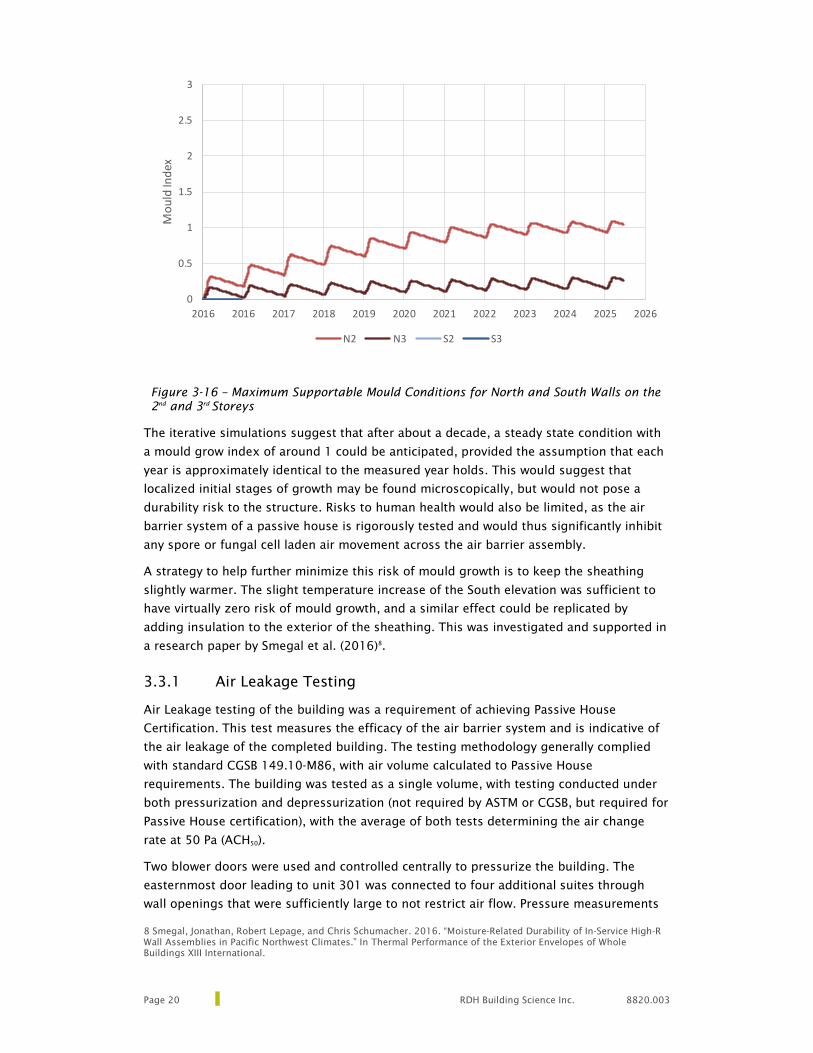
Figure 3-16 – Maximum Supportable Mould Conditions for North and South Walls on the 2nd and 3rd Storeys
The iterative simulations suggest that after about a decade, a steady state condition with
a mould grow index of around 1 could be anticipated, provided the assumption that each
year is approximately identical to the measured year holds. This would suggest that
localized initial stages of growth may be found microscopically, but would not pose a
durability risk to the structure. Risks to human health would also be limited, as the air
barrier system of a passive house is rigorously tested and would thus significantly inhibit
any spore or fungal cell laden air movement across the air barrier assembly.
A strategy to help further minimize this risk of mould growth is to keep the sheathing
slightly warmer. The slight temperature increase of the South elevation was sufficient to
have virtually zero risk of mould growth, and a similar effect could be replicated by
adding insulation to the exterior of the sheathing. This was investigated and supported in
a research paper by Smegal et al. (2016)8.
3.3.1 Air Leakage Testing
Air Leakage testing of the building was a requirement of achieving Passive House
Certification. This test measures the efficacy of the air barrier system and is indicative of
the air leakage of the completed building. The testing methodology generally complied
with standard CGSB 149.10-M86, with air volume calculated to Passive House
requirements. The building was tested as a single volume, with testing conducted under
both pressurization and depressurization (not required by ASTM or CGSB, but required for
Passive House certification), with the average of both tests determining the air change
rate at 50 Pa (ACH50).
Two blower doors were used and controlled centrally to pressurize the building. The
easternmost door leading to unit 301 was connected to four additional suites through
wall openings that were sufficiently large to not restrict air flow. Pressure measurements
8 Smegal, Jonathan, Robert Lepage, and Chris Schumacher. 2016. “Moisture-Related Durability of In-Service High-R Wall Assemblies in Pacific Northwest Climates.” In Thermal Performance of the Exterior Envelopes of Whole Buildings XIII International.
0
0.5
1
1.5
2
2.5
3
2016 2016 2017 2018 2019 2020 2021 2022 2023 2024 2025 2026
Mo
uld
Ind
ex
N2 N3 S2 S3

8820.003 RDH Building Science Inc. Page 21
across the suites were conducted to ensure uniformity of the pressure field. The
westernmost door was used to pressurize unit 201. Stair configuration and firewalls made
wall openings infeasible for this unit, so a parallel pressurization approach with two fans
was employed.
The maximum allowable air leakage rate to achieve Passive House certification is 0.6
ACH50. As a point of comparison, the BC Step Code for Part 9 buildings targets 2.5 ACH50
as its ‘Step 3 – 20% Beyond Code’ target and 1.0 ACH50 as its most stringent Step 5
target9. The Canadian Home Builders Association’s Net Zero Ready Home program
requires a maximum of 1.5 ACH50, so the Passive House target is much more aggressive
than most other residential building standards or codes to date.
The results of the air leakage test are summarized in Table 3.3 below.
TABLE 3.3 AIR LEAKAGE TEST RESULTS
Air Changes per Hour, ACH50, depressurization 0.47
Air Changes per Hour, ACH50, pressurization 0.58
Average ACH50 0.53
The average equivalent leakage area (ELA) at 10 Pa is 206 cm2 for the whole building,
which in visual terms can be represented by a square with approximate dimensions of 14
cm by 14 cm.
9 Stretch Code Implementation Working Group: Energy Step Code Implementation Recommendations Final Report, August 2016. http://www2.gov.bc.ca/assets/gov/farming-natural-resources-and-industry/construction-industry/building-codes-and-standards/reports/step_code_sciwg_report_final.pdf

Page 22 RDH Building Science Inc. 8820.003
4 Occupant Comfort and Air Quality
The Passive House certification path has several criteria for minimum acceptable interior
conditions. An evaluation of both adherence to the quantitative Passive House comfort
requirements and of the occupants’ qualitative experience were included in this part of
the research.
4.1 Quantitative Evaluation
The quantitative evaluation for comfort was based on temperature, relative humidity, and
carbon dioxide readings of the indoor spaces of two units at North Park. The interior
measurements form part of the larger data logging efforts for this research project. The
requirements for comfort are cross referenced with the Passive House Institute (PHI)
standard requirements and with ASHRAE-55: Thermal Environmental Conditions for
Human Occupancy.
4.1.1 Methodology
The metrics for indoor air quality and comfort included ambient air temperature, relative
humidity, and Carbon Dioxide (CO2). Additional comfort metrics included analogues to the
mean radiant temperature, as measured by the surface temperature of the drywall.
The CO2 sensor details are provided in Table 4-1. The temperature and RH sensors were
the same as those used within the building enclosure and are described in Section 3.1.1.
TABLE 4-1 – SENSOR DESCRIPTION
Sensor Type Description Accuracy
CO
2
(from co2meter.com)
Carbon dioxide sensor (COZIR 2K)
±50ppm or ±3%
The temperature, RH, and CO2 sensors were installed in a hollowed out smoke detector on
the underside of the ceiling in the two critical locations for the suites: the living room and
the master bedroom. The locations are shown in Figure 4-1.
.

8820.003 RDH Building Science Inc. Page 23
Figure 4-1 – Typical floor plan showing the approximate locations for surface temperature sensors and indoor air quality sensors.
Surface Temperature Sensor
Relative Humidity and Temperature Sensor
CO2 Sensor

Page 24 RDH Building Science Inc. 8820.003
4.1.2 Results
The hourly temperatures for the living room and bedroom for Suite A and Suite B are
provided in Figure 4-2.10 The living rooms all have southern exposures, while the
bedrooms face north.
Figure 4-2 – Hourly Interior Temperature Living Room in Suite A and B, and Bedroom in Suite A,
including Outdoor Temperature for Reference with 24-hr Running Average in Bold.
In general, the interior conditions remain close to the designed 20°C target. The two
boxed areas of Figure 4-2 above, one blue and the other red, representing a typical cold
month (January) and hot month (August), are enlarged in Figure 4-3 and Figure 4-4,
respectively.
10 Due to instrumentation problems, the indoor IAQ package for Suite B Living Room could not be used.
0
5
10
15
20
25
30
35
Jan Feb Mar Apr May Jun Jul Aug Sep Oct Nov Dec Jan
Te
mp
era
ture
(°C
)
Temperature - Outdoor Temperature - Suite A- Living Room
Temperature - Suite A- Bedroom Temperature - Suite B- Bedroom

8820.003 RDH Building Science Inc. Page 25
Figure 4-3 – January Hourly Temperatures, with 24-hr Running Average in Bold.
Figure 4-4 – August Hourly Temperatures, with 24-hr Running Average in Bold.
A review of the month of August indicates several hours that exceed the 25°C upper limit
for interior temperatures recommended by the PHPP design tool. A 3-day break-down is
for the warmest period in August, including outdoor temperature, is provided in Figure
4-5 below.
-5
0
5
10
15
20
25
Jan-01 Jan-08 Jan-15 Jan-22 Jan-29
Te
mp
era
ture
(°C
)
Temperature - Outdoor Temperature - Suite A- Living Room
Temperature - Suite A- Bedroom Temperature - Suite B- Bedroom
10
15
20
25
30
35
Aug-01 Aug-08 Aug-15 Aug-22 Aug-29
Te
mp
era
ture
(°C
)
Temperature - Outdoor Temperature - Suite A- Living Room
Temperature - Suite A- Bedroom Temperature - Suite B- Bedroom

Page 26 RDH Building Science Inc. 8820.003
Figure 4-5 – Warmest 3-Day Hourly Temperature Conditions for August, 2016. The
timelapse between peaks is approximately 6-hrs, with a faster response exhibited in the
bedrooms, possibly due to operable window use.
A review of these conditions shows that elevated interior temperatures track elevated
exterior temperatures. However, as the nightly outdoor temperature falls, so too does the
interior temperature.
To show the range in temperatures, a series of monthly boxplots were prepared to help
analyse the results (Figure 4-6 and Figure 4-7). The solid box represents the 25% to 75%
percentile, with the “whiskers” representing the 5% and 95% conditions; the line connects
to the 50% mean. The hourly outliers are represented by coloured circles.
Figure 4-6 – Monthly Temperature Boxplots. The 25°C Threshold Line is Shown in Red.
10
15
20
25
30
35
Aug-19 Aug-20 Aug-21 Aug-22
Te
mp
era
ture
(°C
)
Temperature - Outdoor Temperature - Suite A- Living Room
Temperature - Suite A- Bedroom Temperature - Suite B- Bedroom

8820.003 RDH Building Science Inc. Page 27
Figure 4-7 – Monthly Relative Humidity Boxplots.
The average monthly temperatures in the bedrooms appear to be higher than the living
room/kitchen throughout the year, but for most of the year, are not statistically different.
A distinctive seasonal trend, which would be expected for a building with a strong passive
heating aspects, is also apparent. The relative humidity appears to be well controlled and
falls below 50% for most of the year, which helps minimize risks of moisture related
damage to the building enclosure. It also suggests effective air exchange from the HRV.
Similar to what the hourly data suggests, there are a statistically significant number of
hours in which the indoor temperatures exceed 25°C. To demonstrate the number of
hours in a year that exceed the threshold, a cumulative distribution with the number of
hours exceeding a given temperature is shown in Figure 4-8.
Figure 4-8 – Cumulative Distribution Plot of Percent Hours Exceeding Limiting Temperatures
0%
10%
20%
30%
40%
50%
60%
70%
80%
90%
100%
15 17.5 20 22.5 25 27.5 30
Pe
rce
nt
Tim
e E
xce
ed
ing
Temperature (°C)
Temperature - Suite A- Living Room Temperature - Suite A- Bedroom
Temperature - Suite B- Bedroom

Page 28 RDH Building Science Inc. 8820.003
For most of the year, the interior temperatures did not dip below 20°C and did not exceed
25°C.
However, in the bedroom of suite B, approximately 13% of the total hours in the year
exceeded 25°C, while both monitored rooms in Suite A did not experience much more
than 6% of total annual hours in this range. The Passive House criteria is that no more
than 10% of total hours are greater than 25°C.
During the heating season, the living room of suite A experienced about 5% of hours
below 17.5°C. These variations may be indicative of occupant preference, or potentially an
ongoing learning curve to optimize operation of the suites’ heating, ventilation system,
and/or exterior shading devices.
Carbon Dioxide
Carbon dioxide is used as a general indicator of the quality of the interior air. While it is
not considered to be toxic to humans (occupational exposure limit to not exceed 5,000
ppm daily average), higher levels of CO2 do correlate with undesirable indoor air quality.
The hourly CO2 are plotted for the interior air monitoring packages, shown in Figure 4-9.
The hourly data were corrected for CO2 sensor slope error by regressing against the
minimum 24-hr reading throughout the year and then applying a linear translation
correction to meet a 400 ppm outdoor level.
Figure 4-9 – Hourly CO2 Readings in Living Rooms in Suite A and Bedrooms in Suite A
and B, with Running 24hr- Average in Bold.
• Short term spikes exceeding 1400 ppm are not uncommon, particularly in the
living room where the occupants’ use of space can raise interior CO2 levels, but
the 24-hr running average appears to maintain conditions below 800 ppm. The
large difference in peaks to valleys appears to be a result of the HRV providing
fresh air to the interior space once the CO2 source has been removed or the HRV
flow being manually increased. Due to the high-performance enclosure, proximity
to potential ducts is not believed to cause undue influence on readings. The
400
600
800
1000
1200
1400
1600
1800
Jan Feb Mar Apr May Jun Jul Aug Sep Oct Nov Dec Jan
CO
2 (
pp
m)
Suite A Living Room Suite A Bedroom Suite B Living Room

8820.003 RDH Building Science Inc. Page 29
cumulative plot of the percent time that the interior CO2 levels exceed the
threshold is shown in Figure 4-10.
Figure 4-10 – Percent Hours Exceeding Limiting CO2 Values.
The CO2 levels in Suite A’s bedroom and Suite B’s living room fall below 800 ppm more
than 95% of the time. The CO2 level in Suite A’s living room rises above 800 ppm about
27% of the time. While CO2 is a good indicator of occupant use and air quality, qualitative
data provided by occupants supplements the CO2 data with their experiences and patterns
living in the space. Occupant interviews indicate a significant range in occupancy pattern
and pet ownership between Suite A and B, which likely accounts for the observed
differences. Factors such as whether the bedroom door is kept open overnight could also
impact these results.
Mean Radiant Temperatures
Mean radiant temperatures combine air temperature with the effect of surface
temperatures radiating to the body, and are considered to provide a more complete
indicator of occupant comfort. Location of the radiating bodies as well as blocking
materials, such as clothing, can affect the functional mean radiant temperature. The
prescriptive requirement of the Passive House Standard is that interior surface
temperatures shall not be greater than 4.2°C below ambient11. Using the drywall
thermistor data from the monitored wall assemblies, a plot of the interior surface
temperature was created, shown in Figure 4-11. The secondary y-axis shows the
difference between the wall surface temperature and the ambient air. Despite the location
of the air temperature sensors being situated near the ceiling, the high-performance
enclosure would minimize stratification effects.
11 Passive House, EnergPHit, and PHI Low Energy Building Standard, version 9f, revised 15.08.2016
0%
10%
20%
30%
40%
50%
60%
70%
80%
90%
100%
400 600 800 1000 1200 1400 1600 1800
Pe
rce
nt
Tim
e E
xce
ed
ing
CO2 Concentration (ppm)
Suite A Living Room Suite A Bedroom Suite B Living Room

Page 30 RDH Building Science Inc. 8820.003
Figure 4-11 – Drywall Surface Temperature (Above) and Temperature Differential with
Interior Air Conditions (Below) – Red Line Indicates 4.2°C Threshold.
For most of the year, the surface temperatures fall within ±5°C of the room air
temperature. However, Suite A’s Bedroom seems to be an exception, where very cold
temperatures (<16°C) combined with temperature differences exceeding 6°C occur in the
winter months. These differences could be caused by an opened window, or interior
furniture placed against the wall. The placement of dressers, bookshelves, or beds against
a wall will insulate the drywall from the room-side environment, causing it to be colder
than it otherwise would be when exposed to conditioned interior air.
4.1.3 Discussion
Interior comfort is dependent on several variables extending beyond just interior
temperature, relative humidity, and CO2, including metabolic activity, clothing, and even
interior paint colour and lighting.
The quantitative data suggests that the interior air is of good quality, with low instances
of odour or elevated humidity, as based on CO2 readings. The HRV balancing report also
confirms that, during initial commissioning, the HRV was delivering adequate ventilation
air to both bedrooms and living room spaces. However, it appears that several hours
exceeded standard comfort levels for warmth during the summer in Suite A. Investigation
into these occurrences show that when outdoor conditions exceed 25°C and the night
time temperatures do not fall below 18°C, the interior temperatures may become
uncomfortably warm for some occupants. Use of exterior shading devices and night-time
outdoor air flushing techniques as modeled by the PHPP software may not match the
strategies used by the occupants. As will be seen in the qualitative evaluation section that
follows, several of the occupants were still learning how to best operate their systems
several months into the monitoring period.
The qualitative evaluation of comfort provides information about how occupants feel
about their living space.
-10
-5
0
5
10
15
20
25
30
35
40
45
50
10
15
20
25
30
Jan Feb Mar Apr May Jun Jul Aug Sep Oct Nov Dec
ΔT
(°C
)
Su
rfa
ce T
em
pe
ratu
re (°C
)
Suite A Living Suite A Bedroom Suite B Living Suite B Bedroom

8820.003 RDH Building Science Inc. Page 31
4.2 Qualitative Evaluation – Occupant Surveys
In addition to perceptions of comfort, the overall objective of the qualitative research was
to gain insight on various elements of living in a low energy home like the North Park
Passive House by interviewing the homeowners/occupants about their expectations at two
different points in time: first, prior to moving in and second, after they have lived in their
homes for some time. More specifically, the interviews sought to address the following
objectives:
� To identify why the homeowners chose to buy at North Park.
� To understand the initial expectations of the homeowners/occupants.
� To gain feedback on the overall experience of homeowners/occupants after living
in their homes through their first fall and winter seasons.
� To assess homeowners’/occupants’ level of knowledge of sustainable housing
technologies and features including operating and maintenance needs.
� To understand the features that the homeowners/occupants like the most and
like the least, as well as challenges and surprises that came up since moving into
their homes.
� To determine how occupant behavior is affected or changed by living in a Passive
House.
� To ascertain homeowner/occupant perceptions of specific benefits – and costs ‐
of living in a Passive House.
4.2.1 Methodology
All occupants of North Park were invited to participate in qualitative interviews. The first
round of interviews was conducted immediately after move-in, in September 2015. The
second round was conducted in February 2016, after occupants had spent several months
living in their homes and had lived through their first fall and winter.
Semi-structured interviews were conducted in person, in the occupants’ homes. Where
possible, and where two adults shared a suite, they were interviewed at the same time.
Interview format and guiding questions are included in Appendix A, with an open-ended
format to explore the occupants’ perceptions and experiences. Detailed notes were taken
and coded from each recorded interview. Common themes were extracted from the
results using an inductive process.
4.2.2 Results
At least one occupant from all six suites participated in the “Pre-Occupancy” interviews.
Occupants from four of the six suites participated in the “Post-Occupancy” interviews.
Table 4-2 below summarizes key themes that were touched on by the occupants.
TABLE 4-2: SUMMARY QUALITATIVE INTERVIEW RESPONSES – PRE-OCCUPANCY
# of suites (of 6 interviewed)
1. Factors in choosing to buy at North Park:
Location All suites

Page 32 RDH Building Science Inc. 8820.003
TABLE 4-2: SUMMARY QUALITATIVE INTERVIEW RESPONSES – PRE-OCCUPANCY
Aligned with values (environmentally conscious and/or low impact lifestyle)
All suites
Expected low energy costs 5/6 suites
Affordable price point 4/6 suites
Expected low strata fees 4/6 suites
Layout/size/appearance 4/6 suites
Quality of construction/durability 2/6 suites
Parking spot 2/6 suites
Other responses expressed by only 1 suite: expected high level of air quality; being rentable; expected investment/resale value
2. Expectations:
Learning curve to learn to operate the HRV, external shades etc
4/6 suites
No major change in lifestyle expected 3/6 suites
Some change in lifestyle expected 2/6 suites
High level of comfort/no drafts 2/6 suites
Other responses expressed by only 1 suite: less maintenance and repairs; potentially cold feet? Potentially stuffy?
TABLE 4-3: SUMMARY QUALITATIVE INTERVIEW RESPONSES – POST-OCCUPANCY
# of suites (of 4 interviewed)
1. Overall experience so far:
Satisfied or very satisfied All suites
Reasons cited:
Warmth/comfort/interior conditions 3/4 suites
Quietness 3/4 suites
Low electricity bills 3/4 suites
Low strata fees 3/4 suites
Design/layout 2/4 suites
Other responses expressed by only 1 suite: indoor air quality; in-suite hot water
2. Challenges and issues:
Learning to operate the ventilation and/or heating system, when to open windows (varying responses: too warm in winter; too cold overnight; air dry overnight, cold floor; managing the heat with lots of people over)
All suites
Quality of interior finishes below expectations/issues with resolving cosmetic issues
All suites

8820.003 RDH Building Science Inc. Page 33
TABLE 4-3: SUMMARY QUALITATIVE INTERVIEW RESPONSES – POST-OCCUPANCY
Energy monitoring system not working/not end-user friendly
3/4 suites
Internal noise more noticeable than expected, particularly for lower suites
2/4 suites
Energy bills very good but higher than expected
2/4 suites
Difficulty/cost associated with re-keying the European exterior door
2/4 suites
Other responses expressed by only 1 suite: noise from adjacent electrical room; cost of window coverings for custom windows; drainage issues from slab construction; loss of closet space to HRV; lack of light in north facing room; commissioning-related issues; getting used to condensing dryer
3. Lifestyle change resulting from living at North Park?
No/not really 3/4 suites
4. Perceived investment/resale value:
Passive House factor will be a benefit for resale value
3/4 suites
5. Would you recommend a Passive House based on your experience?
Yes All suites
4.2.3 Discussion
Overall, the interviewed occupants at North Park were satisfied or very satisfied with their
experience of living in a Passive House so far, and all would recommend it based on their
experience.
A key takeaway from the pre-occupancy interviews was that the market appeal to the
buyers, many of whom were first time home buyers and young urban professionals, was a
combination of sustainable design, location, and price point.
Most occupants expressed a prior level of commitment to a low impact and/or
environmentally conscious lifestyle, but Passive House was a new concept for most. Most
buyers therefore had an expectation going in that there would be a learning curve to
understanding how the building and system works. Post-occupancy, some occupants were
still struggling to understand how best to operate the system, while others felt it was
simple.
More detailed guidance on how to operate the HRV, heating system, when to open
windows etc, would likely be of benefit to new occupants.
‘A good owner’s manual would help,’ offered the occupants of one suite who were still
struggling to understand their heating and ventilation system.
‘It’s a Passive House, not a magic house,’ said the occupants of another suite who felt
their expectations may have been unreasonably high prior to moving in.

Page 34 RDH Building Science Inc. 8820.003
There was some variation in the experience of internal noise between occupants of upper
and lower suites, with lower suites experiencing more internal noise (e.g. from people
walking up their stairs). With respect to thermal comfort, one upper suite reported being
“almost too warm” while the other “had some very cold nights”. This could be due to
varying amounts of heat migrating up from lower floors, as well as potential operational
issues; for example, with the settings on the HRV, the use of operable windows and/or
the use of operable exterior shades.
The variation in responses around energy use correlates with the wide range in suite level
energy data. This range may be due to both the living habits and preferences of the
occupants, but the responses also indicate that some occupants may still be figuring out
how to operate their suites in the most efficient and comfortable way.

8820.003 RDH Building Science Inc. Page 35
5 Energy and Water Consumption
5.1 Methodology
To analyse the energy and water consumption of the building, utility data was collected
for a minimum of one full year post-occupancy. Results presented as consumption per
square metre were calculated based on the building’s GFA (469 m2).12
Whole building energy data for the six suites plus one common account was provided by
BC Hydro, from September 2015 to February 2017. The data was normalized to average
weather data based on Canadian Weather for Energy Calculations (CWEC). The normalized
consumption was compared against the consumption modeled by the Passive House
Planning Package (PHPP) software used to document and certify Passive Houses. Heating
demand vs. base loads were also analysed to better understand where the model and
actual consumption diverged.
Electricity consumption from individual suites was also collected to provide insight in the
range of suite-level consumption and the impact of occupant behaviour. Limited circuit-
level metering was collected using a “The Energy Detective” (TED) Pro Home residential
electricity monitoring system, with Spyder multiplexer, which enabled end use monitoring
of up to eight individual circuits at a suite’s electrical panel.
Water consumption data for the whole building was provided by the City of Victoria. While
data was provided from July 2015 to November 2016, the data prior to full-occupancy in
September 2015 was incomplete and not used in our analysis. Readings were provided in
three month intervals. To reflect monthly consumption, the raw billing data was adjusted
to calendarized data. The measured consumption for 2016 was used to calculate the total
annual water consumption. Due to the nature of the billing period, water consumption
from December 2015 was included in the yearly 2016 total (data from December 2016
was not available at the time of this study).
5.2 Results
5.2.1 Energy Consumption
The measured, normalized annual energy consumption of the whole building was found
to be 33,570 kWh, or 72 kWh/m2·yr.
The modeled annual energy consumption predicted a value of 43 kWh/m2·yr for the
whole building for a typical weather year. The measured, normalized consumption was
therefore found to be 66% higher than the model predicted. A comparison chart of the
monthly consumption between the actual energy and modeled energy is presented in
Figure 5-1 below.
12 Passive House modeling uses Treated Floor Area, TFA, in its calculation of heating demand, which is a smaller area than Gross Floor Area, which includes exterior walls, and Total (conditioned) Floor Area, which excludes exterior walls but includes interior partition walls. To enable comparison across the industry, the more commonly used GFA was used.

Page 36 RDH Building Science Inc. 8820.003
Figure 5-1 – Actual and Modeled Monthly Whole Building Energy Consumption
Further analysis was conducted to investigate the breakdown of the building’s energy
consumption. The metered results were broken down into heating consumption and
baseline consumption (everything other than heating). An estimate of the heating
consumption was determined by comparing the PHPP model monthly heating demands.
The model indicated that the building would have zero heating demands during the
warmer months of June, July, August and September. The assumption that no heating was
used for these months was, in turn, adopted for the metered results to estimate a
baseline consumption. The two graphs below present the results of the modeled energy
breakdown (Figure 5-2) and the actual energy breakdown (Figure 5-3).
Figure 5-2 – PHPP Modeled Energy Consumption Breakdown
0
500
1000
1500
2000
2500
3000
3500
4000
Jan Feb Mar Apr May Jun Jul Aug Sep Oct Nov Dec
kWh
Actual energy consumption Modeled energy consumption
0
500
1,000
1,500
2,000
2,500
3,000
3,500
4,000
4,500
5,000
Jan Feb Mar Apr May June July Aug Sept Oct Nov Dec
kWh
Modeled Energy Consumption Breakdown
PHPP Modeled Baseline Demand PHPP Modeled Heating Demand

8820.003 RDH Building Science Inc. Page 37
Figure 5-3 – Actual Energy Consumption Breakdown
Table 5.1 below summarizes the breakdown results.
TABLE 5.1: SUMMARY OF END-USE ENERGY BREAKDOWN
PHPP Modeled Energy Actual Energy (kWh/m2·yr)
kWh kWh/m2·yr kWh kWh/m2·yr
Heating 4,130 8.8 4,690 10.0
Baseline 16,040 34.2 28,880 61.6
TOTAL 20,170 43 33,570 72
While the total actual energy consumption was found to be significantly higher than the
total modeled consumption, the breakdown shows that most of this can be attributed to
baseline consumption. The building’s heating more closely reflects the modeled heating
demand, further illustrated in Figure 5-4 below.
Figure 5-4 – Comparison of Actual and PHPP Modeled Heating Demand
0
500
1,000
1,500
2,000
2,500
3,000
3,500
4,000
4,500
5,000
Jan Feb Mar Apr May June July Aug Sept Oct Nov Dec
kWh
Actual Energy Consumption Breakdown
Actual Baseline Consumption Actual Heating Consumption
0.0
0.5
1.0
1.5
2.0
2.5
3.0
3.5
4.0
Jan Feb Mar Apr May June July Aug Sept Oct Nov Dec
kWh
/m2
∙yr
Actual Heating Consumption PHPP Modeled Heating Demand

Page 38 RDH Building Science Inc. 8820.003
Further analysis was conducted for suite consumption. All suites are two-bedroom, but do
range in size. The average annual suite consumption was found to be 5,375 kWh/yr, with
4 out of the 6 suites falling within one standard deviation of the mean. The data suggest a
wide range in energy consumption at the individual suite level. If all suites maintained
consumption at rates similar to the lowest consuming suite (3,530 kWh/yr), total building
energy consumption would be approximately 46 kWh/m2·yr, very close to the modeled 43
kWh/m2·yr.
5.2.2 Sub-metered energy consumption
Sub-metered data from one unit, representing electrical consumption between October
20th, 2015, to January 6th, 2016, was collected and used to validate our assumptions about
heating versus base loads. It also provided additional information on the base load end
uses for a limited time period. The power at the circuit breaker was recorded, in addition
to the total electrical consumption of the suite. The daily energy consumption for the
monitored unit is shown in Figure 5-5, with the dark bands representing the weekends.
Figure 5-5 – Daily Energy Consumption for Monitored Suite.
The sub-metered data permitted a further breakdown of the major components of energy
consumption within the suite. Due to a problem with the circuit transfer for the HRV, and
the use of an additional heater on a non-monitored circuit, the heating loads could not be
confirmed with the data logger configuration.
However, an estimate of the heating load can be calculated by considering that the total
baseline energy consumption of the suite when unoccupied should consist mostly of HRV,
domestic hot water and other electrical system stand-by losses, and any required heat.
The installed HRV is stated to use around 1.5-2kWh per day when running continuously
and data from the breakdown suggest a baseline refrigerator load and hot water tank
losses of around 0.4 and 0.6 kWh per day, respectively. Consequently, subtraction of the
assumed loads permits an estimate of the baseline heating load. This yields a breakdown
shown in Figure 5-6.
0
5
10
15
20
25
30
35
40
En
erg
y C
on
sum
pti
on
(k
Wh
/da
y)

8820.003 RDH Building Science Inc. Page 39
Figure 5-6 – Refined Energy Consumption with HRV and Heating Load Assumptions, from January 1st to January 5th, 2016
The average estimated heating requirements over this monitoring period averaged around
6.8 kWh per day, which is slightly more than the average suite value calculated from the
actual energy consumption for the month of January. This result is consistent with this
suite’s larger size and higher than average overall energy consumption.
5.3 Discussion
Consistent with other measurement and verification studies, the PHPP model
underestimated the non-heating energy demands. The range in consumption across the
six suites was also significant. If all six suites performed at the level of the lowest
consuming suite, the energy demand per square foot would be very close to the modeled
energy demand.
These results point to the significant impact that occupant behaviour has on the actual
energy consumption of even a building like a Passive House that is intentionally built to
dramatically reduce heating demand.
With improved enclosure performance, a lesser component of energy consumption is
required for space heating or cooling. Thus, the fraction of energy consumption used for
occupant related operation increases as a proportion of total energy use. The fraction of
the daily energy use just for domestic hot water amounts to approximately 45% of total
energy consumption, whereas supplemental space heating is estimated in to range in the
25% range. Consequently, in higher performance buildings, greater focus will be required
to minimize occupant related operation loads on the building, requiring higher efficiency
appliances and domestic hot water heating strategies to minimize electrical use.
Having said this, the actual energy consumption of the building is still well below that of
buildings meeting the requirements of local building and energy codes.
0
5
10
15
20
25
30
35
40
2016-01-01 2016-01-02 2016-01-03 2016-01-04 2016-01-05
En
erg
y C
on
sum
pti
on
(k
Wh
)
Appliance Load Hot Water HRV Heating Other Total

Page 40 RDH Building Science Inc. 8820.003
There is limited available data on the actual metered energy consumption of new low-rise
residential buildings. However, a recent study13 completed detailed whole building
modeling of new residential buildings built to ASHRAE 90-1-2010 prescriptive
requirements (i.e., consistent with the energy requirements in the current BC Building
Code (2012)). This study modeled an electrically heated wood-frame building at 132
kWh/m2·yr - nearly double North Park’s EUI of 72. Another study14 measured performance
of existing low-rise residential buildings in south-west BC, with construction dates ranging
from 1970s to 2000s, and found an average EUI of 171 kWh/m2.
5.3.1 Water Consumption
The overall building water consumption for 2016 was found to be approximately 669,000
litres. The annual usage based on the building’s GFA is 1,426 litres/m2. This includes all
six suites and common areas. Water usage is also typically expressed in litres per person
per day. Based on occupant interviews, it is estimated that there were 10 occupants in the
building during 2016, resulting in an average daily water use of 183 litres per person.
The building was not specifically designed to be water efficient beyond good standard
practice. However, water consumption is lower than the average per person consumption
in Canada, which was 251 L/person in 201115. This likely reflects current code
requirements for low flow plumbing fixtures, in combination with a small landscaped area
and minimal irrigation needs at the building.
13 Carbon Neutral 4-6 Storey Multifamily Buildings, March 2016, by RDH for the City of Vancouver
Sustainability Group, including updates. 14 Energy Consumption in Low Rise Multifamily Residential Buildings, March 2017, by RDH Building Science for BC Housing. 15 https://www.ec.gc.ca/indicateurs-indicators/default.asp?lang=en&n=7E808512-1

8820.003 RDH Building Science Inc. Page 41
6 Financial Analysis
This section summarizes actual construction cost and summarizes the financial analysis
to determine the Net Present Value (NPV), Internal Rate of Return (IRR) and Discounted
Payback of the additional investment to build a Passive House.
6.1 Construction Cost
Construction cost data was collected as part of a separate study, The Business Case for
Passive House16, which is excerpted here. The builder reported that final construction and
soft costs were approximately $2519/m2 ($234/ft2), or $1,134,000 total. The incremental
increase above a non-Passive House building of similar build quality was approximately
4.2%.
Key differences in construction costs were estimated for the major building components,
as summarized in Table 6-1 below.
TABLE 6-1: SOURCES OF COST DIFFERENCES
Building Component $ Diff. Description
Architecture +$10,000 More detailed design and advanced planning of details to eliminate thermal bridging
Certification +$5,000 Cost for achieving Passive House certification
Foundation and Slab +$10,900 Thicker insulation and additional rebar reinforcement
Walls & Insulation +$7,500 Additional lumber and labour for 2x8 stud wall and service cavity
Air Sealing & Acoustics +$10,000 Additional labour and higher quality tape to achieve very tight air barrier
Ventilation +$16,000 Compared to a lower efficiency/lower cost HRV for each suite
Heating -$30,000 Compared to in-floor radiant heating system to achieve comparable level of thermal comfort
Plumbing & Electrical No change
Windows & Doors +$17,900 Compared to double paned windows and glass doors with similar quality and functionality (e.g. tilt-and-turn windows)
Total incremental cost $47,300
6.2 Energy Cost
Average weather normalized energy consumption at North Park was 72 kWh/m2·yr, or
33,570 kWh total. The whole building base electricity cost was estimated at $2,676 at
January 2016 electricity rates, or approximately $446 per suite per year (~$37/month per
suite for all electricity). This excludes the contribution of net metering from the solar PV
array, which was not available at the time of completing this research.
16 Business Case for Passive House report, dated May 27, 2015, by Synergy Sustainability Institute.

Page 42 RDH Building Science Inc. 8820.003
To determine the savings over a more conventional build, an estimate of the energy
consumption of a conventional build was needed.
Previously cited whole building modeling of new multifamily residential buildings built to
ASHRAE 90-1-2010 prescriptive requirements benchmarks a new electrically heated wood-
frame multifamily building at 132 kWh/m2·yr17, or 61,940 kWh per year for a building of
the same size as North Park. This metric was used for this analysis.
6.3 Financial Analysis
Cost-effectiveness indicators used for the financial analysis were as follows:
� Net present value (NPV) = discounted future benefits from lower energy bills,
minus incremental capital cost. Benefits and costs were considered for a period of
30 years. A positive NPV indicates a “profitable” investment, whereby benefits
exceed costs after applying the discount rate.
� Internal Rate of Return (IRR) = the rate of return that corresponds to an NPV of
zero; or a “break-even” point for the investment. This IRR can be compared to the
discount rate or required rate of return. If the IRR is larger than the discount rate,
then the investment is considered economically attractive.
� Discounted payback period = the number of years (rounded up for decimals) after
which the discounted benefits exceed the incremental capital costs.
The following parameters were used for the financial analysis:
� BC Hydro Residential electricity prices as of January 2016:
� Step 1 $0.0797 per kWh (up to 1,350 kWh in a two-month billing period). All
consumption was assumed to fall within Step 1.)
� Energy escalation per BC Hydro scheduled increases through 2019, and 2% net of
inflation for the remainder of the analysis period, as follows:
� 2016: 4% increase
� 2017: 4% increase
� 2018: 3.5% increase
� 2019: 3% increase
� 2% increase net of CPI thereafter
� Discount rate 6% (real, net of normal inflation)
� CPI 1.1%
17 Carbon Neutral 4-6 Storey Multifamily Buildings, March 2016, by RDH for the City of Vancouver Sustainability Group, including updates.

8820.003 RDH Building Science Inc. Page 43
The results are summarized in Table 6-2 below:
TABLE 6-2: FINANCIAL ANALYSIS SUMMARY
Annual Energy
Savings
Net Present Value
(NPV)
Internal Rate of
Return (IRR)
Discounted
Payback Period
(kWh/m2) ($/m2) (%) (Years)
60 -$13.93 5% 17
The financial analysis suggests that based on the factors considered, the upfront
investment is marginally cost effective. The NPV is slightly negative; the IRR is close to the
assumed discount rate, and the discounted payback period is between 11 and 20 years.
Consistent with the theoretical analysis completed previously, energy cost savings alone
are therefore not sufficient to offset the additional upfront investment in the shorter term.
However, this basic financial analysis only paints a part of the picture. There are several
financial components that were not included in this analysis, including the following:
� Most owners report that their strata fees are lower than other buildings they
considered buying into, suggesting that the incremental cost was not borne by
the buyers, or that the perceived value for the money was equal to or better than
other options.
� Cost offset by on-site solar PV and net metering
� Potential increased resale value
� Most owners believed the price was comparable or better than other condos they
looked at
� Additional savings beyond the 30-year analysis period
This research also documented several non-monetary benefits to living at the North Park
Passive House, including perceived building durability, improved air quality and perceived
comfort, and the ability to live in a home that reflects one’s personal values.

Page 44 RDH Building Science Inc. 8820.003
7 Conclusions
7.1 Enclosure Performance
The monitoring and analysis indicates that the north facing exposures were generally
wetter than the south facing ones, but all monitored locations showed drying over time,
with a low risk of long term mould growth.
7.2 Thermal Comfort and Air Quality
Interior temperatures were generally within a comfortable range throughout the
monitoring period. However, one suite experienced 13% of hours greater than 25° C
during warm periods in the summer, and some temperatures lower than 17.5° C in the
winter. Indications supported by the occupant interviews suggest that some occupants are
still learning how to best operate the heating and ventilation systems, as well as when to
open windows and use operable shades. This feedback indicates an opportunity to further
improve both comfort conditions and energy consumption in the building.
Relative humidity was well managed at all monitored locations throughout the year.
CO2 levels are generally very good, and occupants reported either good perceived air
quality, or made no comment about air quality, suggesting that the HRV was providing
acceptable air exchanges. Some spikes and variation between suites was observed, likely
due to different occupancy patterns, activity levels and pet ownership.
Qualitative interviews indicated that all participating occupants were satisfied with their
experience living at North Park, but learning opportunities likely still exist to improve
operation and comfort.
7.3 Energy and Water Consumption
The actual energy consumption at North Park is higher than modeled but still much lower
than a conventional new building, and significantly better that a typical existing building.
Also, the analysis showed that the actual heating demand was close to the PHPP modeled
demand, indicating that the source of divergence is in base loads (plug loads, domestic
hot water, etc). In other words, occupant preferences and behaviours have a significant
impact on the final energy consumption. Suite level utility data suggests a broad range in
consumption between suites, further supporting this observation.
Water consumption is lower than the Canadian average, but not unexpectedly so for a
building with limited landscaping and standard low flow fixtures.
7.4 Financial Analysis
The estimated incremental cost to upgrade a building of comparable quality to Passive
House was 4.2%. Annual energy savings were estimated to be 28,370 kWh per year, or 60
kWh/m2.
The financial analysis suggests that based on the factors considered, the upfront
investment is marginally cost effective. The NPV is slightly negative; the IRR is close to the
assumed discount rate, and the discounted payback period is between 11 and 20 years.

8820.003 RDH Building Science Inc. Page 45
Consistent with the theoretical analysis completed previously, energy cost savings alone
are therefore not sufficient to offset the additional upfront investment in the shorter term.
However, this basic financial analysis paints only part of the picture. There are several
financial components that were not included in this analysis, including a perceived
competitive sales price and resale value; cost offset of net metering, and ongoing savings
realized after the analysis period.
This research also documented several non-monetary benefits to living at the North Park
Passive House, including a high level of occupant comfort, perceived building durability,
improved air quality, and the ability to live in a home that reflects one’s personal values.
7.5 Lessons Learned
In addition to the construction lessons that the builder shared, there were several lessons
learned by the research team that can inform future monitoring and verification projects.
Design & Construction
The key lesson learned from the design and construction process was the importance of
keeping the building form simple. Because of the complicated dormer roof shape, the
builder reported that two-thirds of the construction cost and two-thirds of the energy
losses were concentrated on the upper one-third of the building. In future projects, the
builder has insisted on a simpler roof shape.
Partial pre-fabrication of the deep stud wall was also explored early on in this project, but
found to be cost-prohibitive for a project of this small scale.
No supply chain issues were reported by the builder. All materials and products were
readily available through local or regional suppliers.
Instrumentation
Challenges were encountered as part of the instrumentation of the building that
manifested in erroneous sensor readings, unidentifiable and unlocatable sensors, and
issues in tracing sensors back to their locations. These instrumentation problems created
data reliability concerns and alternative solutions and assumptions were required to
achieve the research objectives. While an intentional degree of redundancy was provided
in the initial sensor layout in anticipation of potential problems, some of the critical and
non-duplicatable sensors (i.e. indoor CO2 and T&RH sensors) were non-functional.
As this research project was an addendum to the construction of the building, the sensor
installation had to be phased in whenever an opportunity presented itself in the
contractor schedule. This exposed many sensitive sensors to the rigors of a construction
environment for prolonged durations. Despite careful attention by the construction crew,
it is nonetheless inevitable that damage to the sensors could occur.
In the interest of efficiency, the contractor assisted with some of the instrumentation
installation. An electrician was provided with the bus cables to run back to the central
electrical room. However, upon investigation, the ordering of the cables did not appear to
match the monitoring locations. This led to challenges in tracing back sensors and
resulted in significant time troubleshooting problem sensors. Closer monitoring and
guidance during the installation would alleviate some future troubleshooting issues.

Page 46 RDH Building Science Inc. 8820.003
APPENDIX A: Occupant Interview Protocol and Questions

1701 - 4555 Kingsway
Burnaby, BC V5H 4V8
Phone: 604.439.4135
Toll-free: 1.866.465.6873
Email: [email protected]
www.bchousing.org