Low-Carbon Solid Waste Systems - Columbia University · Low-Carbon Solid Waste Systems Cody Taylor...
13
15th North American Waste to Energy Conference May May 21-23, 2007, Miami, Florida USA NAWTEC15-3215 Low-Carbon Solid Waste Systems Cody Taylor Emily Bedwell HDR Engineering HDR Engineering 115 Sansome Street, Ste 800 245 5 th Avenue, Suite 2401 San Francisco, CA 94104 New York, New York, 10016 Amy Guy David Traeger HDR Engineering HDR Engineering 115 Sansome Street, Ste 800 8404 Indian Hills Drive San Francisco, CA 94104 Omaha, Nebraska 68114 As awareness regarding the potential threat of climate change has grown in the US, many local govements and businesses are being asked to consider the climate implications of their actions. In addition, many leaders, including solid waste managers, who are not yet pressured from the outside, consider it prudent to account for their greenhouse gas ( GH G) emissions and consider it a proactive measure to assess climate risks and opportunities and to show commitment to progress. Sources ofGH G emissions in the solid waste management process include: waste transport vehicles, composting facilities, processing equipment, landfills, and waste-to-ener facilities. Over the past 25 years, the levels of GHG emissions have been reduced through technological advancements in waste-to-ener, environmental regulations such as the Clean Air Act, landfill gas capture and control, and the promotion ofrecycling and reuse. There are many opportunities for solid waste managers to fUrther reduce their GH G emissions levels, including promotion ofwaste-to-ener facilities as part of a low-carbon solid waste management plan. Waste-to-ener may also, in the future, offer potential revenue from the sale ofrenewable ener credits and carbon credits in emerging emissions trading programs. INTRODUCTION Today, increasing public conce and enhanced scientific analysis on the potential impacts of global climate change have led to pressure on lawmakers, regulators, public agencies, and private finns. The result thus far is a changing and uneven policy environment, with ambiguity about the nature and timing of ture developments sparking conce among both public agencies and private firms, as they struggle to plan effectively with this regulatory uncertainty. Many local govements and businesses are being asked to consider the climate implications of their actions. In addition, many leaders, including solid waste managers, who are not yet pressured om the outside, consider it prudent to account for their greenhouse gas (GHG) emissions and consider it a proactive measure to assess climate risks and opportunities and to show commitment to progress. There are many opportunities for solid waste managers to her reduce their GHG emissions levels, including promotion of waste- to-energy facilities as part of a low-carbon solid waste management plan. Waste-to-energy may also, in the ture, offer potential revenue from the sale of renewable energy credits and carbon credits in emerging emissions trading programs. The following sections briefly describe the scientific and policy background, the regulatory initiatives that are moving forward, the relevance of climate change to the solid waste field, and a carbon accounting approach for a solid waste manager interested in proactively and strategically engaging with the climate change issue. 155 CLIMATE CHANGE The Earth's weather and climate are driven by radiant energy om the sun. Certain naturally occurring gases trap some of that heat while the balance escapes into space. This effect of trapping the sun's heat, called the "greenhouse effect", maintains the Earth's average annual temperature of approximately 60 degrees Fahrenheit (F).[1] Figure I below graphically depicts the reflection and absorption of solar radiation. I 'uu� , � . . � Those gases which contribute to the greenhouse effect are called greenhouse gases (GHGs). These GHGs are emitted naturally through interactions between the components of the climate system, such as air, water, plants and land; and have kept the average temperature in a range that allows life to flourish (see Fig. 2).[3] Copyright © 2007 by HDR Engineering, Inc.
Transcript of Low-Carbon Solid Waste Systems - Columbia University · Low-Carbon Solid Waste Systems Cody Taylor...

15th North American Waste to Energy Conference
May May 21-23, 2007, Miami, Florida USA
NAWTEC15-3215
Low-Carbon Solid Waste Systems
Cody Taylor Emily Bedwell HDR Engineering HDR Engineering
115 Sansome Street, Ste 800 245 5th Avenue, Suite 2401 San Francisco, CA 94104 New York, New York, 10016
Amy Guy David Traeger HDR Engineering HDR Engineering
115 Sansome Street, Ste 800 8404 Indian Hills Drive
San Francisco, CA 94104 Omaha, Nebraska 68114
As awareness regarding the potential threat of climate change has grown in the US, many local governments and businesses are being asked to consider the climate implications of their actions. In addition, many leaders, including solid waste managers, who are not yet pressured from the outside, consider it prudent to account for their greenhouse gas ( GH G) emissions and consider it a proactive measure to assess climate risks and opportunities and to show commitment to progress. Sources ofGH G emissions in the solid waste management process include: waste transport vehicles, composting facilities, processing equipment, landfills, and waste-to-energy facilities. Over the past 25 years, the levels of GH G emissions have been reduced through technological advancements in waste-to-energy, environmental regulations such as the Clean Air Act, landfill gas capture and control, and the promotion of recycling and reuse. There are many opportunities for solid waste managers to fUrther reduce their GH G emissions levels, including promotion of waste-to-energy facilities as part of a low-carbon solid waste management plan. Waste-to-energy may also, in the future, offer potential revenue from the sale of renewable energy credits and carbon credits in emerging emissions trading programs.
INTRODUCTION
Today, increasing public concern and enhanced scientific analysis on the potential impacts of global climate change have led to pressure on lawmakers, regulators, public agencies, and private finns. The result thus far is a changing and uneven policy environment, with ambiguity about the nature and timing of future developments sparking concern among both public agencies and private firms, as they struggle to plan effectively with this regulatory uncertainty. Many local governments and businesses are being asked to consider the climate implications of their actions. In addition, many leaders, including solid waste managers, who are not yet pressured from the outside, consider it prudent to account for their greenhouse gas (GHG) emissions and consider it a proactive measure to assess climate risks and opportunities and to show commitment to progress. There are many opportunities for solid waste managers to further reduce their GHG emissions levels, including promotion of wasteto-energy facilities as part of a low-carbon solid waste management plan. Waste-to-energy may also, in the future, offer potential revenue from the sale of renewable energy credits and carbon credits in emerging emissions trading programs. The following sections briefly describe the scientific and policy background, the regulatory initiatives that are moving forward, the relevance of climate change to the solid waste field, and a carbon accounting approach for a solid waste manager interested in proactively and strategically engaging with the climate change issue.
155
CLIMATE CHANGE
The Earth's weather and climate are driven by radiant energy from the sun. Certain naturally occurring gases trap some of that heat while the balance escapes into space. This effect of trapping the sun's heat, called the "greenhouse effect", maintains the Earth's average annual temperature of approximately 60 degrees Fahrenheit (F). [1] Figure I below graphically depicts the reflection and absorption of solar radiation.
I.klstradlillion Is absorbed by the 8iJI1h'uu� and WiIIJI15 It ,� .... �
Those gases which contribute to the greenhouse effect are called greenhouse gases (GHGs). These GHGs are emitted naturally through interactions between the components of the climate system, such as air, water, plants and land; and have kept the average temperature in a range that allows life to flourish (see Fig. 2).[3]
Copyright © 2007 by HDR Engineering, Inc.
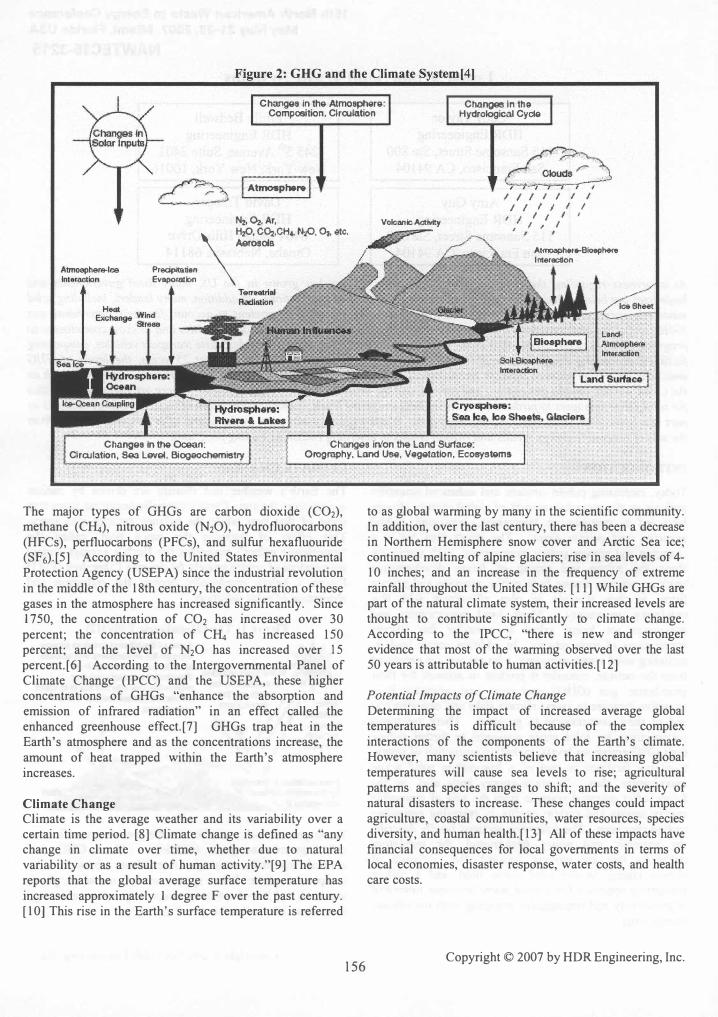
2: GHG and the Climate ... "�r"'",
Changes In the Atmosphere: CMng.ee�n � Hydrological Cyd9 Composition, Clrrulation
� I AtrnosPMN I
Predpitatien Evaporatloon
N2.�,Ar, \H�r C�,CH.,�, 03, /ltC. Aerosols
Volcanic Activity
�l <:-� 1II11 I 1
I I I I , I ,/ 1/ 1 1
I I , I i
Almoapher.Bloeph9re I nlBraction
Changes in the Ocean: Changesinlon the Land Surface: Clra:JJlltion, Sea Lsv9l, Biogeochemistry Orography, Land Use, V9gQtatlon, Ecosystems
The major types of GHGs are carbon dioxide (C02), methane (C�), nitrous oxide (N20) , hydro fluorocarbons (HFCs), perfluocarbons (PFCs), and sulfur hexafluouride (SF6).[5] According to the United States Environmental Protection Agency (USEPA) since the industrial revolution in the middle of the 18th century, the concentration of these gases in the atmosphere has increased significantly. Since 1750, the concentration of CO2 has increased over 30 percent; the concentration of C� has increased 150 percent; and the level of N20 has increased over 15 percent.[6] According to the Intergovernmental Panel of Climate Change (IPCe) and the USEP A, these higher concentrations of GHGs "enhance the absorption and emission of infrared radiation" in an effect called the enhanced greenhouse effect.[7] GHGs trap heat in the Earth's atmosphere and as the concentrations increase, the amount of heat trapped within the Earth's atmosphere increases.
Climate Change Climate is the average weather and its variability over a certain time period. [8] Climate change is defined as "any change in climate over time, whether due to natural variability or as a result of human activity."[9] The EPA reports that the global average surface temperature has increased approximately 1 degree F over the past century. [10] This rise in the Earth's surface temperature is referred
156
to as global warming by many in the scientific community. In addition, over the last century, there has been a decrease in Northern Hemisphere snow cover and Arctic Sea ice; continued melting of alpine glaciers; rise in sea levels of 4-10 inches; and an increase in the frequency of extreme rainfall throughout the United States. [ I I ] While GHGs are part of the natural climate system, their increased levels are thought to contribute significantly to climate change. According to the IPCC, "there is new and stronger evidence that most of the warming observed over the last 50 years is attributable to human activities.[12]
Potential Impacts of Climate Change Determining the impact of increased average global temperatures is difficult because of the complex interactions of the components of the Earth's climate. However, many scientists believe that increasing global temperatures will cause sea levels to rise; agricultural patterns and species ranges to shift; and the severity of natural disasters to increase. These changes could impact agriculture, coastal communities, water resources, species diversity, and human health.[13] All of these impacts have financial consequences for local governments in terms of local economies, disaster response, water costs, and health care costs.
Copyright © 2007 by HDR Engineering, Inc.

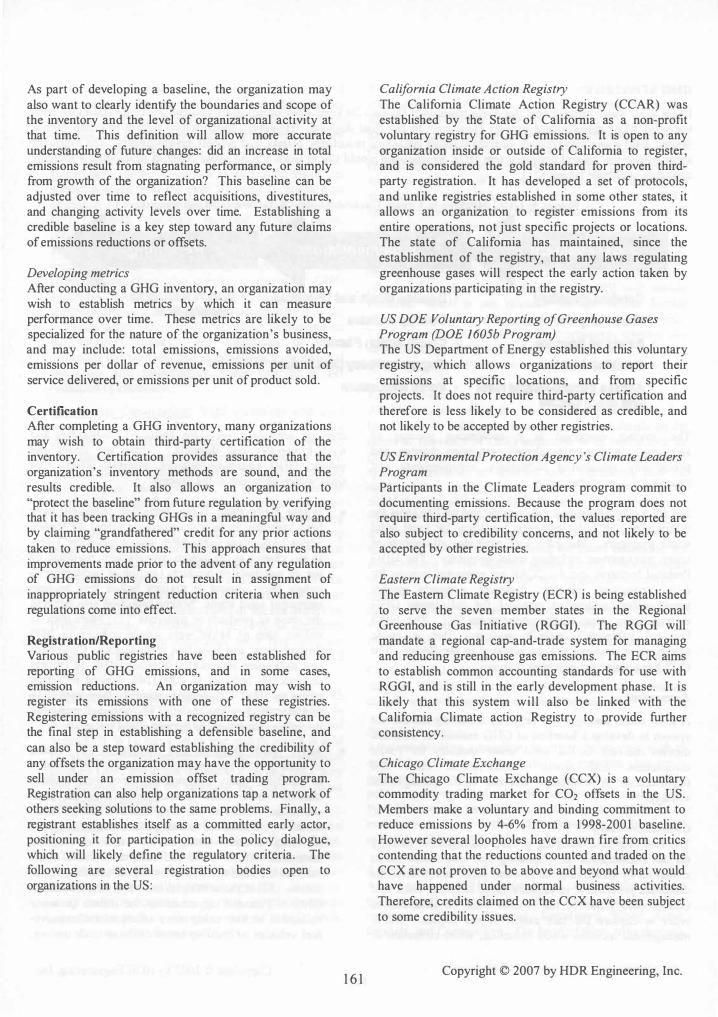
Recent Action Over the past 20 years, the level of awareness and action in response to climate change has moved from the international level to the local governmental level; from providing information and establishing high level goals to state and municipal initiatives and regulations; and from governmental concern to private initiative (see Fig. 3). The United States (US) participated in the initial international efforts by signing and ratifying the United Nations Framework Convention on Climate Change (UNFCCC) and creating the US Global Research Program to facilitate scientific understanding of climate change issues. The US also began maintaining and annually updating the US GHG Emissions Inventory and encouraging voluntary reporting of emissions through the Department of Energy and the Environmental Protection Agency's Climate Leaders program.
157
Since the US withdrew from the Kyoto Protocol in 200 1, many state and local governments have begun to take a more proactive role in responding to climate change by committing to the Kyoto Protocol's goals, establishing regional partnerships, and establishing programs for measuring and reducing GHG emissions. The State of California recently passed Assembly Bill 32 (the California Global Warming Solutions Act) which requires a reduction of approximately 20% in the state's GHG emissions by 2020 and directs the California Air Resources Board (CARB) to develop regulations to establish a system to monitor GHG emissions levels. [ 1 4] Six eastern states are developing a regional mandatory GHG emissions reduction and trading program. In September, New York City Mayor Michael Bloomberg announced a series of environmental initiatives including undertaking of a GHG inventory of the City and a partnership with the Earth Institute of Columbia University to provide "scientific research and advice on climate change-related issues."[ 1 5]
Copyright © 2007 by HDR Engineering, Inc.

Figure 3: Timeline of Major Climate Change Milestones at the International, National, Local and Non-governmental level
'nternational Pin,' on cnma" I Changa ('PC C) -1988
.Independent ScienIffic group
I �
'PCC First Assessment Report "Anthropogenic activities and the resulting
emissions W8I'e substantially increasing atmospheric: concentrations of greenhouse
gases. This would enbanc:e the natural gntenhouae effect and further warm the
surface of the earth...
� • Established US Global Research Program
'PCC Second AsstSsment Report • "Discernible human inftuence on global change" -Described potential impac1s of global
-1990-
1992-
I 1993
I -1995-
I. ,-
UN Framework Convention on Climate Chana. (UNFCCC)
·Framework for intergovernmental efforts to address clima18 change -Gather infonnation about GHG emissions -launch national efforts to address climate
change
warmi!.'9<-____________ .... I GHG Protocol Initiative
oMulti-stakeholda- par1neBhip of businesses, NGOs, governments, and academics -M.ission to develop intematiorulDy a«epled GHG accounting and reporting standards and/Or protocols
California Climate Action R ist -Non-profit voluntary registry for GHG emiSSIOns
-Gold-standard for third party registration
Chicago Climate Exchange ·Emission registry. reduction, trading system -Voluntary -End of Phase I in 2006, members have reduced 6% below baseline "Members include utilities, cities, universities
1997
-1998
Third Conference of UNFCCC Kyoto Protocol
-Legally binding emissions reduction targets -Defines general mechanisms for reduction
I IPCC Third ASSlSim,m R.poR 2001 - "lh8l'e is MW and stronger evidence that
most of the warming observed over the last 50 years is attmutable to human activities .. I
2002JIIII •• ��1
I 2003
I -2004
I 2005
I 2006
I
158 Copyright © 2007 by HDR Engineering, Inc.

CARBON ACCOUNTING
As awareness regarding the potential threat of climate change has grown in the US, many local governments and businesses are being asked to consider the climate implications of their actions. In addition, many government and industry leaders, who are not yet pressured from the outside, consider i� pru�ent to acco�t for their GHG emissions and consider It a proactive measure to assess climate risks and opportunities and to demonstrate commitment to environmental concerns. For many organizations, emissions are an indicator of opportunities for efficiency improvements (and therefore cost reductions), and the process of emissions monitoring often yields new ideas for cutting costs.
Solid Waste Management Carbon Footprint Local governments spend millions of dollars annually to collect, process, and recycle or dispose of municipal solid waste (MSW). The EPA reports that in 2003, the United States generated 236 million tons of MSW, or approximately 4.5 pounds per person per day. MSW landfills, which create landfill gas consisting principally of CO2 and C�, are the largest anthropogenic source of C� in the United States, accounting for 25 percent of the United States' methane emissions.[16] Methane has a more powerful greenhouse effect than CO2• Over a 1 �O-y�ar period, one ton of CH4 is estimated by the SCientific community to make the same contribution to warming as 23 tons of CO2• Therefore, by reducing the methane emissions of landfills, solid waste managers can have a real impact on overall GHG emissions. In addition to landfills, solid waste management has other sources of GHG including waste
transport vehicles, compo sting facilities, proces�in.g
equipment, and waste-to-energy facilities. However, It IS also important to note that solid waste management has the potential to provide offsets and sinks such as avoided f�ssil fuel emissions through recycling. Figure 4 below descnbes the GHG sources, offsets, and sinks involved in solid waste management.
While each phase in the solid waste management process produces GHG emissions, over the past 25 years, the levels of those emissions have been reduced through technological advancements, environmental regulations, and promotion of recycling and reuse. According to a study for the Journal of the Air and Waste Management Association, GHG emissions from municipal solid waste management were estimated to be 36 million metric
. t�ns
carbons equivalents (MMTCE) in 1974 and 8 rrulhon MMTCE in 1997. [ 1 7] It is estimated that if the local waste managers had not taken the steps that they have over the past 25 years, the GHG emissions would be 60 MMTCE today.[18] There are many opportunities for solid waste managers to further reduce these emissions in the future to work toward developing a carbon neutral solid waste management system.
Measurement
Waste management includes waste reduction, collection, composting, recycling, waste-to-energy, and disposal. Each step produces emissions and offers potential offsets or sinks. Waste management GHG emission sources, offsets and sinks are described in Figure 4 below.
Figure 4: GHG Sources, Offsets, and Sinks in Solid Waste Management [19]
Virgin I nputs Life Cycle Stage GHG emissions Sinks & Emission Offsets
M.Il�ls ll<IfKled; TIff<,(J<t.o..ot(, I
.,
CO2 + £I't<!1¥_ """'(-91" �EtIIi...""
CO2 fnc«.ly.ndNon.
r�ll<I>tO<l(rnI'-'.
t�t ------------.. . ..
__ .. t �
159 Copyright © 2007 by HDR Engineering, Inc.

An emission sink is a reservoir that uptakes emissions from another source. Trees and plants are examples of GHG sinks. A GHG emission offset is the quantity of CO2 emISSiOnS avoided (or removed from the atmosphere) due to a specific action. For example, converting a fleet of vehicles to a less carbon-intensive fuel than diesel could generate an offset based on the difference between the CO2 that would have been released from the original fuel, and the actual emissions after the fuel conversion.
GH G Equivalence Many different gases (and even types of particulate matter) have different warming or cooling effects on the earth when they accumulate in the atmosphere. The degree of these effects can vary by several orders of magnitude, based on the heat-absorbing capacity of the gas, and the rate at which it is removed from the atmosphere by emission sinks. To aid decision makers in assessing tradeoffs between different opportunities for emission reductions, scientists have developed a relative index called the Global Warming Potential (GWP) that delineates the comparative potency of various gases. [20] The GWP is defmed as 1 for CO2 and can be used to establish equivalence between different gases, by multiplying a mass of gas by the appropriate GWP to convert it to a mass of C02-equivalent (C02-e). For instance, methane is estimated to be 23 times more powerful in its heat-trapping ability than CO2, so it has a GWP of 23. Therefore, releasing one ton of methane into the atmosphere is typically considered equivalent to releasing 23 tons of CO2.
Carbon intensity Some electric generators have higher or lower emissions per unit of electricity generated, based on the technology employed, their duty cycle, and other factors. Therefore, rates of CO2 emissions differ for end users of electricity based on their sources of power and the generation mix. The term for this measure is carbon intensity (or emissions intensity), and is described in terms of pounds of CO2 per kilowatt-hour (kWh) of electricity used. When applying a carbon intensity to calculate emissions, it is important to choose carefully to use an average or marginal factor that accurately reflects the effect of the entity's energy generation decisions. Case Study 1 shows the air emissions for four types of electricity generators: MSW, coal, oil, and natural gas.
160
Case Study 1: Comparison of Air Emissions
The SWANA Applied Research Foundation's (ARF) Year 4 (FY2005) WTE Group conducted research comparing air emissions from WTE facilities to those of fossil fuel power plants.
Table 1: WTE and Fossil Fuel Power Plants-Comparison of Air Emissions
Fuel Pounds per Meqawatt-hour
CO2 502 N02 MSW 837 0.8 5.4 Coal 2,249 13 6 Oil 1672 12 4 Natural Gas 1,135 0.1 1.7
Table Notes: 1. Data from the EPA Clean Energy websije. l.'IYffl.el1a.gov/cleanene!!l�
Indirect Emissions Often, a significant portion of an organization's emissions are "indirect" emissions, those emitted not from combustion or direct release of gases from the organization'S equipment, but from equipment owned by other entities as a direct result of the organization'S activities. The most common examples of this are the release of CO2 associated with purchased electricity or consumer product applications. Even though these emissions come from another party's actions, they can be directly attributed to the end user of the electricity or the product produced.
Methodology Inventory Boundaries When conducting a GHG inventory, it is important for an entity to start by determining appropriate inventory boundaries: should the inventory include emissions from business travel? From employee commuting? From the manufacture of its office paper? It is important to clearly define this boundary to avoid ambiguity. Most often, the boundary is defined according to financial accounting practices: emissions are "owned" by an organiza:io� if they result from activities at facilities the orgall1Zatl�n owns. However, other boundaries may be chosen 10 some circumstances in response to an organization's ability to control various operations or product design or reuse.
Establishing a baseline Once an organization has decided on appropriate boundaries, it can conduct a meaningful GHG inventory. This inventory will provide a basis to which the organization can compare future changes in emissions.
Copyright © 2007 by HDR Engineering, Inc.
As part of developing a baseline, the organization may also want to clearly identify the boundaries and scope of the inventory and the level of organizational activity at that time. This definition will allow more accurate understanding of future changes: did an increase in total emissions result from stagnating performance, or simply from growth of the organization? This baseline can be adjusted over time to reflect acquisitions, divestitures, and changing activity levels over time. Establishing a credible baseline is a key step toward any future claims of emissions reductions or offsets.
Developing metrics After conducting a GHG inventory, an organization may wish to establish metrics by which it can measure performance over time. These metrics are likely to be specialized for the nature of the organization's business, and may include: total emissions, emissions avoided, emissions per dollar of revenue, emissions per unit of service delivered, or emissions per unit of product sold.
Certification After completing a GHG inventory, many organizations may wish to obtain third-party certification of the inventory. Certification provides assurance that the organization's inventory methods are sound, and the results credible. It also allows an organization to "protect the baseline" from future regulation by verifying that it has been tracking GHGs in a meaningful way and by claiming "grandfathered" credit for any prior actions taken to reduce emissions. This approach ensures that improvements made prior to the advent of any regulation of GHG emissions do not result in assignment of inappropriately stringent reduction criteria when such regulations come into effect.
Registration/Reporting Various public registries have been established for reporting of GHG emissions, and in some cases, emission reductions. An organization may wish to register its emissions with one of these registries. Registering emissions with a recognized registry can be the fmal step in establishing a defensible baseline, and can also be a step toward establishing the credibility of any offsets the organization may have the opportunity to sell under an emission offset trading program. Registration can also help organizations tap a network of others seeking solutions to the same problems. Finally, a registrant establishes itself as a committed early actor, positioning it for participation in the policy dialogue, which will likely defme the regulatory criteria. The following are several registration bodies open to organizations in the US:
161
California Climate Action Registry The California Climate Action Registry (CCAR) was established by the State of California as a non-profit voluntary registry for GHG emissions. It is open to any organization inside or outside of California to register, and is considered the gold standard for proven thirdparty registration. It has developed a set of protocols, and unlike registries established in some other states, it allows an organization to register emissions from its entire operations, not just specific projects or locations. The state of California has maintained, since the establishment of the registry, that any laws regulating greenhouse gases will respect the early action taken by organizations participating in the registry.
US DOE Voluntary Reporting of Greenhouse Gases Program (DOE 1605b Program) The US Department of Energy established this voluntary registry, which allows organizations to report their emissions at specific locations, and from specific projects. It does not require third-party certification and therefore is less likely to be considered as credible, and not likely to be accepted by other registries.
US Environmental Protection Agency's Climate Leaders Program Participants in the Climate Leaders program commit to documenting emissions. Because the program does not require third-party certification, the values reported are also subject to credibility concerns, and not likely to be accepted by other registries.
Eastern Climate Registry The Eastern Climate Registry (ECR) is being established to serve the seven member states in the Regional Greenhouse Gas Initiative (RGGI). The RGGI will mandate a regional cap-and-trade system for managing and reducing greenhouse gas emissions. The ECR aims to establish common accounting standards for use with RGGI, and is still in the early development phase. It is likely that this system will also be linked with the California Climate action Registry to provide further consistency.
Chicago Climate Exchange The Chicago Climate Exchange (CCX) is a voluntary commodity trading market for CO2 offsets in the US. Members make a voluntary and binding commitment to reduce emissions by 4-6% from a 1998-200 1 baseline. However several loopholes have drawn fire from critics contending that the reductions counted and traded on the CCX are not proven to be above and beyond what would have happened under normal business activities. Therefore, credits claimed on the CCX have been subject to some credibility issues.
Copyright © 2007 by HDR Engineering, Inc.

GHG STRATEGY
Local solid waste management decisions made over the past 20 years have significantly reduced the GHG emissions from the solid waste management process from curb to the [mal disposal. However, opportunities remain to create carbon neutral solid waste management systems through emissions reductions, offsets, and process improvements. The following steps outline the general approach that HDR Engineering would use to assist a solid waste client in developing a strategic approach to climate issues. [2 1 ]
Figure 5: GHG Strategy to Create Carbon Neutral Solid Waste Management
• Conduct InvlntDry • Develop OOall and Dladll,. • Rlport RIIUn. to ltakeholdert
• 11I1rd Pwty CertlllCldlan • Develop Pollell.
• 1ItIblllh I_line • Crlltl ActIon '1"'1 • E ..... lllh MelrtCl • Enaaglln Policy DIIC ... lo ..
• All •• cllmlill.,..l_d rtllal • V.tfy RIIdLIctIonl and opportunili'
The process described is a continuous process of assessment, implementing changes, reporting changes, and periodically reassessing technology improvements and process changes as they occur.
The EPA offers extensive information and on-line tools for determining the GHG emission baselines for local solid waste managers. The EPA tool evaluates all aspects of waste management including waste-to-energy. The GHG Protocol Initiative and the CCAR are respected sources for GHG accounting practices; however, currently neither source offers a detailed protocol for calculating GHG emissions for solid waste management. [22] The GHG Protocol Initiative's website indicates that a waste management protocol will be released in the future. The CCX has a waste management protocol.
Assessment
A solid waste manager can begin by assessing the current system to develop a baseline of GHG emissions, establish metrics relevant to the solid waste industry for future comparison, and assess climate-related risks and opportunities to determine ultimate GHG management strategy.
Conduct inventory The first step in developing a GHG management strategy for an organization is evaluating the magnitude of its emissions by identifying the sources, sinks, and offsets. As discussed previously, to identify these sources, sinks, and offsets, each phase of the process must be identified in order to capture the full extent of the impact. MSW management includes waste reduction, waste collection or
162
drop-off, separation, recycling, treatment (composting and waste-to-energy) and disposal. There are direct and indirect GHG emissions sources, potential offsets, and sinks within each step of the process:
• Waste Reduction: Waste reduction programs have been instituted in most communities across the United States. According to the EPA, source reduction "refers to any change in the design, manufacture, purchase, or use of materials or products (including packaging) to reduce their amount or toxicity before they become municipal solid waste. Source reduction also refers to the reuse of products or materials."[23] More than 55 million tons of MSW were source reduced in 2000 through reuse and reduction in packaging. Containers and packaging represented approximately 28 percent of materials reduced in 2000.[24] Source reduction offers an offset for avoided emissions from collecting and disposing of the material and reduced emissions through reduced need to harvest virgin materials.
• MSW Waste Drop-off and Collection: The burning of fossil fuels is the major contributor of CO2 globally. In addition, many communities have local transfer stations where waste is transferred from the local collection vehicle to the long-distance transportation mode, which includes tractor-trailers, barges, or trains for long distance transport of waste or recycled materials. Often front end loaders or other small vehicles are used to move the waste around the transfer station. All of these vehicles burn fossil fuel, emitting GHGs. Potential opportunities for offsets in waste collection include using more efficient or alternativefuel vehicles or creating more efficient truck routing.
Copyright © 2007 by HDR Engineering, Inc.

In some commumtles residents drop off their solid waste directly to the landfill or transfer station, creating a GHG emission source through their vehicles, and emitting more than the greater capacity collection vehicle does.
• Recycling: The recycling rate in the United States has almost doubled over the past 20 years. Currently an estimated 30 percent of the waste stream is recycled. [25] Common materials recycled include paper, plastic, and aluminum. When materials are recycled, an offset may be created for the avoided GHGs from extracting and manufacturing VIrgm materials. However, recycling also creates a source of GHG emissions through collection, processing through a materials recovery facility (MRF), transportation to the recycling center and eventual recycling. Depending on the transport distance, the magnitude of these emissions and the reduction in emissions from material extraction and manufacture, there can be a net reduction in emissions.
• Treatment: Composting: Yard trimmings and food waste comprise over 20 percent of MSW annually generated. [26] Many communities have developed composting programs to divert these wastes from disposal facilities. Biodegradation of organic material will produce biogenic CO2• However, aerobic composting methods promote the conditions to allow organic materials to decompose into the soil, creating an organic material that can be reused. By diverting organic materials to composting, as opposed to other disposal options, solid waste managers can reduce carbon loss from farm soils and reduce methane production. The processing equipment emissions must also be included in the assessment of the net impact on GHG emissions. According to the EPA, an estimated 56.9 percent of yard trimmings were recovered for composting in 2000 up from 1990 recovery rate of 1 2 percent.
• Treatment: Waste-to-Energy: There are over 85 waste-to-energy (WTE) facilities with the capacity to bum up to 95,000 tons of MSW per day in the United States.[27] WTE turns waste into energy which is sold to electricity companies. While WTE facilities produce GHG emissions including CO2 and N20, they also provide offsets by reducing the need for fossil fuel-based electricity.
• Landfill: As stated previously, landfills are the largest anthropogenic source of methane in the United States. While the number of landfills has decreased over the past 20 years, the capacity has not decreased because landfills have generally gotten larger.[28] However, many landfills capture a portion of the methane generated to produce electric power or vehicle fuels, providing an offset from fossil fuels.
163
The GHG emissions from treatment and disposal of solid waste depend on the types of materials. Some accounting schemes differentiate between biogeniC CO2 (released naturally from biological sources) and anthropogenic CO2 (released as a result of human activity). MSW includes organic materials such as food waste and inorganic materials such as plastic. While plastic does not create GHG emissions in a landfill, it does when bumed in a WTE facility. GHG emissions from plastic bumed in a WTE facility are considered to be anthropogenic for the vast majority of plastics manufactured from petroleum inputs. CO2 released from aerobic decomposition of organic materials is generally considered to be biogenic. However, organic materials decomposing in a landfill will release methane, which is not released through natural aerobic decomposition, and is therefore considered anthropogenic. To the extent that composting or combustion releases this same carbon as CO2 rather than methane, the emissions of CO2 are considered biogenic.
Establish baseline After an assessment of the sources, sinks, and offsets has been made the solid waste manager must next decide on the potential relevance of GHG emissions to its business or its public responsibilities. If, after conducting an inventory, the system's emissions are deemed to be significant, then the solid waste manager may choose to proceed with establishment of an emissions baseline against which to measure future performance. This baseline is a time record of historic emissions and a projection of future emissions. In addition to serving as a benchmark for future emissions, the establishment of this baseline allows a solid waste manager to measure and take credit for any emissions reductions it may have made in recent years. For example, if the city or county recently switched to more fuel efficient collection vehicles or increased recycling rates, they may be able to receive credit for the reduction in overall GHG emissions.
Carefully establishing this baseline allows the solid waste manager to account for recent reductions when measuring compliance with any future mandated reductions.
Establish metrics After establishing a baseline, an organization may wish to establish metrics as outlined above to measure changes in performance over time. These metrics are important for public reporting, but also helpful for setting internal targets. Potential metrics for solid waste managers include: GHG emissions per ton collected; GHG emissions per household served; or GHG emissions per dollar of revenue.
Assess climate-related risks After measuring GHG emissions, a solid waste manager can compute the climate risks. There are six major categories of risk: Physical, Regulatory, Fixed Asset, Product, and Competitive. The level of these risks depends
Copyright © 2007 by HDR Engineering, Inc.

on the type and size of the business or government entity. Solid waste management is just one service offered by local governments and paid for through user fees either collected through taxes or through a pay-as-you throw program. While relatively user-fee oriented, solid waste managers are impacted by the financial security of local governments, especially when larger scale projects are needed such as building a waste-to-energy facility or siting a new landfill.
• Physical Risk: Physical risk refers to the effect of changes in weather, temperature, health impacts attributed to climate change. As part of a local government, solid waste managers are impacted as the local government is in terms of costs. The physical risk applies to the solid waste employees and to the infrastructure that exists to collect and dispose of the solid waste. In addition, as local governments face increasing financial impacts from changes in rainfall, increased intensity of wildfires and hurricanes, the financial priorities shift which may directly impact solid waste managers.
• Regulatory Risk: Regulatory risk includes the effect of possible future GHG regulations on demand, resource prices, and ability to continue operations. It also includes the opposite risk that early action proves unwarranted - if expected GHG regulations do not transpire, that may significantly change the rest of the risk and opportunity outlook. In terms of solid waste management, the regulatory risk is increasing as more local and state governments are beginning to assess their GHG emissions and consider mandating reductions. Although many of the larger landfills have installed gas collection systems, landfills are responsible for over 30 percent of the methane emissions in the United States. In addition, solid waste management is likely high among large government service programs, which might be included m regulatory requirements for carbon reductions.
• Product Risk: Product risk includes the energy demand, energy efficiency, and emissions profile of an organization's products, as well as supply chain considerations. Organizations also face risks embedded in the companies fixed assets: their projected life, ability to switch fuels or run more efficiently, their proximity to coastlines, or their vulnerability to interruptions in power or water services. The product risk for solid waste managers would include the capital costs such as collection vehicles and other equipment at transfer stations or MRFs. In addition, many local communities have invested in landfill development or waste-toenergy facilities and face the risk associated with technological improvements to reduce GHG emissions. Often these technological improvements might require significant financial investment.
164
• Competitive Risk: Organizations face competitive risks in their ability to respond to changing regulations and new markets, brand value risks, risks from the introduction of new products that are more or less climate friendly than those already on the market, credit risks, and legal risks. With the increase in community engagement with climate issues in the last decade, these other risks may translate into further political-related risks. Solid waste management often includes characteristics of a public and a private entity. Many communities have invested in disposal facilities including landfills and WTE facilities. As a participant in the disposal market, they must ensure they provide a competitive tipping fee with the many private facilities. As climate change becomes more of a concern, they may also need to compete on GHG terms as the private industry begins to address GHG emissions. Some of the largest private waste collection and disposal companies in the United States, have recently begun assessing their own GHG emissions.
• Fixed Asset Risk: Solid waste managers face risks to their fixed assets including physical exposure to the changing weather, age and projected life and fuel switching capabilities of the equipment and proximity to the coastlines. The increased risks that coastal communities face as a result of climate change, will also impact the local solid waste managers. In addition, depending on the age of the equipment and the local capital budget, the fixed asset risk may increase for solid waste managers.
Assess Climate-Related Opportunities Climate opportunities can be assessed similarly to climate risks. If a solid waste manager determines the climate risks to be low it may be able to leverage that discrepancy to its financial and political advantage. A solid waste manager has opportunities to invest in climate-friendly technologies, products, processes, or programs; it may also document ways in which it is already doing so. By being proactive, a solid waste manager may gain not only financially but also politically as its leadership position is clear to community members. Solid waste managers that reduce their emissions to particularly low levels may even be able to benefit from the growing carbon trading markets.
Implementation How and what actions the solid waste manager should take are directly related to the level of emissions and potential risks and opportunities.
Copyright © 2007 by HDR Engineering, Inc.

Establish Goals and Deadlines With a GHG inventory in hand a solid waste manager can set explicit goals for managing climate risk by reducing GHG emissions. These goals must be achievable, and to be useful, they must also show a level of aggressiveness commensurate with the identified risks and opportunities.
Develop Policies to Mitigate Risks and Pursue Opportunities After making a thorough assessment of climate-related risks and opportunities, a solid waste manager may choose to develop policies to reduce exposure to the risks, and actively pursue the opportunities. These policies are made more effective when they penetrate to the operations level, and rise to the executive level. If climate risks or opportunities are substantial a new position should be created to ensure the policies are achieved.
Create an Action Plan Once goals have been established around GHG emission reductions, it is important to initiate an action plan to achieve these goals and establish milestones to demonstrate progress. The Action Plan will improve public relations and reduce risks. For solid waste managers, this action plan may include increasing recycling, changing hauling patterns, and investing in cleaner technologies for hauling and disposal. It may also include participation in emerging GHG trading markets.
Engage in policy discussion As a concerned early participant, a solid waste manager should have a seat at the table in current and future discussions of the development of GHG policy and regulatory criteria. While it is clear that the regulatory landscape around GHG emissions is changing rapidly, it is not clear exactly how it will evolve. Those organizations and local governments that are actively engaged with the issue will be able to bring their expertise to the conversation and assure that new policies are prudently designed and sensibly implemented.
Verification of Reductions An ongoing part of the implementation of a GHG strategy is periodic monitoring of emissions, comparisons with the GHG metrics established earlier, and verification of expected emissions reductions. These steps are necessary to ensure that any emissions reduction goals are met, and may also be necessary for any solid waste manager wishing to register or sell credits for its reductions.
Reporting Regular monitoring also helps the organization prepare to report its progress to stakeholders and shareholders. Reporting back to community members plays a key role in GHG management by keeping them abreast of the solid waste management system's changing risk profile.
165
Consistent reporting can also help leverage improvements the organization is making into improved public perception or brand value.
CONCLUSION
A new era in environmental regulation appears to be dawning. Like some others before it, the era of regulated greenhouse gas emissions is starting as a patchwork of state and regional actions. Although the various federal, state and local regulations are developing in different ways, the signals are unmistakable: this is an important issue to watch, and it is here to stay. While there are many unanswered questions, the momentum is clear. Most analysts, policymakers, and business leaders believe that we are headed toward a national greenhouse gas regulation. This regulation is initially likely to vary regionally and be influenced by the early action of states such as California. It will take a considerable amount time before any formal standardization of the regulations is developed at the national level. However, adept planners in every business sector including solid waste management should begin anticipating this regulatory evolution by:
• Committing to actions to reduce the greenhouse gases;
• Evaluating the greenhouse gas impacts of all their implementation options;
• Documenting the current greenhouse gas ernissions from operations and the initiatives that they have taken to reduce these emissions;
• Obtaining certification of the emission estimates from a recognized organization regarding the documentation;
• Establishing achievable goals for future solid waste management projects to reduce greenhouse gas emissions further; and
• Identifying greenhouse gas credits that may be used by other divisions of their organization or marketable to other business sectors.
California has taken the lead on this issue by passing the Global Warming Solutions Act (formerly known as AB32), which encourages this early action approach by providing "grandfathering" provisions in the legislation that will recognize early efforts. Proactive solid waste managers can start to manage their carbon risks now by establishing management criteria, reducing the risks of needing expensive capital improvements or curtailment of certain operations.
California AB32 will have a significant impact on all sectors of the economy. The regulations produced will be
Copyright © 2007 by HDR Engineering, Inc.

developed over the next five years. There are three elements required for implementation of AB 32 ( 1 ) reporting emissions, (2) establishing the 1 990 baseline emissions level, and (3) defining required reduction actions. CARB will develop and publish a list of discrete early action measures by June 30, 2007. These early action measures must be implemented by January 1 , 20 1 0. By January 1, 2008, CARB is required to adopt regulations that require reporting and verification of statewide GHG emissions and determine the baseline level of emissions in 1 990 (which will determine the emission reductions required).
1 66
CARB will release the scoping plan for achieving "maximum technologically feasible and cost effective reductions" by January 1 , 2009. Regulations to adopt limits and emission reduction measures will be adopted by January 1 , 20 1 1 and become operative as of January 1 , 20 1 2.
California has grandfathered the efforts of entities who acted to register and reduce emissions before the advent of this regulation, and other state and regional initiatives are likely to do the same. The result is that solid waste managers who proactively manage GHG risks and reduce emissions will be in the best position to deal with current and future greenhouse gas regulations.
Copyright © 2007 by HDR Engineering, Inc.
END NOTES
1 IPCC Climate Change 200 I :The Scientific Basics 2 US EPA website www.epa.gov. Accessed on September 19, 2006. 3 IPCC Climate Change 200 1 : The Scientific Basics 4 ibid 5 US EPA website www.epa.gov. Accessed on September 19, 2006. 6 ibid, IPCC Summary of Policymakers 200 1 . 7 IPCC Climate Change 200 1 : The Scientific Basics and US EPA website www.epa.gov Accessed on September 19, 2006. 8 IPCC Climate Change 200 1 : The Scientific Basics 9 IPCC Summary for policy makers 200 1 lO EPA IPCC 1 1 EPA: "Climate Change and California." 1 997 12 IPCC Climate Change 200 I : The Scientific Basics 1 3 USEPA website www.epa.gov. Accessed September 19, 2006 14 AB 32 Global Warming Solutions Act, Union of Concerned Scientists 1 5 Press Release date September 2 1 , 2006 from the New York City Office of the Mayor. 16 USEPA website www.epa.gov. Accessed September 19, 2006 1 7 Thomeloe, S, Weitz, K and Zannes, M. "The Impact of Municipal Solid Waste Management on Greenhouse Gas Emissions in the United States." Journal of the Air and Waste Management Association. Volurne 52, September 2002. 1 8 ibid. 19 EPA. "Solid Waste Management and Greenhouse Gases: A life-cycle Assessment of Emissions and Sinks." 2002. 20 For a current list of global warming potentials from the IPCC's Third Assessment Report, see http://www.grida.no/climate/ipcc tar/wgl/248.htm. The 100-year GWP is the most commonly-used value in decision making. 2 1 This strategy section applying to the waste management sector is based on the framework set out in the CERES toolkit Managing Risks and Opportunities a/Climate Change. available at http://www .ceres.org. 22 The GHG Protocol Initiative website is: http://www.ghgprotocol.org; The California Climate Action Registry website is: http://www.climateregistry.org/ 23 USEPA website www.epa.gov. Accessed September 19, 2006 24 ibid 25 USEPA website www.epa.gov. Accessed September 19, 2006 26 ibid 27 ibid 28 ibid
15th North American Waste to Energy Conference
May May 21-23, 2007, Miami, Florida USA
NAWTEC15-32015
167 Copyright © 2007 by HDR Engineering, Inc.