Low Carbon Fuel Standard (LCFS) Analysis … · Low Carbon Fuel Standard (LCFS) Analysis &...
24
Low Carbon Fuel Standard (LCFS) Analysis & Compliance Costs Role of Alternative Fuels in California’ s Role of Alternative Fuels in California s Transportation Energy Future Transportation Committee Workshop November 14, 2011 Gordon Schremp F l dT t ti Di i i Fuels andT ransportation Division California Energy Commission [email protected]
Transcript of Low Carbon Fuel Standard (LCFS) Analysis … · Low Carbon Fuel Standard (LCFS) Analysis &...
Low Carbon Fuel Standard (LCFS) Analysis & Compliance Costs
Role of Alternative Fuels in California’sRole of Alternative Fuels in California s Transportation Energy Future
Transportation Committee Workshop
November 14, 2011
Gordon Schremp
F l d T t ti Di i iFuels and Transportation Division
California Energy Commission

LCFS Compliance Analysis
• Primary intent of this continuation analysis is to evaluate compliance feasibility using various types of biofuels & costs– This scenario analysis should not be considered a forecast– This scenario analysis should not be considered a forecast
• Three cases with varying assumptions– Availability of low carbon intensity fuels increased with each case
M t bi f l tl il bl i i l titi– Most biofuels are currently available in commercial quantities– Only exceptions cellulosic biofuels, especially BTL gasoline
• Biofuel costs are introduced in the analysis– Biofuel selection based on least‐cost, lowest carbon intensity fuels
• Adjustment for biodiesel NOx mitigation– Biodiesel use above 5 percent mitigated with renewable dieselp g
• Primary concern is plausibility of the assumptions
11/14/2011 2
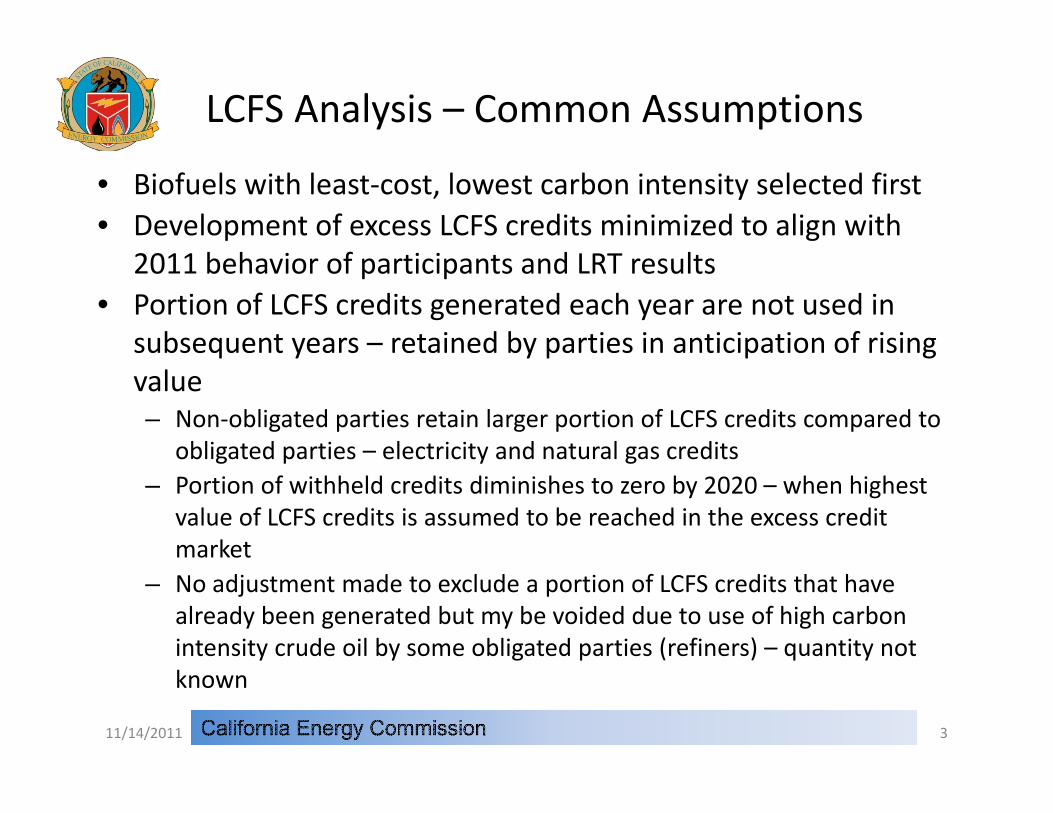
LCFS Analysis – Common Assumptions
• Biofuels with least‐cost, lowest carbon intensity selected first• Development of excess LCFS credits minimized to align with
b h i f i i d l2011 behavior of participants and LRT results• Portion of LCFS credits generated each year are not used in
subsequent years – retained by parties in anticipation of rising q y y p p gvalue– Non‐obligated parties retain larger portion of LCFS credits compared to
obligated parties – electricity and natural gas creditsobligated parties electricity and natural gas credits– Portion of withheld credits diminishes to zero by 2020 – when highest
value of LCFS credits is assumed to be reached in the excess credit market
– No adjustment made to exclude a portion of LCFS credits that have already been generated but my be voided due to use of high carbon intensity crude oil by some obligated parties (refiners) – quantity not known
11/14/2011 3
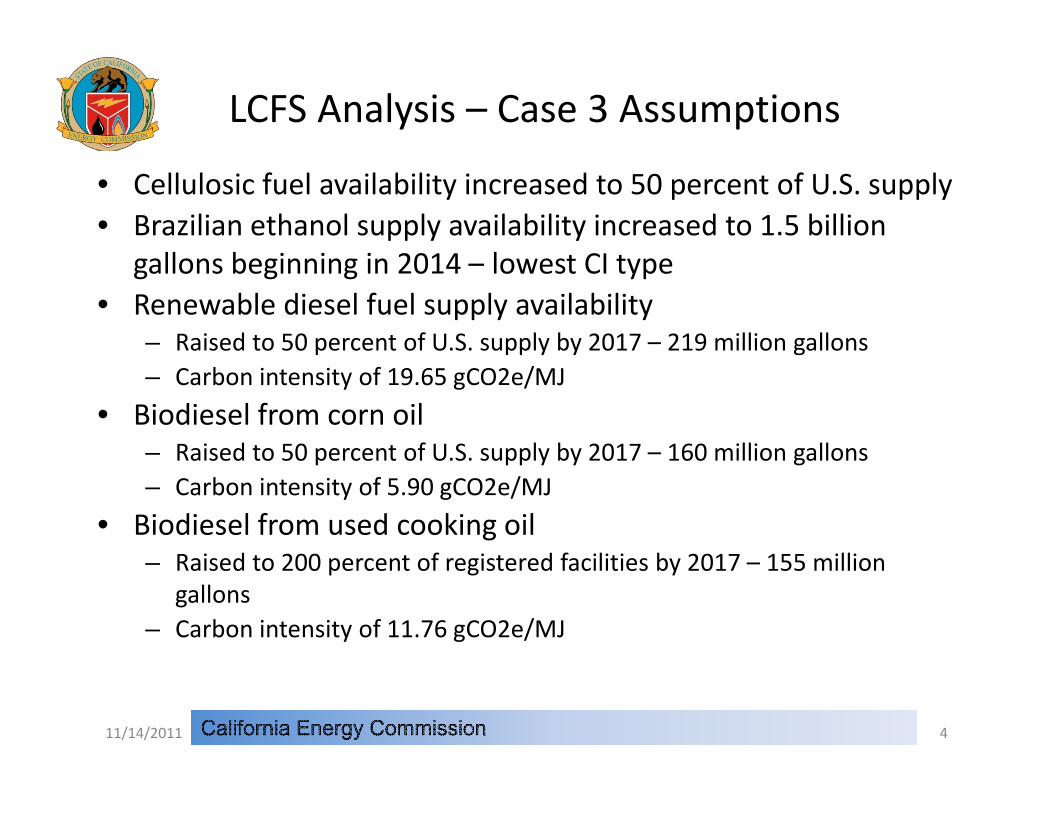
LCFS Analysis – Case 3 Assumptions
• Cellulosic fuel availability increased to 50 percent of U.S. supply• Brazilian ethanol supply availability increased to 1.5 billion
ll b i i i lgallons beginning in 2014 – lowest CI type• Renewable diesel fuel supply availability
– Raised to 50 percent of U.S. supply by 2017 – 219 million gallons– Carbon intensity of 19.65 gCO2e/MJ
• Biodiesel from corn oil– Raised to 50 percent of U.S. supply by 2017 – 160 million gallonsRaised to 50 percent of U.S. supply by 2017 160 million gallons– Carbon intensity of 5.90 gCO2e/MJ
• Biodiesel from used cooking oilRaised to 200 percent of registered facilities by 2017 155 million– Raised to 200 percent of registered facilities by 2017 – 155 million gallons
– Carbon intensity of 11.76 gCO2e/MJ
11/14/2011 4
7 000
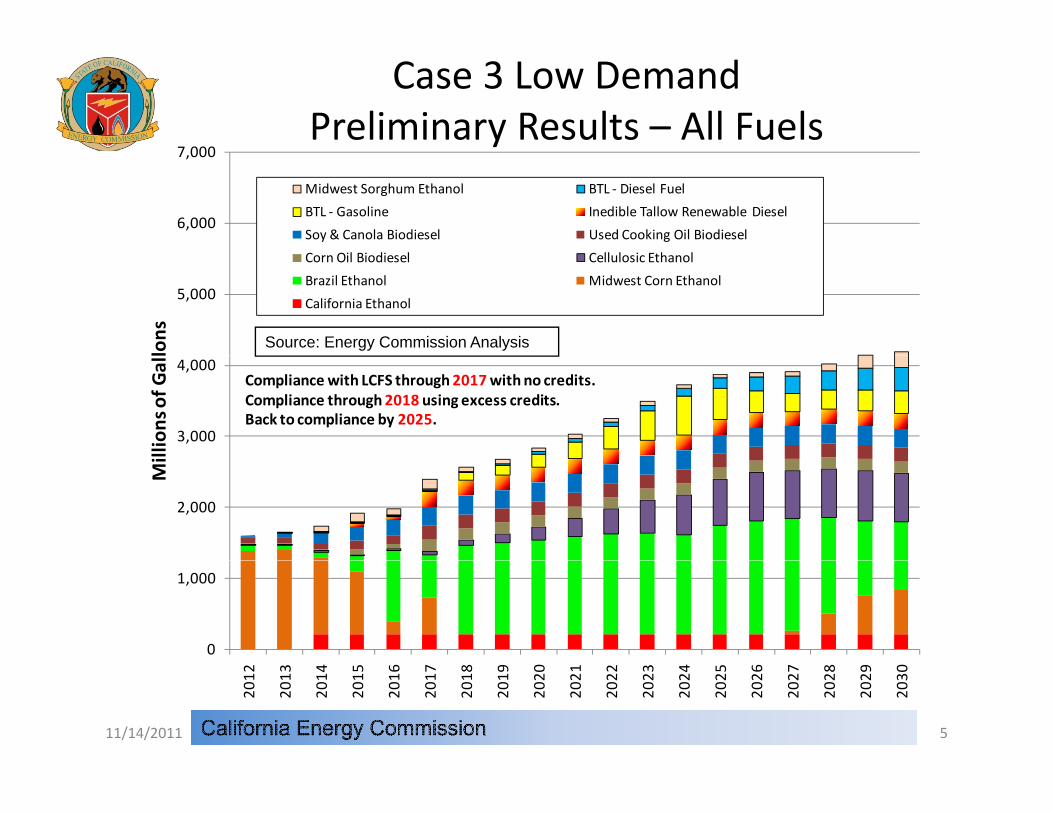
Case 3 Low DemandPreliminary Results – All Fuels
6,000
7,000
Midwest Sorghum Ethanol BTL ‐ Diesel Fuel
BTL ‐ Gasoline Inedible Tallow Renewable Diesel
Soy & Canola Biodiesel Used Cooking Oil Biodiesel
C Oil Bi di l C ll l i E h l
5,000
lons
Corn Oil Biodiesel Cellulosic Ethanol
Brazil Ethanol Midwest Corn Ethanol
California Ethanol
Source: Energy Commission Analysis
3,000
4,000
llion
s of G
all
Compliance with LCFS through2017 with no credits.Compliance through2018 using excess credits.Back to compliance by 2025.
2,000
Mi
0
1,000
2012
2013
2014
2015
2016
2017
2018
2019
2020
2021
2022
2023
2024
2025
2026
2027
2028
2029
2030
11/14/2011 5
4,000
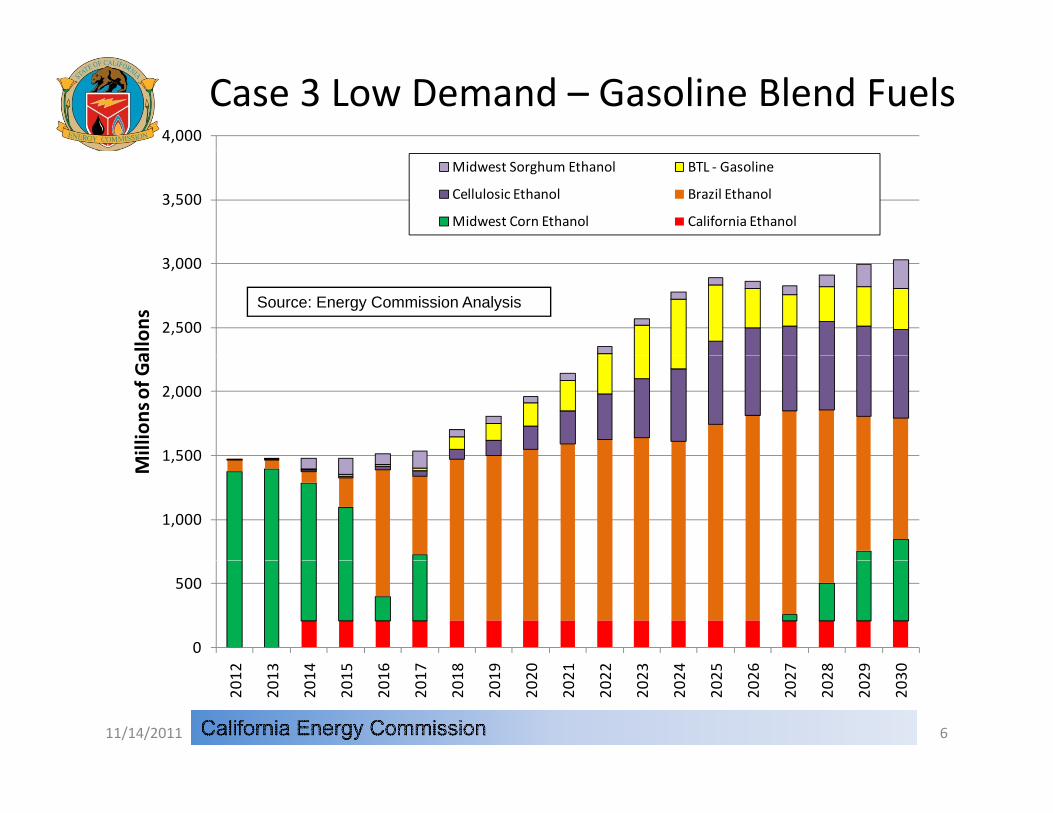
Case 3 Low Demand – Gasoline Blend Fuels
3,500
Midwest Sorghum Ethanol BTL ‐ Gasoline
Cellulosic Ethanol Brazil Ethanol
Midwest Corn Ethanol California Ethanol
2,500
3,000
allons
Source: Energy Commission Analysis
1 500
2,000
Millions of G
a
1,000
1,500
M
0
500
2012
2013
2014
2015
2016
2017
2018
2019
2020
2021
2022
2023
2024
2025
2026
2027
2028
2029
2030
11/14/2011 6
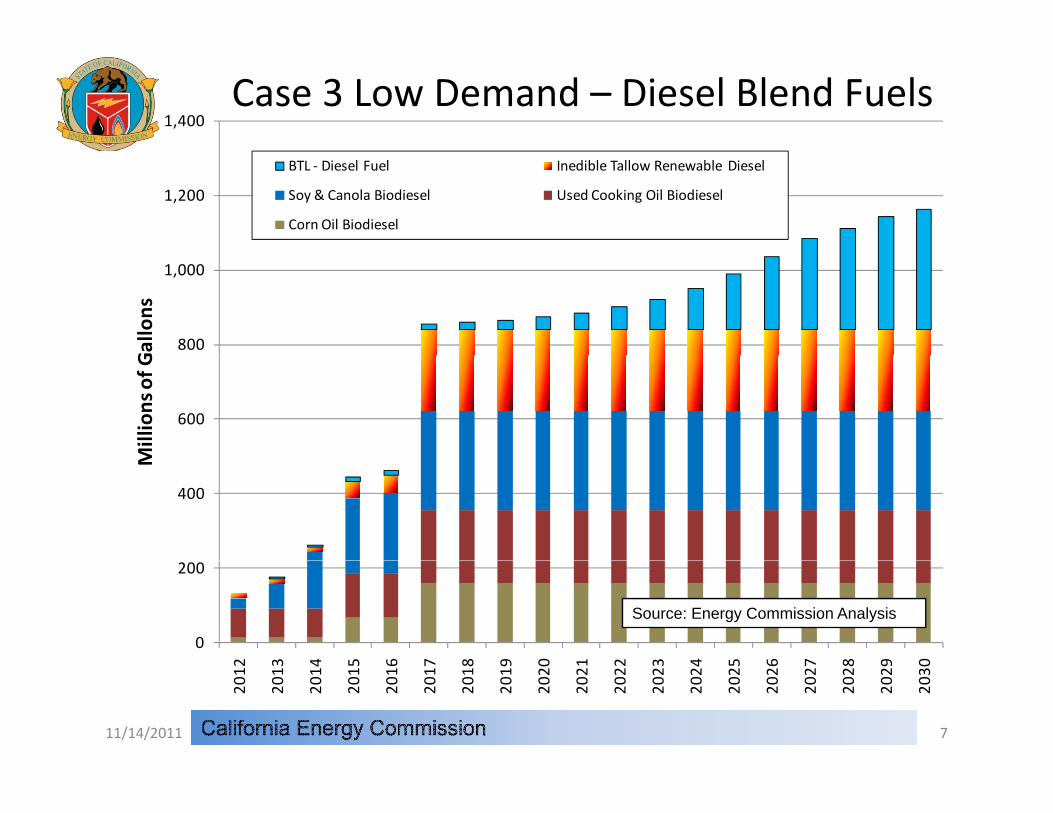
1,400Case 3 Low Demand – Diesel Blend Fuels
1,200
BTL ‐ Diesel Fuel Inedible Tallow Renewable Diesel
Soy & Canola Biodiesel Used Cooking Oil Biodiesel
Corn Oil Biodiesel
800
1,000
Gallons
600
Millions of G
400
M
0
200
2 3 4 5 6 7 8 9 0 1 2 3 4 5 6 7 8 9 0
Source: Energy Commission Analysis
2012
2013
2014
2015
2016
2017
2018
2019
2020
2021
2022
2023
2024
2025
2026
2027
2028
2029
2030
11/14/2011 7
30,000,000Natural Gas Electricity
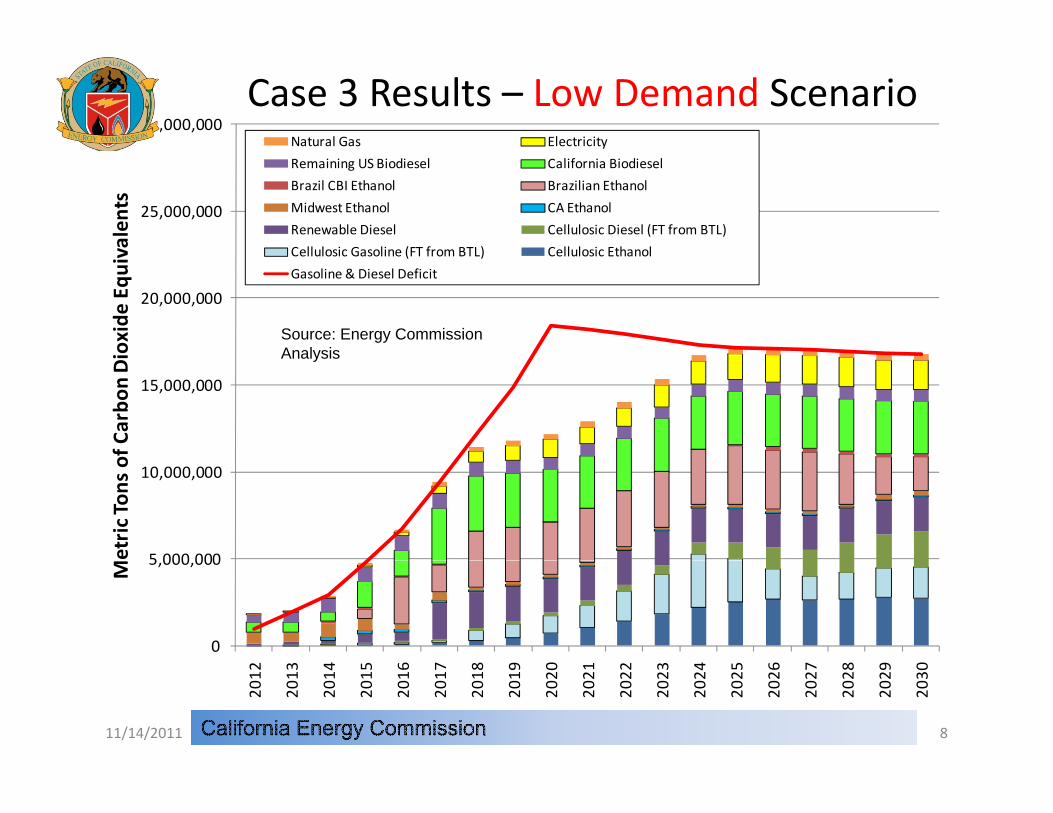
Case 3 Results – Low Demand Scenario
25,000,000
valents
Remaining US Biodiesel California Biodiesel
Brazil CBI Ethanol Brazilian Ethanol
Midwest Ethanol CA Ethanol
Renewable Diesel Cellulosic Diesel (FT from BTL)
Cellulosic Gasoline (FT from BTL) Cellulosic Ethanol
20,000,000
ioxide
Equ
iv Cellulosic Gasoline (FT from BTL) Cellulosic Ethanol
Gasoline & Diesel Deficit
Source: Energy Commission Analysis
15,000,000
of Carbo
n Di Analysis
5 000 000
10,000,000
etric Tons o
0
5,000,000
2 3 4 5 6 7 8 9 0 1 2 3 4 5 6 7 8 9 0
M
2012
2013
2014
2015
2016
2017
2018
2019
2020
2021
2022
2023
2024
2025
2026
2027
2028
2029
2030
11/14/2011 8

30,000,000Natural Gas Electricity
Case 3 Results – High Demand Scenario
25,000,000
alen
tsNatural Gas ElectricityRemaining US Biodiesel California BiodieselBrazil CBI Ethanol Brazilian EthanolMidwest Ethanol CA EthanolRenewable Diesel Cellulosic Diesel (FT from BTL)Cellulosic Gasoline (FT from BTL) Cellulosic Ethanol
20,000,000
oxide Eq
uiva Gasoline & Diesel Deficit
Source: Energy Commission Analysis
15,000,000
of Carbo
n Dio Analysis
5 000 000
10,000,000
Metric Tons o
0
5,000,000
2 3 4 5 6 7 8 9 0 1 2 3 4 5 6 7 8 9 0
M
2012
2013
2014
2015
2016
2017
2018
2019
2020
2021
2022
2023
2024
2025
2026
2027
2028
2029
2030
11/14/2011 9

Case 3 – Demand Observations
• Compliance until 2017 through increased use of cellulosic fuels• Excess credits can extend compliance an additional years (2018)
– Due to increased supply of renewable diesel and corn oil biodiesel
• Compliance through deficit portion of the Low Demand forecast period (2019‐2024) would require generation of additional credits from:– Use of additional quantities of drop‐in biofuels greater than 50 percent of
total U.S. supplypp y• Biomass‐to‐liquids (BTL) gasoline and diesel
• Deficit portion of the forecast period (2019‐2027) under the High Demand scenario would require even greater generation ofHigh Demand scenario would require even greater generation of additional credits
11/14/2011 10

Case 3 – Additional Concerns
• Heavy dependence on Brazilian ethanol lessens somewhat– Similar to previous cases
• Biodiesel use would need to rapidly increase to B5– Similar to previous cases– Feasibility of corn oil biodiesel supply increase in 2017 uncertain
• Use of renewable diesel significantly increased– Feasibility of supply increase to 219 million gallons in 2017 uncertain
• Use of cellulosic fuels significantly increased beginning in 2018Use of cellulosic fuels significantly increased beginning in 2018– Feasibility of using half of the U.S. cellulosic fuel supply questionable,
even if the volumes forecast by EIA actually become available
11/14/2011 11
More Expensive Biofuels
• Previous LCFS analysis by Energy Commission staff did not incorporate costs of biofuels but recognized that severalincorporate costs of biofuels but recognized that several different types of biofuels selected for use in the cases are currently more expensive than corn‐based ethanolSt ff d l d bi f l i f LCFS l i• Staff developed biofuel prices for LCFS analysis
• Used recent historical values as starting point– Near‐term pricing information
• Brazilian ethanol as one example
– Federal RFS2 RIN values during 2010 & 2011• Biodiesel
C ll l i th l• Cellulosic ethanol• Advanced biofuels
11/14/2011 12
Initial Biofuel Values ‐ Ethanol
• Brazilian sugarcane ethanol – $1.04 per gallon greater compared to ethanol delivered to California
from the Midwest during 2010from the Midwest during 2010– $1.56 per gallon greater compared to ethanol delivered to California
from the Midwest during the first eight months of 2011
• Caribbean Basin Initiative (CBI) ethanolCaribbean Basin Initiative (CBI) ethanol– Ethanol from CBI countries less expensive compared to Brazilian
anhydrous ethanol by approximately the value of the tariff• 44 cents per gallon (cpg) greater compared to ethanol delivered to California from the p g ( pg) g p
Midwest during 2010• 53 cpg greater compared to ethanol delivered to California from the Midwest during
the first eight months of 2011
• Staff used incremental costs from 2010 for the low prices (high• Staff used incremental costs from 2010 for the low prices (high demand) cases and the incremental costs from 2011 for the high prices (low demand) cases
11/14/2011 13

Initial Biofuel Values ‐ Biodiesel
• Biodiesel from soybean oil– Calculated as a premium to wholesale diesel fuel
• Used RIN values multiplied by 1.5p y
• Renewable Identification Number (RIN) credit values– 42 cents per gallon (cpg) for biomass‐based diesel during 2010– 124 cpg for biomass‐based diesel during the first eight months of 2011124 cpg for biomass based diesel during the first eight months of 2011
• Applied 1.5 multiplier to wholesale diesel– $2.88 per gallon calculated biodiesel price for 2010 based on average
$2 25 per gallon CARB diesel wholesale value$2.25 per gallon CARB diesel wholesale value– $4.94per gallon calculated biodiesel price during the first eight months
of 2011 based on an average $3.08 per gallon CARB diesel wholesale valuevalue
• Staff used values from 2010 for the low prices (high demand) cases and the values from 2011 for the high prices (low d d)demand) cases
11/14/2011 14

Initial Biofuel Values – Cellulosic Ethanol
• Cellulosic ethanol prices were derived due to lack of historical data– Calculated as a RIN premium to Brazilian ethanol– Calculated as a RIN premium to Brazilian ethanol
• Renewable Identification Number (RIN) credit values– 30 cents per gallon (cpg) for cellulosic biofuels during 2010
100 f ll l i bi f l d i th fi t i ht th f 2011– 100 cpg for cellulosic biofuels during the first eight months of 2011
• Applied these RIN values as premium to Brazilian ethanol– $2.86 per gallon calculated cellulosic ethanol price for 2010 based on
average $2.56 per gallon Brazilian ethanol value– $4.87per gallon calculated cellulosic ethanol price during the first eight
months of 2011 based on an average $3.87 per gallon Brazilian ethanol lvalue
• Staff used values from 2010 for the low prices (high demand) cases and the values from 2011 for the high prices (low demand) cases
11/14/2011 15
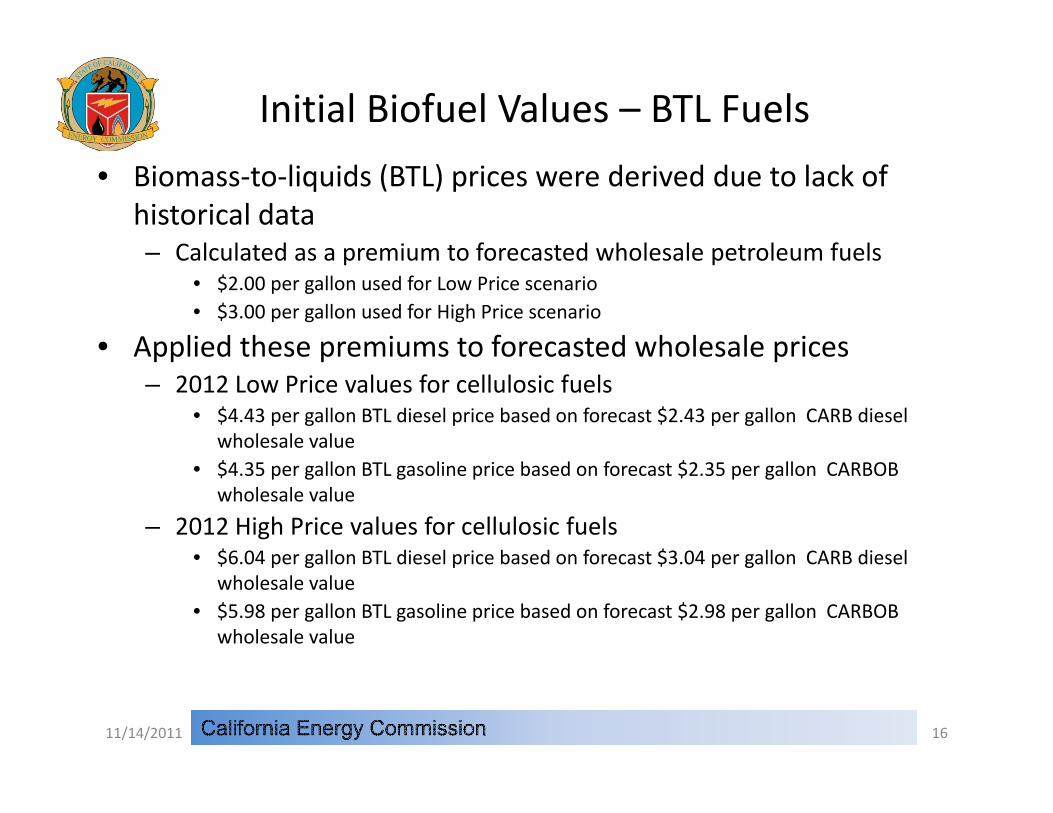
Initial Biofuel Values – BTL Fuels
• Biomass‐to‐liquids (BTL) prices were derived due to lack of historical data– Calculated as a premium to forecasted wholesale petroleum fuels– Calculated as a premium to forecasted wholesale petroleum fuels
• $2.00 per gallon used for Low Price scenario• $3.00 per gallon used for High Price scenario
• Applied these premiums to forecasted wholesale pricesApplied these premiums to forecasted wholesale prices– 2012 Low Price values for cellulosic fuels
• $4.43 per gallon BTL diesel price based on forecast $2.43 per gallon CARB diesel wholesale value
• $4.35 per gallon BTL gasoline price based on forecast $2.35 per gallon CARBOB wholesale value
– 2012 High Price values for cellulosic fuels• $6 04 per gallon BTL diesel price based on forecast $3 04 per gallon CARB diesel$6.04 per gallon BTL diesel price based on forecast $3.04 per gallon CARB diesel
wholesale value• $5.98 per gallon BTL gasoline price based on forecast $2.98 per gallon CARBOB
wholesale value
11/14/2011 16

700
2012 Fuel Prices – No CI Adjustment
600
Low Price ‐ High Demand Scenario
High Price ‐ Low Demand Scenario
Source: Energy Commission Analysis
400
500
Gallon
300
Cents P
er G
100
200
0
RFG Ex
ax Diesel
Tax
dwest
ybean
odiesel
dwest
hano
l
CBI
arcane
hano
l
zilian
arcane
hano
l
lulosic
hano
l
lulosic
soline
lulosic
iesel
Rack R Ta
CARB
Ex T
Mid
Soy
Bio
Mi
Et CSuga Eth
Bra
Sug a Eth
Cell
Eth
Cell
Gas
Cell D
11/14/2011 17
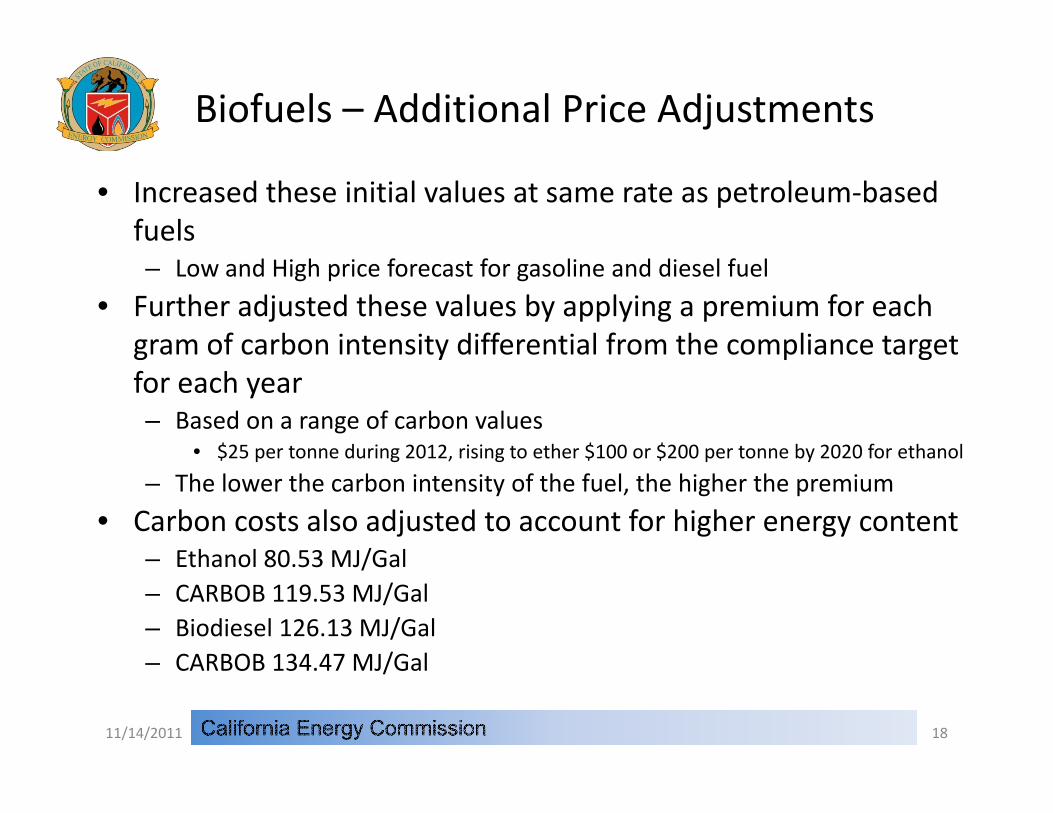
Biofuels – Additional Price Adjustments
• Increased these initial values at same rate as petroleum‐based fuels– Low and High price forecast for gasoline and diesel fuel
• Further adjusted these values by applying a premium for each gram of carbon intensity differential from the compliance target g y p gfor each year– Based on a range of carbon values
• $25 per tonne during 2012, rising to ether $100 or $200 per tonne by 2020 for ethanol$25 per tonne during 2012, rising to ether $100 or $200 per tonne by 2020 for ethanol
– The lower the carbon intensity of the fuel, the higher the premium
• Carbon costs also adjusted to account for higher energy content– Ethanol 80 53 MJ/Gal– Ethanol 80.53 MJ/Gal– CARBOB 119.53 MJ/Gal– Biodiesel 126.13 MJ/Gal– CARBOB 134 47 MJ/Gal– CARBOB 134.47 MJ/Gal
11/14/2011 18

600CornOil Biodiesel (5.90 grams)
CI Premium Adjustment – Diesel SubstitutesSource: Energy Commission Analysis
500
Corn Oil Biodiesel (5.90 grams)
UCO ‐No Cooking Biodiesel (11.76 grams)
Inedible Tallow Renewable Diesel (19.65 grams)
Cellulosic Diesel Fuel (37.20 grams)
Source: Energy Commission Analysis
400
llon
NA Canola Oil Biodiesel (62.99 grams)
Midwest Soybean Biodiesel (83.25 grams)
Premium to CARB diesel
300
ents Per Ga
200
Ce
100
02012 2015 2020
11/14/2011 19

600
CI Premium Adjustment – Gasoline Substitutes
500
BTL Gasoline (37.20 grams)
Cellulosic Ethanol (37.20 grams)
Brazil Anhydrous Ethanol ‐ Cogen + Mechanized Harvest (58.40 grams)
Brazil Hydrous Ethanol ‐ CBI El Salvador (58.40 grams)
il h d h l ( )
400
on
Brazil Anhydrous Ethanol ‐ Cogen (66.40 grams)
Brazil Anhydrous Ethanol ‐ Average (73.40 grams)
Premium to CARBOB
200
300
ts Per Gallo
100
200
Cent
02012 2015 2020
‐100Source: Energy Commission Analysis
11/14/2011 20
LCFS & RFS2 Estimated Cost Comparison
• Energy Commission staff calculated the cost of RFS2 & LCFS– Used estimated biofuel values and forecasted petroleum prices
• California consumers and businesses are expected to pay higher• California consumers and businesses are expected to pay higher prices for gasoline and diesel fuel due to:– Rising crude oil prices & linkage to higher petroleum fuel prices
I d f i bi f l– Increased use of more expensive biofuels
• Absent an LCFS regulation for California, transportation fuel prices are expected to rise due, in part, to proportional share compliance with the federal RFS2 provisions
• Therefore, only that portion that is in excess of the biofuels needed for RFS2 compliance should be attributed to the LCFSneeded for RFS2 compliance should be attributed to the LCFS
• Case 3 results used to calculate the difference in costs between the two regulations
11/14/2011 21

Case 3 Low Demand – LCFS less RFS2Preliminary Initial Results
10,000
y
Energy Commission staff will continue to work with Air Board t ff th d l f d
6 000
8,000 staff on methodology for and prices used in calculating these regulatory compliance differences
4,000
6,000
s of D
ollars
Low CI ‐ High Price ‐ Low Demand
d e e ces
2,000Millions
Source: Energy Commission Analysis
0
012
013
014
015
016
017
018
019
020
021
022
023
024
025
026
027
028
029
030
‐2,000
20 20 20 20 20 20 20 20 20 20 20 20 20 20 20 20 20 20 20
11/14/2011 22
Continuing Efforts
• Energy Commission staff will continue to analyze LCFS compliance cases, including:– New compliance targets proposed by the Air Resources Board in
response to revised high carbon intensity crude oil provisions– Additional sensitivities suggested during today’s workshop or detailed in
subsequent comments– More detailed assessment of the differences between Energy
Commission and Air Resources Board respective LCFS compliance l ianalysis
• This additional LCFS analysis will be published in the Final Staff Report
11/14/2011 23
LCFS Outside of California
• 22 other states are developing or considering adoption of LCFS programs similar to California
• The incremental demand for the same type of biofuels used to comply with California’s LCFS program that would result if any other region of the United States carried out implementation ofother region of the United States carried out implementation of an LCFS‐like program would, at a minimum, increase competition and raise the market‐clearing prices of these biof elsbiofuels
• States considering implementation of LCFS‐like regulations equate to 3.7 times the quantity of gasoline consumed in California and 7.2 times the quantity of diesel fuel consumed in California during 2009
11/14/2011 24