Low Carbon DevelopmentScenarios for Nepal to Attain a …€¢ Efficient electric motor • Vertical...
29
Low Carbon Development Scenarios for Nepal to Attain a 2⁰C Target Ram M. Shrestha 1 , Bijay Bahadur Pradhan 2 Bundit Limmeechokchai 2 1 Asian Institute of Technology and Management, Lalitpur, Nepal 2 Sirindhorn International Institute of Technology, Thammasat University, Thailand 1 23 rd AIM International Workshop November 27-28, 2017 National Institute of Environmental Studies (NIES) Tsukuba, Japan
Transcript of Low Carbon DevelopmentScenarios for Nepal to Attain a …€¢ Efficient electric motor • Vertical...

Low Carbon Development Scenarios for Nepal to Attain a 2⁰C Target
Ram M. Shrestha1, Bijay Bahadur Pradhan2
Bundit Limmeechokchai2
1Asian Institute of Technology and Management, Lalitpur, Nepal 2Sirindhorn International Institute of Technology, Thammasat University, Thailand
1
23rd AIM International Workshop November 27-28, 2017
National Institute of Environmental Studies (NIES)Tsukuba, Japan
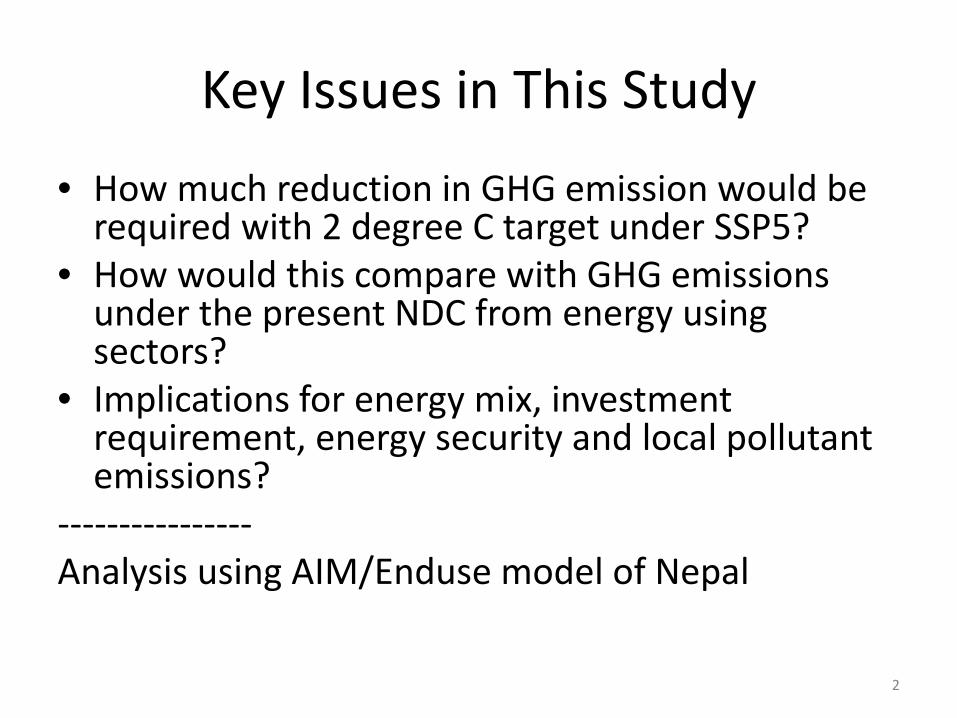
Key Issues in This Study
• How much reduction in GHG emission would be required with 2 degree C target under SSP5?
• How would this compare with GHG emissions under the present NDC from energy using sectors?
• Implications for energy mix, investment requirement, energy security and local pollutant emissions?
----------------Analysis using AIM/Enduse model of Nepal
2
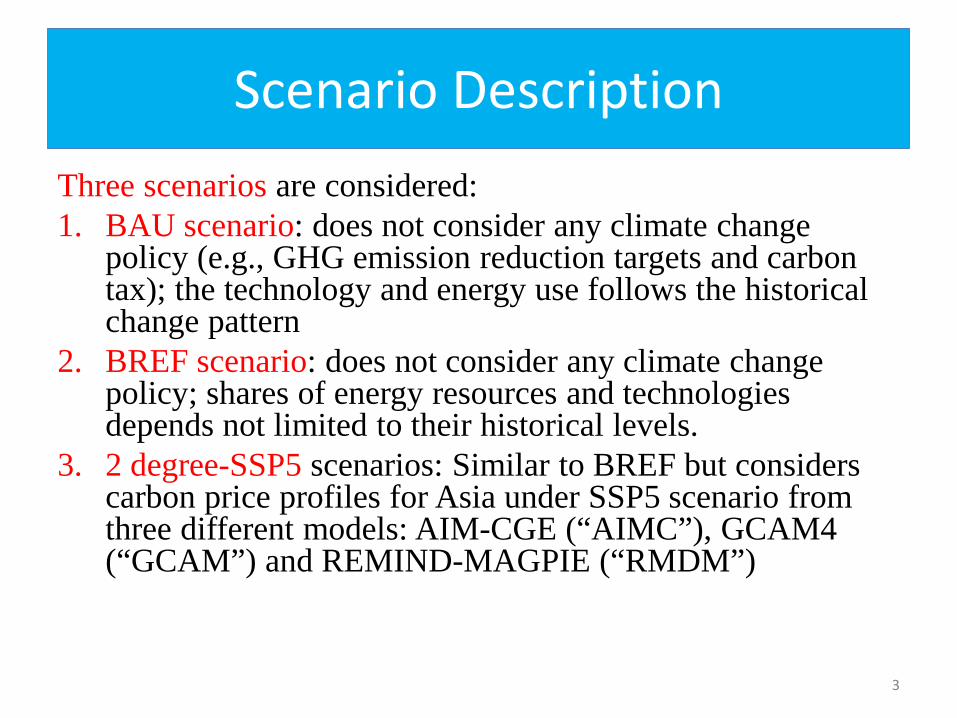
Scenario DescriptionThree scenarios are considered:1. BAU scenario: does not consider any climate change
policy (e.g., GHG emission reduction targets and carbon tax); the technology and energy use follows the historical change pattern
2. BREF scenario: does not consider any climate change policy; shares of energy resources and technologies depends not limited to their historical levels.
3. 2 degree-SSP5 scenarios: Similar to BREF but considers carbon price profiles for Asia under SSP5 scenario from three different models: AIM-CGE (“AIMC”), GCAM4 (“GCAM”) and REMIND-MAGPIE (“RMDM”)
3

Socio-economic parameters in BAU
4
2010 2020 2030 2040 2050
GDP (2010 USD) 18.9 30.8 51.1 96.0 181.0
GDP/capita (2010 USD/cap.) 723.0 1,014.2 1,511.6 2,646.8 4,793.2
Population (million) 26.1 30.4 33.8 36.3 37.8
Urban (million) 4.4 7.4 11.1 15.3 19.3
Rural (million) 21.7 23.0 22.7 21.0 18.4
Population, urban population and GDP growth rates are based on SSP5 scenario.

Socio-economic growth rates in SSP5
5
2010-2020 2020-2030 2030-2040 2040-2050
GDP growth (%) 5.01 5.18 6.51 6.54
Population growth (%) 1.52 1.07 0.71 0.40
Urban population growth (%) 5.2 4.2 3.2 2.4

Carbon price in SSPS5 scenario for Asia
6Source: SSP Public Database Version 1.1. https://tntcat.iiasa.ac.at/SspDb
0
100
200
300
400
500
600
2010 2020 2030 2040 2050
Car
bon
pric
e(2
010
US$
/tCO
2e) AIMC
RMDM
GCAM
2010 2020 2030 2040 2050
AIMC 0 0 235 471 518
RMDM 0 6 46 160 289
GCAM 0 22 22 135 220
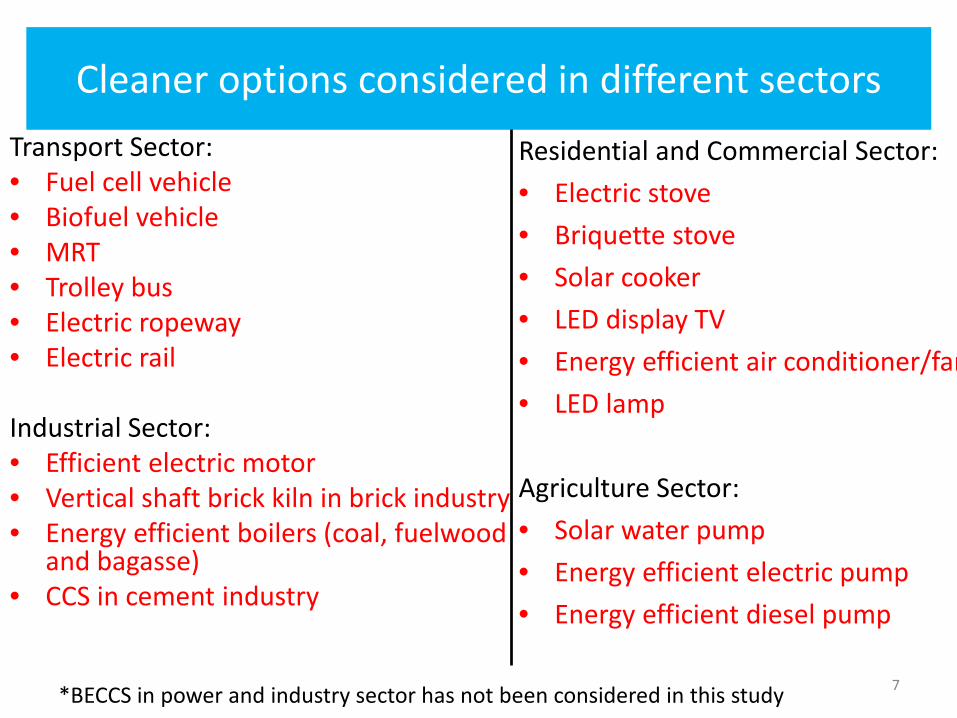
Cleaner options considered in different sectors Transport Sector:• Fuel cell vehicle• Biofuel vehicle• MRT • Trolley bus• Electric ropeway• Electric rail
Industrial Sector:• Efficient electric motor• Vertical shaft brick kiln in brick industry• Energy efficient boilers (coal, fuelwood
and bagasse)• CCS in cement industry
7
Residential and Commercial Sector:• Electric stove• Briquette stove• Solar cooker• LED display TV• Energy efficient air conditioner/fan• LED lamp
Agriculture Sector:• Solar water pump• Energy efficient electric pump• Energy efficient diesel pump
*BECCS in power and industry sector has not been considered in this study
Energy and EnvironmentalImplications
8

Cost-effective Mitigation Options in 2 degree Scenarios
Mitigation options in the Residential and Commercial Sectors:• Improved cook stoves• Biogas cooking• Electric cooking• Solar water heater• LED lamps in lighting
Mitigation options in Agriculture• Electric pumps • Solar pumping in AIMC and RMDM
9
Mitigation options in the Transport Sector:• Biofuel vehicles (ethanol and biodiesel
blend), • Flexi-fuel vehicles in AIMC• Electric cars in all three scenarios; • Electric buses in AIMC and RMDM• Gasoline hybrid vehicles (i.e., car and taxi)• Diesel hybrid vehicles (i.e., Pickup)• Diesel hybrid vehicles (i.e., Trucks)
Mitigation options in the Industrial Sector• Electric motor (motive power)• Improved fixed chimney brick kiln• Energy efficient coal boiler• Bagasse and Fuelwood boiler• CCS in cement industry (from 2025 in
AIMC, 2037 in RMDM and 2039 from GCAM)

Declining Dominance of Traditional Biomass in TPES in BAU Scenario
• Traditional biomass share decreases from 85% to 48% during 2010-2050• Oil product share increases from 9% to 25% • share of renewables (mainly hydropower) increases from 3% to 18%
10
0
5
10
15
20
25
30
2010 2015 2020 2025 2030 2035 2040 2045 2050
Mto
e
BAU scenario
Electricity importOther RenewablesHydroPetroleumCoalTraditional Biomass

Fossil fuel Consumption in BAU
11
• Total fossil fuel (coal and petroleum) would increase at CAGR of 5.1%.• Coal consumption would increase at CAGR of 4.9% (mainly cement industry, shift
from clinker import to limestone based cement manufacturing)• Petroleum product consumption would increase at 5.2%
0123456789
10
2010 2020 2030 2040 2050
Mto
e
Petroleum
Coal

Total Primary Energy Supply in BAU and 2⁰C Scenarios
In 2050, TPES • In AIMC is 12.4 % below that in BAU• 11.7% lower in RMDM and 11.2% lower in GCAM • 4.3% lower in BREF
0
5
10
15
20
25
30
2010 2020 2030 2040 2050
Mto
e
BAUBREFAIMCRMDMGCAM

Lower total primary energy supply and higher share of hydropower in 2⁰ C Scenarios
13
During 2010-2050 Cumulative TPES reduced by• 11% in AIMC• 8.3% in RMDM • 7.8% in GCAM ; 5.1% in BREF
0
5
10
15
20
25
30
2010 2015 2020 2025 2030 2035 2040 2045 2050
Mto
e
BREF scenario
0
5
10
15
20
25
30
2010 2015 2020 2025 2030 2035 2040 2045 2050
Mto
e
AIMC scenario
0
5
10
15
20
25
30
2010 2015 2020 2025 2030 2035 2040 2045 2050M
toe
GCAM scenario
0
5
10
15
20
25
30
2010 2015 2020 2025 2030 2035 2040 2045 2050
Mto
e
RMDM scenario
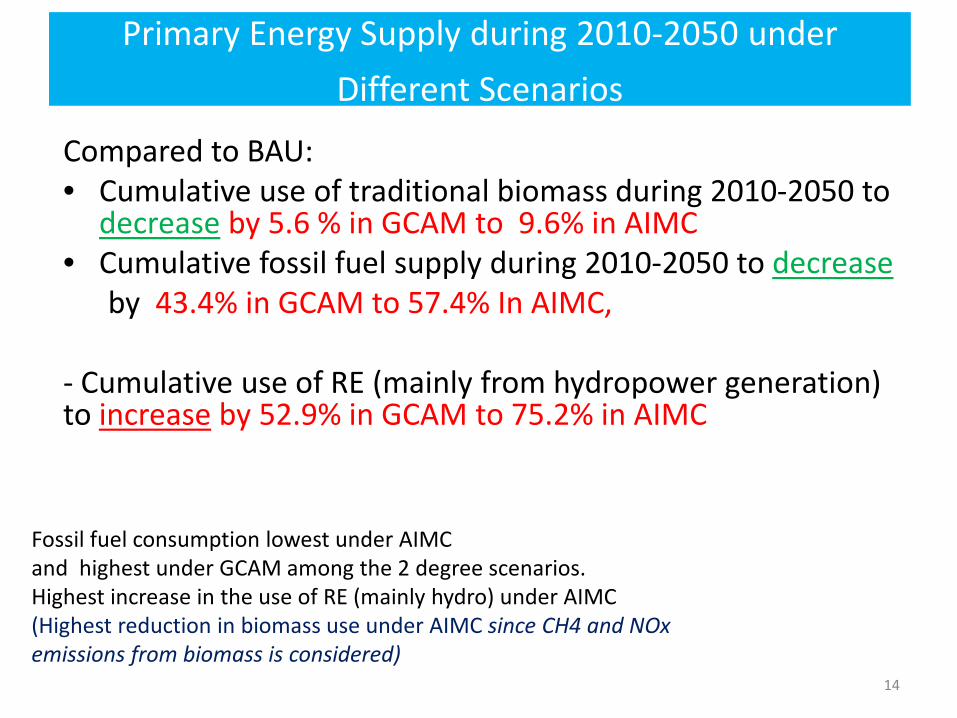
Primary Energy Supply during 2010-2050 under Different Scenarios
Compared to BAU:• Cumulative use of traditional biomass during 2010-2050 to
decrease by 5.6 % in GCAM to 9.6% in AIMC • Cumulative fossil fuel supply during 2010-2050 to decrease
by 43.4% in GCAM to 57.4% In AIMC,
- Cumulative use of RE (mainly from hydropower generation) to increase by 52.9% in GCAM to 75.2% in AIMC
14
Fossil fuel consumption lowest under AIMC and highest under GCAM among the 2 degree scenarios.Highest increase in the use of RE (mainly hydro) under AIMC(Highest reduction in biomass use under AIMC since CH4 and NOx emissions from biomass is considered)

Need for energy efficiency improvement in final energy use under 2⁰C scenarios
15
• Final energy consumption would be smaller in 2 degree cases (with largest reduction in AIMC) indicating improved energy efficiency in the endues sectors
• In 2030, FEC would decrease by (than in BAU)• 18.1% in AIMC, 10.7% in RMDM and 9.5% in GCAM; 8.3% in BREF
• In 2050, FEC would decrease by (than in BAU)• 15.6% in AIMC, 14.5% in RMDM and 13.9% in GCAM; 4.8% in BREF
0
5
10
15
20
25
30
BA
U
BR
EF
AIM
C
RM
DM
GC
AM
BA
U
BR
EF
AIM
C
RM
DM
GC
AM
2010 2030 2050
Mto
e AgricultureCommercialIndustrialTransportResidential
Final Energy Consumption

Requirement for huge increase in electricity supply under 2 degree scenarios
16
Electricity supply in the BAU in 2050 would increase by more than 13 times compared to 2010 levelCumulative electricity supply during 2010-2050 in BAU: 825 TWhCumulative electricity supply during 2010-2050 would be • 79% higher in AIMC (than that in BAU)• 59% higher in RMDM and 55% higher in GCAM
0
20
40
60
80
100
120
2010 2015 2020 2025 2030 2035 2040 2045 2050
TW
h
BAU
BREF
AIMC
GCAM
RMDMBAU: 53.2 TWh(In 2050)
BREF: +19%
AIMC :+110%
GCAM :+92%
RMDM :+97%
In 2050, supply increases by

Massive increase in power generation capacity required!
17
Compared to BAU,, installed generation capacity in 2030 needs to increase by• 14% in GCAM to 51% in AIMCIn 2050, installed capacity needs to increase by• 92% in GCAM to 110% in AIMC
*Assuming capacity factor of 50% and additional power required to support peak load is 30%
4.7
15.8
5.4
18.8
7.2
33.1
5.6
31.1
5.4
30.3
0
5
10
15
20
25
30
35
2030 2050
GW
BAU
BREF
AIMC
RMDM
GCAM
GHG implications
18

GHG emission from energy use in different scenarios
19
• In 2050 GHG emission in BAU would be 5 times of the emission level in 2010. • In 2050, the emission would 70.6% less in AIMC, 62.5% less in RMDM and 59.2% less in GCAM• Cumulative GHG emissions during 2010-2050 would be 647 MtCO2e in the BAU• Cumulative GHG emissions would be 6% less in BREF, 49% less in AIM-CGE, 38% less in RMDM and 36% less
in GCAM than that in the BAU
0
5
10
15
20
25
30
35
40
2010 2015 2020 2025 2030 2035 2040 2045 2050
MtC
O₂
e
BAU
BREF
AIMC
RMDM
GCAM

Sectoral Cumulative GHG Emissions during 2010-2050
20
• Largest reduction in GHG emission from the industry sector• Compared to the BAU, cumulative GHG emission during 2010-2050 would decrease :
- in Transport sector: by 25% in GCAM to 51% in AIMC ; - in Industry sector: by 47% in GCAM to 54% in AIMC;- in Residential sector: by 39% in GCAM to 45% in AIMC; - in Commercial Sector: by 52% in GCAM to 59% in AIMC; - in Agriculture Sector: by 0.8% in RMDM to 9% in AIMC.
215204
104
154 162
199
162
109117 121
27 2711 12 13
184 191
8499 97
20 20 18 20 20
0
50
100
150
200
250B
AU
BR
EF
AIM
C
RM
DM
GC
AM
BA
U
BR
EF
AIM
C
RM
DM
GC
AM
BA
U
BR
EF
AIM
C
RM
DM
GC
AM
BA
U
BR
EF
AIM
C
RM
DM
GC
AM
BA
U
BR
EF
AIM
C
RM
DM
GC
AM
Transport Residential Commercial Industry Agriculture
GH
G e
mis
sion
(MtC
O₂
e)

Sectoral contributions to total GHG reduction in 2030 and 2050, %
21
0
20
40
60
80
100
120
AIMC RMDM GCAM
2030
Agriculture
Industries
Transport
Commercial
Residential
0
20
40
60
80
100
120
AIMC RMDM GCAM
2050
• In 2030: GHG reduction mostly from industry and residential sectors at the lower tax scenarios (GCAM and RMDM),
• In 2050: largest reduction from the transport sector in all three tax scenarios

Overall CO2 Intensity
22
• In the BAU, by 2050 CO2 intensity would be increased by 90% compared to the 2010 level.
• By 2050, CO2 intensity would have to be reduced by 68%, 58% and 54% in AIMC, RMDM and GCAM scenarios respectively compared to the intensity under BAU.
• Up to 35% reduction in the CO2 intensity would be required during 2010-2050.
0.0
0.5
1.0
1.5
2.0
2.5
2010 2020 2030 2040 2050
CO₂
inte
nsity
[201
0 va
lue
= 1.
0]
BAUBREFAIMCRMDMGCAM

How good are present NDCs to meet the 2⁰ target?
23
• In 2050, in GHG emission in high NDC scenario would be • 68% higher than emission level in AIMC • 31% higher than that in RMDM• 21% higher than that in GCAM
13.4 12.7
7.610.3 10.6 11.0
33.730.7
9.912.6 13.7
16.6
0
10
20
30
40
BA
U
BR
EF
AIM
C
RM
DM
GC
AM
ND
C
BA
U
BR
EF
AIM
C
RM
DM
GC
AM
ND
C
2030 2050
MtC
O₂
e

Total investment requirement during 2010-2050
24
• Total investment requirement would increase by 11% in GCAM to 17% in AIMC; 3% in BREF.
425436
498
477 472
380
400
420
440
460
480
500
520
BAU BREF AIMC RMDM GCAM
billi
on U
SD
Investment

Total cost and tax revenue during 2010-2050
25
• Total cost would increase by 8% in GCAM to 18% in AIMC scenarios• Total tax revenue as % of total cost varies from 11.6% in GCAM to 12.6% in AIMC
scenarios.
79.0
41.535.2
0
20
40
60
80
100
AIMC RMDM GCAM
billi
on U
SD
Tax Revenue
574 576
680
632 623
450
500
550
600
650
700
BAU BREF AIMC RMDM GCAM
billi
on U
SD
Total Cost

Cumulative SO₂ and NOx emissions
26
• Compared to BAU, SO₂ emissions (cumulative during 2010-2050) would decrease by
• 29% in both RMDM and GCAM to 44% in AIMC; 3% in BREF• NOx emissions (cumulative 2010-2050) would decrease by
• 17% in GCAM to 33% in AIMC; 6% in BREF
308 298
171 218 220
0
100
200
300
400
BAU BREF AIMC RMDM GCAM
thou
sand
tons
SO₂
4,685 4,411
3,149 3,824 3,906
0
1,500
3,000
4,500
6,000
BAU BREF AIMC RMDM GCAMth
ousa
nd to
ns
NOx

Energy Security
27
• Reduced dependency in imported energy; but more concentration on hydropower (and reduced diversification of energy resources!)
• NEID would decrease from 32.6% in BAU to 8.6% in AIMC, 11.6% in RMDM and 12.9% in GCAM in 2050.
Net Energy Import Dependency (NEID), %
BAU BREF AIMC RMDM GCAM
2010 12.0
2030 20.9 21.5 12.4 16.7 17.5
2050 33.8 31.5 8.6 11.6 12.9
Shannon Weiner Index (SWI)
BAU BREF AIMC RMDM GCAM
2010 0.6
2030 1.1 0.6 1.0 1.0 1.0
2050 1.4 1.4 1.1 1.1 1.1

Summary of Key findings• Large shift to hydropower based electrification required to meet the 2 degree
target.• Electricity generation capacity under the 2 degree cases would be about twice as
high as the capacity in BAU.• Biomass share in TPES would be reduced under the 2 degree tax scenarios and
increased role of electricity. • Total cost during 2010-2050 under the three 2 degree tax scenarios would be 8
to18% higher than that in BAU case.• Total investment requirement would be 11 to 17% higher than that in the BAU
scenario.• GHG emission intensity by 2050 would have to be reduced by up to 35% from the
2010 level.• Present energy related NDCs are largely inadequate to meet GHG emission
reduction requirement to meet even 2 degree target (not to mention the 1.5 degree target)
• The GHG emissions under energy related NDCs are 21% to 68% higher than the total allowable emissions under the three 2 degree scenarios considered.
=> Need for larger interventions
28