Low-altitude, high-resolution aerial imaging for field ...
14
©FUNPEC-RP www.funpecrp.com.br Genetics and Molecular Research 19 (3): gmr18598 Low-altitude, high-resolution aerial imaging for field crop phenotyping in summer squash (Cucurbita pepo) I.F. Beloti 1 , G.M. Maciel 2 , R.B.A. Gallis 3 , R.R. Finzi 2 , A.A. Clemente 2 , A.C.S. Siquieroli 5 and F.C. Juliatti 4 1 Laboratório de Análises do Solo, Instituto de Ciências Agrárias, Universidade Federal de Uberlândia, Uberlândia, MG, Brasil 2 Laboratório de Análise de Sementes e Recursos Genéticos, Instituto de Ciências Agrárias, Universidade Federal de Uberlândia campus Monte Carmelo, Monte Carmelo, MG, Brasil 3 Laboratório de Sensoriamento Remoto e Fotogrametria, Instituto de Geografia, Universidade Federal de Uberlândia campus Monte Carmelo, Monte Carmelo, MG, Brasil 4 Laboratório de Micologia e Proteção Vegetal, Instituto de Ciências Agrárias, Universidade Federal de Uberlândia, Uberlândia, MG, Brasil 5 Laboratório de Genética e Bioquímica, Instituto de Bioquímica, Universidade Federal de Uberlândia campus Monte Carmelo, Monte Carmelo, MG, Brasil Corresponding author: I.F. Beloti E-mail: [email protected] Genet. Mol. Res. 19 (3): gmr18598 Received March 24, 2020 Accepted August 11, 2020 Published August 30, 2020 DOI http://dx.doi.org/10.4238/gmr18598 ABSTRACT. The culture of summer squash (Cucurbita pepo) has great socioeconomic importance worldwide. Characterization of C. pepo germplasm has been predominantly performed by field evaluations, which is very time consuming. Thus, the validation of new techniques capable of optimizing time for the field germplasm selection process would be useful. We evaluated agronomic potential and genetic dissimilarity of C. pepo germplasm and gathered data to determine whether aerial images obtained by drone imaging could assist in the selection of vegetative vigor; this is the first such analysis for this crop. Sixty-five genotypes belonging to the vegetable germplasm bank of the Federal University of Uberlândia were evaluated, with three replications
Transcript of Low-altitude, high-resolution aerial imaging for field ...

©FUNPEC-RP www.funpecrp.com.br Genetics and Molecular Research 19 (3): gmr18598
Low-altitude, high-resolution aerial imaging
for field crop phenotyping in summer squash
(Cucurbita pepo)
I.F. Beloti1, G.M. Maciel
2, R.B.A. Gallis
3, R.R. Finzi
2, A.A. Clemente
2,
A.C.S. Siquieroli5 and F.C. Juliatti
4
1 Laboratório de Análises do Solo, Instituto de Ciências Agrárias,
Universidade Federal de Uberlândia, Uberlândia, MG, Brasil 2 Laboratório de Análise de Sementes e Recursos Genéticos, Instituto de
Ciências Agrárias, Universidade Federal de Uberlândia campus Monte
Carmelo, Monte Carmelo, MG, Brasil 3 Laboratório de Sensoriamento Remoto e Fotogrametria, Instituto de
Geografia, Universidade Federal de Uberlândia campus Monte Carmelo, Monte Carmelo, MG, Brasil 4 Laboratório de Micologia e Proteção Vegetal, Instituto de Ciências
Agrárias, Universidade Federal de Uberlândia, Uberlândia, MG, Brasil 5 Laboratório de Genética e Bioquímica, Instituto de Bioquímica,
Universidade Federal de Uberlândia campus Monte Carmelo, Monte
Carmelo, MG, Brasil
Corresponding author: I.F. Beloti E-mail: [email protected]
Genet. Mol. Res. 19 (3): gmr18598 Received March 24, 2020
Accepted August 11, 2020
Published August 30, 2020
DOI http://dx.doi.org/10.4238/gmr18598
ABSTRACT. The culture of summer squash (Cucurbita pepo) has great
socioeconomic importance worldwide. Characterization of C. pepo
germplasm has been predominantly performed by field evaluations,
which is very time consuming. Thus, the validation of new techniques
capable of optimizing time for the field germplasm selection process
would be useful. We evaluated agronomic potential and genetic
dissimilarity of C. pepo germplasm and gathered data to determine
whether aerial images obtained by drone imaging could assist in the
selection of vegetative vigor; this is the first such analysis for this crop.
Sixty-five genotypes belonging to the vegetable germplasm bank of the
Federal University of Uberlândia were evaluated, with three replications

©FUNPEC-RP www.funpecrp.com.br Genetics and Molecular Research 19 (3): gmr18598
I.F. Beloti et al. 2
in a randomized block design. The variables evaluated were: production
per plant, number of fruits per plant, leaf temperature, precocity, and the
indexes SPAD (Soil Plant Analysis Development), LAI (Leaf Area
Index), NDVI (Normalized Difference Vegetation Index) and NDRE
(Normalized Difference Red Edge Index) the last three variables were
obtained using drone imaging. Genetic divergence analysis was
performed with multivariate techniques using generalized Mahalanobis
distance and UPGMA clustering. Hybrid performance was compared by
the Scott-Knott test. UPGMA clustering showed considerable genetic
diversity, with the formation of 12 distinct groups. The largest relative
contribution was from the leaf area index in the discrimination of the
genotypes, demonstrating high efficiency in the validation of the image
phenotyping technique. Eight genotypes stood out for yield, fruit
number, precocity and high leaf area index, NDVI and NDRE values.
The use of image phenotyping using NDVI and NDRE sensors was
efficient to identify C. pepo genotypes that differed in plant vigor.
Key words: Geotechnology; Genetic dissimilarity; Drone; Leaf area index;
NDVI; NDRE
INTRODUCTION Summer squash (Cucurbita pepo) is a vegetable of great socioeconomic importance,
especially for family farmers in developing countries. It belongs to the Cucurbitaceae family,
which has wide genetic variability, composed of more than 80 genera and 800 plant species
(Formisano et al., 2012).
Due to the expansion of the hybrid seed market and the demand for new hybrids
(ABCSEM, 2014), there is a need to optimize the selection process in C. pepo germplasm. One
of the limitations for advancing research is related to the considerable time needed to select high
vigor plants in the field. The use of optical sensors has been reported to be effective for
germplasm evaluation in several plant species. These sensors can cover a large field in a very
short time, providing a quick assessment of all plots. Thus, this method has the potential to
improve standard classification methods, which are extremely useful in plant breeding
(Haghighattalab et al., 2016).
Aerial platforms with adequately equipped portable multispectral sensors can critically
aid in evaluating the yield potential of new lines and for quantification of large field plots, which
is more difficult and time consuming with ground-based physical assessments (Sankaran et al.,
2015). These aerial platforms have shown to be a potential alternative given their low cost of
operation for environmental monitoring, high spatial and temporal resolution, and their high
flexibility in image acquisition programming (Zhang and Kovacs, 2012).
Contemporary studies have correlated vegetation reflectance with agronomic
characteristics in several species: Risso et al. (2012) for soybeans; Vicente et al. (2012) for sugar
cane; Haghighattalabet al. (2016) for wheat; Makanza et al. (2018) for maize; and Maciel et al.
(2019) for lettuce. Studies on olericulture species are scarce and there are no studies correlating
these multispectral indices for C. pepo. For this species, some of the main characteristics to be
evaluated in the field include plant vigor and vegetative growth (Strassburger et al., 2011).

Genetics and Molecular Research 19 (3): gmr18598
©FUNPEC-RP www.funpecrp.com.br
Phenotyping by aerial imaging of summer squash 3
We evaluated the agronomic potential of summer squash genotypes to validate the use
of aerial images obtained with a drone for measuring vegetative vigor, to determine whether
analysis of aerial images can contribute to the evaluation of genotypes.
MATERIAL AND METHODS The experiment was conducted in the city of Monte Carmelo, Brazil (18º42'43.9” S;
47º29'55.8” W; 873 m altitude) from August to December 2018, in a randomized block design
with three blocks. The genotypes were originally obtained from vegetable markets. From 2013,
five successive self-fertilizations were performed after hybridization between the accesses
“UFU-A”, “UFU-B”, “UFU-C”, “UFU-D”, “UFU-E”, “UFU-F” and "UFU-G". The method of
genetic improvement used was genealogical. Sixty-five C. pepo genotypes were obtained (Table
1). These genotypes belong to the vegetable germplasm bank of the Federal University of
Uberlândia.
Table 1. Cucurbita pepo genotypes obtained after five self-fertilizations and evaluated in a field experiment.
Number Genotype Number Genotype
3 UFU 1#1 38 UFU 77#1 4 UFU 2#1 39 UFU 78#1 5 UFU 3#1 40 UFU 79#1 7 UFU 10#1 41 UFU 83#1 8 UFU 11#1 42 UFU 85#1
9 UFU 12#1 43 UFU 87#1 10 UFU16#1 44 UFU 88#1 11 UFU 17#1 45 UFU 89#1 12 UFU 19#3 46 UFU 90#1 13 UFU 20#2 47 UFU 93#1 14 UFU 24#1 48 UFU 94#1 15 UFU 28#1 49 UFU 95#1 16 UFU 29#1 50 UFU 96#2 17 UFU 30#1 51 UFU 97#2
18 UFU 32#1 52 UFU 99#1 19 UFU 33#2 53 UFU 102#1 20 UFU 36#2 54 UFU 104#1 21 UFU 41#2 55 UFU 105#1 22 UFU 42#1 56 UFU 110#1 23 UFU 43#1 57 UFU 111#1 25 UFU 46#1 58 UFU 118#1 26 UFU 47#2 59 UFU 121#1
27 UFU 54#2 60 UFU 124#1 28 UFU 55#1 61 UFU 65#1 29 UFU 59#2 62 UFU 115#1 30 UFU 60#3 63 Tronco caserta 31 UFU 62#1 64 UFU-E 32 UFU 67#2 65 UFU-B 33 UFU 68#1 66 UFU-C 34 UFU 69#1 67 PX13067051
35 UFU 71#2 68 UFU-G 36 UFU 72#2 69 UFU-A 37 UFU 76#1
The soil was sampled at a depth of 0 to 20 cm, and samples were analyzed for chemical and physical properties, presenting the following characteristics: clayey texture

©FUNPEC-RP www.funpecrp.com.br Genetics and Molecular Research 19 (3): gmr18598
I.F. Beloti et al. 4
containing more than 50% of clay in its composition; pH in CaCl2 = 4.9; OM = 3.9 dag.kg-1
; Pmeh = 79.1 mg.dm
-3; K = 0.29 cmol.dm
-3; Ca = 3.3 cmol.dm
-3; Mg = 1.3 cmol.dm
-3; H +
Al = 4.9 cmol.dm-3
; SB = 4.90 cmol.dm-3
; T = 9.80 cmol.dm-3
; and V% = 50. Given the soil
analysis, the calculation of planting and mulching fertilizers was performed, as well as liming, as required by the summer squash crop.
Sowing was performed in 128-cell polystyrene trays with commercial coconut fiber
substrate on October 6, 2018 in a greenhouse, and transplanted to the field 14 days after sowing in a randomized block design (RBD). The 65 genotypes were planted in three blocks with four plants per plot, totaling 780 plants, spaced 0.7 m between plants and 1.2 m
between rows, with an area of 3.36 m² per plot and a total area of 655.2 m². Weed management and pest and disease control were carried out by weekly
monitoring, through chemical control. Irrigation was performed at a frequency of application according to the need of the plants with a sprinkler irrigation system, avoiding the permanent wilting point.
According to the climate classification of Köppen and Geiger (1939), the local climate is Aw (tropical savanna). During the experiment, the average temperature was 23.38°C, relative humidity was 81% and cumulative precipitation was 745.4 mm (Figure 1).
Figure 1. A) Minimum, maximum and average temperatures in the experimental plot region; B) Rainfall and relative humidity in Monte Carmelo, from October 5 to December 23, 2018.

Genetics and Molecular Research 19 (3): gmr18598
©FUNPEC-RP www.funpecrp.com.br
Phenotyping by aerial imaging of summer squash 5
The following characteristics were evaluated during the flowering / fruiting stage: SPAD (Soil Plant Analysis Development) Index: measured during the
flowering/fruiting phase with the aid of a Minolta SPAD-502 CFL1030 model chlorophyll
meter. It has an accuracy of ± 1.0 SPAD unit (for values between 0.0 and 50.0 at normal temperature/humidity). The center of the third expanded leaf, between 7:00 and 9:00 am, was sampled from four plants per plot, thus obtaining the average of the plot.
Leaf temperature (ºC): measured with an infrared thermometer (model 4000, 4GL, Everest Interscience, Tucson, AZ, USA), which has an accuracy of ± 0.3°C at temperatures of -10 to 50°C. The upper leaves were sampled trying to point the sensor in the central
position of the leaf surface in the third expanded leaf. During the harvest period (when the fruits were fully expanded), the following were
evaluated: Production (kg.plant-1
); Number of fruits (fruits.plant-1
); Precocity: number of days to start the production cycle from field transplantation. Leaf Area Index (LAI) (m²m
-2) was measured with an unmanned aerial vehicle
(Phantom4 Pro© DJI) to capture images at the field test points on November 23, 2018.
Flight plans were planned and conducted using the DroneDeploy©
application at a flight height of 50 m with a flight speed of 3 ms
-2 overlaying 173 photos using a 20-megapixel
resolution visible camera and a 12-megapixel near infrared camera (MAPIR- Peau Productions, Inc). Using these images, two orthophotos of the area of the experiment was
generated with the program Pix4d©
, one with the images taken with the visible light camera with GSD (Ground Sample Distance) of 1 cm (resolution per pixel), and the other with the infrared images with GSD 5 cm. The leaf area index was obtained by the ratio between leaf
area (m²) and plot area (m²). The area was obtained using the infrared orthophoto and subsequently calculated using Image J
© software by quantifying the pixels in the image (1
pixel = 1cm²).
At the end of the production cycle (beginning of leaf senescence), we evaluated: Normalized Difference Vegetation Index (NDVI) and Normalized Difference Red
Edge Index (NDRE): A second flight was made in the final phase of the experiment
(12/22/2018), replacing the MAPIR chamber with a multi-spectral chamber (Micasense) Red Edge-M (Seattle, USA), coupled with a 3D kit developed by Sky Flight Robotics
©
(Michigan, USA). The camera captures five images of the same resolution (1280 × 800) for five bands: 475 nm for Blue with 20 nm calculated bandwidth, maximum average bandwidth of 560 nm, band 560 nm for Green with 20 nm bandwidth, band 668 nm for 10
nm bandwidth Red, band 840 nm 40 nm band Infrared (NIR) and band 717 nm for 10 nm band Red Edge. Radiometric calibration of the images was performed by capturing images from a reflectance panel calibrated at 1 m height immediately before and after the flight.
The camera captured the images on a digital memory card in 16-bit.tif format files. After capturing the images using UAV and the RedEdge camera, the images were processed using
AgisoftPhotoScan software (www.agisoft.com) to obtain the mosaic. The NDVI and NDRE indexes of each plot were calculated using software that generates the results in the SOLVI cloud (solvi.nu).
The Normalized Difference Vegetation Index (NDVI, Equation (1)) was calculated from the difference and sum of the red band and NIR band reflectance values of the orthomosaic generated using the MicasenseRed Edge camera.
𝑁𝐷𝑉𝐼 =(NIR−RED )
(NIR +RED ) (Eq. 1)

©FUNPEC-RP www.funpecrp.com.br Genetics and Molecular Research 19 (3): gmr18598
I.F. Beloti et al. 6
The Border Red Normalized Difference Vegetation Index (NDRE, Equation (2)) was
calculated from the difference and sum of the reflectance values of the near infrared band (NIR)
and the red-edge band of the orthomosaic generated using the Micasense Red Edge camera.
𝑁𝐷𝑅𝐸 =(NIR−Red Edge )
(NIR +Red Edge ) (Eq. 2)
An NDVI threshold between 0.45 and 0.96 was used to capture green leaf reflectance
and to exclude ground background reflectance. For NDRE the threshold was from 0.13 to 0.33.
The assumptions tests of Kolmogorov-Smirnov, Bartlett and Additivity of the Blocks
were used. The data were then subjected to analysis of variance by the F test. The means were
compared by the Scott-Knott test. The variables were correlated with each other using Pearson's
correlation. These analyses were performed using R software (R development core team, 2019).
Then, multivariate analyzes were performed to determine the genetic dissimilarity
between the genotypes, obtaining the dissimilarity matrix by the generalized Mahalanobis
distance (Dii´2 ). Genetic divergence was represented by a dendrogram obtained by the
hierarchical Unweighted Pair-Group Method using Arithmetic Averages (UPGMA). Cluster
validation by the UPGMA method was determined by the cophenetic correlation coefficient
(CCC), calculated by the Mantel test (1967). The relative contribution of characters to
divergence was calculated by the criteria of Singh (1981). All data obtained were analyzed using
Genes software (Cruz 2013).
RESULTS Based on the Scott-Knott test, all variables were significant, except leaf temperature
(Table 2).
Nineteen genotypes had the highest leaf area indexes. In relation to precocity, 43
genotypes started fruiting first. Obtaining early cycles is an important feature for Brazilian
producers in cold regions (South and Southeast) to avoid frost losses and in dry regions
(Midwest and Northeast) to escape droughts. Precocity is also related to faster harvests, lower
plant vulnerability in the field to biotic and abiotic stresses, and lower costs for irrigation,
fertilization and other inputs.
For the SPAD index 37 genotypes had the highest values. Several studies have shown
the efficiency of the SPAD index as an alternative to measure levels of chlorophyll in leaves
(Klooster et al., 2012). Porto et al. (2011) evaluated the SPAD index in C. pepo cv. “Caserta”,
with increasing doses of nitrogen using the SPAD-502 portable chlorophyll meter (Minolta
Camera Co. Ltda.). Five measurements of the SPAD index per leaf were made in the central
region of the leaf blade of each plant in the useful plot, totaling 30 measurements per plot in
each treatment, using the average to represent the treatments. Estimated critical level values for
the SPAD index were 55.62 SPAD units. The critical SPAD index level obtained for the summer
squash crop was close to the range of critical SPAD index levels (associated with maximum
yield) reported by Swiader and Moore (2002) for the same crop. These authors found values of
56.7 and 59.0 units determined in newly expanded leaves during the anthesis phase, in rainfed
crops and under irrigation, in experiments conducted in Urbana, Illinois, United States. In our
study, this index ranged from 46.4 to 95.01, with an average of 70.79, which is higher than
found by Swiader and Moore (2002).

Genetics and Molecular Research 19 (3): gmr18598
©FUNPEC-RP www.funpecrp.com.br
Phenotyping by aerial imaging of summer squash 7
Table 2. Leaf Area Index (LAI), Precocity (PREC), SPAD Index (SPAD), Production per plant (PROD), No. of
fruits per Plant (NF), Leaf Temperature (LT), Normalized Difference Vegetation Index (NDVI) and Border Red Normalized Difference Vegetation Index (NDRE) in summer squash.
Genotype code LAI (m2.m-2) PREC (days) SPAD PROD (kg) NF LT (°C) NDVI NDRE
3 0.26 B 30.00 C 65.1 B 2.03 A 5.70 A 23.7ns 0.27 B 0.09 A
4 0.28 B 31.00 C 72.8 A 0.86 B 3.33 A 24.3ns 0.30 A 0.09 A 5 0.24 B 37.67 B 92.8 A 0.64 B 2.63 B 25.3ns 0.16 B 0.04 B
7 0.22 B 35.00 C 81.4 A 0.82 B 2.72 B 24.8ns 0.27 B 0.09 A 8 0.39 A 32.33 C 87.6 A 1.21 A 3.08 A 24.2ns 0.39 A 0.13 A
9 0.26 B 37.00 B 48.1 B 0.47 B 1.58 B 24.0ns 0.24 B 0.05 B 10 0.50 A 31.00 C 73.8 A 0.64 B 1.67 B 23.2ns 0.30 A 0.07 B
11 0.28 B 38.67 B 46.1 B 1.18 A 4.08 A 23.9ns 0.22 B 0.06 B 12 0.21 B 34.00 C 53.0 B 0.81 B 2.72 B 25.6ns 0.18 B 0.05 B
13 0.45 A 32.33 C 49.1 B 1.44 A 3.58 A 24.6ns 0.17 B 0.05 B 14 0.30 B 31.00 C 75.4 A 0.98 B 2.50 B 22.7ns 0.27 B 0.07 B
15 0.31 B 36.00 B 82.4 A 0.93 B 2.58 B 24.8ns 0.19 B 0.05 B 16 0.26 B 35.00 C 67.9 B 1.09 B 2.30 B 24.8ns 0.35 A 0.09 A
17 0.20 B 29.00 C 61.3 B 1.13 A 4.13 A 25.7ns 0.18 B 0.06 B 18 0.19 B 37.00 B 91.4 A 0.59 B 1.25 B 27.6ns 0.24 B 0.06 B
19 0.31 B 33.00 C 58.2 B 0.84 B 2.42 B 25.0ns 0.24 B 0.07 B 20 0.29 B 42.33 A 84.4 A 1.44 A 3.75 A 23.0ns 0.34 A 0.11 A
21 0.46A 35.00 C 62.8 B 0.89 B 2.42 B 23.4ns 0.26 B 0.05 B 22 0.21 B 34.67 C 71.5 A 0.74 B 2.75 B 25.0ns 0.24 B 0.08 A
23 0.28 B 29.00 C 71.3 A 0.77 B 2.56 B 27.5ns 0.24 B 0.04 B 25 0.38 A 34.33 C 64.7 B 0.79 B 2.00 B 28.9ns 0.37 A 0.12 A
26 0.28 B 43.67 A 55.8 B 0.53 B 2.64 B 23.5ns 0.35 A 0.08 B
27 0.37 A 36.33 B 53.0 B 1.40 A 2.17 B 26.5ns 0.33 A 0.08 A
28 0.34 B 38.67 B 71.9 A 1.04 B 2.58 B 26.2ns 0.35 A 0.09 A 29 0.33 B 33.00 C 93.9 A 0.69 B 3.17 A 27.4ns 0.35 A 0.11 A
30 0.29 B 28.00 C 88.1 A 0.73 B 2.58 B 25.5ns 0.40 A 0.13 A 31 0.32 B 32.33 C 76.8 A 1.13 A 3.25 A 25.3ns 0.37 A 0.11 A
32 0.24 B 33.00 C 66.2 B 0.55 B 2.33 B 24.8ns 0.29 A 0.09 A 33 0.26 B 36.33 B 47.9 B 0.68 B 1.72 B 25.6ns 0.25 B 0.09 A
34 0.35 B 33.67 C 83.7 A 1.74 A 4.83 A 26.1 ns 0.33 A 0.07 B 35 0.22 B 35.00 C 76.3 A 0.57 B 1.83 B 25.0ns 0.19 B 0.04 B
36 0.32 B 31.00 C 55.6 B 0.85 B 1.75 B 29.5ns 0.19 B 0.05 B 37 0.25 B 31.00 C 76.6 A 1.01 B 3.42 A 24.4ns 0.28 B 0.07 B
38 0.33B 31.00 C 74.8 A 1.35 A 3.08 A 24.8ns 0.35 A 0.10 A 39 0.39 A 31.00 C 53.8 B 1.38 A 3.92 A 24.2ns 0.31 A 0.08 A
40 0.30 B 29.00 C 60.6 B 1.31 A 3.92 A 27.8ns 0.29 A 0.07 B
41 0.23 B 34.33 C 62.3 B 0.92 B 2.00 B 23.4ns 0.20 B 0.05 B 42 0.38 A 35.00 C 76.3 A 1.25 A 3.67 A 23.0ns 0.45 A 0.16 A
43 0.39 A 36.67 B 76.9 A 0.83 B 2.00 B 23.9ns 0.34 A 0.07 B 44 0.26 B 49.00 A 80.2 A 0.35 B 1.50 B 27.1ns 0.28 B 0.09 A
45 0.18 B 32.00 C 58.0 B 0.45 B 1.58 B 28.1ns 0.26 B 0.06 B 46 0.27 B 35.00 C 72.7 A 0.73 B 1.75 B 27.3ns 0.27 B 0.08 B
47 0.24 B 37.00 B 58.1 B 0.37 B 1.47 B 25.0ns 0.32 A 0.04 B 48 0.26 B 36.67 B 78.2 A 0.60 B 2.39 B 24.8ns 0.27 B 0.08 A
49 0.24 B 37.00 B 73.3 A 0.66 B 1.17 B 26.2ns 0.16 B 0.03 B 50 0.17 B 37.00 B 49.2 B 0.33 B 1.08 B 28.2ns 0.23 B 0.05 B
51 0.31 B 33.00 C 69.8 A 1.07 B 2.50 B 26.7ns 0.33 A 0.09 A 52 0.26 B 33.00 C 69.9 A 1.95 A 3.92 A 26.6ns 0.17 B 0.03 B
53 0.30 B 31.00 C 86.2 A 1.59 A 4.58 A 24.5ns 0.21 B 0.04 B 54 0.33 B 43.33 A 61.8 B 0.66 B 1.75 B 22.6ns 0.31 A 0.08 A
55 0.45 A 43.33 A 79.9 A 0.42 B 1.75 B 25.8ns 0.36 A 0.10 A 56 0.28 B 38.67 B 78.7 A 1.07 B 3.17 A 25.1ns 0.26 B 0.07 B
57 0.46 A 34.33 C 55.5 B 1.05 B 2.50 B 24.7ns 0.30 A 0.10 A 58 0.28 B 28.00 C 63.7 B 0.93 B 3.42 A 24.1ns 0.23 B 0.05 B
59 0.29 B 33.00 C 83.5 A 0.17 B 0.92 B 27.4ns 0.26 B 0.06 B 60 0.39 A 36.33 B 64.6 B 0.77 B 2.42 B 24.0ns 0.33 A 0.08 A
61 0.30 B 47.00 A 67,0 B 0.64 B 1.17 B 26.4ns 0.36 A 0.09 A 62 0.30 B 33.00 C 73.1 A 0.64 B 2.50 B 24.2ns 0.19 B 0.06 B
63 0.43A 30.00 C 58.0 B 1.34 A 2.92 B 26.1ns 0.24 B 0.06 B 64 0.55 A 34.33 C 82.9 A 1.43 A 4.11 A 25.1ns 0.33 A 0.11 A
65 0.51 A 28.00 C 67.2 B 2.37 A 4.25 A 24.0ns 0.44 A 0.13 A 66 0.50 A 31.00 C 86.7 A 1.65 A 3.25 A 24.8ns 0.38 A 0.12 A
67 0.37 A 29.00 C 85.3 A 1.47 A 3.67 A 22.8ns 0.32 A 0.08 A 68 0.46 A 33.00 C 91.6 A 1.29 A 3.50 A 24.7ns 0.45 A 0.13 A
69 0.41 A 32.00 C 95.0 A 1.26 A 2.25 B 24.5ns 0.40 A 0.11 A
Kolmogorov-Smirnov
0.371 0.009ns 0.641 0.019 ns 0.457 0.371 0.09 0.03 ns
Bartlett 0.30 0.00 ns 0.56 0.104 0.1389 0.28 0.15 0.80
Block Additivity 0.13 0.11 0.12 0.0006ns 0.02 ns 0.45 0.22 0.03 ns
* Means followed by distinct letters in the columns do not differ statistically from each other, by the Scott-knott test, at 0.05 significance.
ns = Not significant

©FUNPEC-RP www.funpecrp.com.br Genetics and Molecular Research 19 (3): gmr18598
I.F. Beloti et al. 8
For production per plant (kg), 22 genotypes obtained the highest production. Regarding the number of fruits per plant, the highest numbers were found for 24 genotypes. For leaf temperature, no significant difference was found between the evaluated genotypes
(Table 2). Regarding the NDVI index, 32 genotypes obtained the highest indexes. For the
NDRE index, 31 genotypes obtained the highest indexes. NDVI values ranged from 0.16 to
0.45, with a mean value of 0.29. NDRE values ranged from 0.03 to 0.16, with a mean value of 0.08 (Table 2).
The genotypes that presented high production per plant, number of fruits per Plant,
early cycles, high leaf area index, NDVI and NDRE were Abobrinha 11#1 (8), Abobrinha 78#1 (39), Abobrinha 85#1 (42), UFU-E (64), UFU-B (65), UFU-C (66), PX13067051 (67)
and UFU-G (68) (Table 2). The development of more productive genotypes in future breeding programs
depends on the genetic variability available in germplasm banks (Koundinya et al. 2013). In
our study, in the genetic diversity dendrogram (Figure 2), the genotypes were grouped according to the mean group linkage (UPGMA) method. For this, the cophenetic correlation value (CCC) was 63% (p = 0.01), indicating validation of the clustering method.
Figure 2. Illustrative dendrogram of the analysis of 65 Cucurbita pepo genotypes by the mean group bonding
method (UPGMA) obtained with the generalized Mahalanobis distance (Dii2 ).

Genetics and Molecular Research 19 (3): gmr18598
©FUNPEC-RP www.funpecrp.com.br
Phenotyping by aerial imaging of summer squash 9
Separation of the groups was obtained by delimiting a cutoff line considering 60% of dissimilarity between the genotypes. The cut-off line was established wherever abrupt changes in the branches in the dendrogram were observed (Cruz et al., 2012). Based on this
cutoff (dashed line in Figure 2) the genotypes constituted 12 distinct groups. The first group consisted of approximately 54% of the genotypes, including
commercial genotype “PX13067051”. The second group consisted of approximately 6% of
the genotypes. The third group consisted of approximately 3% of the genotypes. The fifth group consisted of approximately 11% of the genotypes including the commercial genotype “Tronco caserta”. The seventh group consisted of approximately 5% of the genotypes. The
eighth group consisted of approximately 8% of the genotypes. The eleventh group consisted of 6% of the genotypes. The fourth, sixth, ninth, tenth and twelfth groups are each
composed of a single genotype. Based on the criteria proposed by Singh (1981), it was observed that the most
important characteristics for genotype discrimination in decreasing order were: Leaf Area
Index, Precocity, NDRE, Production per Plant, Number of fruits per Plant, SPAD Index, NDVI and Leaf Temperature (Table 3).
Table 3. Relative contribution of the evaluated characteristics of summer squash to divergence using the Singh (1981) criteria.
Character S.J S.J(%)
Precocity 03651.04 009.46 Production per Plant 03078.12 007.98 Number of fruits per Plant 02954.85 007.66 Leaf Area Index 19170.55 049.70 SPAD Index 02786.00 007.22
Leaf temperature 01503.61 003.90 NDVI 01835.56 004.76 NDRE 03596.64 009.32
Total 38576.36 100.00
Normalized Difference Vegetation Index (NDVI); Border Red Normalized Difference Vegetation Index (NDRE).
The largest relative contribution refers to the leaf area index in the discrimination of the evaluated genotypes. This demonstrates the great importance of field evaluation of this trait for future breeding programs. This fact shows the usefulness of images obtained by
drones, saving time and labor in obtaining these data. The leaf area index (LAI) was positively correlated with yield and number of fruits
per plant (Table 4), extremely relevant characteristics in summer squash breeding. The
NDVI and NDRE vegetation index are well correlated with the LAI. These indexes are sensitive to canopy changes when the LAI is low (i.e. during the early stage), with the
signal becoming saturated when the crop canopy closes (Inman et al. 2008; Marti et al. 2007).
The correlation between leaf area index and Production per plant, number of fruits
per plant, NDVI and NDRE demonstrates the importance of image selection (Table 4). The NDVI and NDRE indexes showed a high positive correlation (Table 4).
The RGB orthomosaic and the Infrared orthomosaic (first flight) can be viewed in
Figure 3.

©FUNPEC-RP www.funpecrp.com.br Genetics and Molecular Research 19 (3): gmr18598
I.F. Beloti et al. 10
Table 4. Pearson correlation coefficients between the evaluated characters in summer squash: Leaf Area
Index (LAI), Precocity (PREC), SPAD Index (SPAD), Production per plant (PROD), No. of fruits per Plant
(NF), Leaf Temperature (LT), Normalized Difference Vegetation Index (NDVI) and Border Red Normalized Difference Vegetation Index (NDRE).
PROD NF LT LAI PREC SPAD NDVI NDRE
PROD 1 0.86 -0.06 -0.54 -0.39 -0.19 -0.32 -0.40 NF 1 -0.11 -0.45 -0.43 -0.22 -0.26 -0.36 TF -1 -0.05 -0.02 -0.20 -0.03 -0.01 LAI -1 -0.29 -0.22 -0.58 -0.60
PREC 1 -0.17 -0.12 -0.15 SPAD -1 -0.23 -0.26 NDVI -1 -0.86 NDRE -1
Figure 3. RGB (visible spectrum) orthomosaic of the experiment (left) and Infrared orthomosaic (right) of the
summer squash plants.
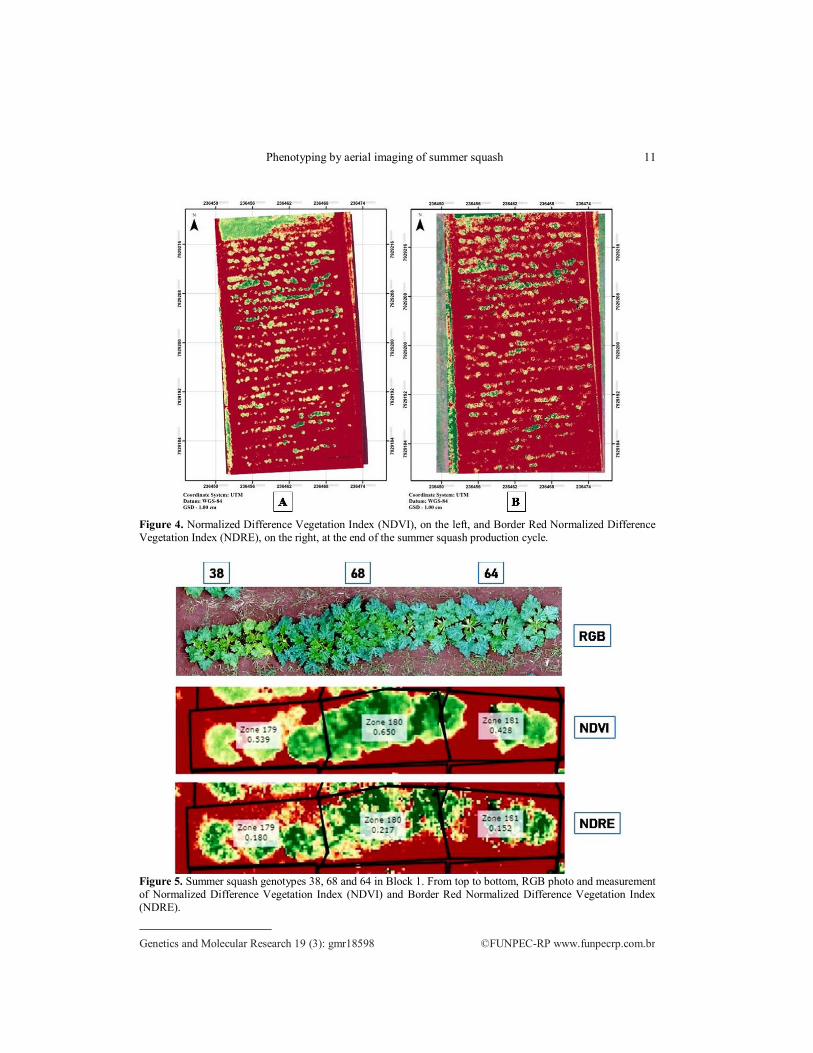
For the second flight the images obtained and processed for NDVI and NDRE
estimates are given in Figure 4.
In the images obtained in the second flight (end of the production cycle), it is still possible to make a differentiation of genotypes, even with the progression of leaf
senescence (Figure 4). Genotypes 8, 25, 27, 39, 42, 55, 57, 60, 64, 65, 66, 67, 68 and 69 obtained high LAI values and high NDVI and NDRE values on the second flight image.
By analyzing Figure 5, the NDVI and NDRE spectrum image shows that there is
coherence between the results obtained by the sensors when compared to the RGB image. It shows the difference between genotypes 38, 68 and 64 in the visible spectrum (RGB).
These differences are accentuated when the NDVI and NDRE indexes are calculated.
There is no statistical difference between genotypes 68 and 64 for all variables analyzed.
Genotype 38, on the other hand, presented lower LAI in relation to the others.
Genetics and Molecular Research 19 (3): gmr18598
©FUNPEC-RP www.funpecrp.com.br
Phenotyping by aerial imaging of summer squash 11
Figure 4. Normalized Difference Vegetation Index (NDVI), on the left, and Border Red Normalized Difference
Vegetation Index (NDRE), on the right, at the end of the summer squash production cycle.
Figure 5. Summer squash genotypes 38, 68 and 64 in Block 1. From top to bottom, RGB photo and measurement
of Normalized Difference Vegetation Index (NDVI) and Border Red Normalized Difference Vegetation Index
(NDRE).

©FUNPEC-RP www.funpecrp.com.br Genetics and Molecular Research 19 (3): gmr18598
I.F. Beloti et al. 12
DISCUSSION
Variables such as plant height and canopy cover, measured using aerial images to monitor crop growth can be used to estimate final yield. As an example, Bendig et al.
(2014) measured plant height of barley from the crop surface model generated by RGB images, used to develop regression models to predict biomass and the best model obtained a
relative error of 54.04%. A study by Zhao et al. (2007), in cotton, showed that NDVI has a high linear
correlation (R2> 0.6) with leaf area index (LAI). As NDVI and LAI correlate with canopy
coverage, a linear relationship was found between NDVI and canopy coverage. The coefficient of determination (R
2) was low (0.33 to 0.48) because data collection was
performed at the late vegetative stage, where the correlation between LAI and NDVI was
depreciated, the same fact was observed in the present study. Another reason for the low R2
may be due to the late planting that caused cotton plants to grow differently from normal
growth. The linear relationship became weak after the fully closed canopy due to leaf defoliation.
In our study the yield variable had a high positive correlation with the number of
fruits per plant, a positive correlation with NDVI and NDRE. In relation to precocity, the correlation was negative, demonstrating that early cycles are related to lowers yields in summer squash. SPAD and leaf temperature indexes showed low correlations with
Production per plant. Regarding the number of fruits showed positive correlations with SPAD, NDVI and NDRE. Leaf temperature was correlated with SPAD index, but it had low
correlations with the other variables (Table 4). Porto et al. (2011), in summer squash, found high correlations of R
2 = 0.96 (p
<0.001) between SPAD index and total chlorophyll content, R2 = 0.93 (p <0.001) between
SPAD index and total N content, and R2 = 0.96 (p <0.001) between total chlorophyll
content and total N content. These results indicate the possibility of using the portable meter SPAD-502 in the indirect evaluation of the total chlorophyll content and in the
characterization of the N state in the summer squash crop, consequently the yield. However, in the present study the correlations of SPAD and production were low (0.19).
This study demonstrated the usefulness of multispectral aerial images to estimate
leaf area index. By analyzing the infrared spectrum image obtained in the first flight, in full vegetative development and production, differences in vegetative vigor could be observed
between the evaluated genotypes (Figure 3). Through the NDVI index it was possible to separate the plants in relation to the soil
bottom (Red Latosol). This fact was also observed by Díaz-Varela et al. (2015), in which
NDVI could be used to separate the crown of olive trees (Olea europaea L.) from the ground floor, using aerial images. Current methods for estimating leaf area index (LAI) involve destructive sampling and are not practical in breeding programs. Drone and
proximal sensor technologies open new opportunities to evaluate these features several times in large trials with small plots (Potgieter et al., 2017).
The screening process may require great human effort, in addition to the fact that the evaluation of some variables in certain environments limits the yield of this process. This is described by Furbank and Tester (2011) as one of the bottlenecks of the phenotyping
process. In particular, this process is time consuming and as such quite expensive. The use of image evaluation is a great tool to circumvent these barriers because they are

Genetics and Molecular Research 19 (3): gmr18598
©FUNPEC-RP www.funpecrp.com.br
Phenotyping by aerial imaging of summer squash 13
noninvasive, fast and with high correlation to plant anatomical, physiological and biochemical characteristics (Walter et al., 2015).
CONCLUSIONS
The summer squash germplasm bank was found to have considerable genetic diversity among the genotypes, allowing good efficiency in the validation of the image phenotyping technique. Genotypes Abobrinha 11#1 (8), Abobrinha 78#1 (39), Abobrinha
85#1 (42), UFU-E (64), UFU-B (65), UFU-C (66), PX13067051 (67), UFU-G (68) stood out for yield, fruit number, precocity and high leaf area index, NDVI and NDRE values.
ACKNOWLEGDMENTS The authors would like to thank the Federal University of Uberlândia (UFU), the
Minas Gerais State Research Foundation (FAPEMIG), the National Council for Scientific
and Technological Development (CNPq), and the Coordination for the Improvement of Higher Education Personnel (CAPES) for funding this research.
CONFLICTS OF INTEREST
The authors declare no conflict of interest.
REFERENCES
ABCSEM – Associação Brasileira de Comércio de Sementes e Mudas. (2014). 2º levantamento de dados
socioeconômicos da cadeia produtiva de hortaliças no Brasil. Available at http: // www.abcsem.com.br// Accessed
December 20, 2019.
Bendig J, Bolten A, Bennertz S, Broscheit J, et al. (2014). Estimating Biomass of Barley Using Crop Surface Models
(CSMs) Derived from UAV-Based RGB Imaging. Remote Sens. 6: 10395-10412.
https://doi.org/10.3390/rs61110395.
Cruz CD, Regazzi AJ and Carneiro PCS (2012). Modelos biométricos aplicados ao melhoramento genético. Viçosa:
UFV. 514p.
Cruz CD (2013). GENES: a software package for analysis in experimental statistics and quantitative genetics. Acta sci.
agron. 35: 271-276. https://doi.org/10.4025/actasciagron.v35i3.21251.
Formisano G, Roig C, Esteras C, Ercolano MR, et al. (2012). Genetic diversity of Spanish Cucurbita pepo landraces: an
unexploited resource for summer squash breeding. Genet. resour. crop. ev. 59: 1169-1184.
https://doi.org/10.1007/s10722-011-9753-y.
Furbank RT and Tester M (2011). Phenomics - technologies to relieve the phenotyping bottleneck. Trends plant sci. 16:
635-644. https://doi.org/10.1016/j.tplants.2011.09.005.
Haghighattalab A, González Pérez L, Mondal S, Singh D, et al. (2016). Application of unmanned aerial systems for high
throughput phenotyping of large wheat breeding nurseries. Plant Methods. 12: 35. https://doi.org/10.1186/s13007-
016-0134-6.
Inman D, Khosla R, Reich R and Westfall DG (2008). Normalized difference vegetation index and soil color-based
management zones in irrigated maize. Agron. J.. 100: 60-66. https://doi.org/10.2134/agronj2007.0020.
Klooster W S, Creg B M, Fernandez R T and Nzokou P (2012). Growth and physiology of deciduous shade trees in
response to controlled-release fertilizer. Sci. Hortic. 135: 71-79. https://doi.org/10.1016/j.scienta.2011.12.009. Köppen W and Geiger R (1939). Handbuch der Klimatologie, Berlin: G. Borntraeger. 6v.
Koundinya AVV, Dhankhar SK and Yadav AC (2013). Genetic variability and divergence in okra (Abelmoschus
esculentus). Indian J. Agric. Sci. 83: 97-100. https://doi.org/10.15740/HAS/IJAS/11.1/158-160.
Liu K, Yazhen L and Huiwen HU (2014). Estimating the effect of urease inhibitor on rice yield based on NDVI at key
growth stages. Front. Agr. Sci. Eng. 1: 150-157. http://doi.org/10.15302/J-FASE-2014028.

©FUNPEC-RP www.funpecrp.com.br Genetics and Molecular Research 19 (3): gmr18598
I.F. Beloti et al. 14
Makanza R, Zaman-Allah M, Cairns JE, Magorokosho C, et al. (2018). High-throughput phenotyping of canopy cover and senescence in maize field trials using aerial digital canopy imaging. Remote Sens. 10: 330.
http://doi.org/10.3390/rs10020330.
Mantel N (1967). The detection of disease clustering and generalized regression approach. Cancer Res. 27: 209-220.
Marti J, Bort J, Slafer GA and Araus JL (2007). Can wheat yield be assessed by early measurements of Normalized
Difference Vegetation Index? Ann. appl. Biol. 150: 253-257. https://doi.org/10.1111/j.1744-7348.2007.00126.x.
Picoli MCA, Lamparelli RAC, Sano E, De Mello JRB, et al. (2013). Effect of sugar cane planting row directions on
ALOS/PALSAR satellite images. GIsci. Remote Sens. 50: 349-357. https://doi.org/10.1080/15481603.2013.808457.
Pôrto ML, Puiatti M, Fontes PCR, Cecon PR, et al. (2011). Índice SPAD para o diagnóstico do estado de nitrogênio na
cultura da abobrinha. Hortic. Bras. 29: 311-315. http://dx.doi.org/10.1590/S0102-05362011000300009.
Potgieter AB, George-jaeggli B, Chapman SC, Laws K, et al. (2017). Multi-Spectral Imaging from an Unmanned Aerial
Vehicle Enables the Assessment of Seasonal Leaf Area Dynamics of Sorghum Breeding Lines. Front Plant Sci. 8:
1532. https://doi.org/10.3389/fpls.2017.01532.
R Development Core Team.: R: A language and environment for statistical computing (2019). R Foundation for
Statistical Computing, Vienna, https://www.rproject.org/.
Risso J, Rizzi R, Rudorff BFT, Adami M, et al. (2012). Índices de vegetação Modis aplicados na discriminação de áreas
de soja. Pesq. Agropec. Brás. 47: 1317-1326. http://dx.doi.org/10.1590/S0100-204X2012000900017.
Sankaran S, Khot L R.; Espinoza C Z, et al. (2015). Low-altitude, high-resolution aerial imaging systems for row and
field crop phenotyping: A review. Eur. J. Agron. 70: 112-123. http://dx.doi.org/10.1016/j.eja.2015.07.004. Singh D (1981). The relative importance of characters affecting genetic divergence. Indian J. Genet. Pl. Br. 41: 237-245.
Strassburger AS, Peil RMN, Fonseca LA, Aumonde TZ, et al. (2011). Dinâmica de crescimento da abobrinha italiana em
duas estações de cultivo. Acta sci-agron. 33: 283-289. https://dx.doi.org/10.4025/actasciagron.v33i2.5952.
Swiader JM and Moore A (2002). SPAD chlorophyll response to nitrogen fertilization and evaluation of nitrogen status
in dryland and irrigated pumpkins. J. Plant. Nutr. 25: 1089-1100. https://doi.org/10.1081/PLN-120003941.
Vicente LE, Gomes D, Victoria D. de C, Garçon EAM, et al. (2012). NDVI temporal series from the SPOT Vegetation
sensor and SAM algorithm applied to sugarcane mapping. Pesq. Agropec. Bras. 47: 1337-1345.
http://dx.doi.org/10.1590/S0100-204X2012000900019.
Walter A, Liebisch F and Hund A (2015). Plant phenotyping: from bean weighing to image analysis. Plant Methods. 11:
14. http://dx.doi.org/10.1186/s13007-015-0056-8.
Zhang C and Kovacs JM (2012). The application of small unmanned aerial systems for precision agriculture: a review.
Precision Agric. 13: 693-712. https://doi.org/10.1007/s11119-012-9274-5.
Zhao D, Huang L, Li J and Qi J (2007). A comparative analysis of broadband and narrowband derived vegetation indices
in predicting LAI and CCD of a cotton canopy. ISPRS J. Photogramm. 62: 25-33.
https://doi.org/10.1016/j.isprsjprs.2007.01.003.