Louisiana Data Analysis Part 1: Prison Trends · 1 Louisiana Data Analysis Part 1: Prison Trends...
84
1 Louisiana Data Analysis Part 1: Prison Trends Justice Reinvestment Task Force August 11, 2016
Transcript of Louisiana Data Analysis Part 1: Prison Trends · 1 Louisiana Data Analysis Part 1: Prison Trends...

1
Louisiana Data Analysis Part 1: Prison Trends
Justice Reinvestment Task Force
August 11, 2016

2
Pretrial Population
Charge of the Justice Reinvestment Task Force
• The Justice Reinvestment Task Force is a high-level, inter-branch, and
bipartisan group charged with analyzing the drivers of the Louisiana prison
population; assessing state sentencing and corrections policy; consulting
criminal justice stakeholders; and forging consensus on a comprehensive
package of reforms that will accomplish the following three goals as set out in
HCR 82:
– Reduce correctional populations and associated criminal justice spending by focusing
prison space on serious and violent criminals.
– Hold offenders accountable more efficiently by implementing or expanding research-
based supervision and sentencing practices.
– Reinvest savings into strategies shown to decrease recidivism, including improved
reentry outcomes.
Introduction

3
Pretrial Population
Justice Reinvestment Task Force Schedule
• June 17, 2016: Introduction and National Trends
• August 11, 2016: Data Analysis I: Prison Trends
• September 23, 2016: Data Analysis II
• October 21, 2016: Data Analysis III
• November 17, 2016: System Assessment and Introduction
to Policy Development
Introduction

4
Pretrial Population
How We Examine Prison Populations
Introduction
Admissions
Newly Sentenced Prisoners
Revocations
Time Served
Newly Sentenced Prisoners
Revocations
Prison Population

5
Pretrial Population
Outline
• Regional Context
• Trends in the Louisiana Prison Population
– Admissions: how many people come into prison
– Time served: how long they stay in prison
– Prison population: impact of admissions and time served
trends
– Behind the decline: trends driving the recent decrease in
the prison population
Introduction

6
LOUISIANA IN THE REGIONAL
CONTEXT

7
Pretrial Population
Dramatic Growth in the Imprisonment Rate in Last
Three and a Half Decades
Regional Context
Source: Department of Justice, Bureau of Justice Statistics
179
816
0
100
200
300
400
500
600
700
800
900
1,000
197
8
197
9
198
0
198
1
198
2
198
3
198
4
198
5
198
6
198
7
198
8
198
9
199
0
199
1
199
2
199
3
199
4
199
5
199
6
199
7
199
8
199
9
200
0
200
1
200
2
200
3
200
4
200
5
200
6
200
7
200
8
200
9
201
0
201
1
201
2
201
3
201
4
Louisiana Imprisonment Rate per 100,000 Residents, 1978-2014

8
Pretrial Population
Crime Rate Began Declining in Mid-1990s
Regional Context
Source: Federal Bureau of Investigation, Uniform Crime Reports
4,792
3,974
0
1,000
2,000
3,000
4,000
5,000
6,000
7,000
8,000
197
8
197
9
198
0
198
1
198
2
198
3
198
4
198
5
198
6
198
7
198
8
198
9
199
0
199
1
199
2
199
3
199
4
199
5
199
6
199
7
199
8
199
9
200
0
200
1
200
2
200
3
200
4
200
5
200
6
200
7
200
8
200
9
201
0
201
1
201
2
201
3
201
4
Louisiana Total Index Crime Rate per 100,000 Residents, 1978-2014

9
Pretrial Population
Louisiana Has Similar, Though Slightly Higher,
Crime Rate to Many States in the Region
Regional Context
Source: Federal Bureau of Investigation, Uniform Crime Reports
427 480 541 377 515 498 608 406 482
3,178 3,338 3,416
3,281 3,459 3,460 3,061
3,019 3,276
0
500
1,000
1,500
2,000
2,500
3,000
3,500
4,000
4,500
Alabama Arkansas Florida Georgia Louisiana SouthCarolina
Tennessee Texas GroupAverage
Total Index Crime Rate per 100,000 Residents by Type, 2014
Violent Property

10
Pretrial Population
Imprisonment Rate Higher Than States in Region
With Similar Crime Rates
Regional Context
Source: Department of Justice, Bureau of Justice Statistics
633 599
513 517
816
429 437
584 566
0
100
200
300
400
500
600
700
800
900
Alabama Arkansas Florida Georgia Louisiana SouthCarolina
Tennessee Texas GroupAverage
Imprisonment Rate per 100,000 Residents, 2014

11
Pretrial Population
Louisiana Has Highest Prison Admission Rate of
States in Region with Similar Crime Rates
Regional Context
165
272
159
188
356
189
224
265
227
0
50
100
150
200
250
300
350
400
Alabama Arkansas Florida Georgia Louisiana SouthCarolina
Tennessee Texas GroupAverage
Prison Admission Rate per 100,000 Residents, 2014
Source: Department of Corrections statistical reports for each state

12
Pretrial Population
Admission Rate of Nonviolent Prisoners Much Higher
Than States in Region With Similar Crime Rates
Regional Context
50 70 48 40 59 54
109 118
307
149
205 178
0
50
100
150
200
250
300
350
400
Florida Georgia Louisiana South Carolina Texas Group Average
Prison Admission Rate per 100,000 Residents by Offense Type, 2014
Violent Nonviolent
Source: Department of Corrections statistical reports for each state
13
Pretrial Population
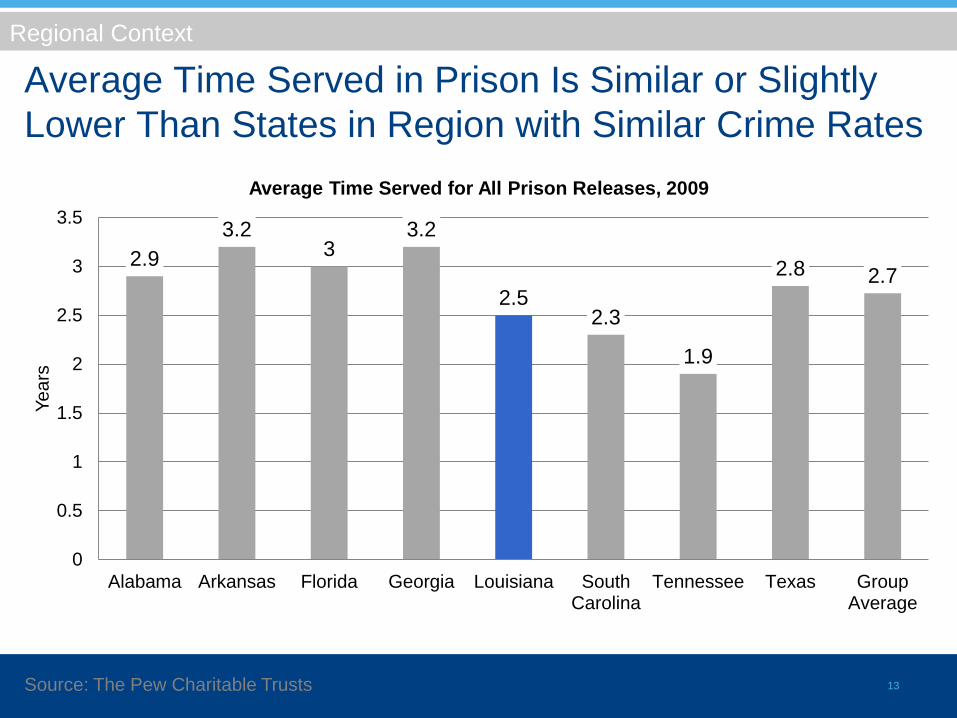
Average Time Served in Prison Is Similar or Slightly
Lower Than States in Region with Similar Crime Rates
Regional Context
2.9
3.2 3
3.2
2.5 2.3
1.9
2.8 2.7
0
0.5
1
1.5
2
2.5
3
3.5
Alabama Arkansas Florida Georgia Louisiana SouthCarolina
Tennessee Texas GroupAverage
Ye
ars
Average Time Served for All Prison Releases, 2009
Source: The Pew Charitable Trusts

14
Pretrial Population
Key Takeaways: Regional Context
• Louisiana’s imprisonment rate more than quadrupled in the
past 35 years.
• Louisiana has a higher imprisonment and prison admission
rate than other states in the region with similar crime rates.
• Average time served for people released from prison in
Louisiana is on par with or lower than many states in the
region with similar crime rates.
Regional Context

15
TRENDS IN THE LOUISIANA
PRISON POPULATION

16
Pretrial Population
Data Sources
• Louisiana Department of Corrections
– Prison admissions, 2006-2015
– Prison releases, 2006-2015
– Annual snapshots of prison population,
December 31, 2006-2015
Trends in the LA Prison Population

17
Pretrial Population
Definition of Terms
Supervision
• Community supervision
– Probation, parole, or good time parole
Offense Type
• Violent crime
– Any crime defined as violent in LA R.S. 14:2(B), as well as vehicular
homicide (designated by the Supreme Court as a violent crime), and
domestic abuse by burning (designated by statute as a violent
crime)
• Primary offense
– The offense with the longest sentence length associated with an
inmate’s current prison stay
Trends in the LA Prison Population

18
Pretrial Population
Definition of Terms: Prior Contact
• Prior DOC contacts include:
– Prison sentence in DOC custody
– Probation sentence supervised by DOC
– Felony specialty court sentence
– Parole or good time parole supervision sentence
– Revocation to prison
• Prior DOC contacts do not include:
– Arrests
– Participation in DA diversion programs
– Misdemeanor convictions
Trends in the LA Prison Population

19
Pretrial Population
Definition of Terms: Admission Types
• Newly sentenced prisoner
– Admitted to prison for a court-ordered felony sentence at the time of
conviction
• Revocation
– Admitted to prison for violating the terms of community supervision
• Habitual offender
– Person sentenced under Louisiana’s habitual offender statute, which
increases the minimum and maximum penalties for second or
subsequent felonies
Trends in the LA Prison Population

20
Pretrial Population
Definition of Terms: Release Types
• Parole
– Released by the Parole Board after serving the statutorily required
portion of the sentence
• Expiration of Sentence
– Released to the community after serving full sentence in prison
• Diminution of Sentence
– Released to good time parole supervision after earning good time
credits or attending certified treatment and rehabilitation programs
• Other
– Released through another mechanism such as commutation of
sentence, court-ordered release, or death
Trends in the LA Prison Population
21
Pretrial Population
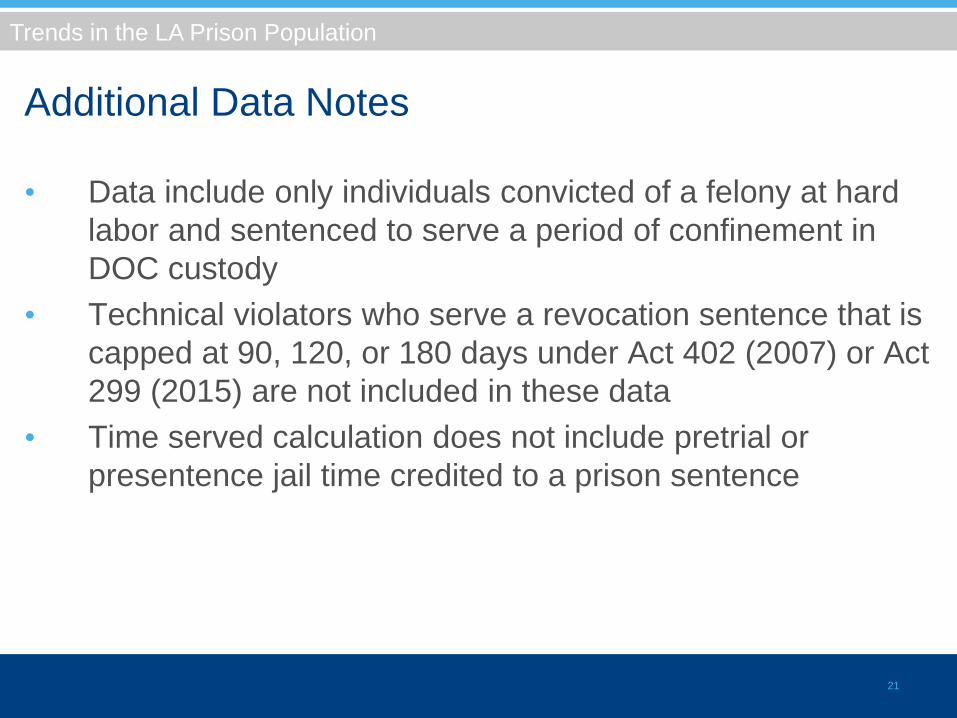
Additional Data Notes
• Data include only individuals convicted of a felony at hard
labor and sentenced to serve a period of confinement in
DOC custody
• Technical violators who serve a revocation sentence that is
capped at 90, 120, or 180 days under Act 402 (2007) or Act
299 (2015) are not included in these data
• Time served calculation does not include pretrial or
presentence jail time credited to a prison sentence
Trends in the LA Prison Population

22
PRISON ADMISSIONS

23
Pretrial Population
Louisiana Has Highest Prison Admission Rate of
States in Region with Similar Crime Rates
Admissions
165
272
159
188
356
189
224
265
227
0
50
100
150
200
250
300
350
400
Alabama Arkansas Florida Georgia Louisiana SouthCarolina
Tennessee Texas GroupAverage
Prison Admission Rate per 100,000 Residents, 2014
Source: Department of Corrections statistical reports for each state

24
Pretrial Population
Prison Admissions Up 8% Overall in Last Decade,
Declining Since 2012
15,332
17,684
16,504
0
2,000
4,000
6,000
8,000
10,000
12,000
14,000
16,000
18,000
20,000
2006 2007 2008 2009 2010 2011 2012 2013 2014 2015
Admissions by Year
Admissions
Source: Louisiana Department of Corrections

25
Pretrial Population
Violent Crime Down 29%, Property Crime Down
15% Since 2006
Admissions
721
4,081
515
3,459
0
500
1,000
1,500
2,000
2,500
3,000
3,500
4,000
4,500
Violent crime rate Property crime rate
Total Index Crime Rate Per 100,000 Residents, 2006 and 2014
2006 2014
Source: Federal Bureau of Investigation, Uniform Crime Reports

26
Pretrial Population
Nearly 9 in 10 Prison Admissions Are Male
Male 89%
Female 11%
Admissions by Sex, 2015
Admissions
Source: Louisiana Department of Corrections

27
Pretrial Population
Female Prison Admissions Up 15% in Last
Decade, Outpacing Growth of Male Admissions
1,636
1,887
0
200
400
600
800
1,000
1,200
1,400
1,600
1,800
2,000
2006 2007 2008 2009 2010 2011 2012 2013 2014 2015
Female Admissions by Year
Admissions
Source: Louisiana Department of Corrections

28
Black Share of Prison Admissions Larger Than
Share of State Population
Admissions
White 42%
Black 58%
Hispanic 0%
Other 0%
Prison Admissions by Race, 2015
White 63%
Black 32%
Asian 2%
Other 3%
State Population by Race, 2015
Sources: US Census Bureau and Louisiana Department of Corrections

29
Majority of Female Prison Admissions Are White,
Majority of Males Are Black
Admissions
White 69%
Black 31%
Hispanic 0%
Other 0%
Female Admissions by Race, 2015
White 38%
Black 61%
Hispanic 1%
Other 0%
Male Admissions by Race, 2015
Source: Louisiana Department of Corrections

30
Pretrial Population
25-34 Year Olds Make Up Largest Share of Prison
Admissions
Admissions
18-24 19%
25-34 39%
35-44 24%
45-54 13%
55 or Older 5%
Admissions by Age Category, 2015
Source: Louisiana Department of Corrections

31
Pretrial Population
Number of Admissions 55 or Older Has More Than
Doubled in Last Decade
Admissions
348
857
0
100
200
300
400
500
600
700
800
900
2006 2007 2008 2009 2010 2011 2012 2013 2014 2015
Admissions 55 or Older by Year
Source: Louisiana Department of Corrections

32
Pretrial Population
86% of Prison Admissions Have A Nonviolent
Primary Offense
Admissions
Violent 14%
Drug 36%
Property 31%
Other 19%
Admissions by Primary Offense Type, 2015
Source: Louisiana Department of Corrections

33
Pretrial Population
81% of Prison Admissions Have No Violent
Offenses Associated with Current Admission
Violent Offense Associated w/
Current Admission 19%
Drug 35%
Property 29%
Other 17%
Admissions by Offense Type, 2015
Admissions
Source: Louisiana Department of Corrections

34
Pretrial Population
Over 80% of Drug, Property, Other Admissions Have
No Prior DOC Contacts with a Primary Violent Offense
55%
88% 86% 82%
45%
13% 15% 18%
0%
10%
20%
30%
40%
50%
60%
70%
80%
90%
100%
Violent OffenseAssociated w/ Current
Admission
Drug Property Other
Admissions by Offense Type by Prior DOC Contact Type, 2015
Prior DOC Contact w/ Primary Violent Offense
No Prior DOC Contact w/ Primary Violent Offense
Admissions
Source: Louisiana Department of Corrections

35
Pretrial Population
Revocations Make Up Majority of Admissions,
But Share Has Declined in Last Decade
Admissions
9,978 69%
10,300 9,658 59%
4,536 31%
7,312 6,755 41%
0
2,000
4,000
6,000
8,000
10,000
12,000
2006 2007 2008 2009 2010 2011 2012 2013 2014 2015
Admissions by Admission Type by Year
Revocation from Supervision Newly Sentenced Prisoner
Source: Louisiana Department of Corrections

36
Pretrial Population
Newly Sentenced Prison Admissions Up 49% in
Last Decade
Admissions: Newly Sentenced Prisoners
4,536
6,755
0
1,000
2,000
3,000
4,000
5,000
6,000
7,000
8,000
2006 2015
Newly Sentenced Prison Admissions, 2006 and 2015
Source: Louisiana Department of Corrections

37
Pretrial Population
Newly Sentenced Prison Admissions Up Across All
Offense Types
842
1,805
1,057
785
1,348
2,033
1,617 1,700
0
500
1,000
1,500
2,000
2,500
Violent Drug Property Other
Admissions by Offense Type, Newly Sentenced Prisoners, 2006 and 2015
2006 2015
13%
increase
117%
increase
53%
increase
Admissions: Newly Sentenced Prisoners
60%
increase
Source: Louisiana Department of Corrections

38
Pretrial Population
More Than Half of New Drug Sentences to Prison
Are for Possession
Admissions: Newly Sentenced Prisoners
Possession 53% Possession w/
Intent to Distribute
26%
Distribution 20%
Manufacture and Grow 1%
Drug Admissions by Offense Type, Newly Sentenced Prisoners, 2015
Source: Louisiana Department of Corrections

39
Pretrial Population
Top 10 Most Common Crimes at Admission for
Newly Sentenced Prisoners Are All Nonviolent
Top 10 Offenses at Admission in 2015, Newly Sentenced Prisoners
Offense 2006 2015 % Change, 2006-2015
POSSESSION OF SCHEDULE II DRUG 779 641 -18%
SIMPLE BURGLARY 278 466 68%
OPERATE VEHICLE WHILE INTOXICATED 218 380 74%
POSSESSION OF FIREARM BY FELON 102 308 202%
DISTRIBUTE SCHEDULE II DRUG 278 262 -6%
POSSESS WITH INTENT TO DISTRIBUTE SCHEDULE II DRUG 296 252 -15%
POSSESSION OF SCHEDULE I DRUG 100 245 145%
SIMPLE BURGLARY INHABITED DWELLING 83 216 160%
POSSESS WITH INTENT TO DISTRIBUTE SCHEDULE I DRUG 146 209 43%
SEX OFFENDER REGISTRATION VIOLATION 57 201 253%
Admissions: Newly Sentenced Prisoners
Source: Louisiana Department of Corrections

40
Pretrial Population
34% of Newly Sentenced Prisoners Have No Prior
DOC Contacts
Admissions: Newly Sentenced Prisoners
0 Priors 34%
1 Prior 16%
2 Priors 15%
3-5 Priors 26%
More than 5 Priors
9%
Admissions by Prior DOC Contacts, Newly Sentenced Prisoners, 2015
Source: Louisiana Department of Corrections

41
Pretrial Population
People Sentenced Under Habitual Offender Statute
Are a Small But Growing Share of Prison Admissions
157
365
0
50
100
150
200
250
300
350
400
450
500
2006 2007 2008 2009 2010 2011 2012 2013 2014 2015
Newly Sentenced Prisoners Convicted Under Habitual Offender Statute by Year
Admissions: Newly Sentenced Prisoners
Source: Louisiana Department of Corrections

42
Pretrial Population
Urban Centers Send Largest Number of Newly
Sentenced Prisoners to Prison
Admissions: Newly Sentenced Prisoners
Admissions by Parish of Conviction, Newly Sentenced Prisoners,
2015
Source: Louisiana Department of Corrections

43
Pretrial Population
Wide Variation in Admission Rate per 100,000
Residents Across Jurisdictions
Admissions: Newly Sentenced Prisoners
Admissions per 100,000 Residents by Parish of Conviction, Newly Sentenced
Prisoners, 2015
Source: Louisiana Department of Corrections

44
Pretrial Population
Revocations from Community Supervision to
Prison Flat over Last Decade
Admissions: Revocations
9,978 9,658
0
2,000
4,000
6,000
8,000
10,000
12,000
2006 2015
Revocations from Supervision, 2006 and 2015
Source: Louisiana Department of Corrections

45
Pretrial Population
Over 75% of Revocations Admitted to Prison Had
Underlying Drug or Property Offense
Admissions: Revocations
Source: Louisiana Department of Corrections
Violent 9%
Drug 41%
Property 35%
Other 15%
Revocations by Underlying Offense Type, 2015

46
Pretrial Population
Key Takeaways: Prison Admissions
• Prison admissions are up 8% in the last decade but have been
falling since 2012.
• Louisiana has the highest prison admission rate of surrounding
states with similar crime rates.
– 86% of prison admissions have a primary offense that is nonviolent.
• Newly sentenced prison admissions are up 49% in the last decade
with increases across all offense types.
– Drug possession is the most common crime at admission for newly
sentenced prisoners.
– All of the top ten most common offenses for newly sentenced prison
admissions are nonviolent.
• Revocations make up 59% of prison admissions.
Admissions

47
Break

48
TIME SERVED IN PRISON

49
Pretrial Population
Average Time Served in Prison Is Similar or Slightly
Lower Than States in Region with Similar Crime Rates
Time Served
2.9
3.2 3
3.2
2.5 2.3
1.9
2.8 2.7
0
0.5
1
1.5
2
2.5
3
3.5
Alabama Arkansas Florida Georgia Louisiana SouthCarolina
Tennessee Texas GroupAverage
Ye
ars
Average Time Served for All Prison Releases, 2009
Source: The Pew Charitable Trusts

50
Pretrial Population
Average Time Served in Prison Has Changed Little
in the Last Decade
Time Served
24.9 25
0
5
10
15
20
25
30
2006 2007 2008 2009 2010 2011 2012 2013 2014 2015
Mo
nth
s
Average Time Served by Year
Source: Louisiana Department of Corrections

51
Pretrial Population
Number of Releases with Shortest and Longest
Lengths of Stay Have Increased
Time Served
6,177 6,502
1,188 819
302
9,340
5,883
1,335 854
605
0
1,000
2,000
3,000
4,000
5,000
6,000
7,000
8,000
9,000
10,000
Less Than 1 Year 1-3 Years 4-5 Years 6-10 Years More Than 10Years
Releases by Time Served Category, 2006 and 2015
2006 2015
51%
increase
100%
increase
Source: Louisiana Department of Corrections
52
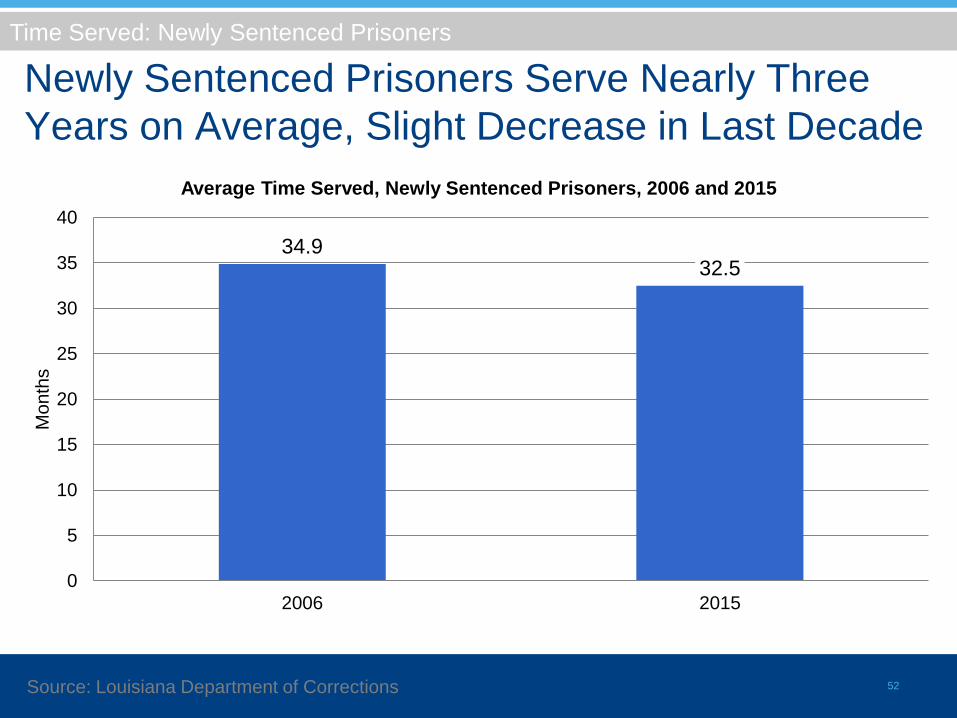
Pretrial Population
Newly Sentenced Prisoners Serve Nearly Three
Years on Average, Slight Decrease in Last Decade
34.9 32.5
0
5
10
15
20
25
30
35
40
2006 2015
Mo
nth
s
Average Time Served, Newly Sentenced Prisoners, 2006 and 2015
Time Served: Newly Sentenced Prisoners
Source: Louisiana Department of Corrections

53
Pretrial Population
Average Time Served Down for Drug, Property,
Other Offenses
Time Served: Newly Sentenced Prisoners
78.8
25.8 22.4 21.1
84.8
23.7 16.9
19.9
0
10
20
30
40
50
60
70
80
90
Violent Drug Property Other
Mo
nth
s
Average Time Served by Offense Type, Newly Sentenced Prisoners, 2006 and 2015
2006 2015
Source: Louisiana Department of Corrections

54
Pretrial Population
Time Served Climbing for Some Common Offenses
Time Served (Months) for 10 Most Common Offenses at Admission in 2015, Newly Sentenced Prisoners
Offense 2006 2015 % Change, 2006-2015
POSSESSION OF SCHEDULE II DRUG 17.9 16.8 -6%
SIMPLE BURGLARY 29.7 19.9 -33%
OPERATE VEHICLE WHILE INTOXICATED 6 11.3 88%
POSSESSION OF FIREARM BY FELON 35.9 30.6 -15%
DISTRIBUTE SCHEDULE II DRUG 32.3 35.3 9% POSSESS WITH INTENT TO DISTRIBUTE SCHEDULE II DRUG 29.6 35 18%
POSSESSION OF SCHEDULE I DRUG 28.1 17 -40%
SIMPLE BURGLARY INHABITED DWELLING 29.4 20.5 -30% POSSESS WITH INTENT TO DISTRIBUTE SCHEDULE I DRUG 30.9 24.7 -20%
SEX OFFENDER REGISTRATION VIOLATION 3.2 14 338%
Time Served: Newly Sentenced Prisoners
Source: Louisiana Department of Corrections

55
Pretrial Population
Revocations Serve Roughly a Year and a Half on
Average; Little Change in Last Decade
Time Served: Revocations
20.3 19.5
0
5
10
15
20
25
2006 2015
Mo
nth
s
Average Time Served, Revocations, 2006 and 2015
Source: Louisiana Department of Corrections

56
Proportion of Parole Releases Decreased Over
Last Decade
Time Served
Expiration of
Sentence 6%
Diminution of
Sentence 83%
Parole 8%
Other 3%
Releases by Release Type, 2006
Expiration of
Sentence 6%
Diminution of
Sentence 89%
Parole 2%
Other 3%
Releases by Release Type, 2015
Source: Louisiana Department of Corrections

57
Pretrial Population
75% of Releases Exit a Local Facility or
Transitional Work Program
Time Served
Local Facility 63%
Other 2%
Private Facility 4%
Reentry Center 3%
State Prison 16%
Transitional Work
Program 12%
Releases by Release Facility, 2015
Source: Louisiana Department of Corrections

58
Pretrial Population
Key Takeaways: Time Served
• On average, time served is decreasing for drug and
property offenses, though it is on the rise for some common
crimes.
• Newly sentenced prisoners serve longer on average than
revocations from community supervision.
• The majority of those released from prison are released
from a local facility.
Time Served

59
PRISON POPULATION

60
Pretrial Population
Imprisonment Rate Higher Than States in Region
With Similar Crime Rates
Prison Population
Source: Department of Justice, Bureau of Justice Statistics
633 599
513 517
816
429 437
584
0
100
200
300
400
500
600
700
800
900
Alabama Arkansas Florida Georgia Louisiana SouthCarolina
Tennessee Texas
Imprisonment Rate per 100,000 Residents, 2014

61
Pretrial Population
Prison Population Peaked at Roughly 40,000 in
2012; Down 9% in Last 3 Years
35,885
39,867
36,146
0
5,000
10,000
15,000
20,000
25,000
30,000
35,000
40,000
45,000
2006 2007 2008 2009 2010 2011 2012 2013 2014 2015
Prison Population by Year (December 31 Annual Snapshot)
Prison Population
Source: Louisiana Department of Corrections

62
Pretrial Population
Males Make Up 94% of Prison Population
Prison Population
Male 94%
Female 6%
Prison Population by Sex, 2015
Source: Louisiana Department of Corrections

63
Black Inmates Make Up Majority of Prison
Population
Prison Population
White 32%
Black 68%
Hispanic 0%
Other 0%
Prison Population by Race, 2015
White 63%
Black 32%
Asian 2%
Other 3%
State Population by Race, 2015
Sources: US Census Bureau and Louisiana Department of Corrections

64
Pretrial Population
12% of Inmates Are 55 or Older
Prison Population
Under 18 0%
18-24 11%
25-34 31%
35-44 27%
45-54 19%
55 or Older 12%
Prison Population by Age Category, 2015
Source: Louisiana Department of Corrections

65
Pretrial Population
One Quarter of Prisoners Have No Prior DOC
Contacts
0 Priors 25%
1 Prior 19%
2 Priors 17%
3-5 Priors 28%
More than 5 Priors 11%
Prison Population by Prior DOC Contacts, 2015
Prison Population
Source: Louisiana Department of Corrections

66
Pretrial Population
Revocations from Community Supervision Make
Up 43% of Prison Population
Prison Population
Source: Louisiana Department of Corrections
Newly Sentenced Prisoner
57%
Revocation from Supervision
43%
Prison Population by Admission Type, 2015

67
Pretrial Population
People Sentenced for Drug or Property Crimes
Make Up 40% of Prison Population
Violent 45%
Drug 24%
Property 16%
Other 15%
Prison Population by Offense Type, 2015
Prison Population
Source: Louisiana Department of Corrections

68
Pretrial Population
Inmates Convicted Under Habitual Offender
Statute Make Up 15% of Prison Population
Other 85%
Habitual Offender
15%
Prison Population by Habitual Offender Status, 2015
Prison Population
Source: Louisiana Department of Corrections

69
Pretrial Population
People Serving Life Sentences Make up 13% of
Prison Population
Prison Population
Other 87%
Life 13%
Prison Population by Sentence Type, 2015
Source: Louisiana Department of Corrections

70
Pretrial Population
Key Takeaways: Prison Population
• The prison population peaked in 2012 and has declined 9% in
the last three years.
– Despite the decline, Louisiana still has the highest imprisonment
rate of any state in the country.
• People serving time for drug or property crimes make up 40%
of the prison population.
• 43% of prisoners are revocations from community supervision.
Prison Population

71
TRENDS IN THE PRISON
POPULATION SINCE 2012

72
Pretrial Population
Prison Population Peaked in 2012 at Roughly
40,000
35,885
39,867
36,146
0
5,000
10,000
15,000
20,000
25,000
30,000
35,000
40,000
45,000
2006 2007 2008 2009 2010 2011 2012 2013 2014 2015
Prison Population by Year
Recent Trends
Source: Louisiana Department of Corrections

73
Pretrial Population
Prison Population Down 9% Since 2012
39,867
36,146
0
5,000
10,000
15,000
20,000
25,000
30,000
35,000
40,000
45,000
2012 2013 2014 2015
Prison Population by Year
Recent Trends
Source: Louisiana Department of Corrections

74
Pretrial Population
Prison Admissions Down 7% Since 2012
Recent Trends
17,684 16,504
0
2,000
4,000
6,000
8,000
10,000
12,000
14,000
16,000
18,000
20,000
2012 2013 2014 2015
Prison Admissions by Year
Source: Louisiana Department of Corrections

75
Pretrial Population
Declines in Admissions Across Most Offense
Types
2,515
6,699
5,208
3,091
2,252
5,972
5,001
3,155
0
1,000
2,000
3,000
4,000
5,000
6,000
7,000
8,000
Violent Drug Property Other
Admissions by Offense Type, 2012 and 2015
2012 2015
Recent Trends
Source: Louisiana Department of Corrections

76
Pretrial Population
Declines in Newly Sentenced Prisoners and
Revocations Admitted to Prison
7,312
10,061
6,755
9,658
0
2,000
4,000
6,000
8,000
10,000
12,000
Newly Sentenced Prisoner Revocation from Supervision
Admissions by Admission Type, 2012 and 2015
2012 2015
Recent Trends
Source: Louisiana Department of Corrections

77
Pretrial Population
Releases Have Increased 5% Since 2012, Now
Outpace Admissions
17,684
16,504 17,097
18,023
0
2,000
4,000
6,000
8,000
10,000
12,000
14,000
16,000
18,000
20,000
2012 2013 2014 2015
Admissions and Releases by Year
Admissions Releases
Recent Trends
Source: Louisiana Department of Corrections

78
Pretrial Population
Key Takeaways: Recent Trends
• The prison population has declined 9% since 2012.
• The decline is driven by a combination of decreasing
admissions and increasing releases.
– Declining admissions across both revocations and newly
sentenced prisoners.
Recent Trends

79
SUMMARY

80
Pretrial Population
Summary of Takeaways
• Admissions:
– Prison admissions are up 8% in the last decade but have been
falling since 2012.
– Louisiana has the highest prison admission rate among surrounding
states with similar crime rates.
• 86% of prison admissions have a primary offense that is nonviolent.
– Newly sentenced prison admissions are up 49% in the last decade
with increases across all offense types.
• Drug possession is the most common crime at admission for newly
sentenced prisoners.
• All of the top ten most common offenses for newly sentenced prison
admissions are nonviolent.
– Revocations make up 59% of prison admissions.
Summary

81
Pretrial Population
Summary of Takeaways
• Time Served:
– On average, time served is decreasing for drug and property
offenses, though it is on the rise for some common crimes.
– Newly sentenced prisoners serve longer on average than
revocations from community supervision.
– The majority of those released from prison are released from a local
facility.
Summary

82
Pretrial Population
Summary of Takeaways
• Prison Population:
– The prison population peaked in 2012 and has declined 9% in the
last three years, driven by decreasing admissions and increasing
releases.
• Despite the decline, Louisiana still has the highest imprisonment rate of
any state in the country.
– People serving time for drug or property crimes make up 40% of the
prison population.
– 43% of prisoners are revocations from community supervision.
Summary

83
Questions?

84
Pretrial Population
Contact Information
• Laura Bennett
– Office: (202) 552-2028
– Email: [email protected]
• Public Safety Performance Project
– www.pewtrusts.org/publicsafety
Summary