Louis Armstrong New Orleans International Airport (MSY ......Dec 24, 2014 · jet bridges, MSY has...
28
Louis Armstrong New Orleans International Airport (MSY) Airline Competition Plan Update No. 1 _____________________________________________ Submitted to: Federal Aviation Administration As required by: The Wendell H. Ford Aviation Investment & Reform Act for the 21st Century Pub. L. 106-181, Section 155 Submitted: December 24, 2014
Transcript of Louis Armstrong New Orleans International Airport (MSY ......Dec 24, 2014 · jet bridges, MSY has...

Louis Armstrong New Orleans International Airport (MSY)
Airline Competition Plan Update No. 1
_____________________________________________
Submitted to:
Federal Aviation Administration
As required by:
The Wendell H. Ford Aviation Investment & Reform Act for the 21st Century
Pub. L. 106-181, Section 155
Submitted:
December 24, 2014

Page | 2
TABLE OF CONTENTS
OVERVIEW ................................................................................................................................................. 3
AVAILABILITY OF GATES AND RELATED FACILITIES ................................................................... 5
LEASING AND SUBLEASING ARRANGEMENTS .............................................................................. 10
PATTERNS OF AIR SERVICE ................................................................................................................. 11
GATE ASSIGNMENT POLICY ................................................................................................................ 12
GATE USE REQUIREMENTS.................................................................................................................. 13
FINANCIAL CONSTRAINTS................................................................................................................... 14
AIRPORT CONTROLS OVER AIRSIDE AND GROUNDSIDE CAPACITY…………..……………..14
AIRPORT INTENTIONS TO BUILD OR ACQUIRE GATES TO BE USED AS COMMON
FACILITIES ............................................................................................................................................... 15
AIRFARE COMPARISON ........................................................................................................................ 16
SUMMARY ................................................................................................................................................ 28

Page | 3
OVERVIEW
On February 15, 2013, Louis Armstrong New Orleans International Airport (“MSY”) submitted
its Airline Competition Plan (“Plan”) in accordance with the Wendell H. Ford Aviation
Investment and Reform Act for the 21st Century (“AR-21”), Section 155, and applicable Federal
Aviation Administration (“FAA”) Program Guidance. MSY received approval for the initial Plan
on June 28, 2013 from the FAA. In accordance with 49 USC § 47107(a)(15), the Plan was made
available to the public by posting on MSY’s website under “Public Notice Advertisement.”
Below is a direct link to the posting:
http://www.flymsy.com/Files/Publications/MSY_Airline_Competition_Plan_2013.pdf
MSY prepared this first update to its approved Plan to provide updated information about MSY,
its physical properties, use of facilities and explains how airport management continues its
commitment and actions to provide new entrant access and expansion by incumbent carriers.
MSY is identified by the FAA as a medium hub airport. MSY now hosts thirteen (13) air carriers
and two (2) all-cargo carriers (December 2014). There are currently 45 nonstop destinations
available for booking from MSY. MSY fosters and strongly encourages airline competition and
accommodates new entrant carriers. No one carrier dominates the market; however, Southwest
Airlines and Delta Air Lines enplanements accounted for 62.9% in 2013. In the past four years,
MSY has seen eight (8) new carriers announce service.
MSY has approximately 1.2 million square feet of terminal space, with four (4) concourses.
There are a total of forty-two (42) gates, including six (6) on Concourse C with direct Federal
Inspection Service (FIS) access. In 2010, Concourse A closed, but the concourse has been
maintained and can be reactivated for commercial air service. The following is a breakdown of
the number of gates and airlines operating in each concourse:
Concourse A Concourse B Concourse C Concourse D
6 gates 10 gates 14 gates 12 gates
(currently vacant) AirTran American Delta
Southwest Frontier United
JetBlue Air Canada
Spirit
US Airways
Alaska
Allegiant
(2/2015)

Page | 4
The average number of daily departures (1H2014) is approximately 137. There are no slot
restrictions, curfews or other constraints on air operations.
MSY policies provide a fertile environment for airline competition. Since 2010, MSY has
significantly decreased its cost per enplanement (CPE) paid by the airlines. Just as other
airports, MSY offers incentives consistent with Federal law and FAA policies to attract new
airlines and to encourage incumbent airline growth to new destinations.
The following factors demonstrate the lack of barriers to new entrant and incumbent airlines
desiring growth at MSY:
A. The lack of barriers:
No slot restrictions.
No significant aircraft delays.
Declining airline costs per enplanement.
B. Airport space available:
Thirty-two (32) agent positions and multiple options for offices.
Thirteen (13) jet bridges and hold rooms are non-preferential, available for lease by
airlines, not including seven gates with no jet bridges currently in place.
C. Significant level of existing competition:
Approximately 46.5% (Year Ending December, 2013) of capacity operated by low-
cost carriers, projected to increase to 48.5% in 1Q2015.
Consistently lower fares than the national average (Compared to top 100 passenger
markets, BTS.gov).
D. No complaints received from incumbent or new entrant carriers regarding denial of space
prior to filing this Plan Update. Most recently, Spirit Airlines, Alaska Airlines,
PEOPLExpress and Allegiant Air were provided the option of several gates and hold
rooms with access to Federal Inspection Services (FIS), ticket counters, and office space.

Page | 5
AVAILABILITY OF GATES AND RELATED FACILITIES
A. Number of gates available at MSY by lease arrangement
MSY has four (4) concourses with a total of forty-two (42) gates. Thirty-five (35) gates
(Concourses B, C and D) have passenger jet bridges and six (6) gates on Concourse A and one
(1) gate on Concourse B do not have passenger jet bridges. While the seven gates do not have
jet bridges, MSY has an approved PFC project to acquire jet bridges; and, if so acquired for any
of these seven gates, they would only be leased on a preferential use or common use basis.
As of December 2014, the allocation of the gates is as follows:
1. Fifteen (15) gates with MSY-owned jet bridges are under preferential leases to
signatory airlines. Since approval of the Plan, the following changes in gate use has
occurred:
a. U.S. Airways has consolidated operations with American in Concourse C. The
new American (combined operations) now leases a total of five (5) gates.
b. Southwest Airlines has begun leasing one additional gate on Concourse B
(Gate B2), where they also RON.
2. Seven (7) gates are under preferential leases to signatory airlines that also own the
associated jet bridge on the particular leased gate(s).
3. Three (3) gates with MSY-owned jet bridges are under a common use (non-signatory)
lease with airlines. Since MSY’s approval of its Airline Competition Plan, C8 has
been recaptured and used on a common-use, per turn basis. In February 2015,
Allegiant Air will begin its operations at MSY using a common-use gate, raising this
to a total of four (4) gates used on a common use basis.
a. Frontier Airlines has been relying on a common use gate since June 2010,
averaging less than two average daily flights. The use of this common use
gate has not created an impediment to the Frontier Airlines schedule.
b. Air Canada has been relying on United’s leased gate since October 2010,
averaging one daily flight. The shared gate has not created an impediment to
the Air Canada schedule.
c. Spirit Airlines continues to use a common use gate, and has grown its
operations from one (1) daily flight to five (5) daily flights. Spirit Airlines
recently expressed interest in becoming a signatory airline and preferentially
leasing a gate.
4. Thirteen (13) gates with Airport-owned jet bridges are available for use or lease
(either on a common use or preferential use basis) by airlines. As noted in 3 above,

Page | 6
three (3) of these gates on Concourse C are being used on a common use basis by
non-signatory airlines (Spirit, Alaska and Frontier Airlines) and one is being used on
a “per turn” basis by American Airlines. Beginning February 2015, one gate on
Concourse C will be used on a common use basis by the non-signatory airline,
Allegiant Air. The two (2) common use gates on Concourse D are being used on a
“per turn” basis, one by Delta Air Lines and one by United Airlines.
5. Six (6) gates without jet bridges on Concourse A and one (1) on Concourse B are
available for use or lease by airlines.
Below is a depiction of the gates at MSY as of November 2014. The jet bridges highlighted in
green are MSY’s common-use gates. Those gates identified with MSY’s “fleur de lis” logo are
gates that are not leased or used by any airline.
B. Gate-use monitoring policy
MSY Operations Department is staffed with no less than one (1) Operations Supervisor
24-hours a day / 365-days a year. The Operations Supervisors monitor use of the thirteen
(13) gates with jet bridges that are not leased to any airline as well as the common use
gates leased to non-signatory airlines. The Operations Supervisors have the authority to
permit use of any of these available gates at the request of any carrier on a first come,
first serve basis. In addition, Operations Supervisors are charged with implementation of
the US Department of Transportation approved MSY Emergency Contingency Plan for

Page | 7
irregular operations. As of the submission of this Plan Update, MSY has been able to
accommodate all airline requests for additional gates, including charters, airline RONs
and diverted aircraft. In addition, MSY is able to accommodate any request by a potential
new entrant airline seeking gate space. MSY will consider a plan to monitor leased gates
in the event that MSY gate capacity becomes constrained.
C. Differences, if any, between gate-use monitoring policy at PFC-financed facilities,
facilities subject to PFC assurance #7, and other gates.
No change since the last Plan approval.
D. Description of the process for accommodating new service and for service by a new
entrant.
New service through an incumbent carrier is accommodated through a gate already leased
or assigned on a common-use basis. If an additional gate is required then one will be
assigned on a vacant gate of their choice. A new entrant carrier is provided a walk-
through of the terminal and any vacant space may be chosen accordingly, including
ticketing, office, and gate space. Incentives are also available for new non-stops and new
entrant carriers. The Airport uses objective standards by recognizing the flight
requirements of any requesting Airline. There are thirteen (13) vacant gates with jet
bridges available for lease (common use or preferential use) or use on a per turn basis,
five (5) of which can accommodate International flights, including three (3) capable of
wide-body aircraft. If in the unlikely event the Airport has no available gates for the
requesting Airline, the following objective standards used include, but are not limited to:
international flight requirements and Customs, TSA screening, aircraft wing span and
height requirements, fueling requirements, scheduling, ground equipment required for
specific aircraft type, personnel training, and alliance and code sharing synergies. The
Airport Operations Department will identify these and allocate a gate accordingly.
E. Has the PFC competitive assurance #7 operated to convert previously exclusive
gates to preferential-use gates or has it caused such gates to become available to
other users?
No change since the last Plan approval.
F. Gate Utilization (departures/gate) per week and month
In December 2014, approximately 1,046 flights per week were scheduled to depart from
MSY. With 28 of the available 42 gates being used on a daily basis, airport-wide
utilization per gate in December 2014 was 37 flights per week and 149 per month. The
following table below shows the full year average for gate utilization by operating carrier
in 2013.

Page | 8
Full Year Ending December 2013 Gate Utilization
AirlineNumber of
Departures
Number of
Gates1
Daily Turns
per gate
Endeavor Air 1,257
Compass Airlines Inc. 294
Delta Air Lines 6,628
ExpressJet Airlines 530
SkyWest Airlines 194
Chautauqua Airlines Inc. 69
Shuttle America 5
Combined Operations 8,977 6 4.1
Frontier Airlines 372
Republic Airline 1
Combined Operations 373 1 1.0
ExpressJet Airlines 1,719
GoJet Airlines LLC 687
SkyWest Airlines 457
Chautauqua Airlines Inc. 198
Shuttle America 886
United Airlines 5,059
Mesa Airlines 4
Jazz Air 339
Combined Operations 9,349 6 4.3
PSA 3
US Airways 2,416
Mesa Airlines 247
Republic Airline 2,507
Air Wisconsin Airlines 4
American Airlines 3,696
Envoy Air Inc 635
Republic Airline 455
Combined Operations 9,963 6 4.5
AirTran Airways 1,833
Southwest Airlines 16,867
Combined Operations 18,700 6 9
JetBlue Airways 1,437 1 3.94
Spirit Airlines 342 1 0.94
TOTAL MSY 49,480 27 2
5
1American
, Delta, and United utilize one gate on a per turn basis
2Alaska Airlines began service June 2014, not included in Full Year 2013 statistics
Source: Diio Mi, New Orleans Aviation Board

Page | 9
G. Number of carriers in the past year that have requested access or sought to expand,
how they were accommodated, and the length of time between any requests and
access
Since FAA approval of the Plan, Alaska Airlines has begun nonstop service to Seattle,
WA, the longest transcontinental nonstop currently scheduled from MSY. Southwest has
expanded options to include new non-stops to Austin, TX, San Diego, CA, San Antonio,
TX, Oakland, CA and Washington, D.C. Spirit Airlines expanded service to include
nonstop service to Chicago, IL, Dallas, TX, Detroit, MI, Ft. Lauderdale, FL and Houston,
TX. A startup airline, PEOPLExpress began the first nonstop service between MSY and
Newport News/Williamsburg, VA in August 2014. VacationExpress has added an
international nonstop to Punta Cana, Dominican Republic and expanded the frequency of
Cancun, Mexico from one weekly to three weekly for the upcoming year. Delta Air Lines
has also implemented a weekly nonstop to Cancun, Mexico with once weekly service
starting in February 2015. Similarly, United Airlines will be launching a weekly nonstop
route to Cancun, Mexico starting in May 2015. Ultra low-cost carrier Allegiant Air had a
major announcement in November 2014 announcing nonstop service to four destinations,
including Indianapolis, IN, Columbus-Rickenbacker, OH, Orlando-Sanford, FL and
Cincinnati, OH. We have been able to immediately accommodate each airline that has
requested terminal space and gates upon their request.
H. Description of process to resolve any access complaints by a new entrant or an air
carrier seeking to expand service
No change since the last Plan approval.
I. Use/lose or use/share policies for gates and other facilities
No change since the last Plan approval.
J. Policy regarding “recapturing” gates that are not being fully used
No change since the last Plan approval.
K. Plans to make gates and related facilities available to new entrant air carriers that
want to expand service at MSY; methods of accommodating new gate demand by
air carriers at MSY (common-use, preferential-use, or exclusive-use gates); and
length of time between when an air carrier initially contacts MSY and could begin
operations
MSY actively pursues new entrant airlines and can adequately accommodate the needs of
new and existing carriers. In February 2014, Alaska Airlines was a new entrant carrier
seeking a common-use gate for their daily flight to Seattle, WA. Alaska was provided
several options for gate, ticketing counters, and office spaces for their operation.
PEOPLExpress was offered multiple options. Allegiant Air will take advantage of an
office and common-use ticket counters when they commence operations in February
2015.

Page | 10
L. Availability of an airport competitive access liaison to assist requesting carriers,
including new entrants
MSY has dedicated staff to market and promote air service and present business cases to
key airline planners, including familiarizing new carriers with MSY, terminal space
availability and ensuring incumbent and new entrants are aware of promotional
incentives. Any concerns regarding access should be reported to the Air Service
Manager, Business Development Officer or the Deputy Director and Chief Operations
Officer.
M. Number of aircraft remain overnight (RON) positions available at the airport by
lease arrangement, i.e. exclusive, preferential, common-use or unassigned, and
distribution by carrier. Describe procedures for monitoring and assigning RON
positions and for communicating availability of RON positions to users.
No change since the last Plan approval.
1.) Procedures for Assigning and Communicating Available RON Positions
No change since the last Plan approval.
2.) Monitoring Procedures
No change since the last Plan approval.
LEASING AND SUBLEASING ARRANGEMENTS
A. Is a subleasing agreement with an incumbent carrier necessary to obtain access?
No change since the last Plan approval.
B. How MSY assists requesting airlines obtain a sublease?
No change since the last Plan approval.
C. Airport policies regarding sublease fees (e.g., no more than 15 percent above the
standard airport-determined fee).
No change since the last Plan approval.
D. Airport oversight policies for sublease fees and ground handling arrangements.
Under the Airline-Airport Use and Lease Agreement, Airlines must request permission
from the Director of Aviation to sublease their preferential areas. Included in the request,
a copy of the proposed sublease agreement and rental fees are sent for review by MSY.

Page | 11
MSY will use best efforts to negotiate inclusion of fee limitation language in its next
Airline Airport Use and Lease Agreement. To date, we have not had an airline raise
concerns about sublease fees. If we were to receive such notification, we would review
the fees being charged and interject accordingly, if necessary, to amicably resolve the
matter.
E. Are formal arrangements in place to resolve disputes among air carriers regarding
the use of airport facilities?
In addition to direct one-on-one communication with the airlines, MSY sponsors an
Airport-Airline Affairs Committee (“AAAC”) as a primary vehicle for airlines to resolve
any disputes in regard to airport facilities. MSY hosts airline station managers meetings
as an additional means to identify any issues or concerns in regard to use of MSY
facilities. MSY is considering development of a formal procedure to resolve disputes
among air carriers, as we are committed to eliminating any impediments to competition.
F. How complaints by subtenants about excessive sublease fees or unneeded bundling
of services are resolved?
No change since the last Plan approval.
G. How independent contractors who want to provide ground handling, maintenance,
fueling, catering or other support services but have been unable to establish a
presence at MSY are accommodated?
Signatory air carriers may perform aircraft handling and servicing with their own
employees or by contracting for their services directly with a ground handling company
of their choice. In addition, MSY has eight independent and contractible companies on-
site to provide on-call ground handling. Alaska Airlines and PEOPLExpress expressed
interest in ground handlers not currently providing services at MSY. The Airport worked
with Menzie’s Aviation and QuickFlight Services to obtain Board approval for ground
handling permits so they may conduct business at MSY. A ground handler wishing to
conduct business at the Airport will contact the Manager of Properties to obtain
information on insurance requirements and vacant terminal spaces.
H. Copies of lease and use agreements in effect.
No change since the last Plan approval.
PATTERNS OF AIR SERVICE
A. Number of Markets Served
As of December 2014, MSY has nonstop service to 42 domestic and 3 international
destinations.
B. Nonstop Markets and Flight frequency

Page | 12
CY 2013-2014 (including announcements for 2015 service)
GATE ASSIGNMENT POLICY
A. Gate assignment policy and method of informing existing carriers and new entrants
of this policy. This would include standards and guidelines for gate usage and
leasing, such as security deposits, minimum usage, if any, fees, terms, master
agreements, signatory and non-signatory requirements.
Each airline considering service at MSY is provided a presentation, including a hard copy
entailing general airport information, gates available preferential or common use,
contacts for on-site ground handlers, rates and charges, and signage requirements.
Incumbent carriers have either preferential or common use gates. With thirteen available
common-use gates with jet bridges, requests are accommodated on a first come, first
serve basis.
B. Methods for announcing to tenant carriers when gates become available.
No change since the last Plan approval.
C. How announcements are made to tenant air carriers when gates become available.
Do all tenant air carriers receive information on gate availability and terms and
conditions by the same process at the same time?
No change since the last Plan approval.
D. New policies that have been adopted or actions that have been taken to ensure that
new entrant carriers have reasonable access to MSY and that incumbent carriers
can expand their operations.
There are currently thirteen (13) available gates with jet bridges available for incumbent
or new entrant carriers. There are seven (7) available gates on Concourse A with no jet
bridges that can be activated if additional space is needed by any carrier, new or existing.
Domestic International
Number of markets served nonstop 42 3
Average number of flights per day 134 1
Number of markets served by low-cost carriers 27
Number of markets served by one carrier 25 1
Number of new markets in 2013-2014 12 2
Number of previously served markets dropped since filing 5 1

Page | 13
Airport staff closely monitors gate utilization and availability in order to accommodate all
requests.
GATE USE REQUIREMENTS
A. Gate use monitoring policy, including schedules for monitoring, basis for
monitoring activity (i.e., airline schedules flight information display systems, etc.),
and the process for distributing the product to interested carriers.
MSY Operations staff monitors gates on a daily basis with information from the airline
station managers, handlers and their daily observations. If capacity were to become
constrained, Operations staff would also utilize daily flight schedules. Tenants must
request permission prior to use and staff assigns gates accordingly on a first come first
serve basis.
B. Requirements for signatory status and identity of signatory carriers.
No change since the last Plan approval.
C. Where applicable, minimum use requirements for leases (i.e., frequency of
operations, number of seats, etc.).
Currently, to become Signatory an Air Transportation Company must provide passenger
service with at least two daily departures, lease at least 2,500 square feet of terminal
space, and execute an agreement with MSY. MSY is negotiating the terms of a new Use
and Lease Agreement with the airlines. In principal, MSY and the airlines have agreed to
include an increased utilization requirement provision (as recommended by the FAA in
its 2013 Plan approval) to a minimum of four (4) scheduled turns per day for each
preferential gate.
D. The priorities, if any, employed to determine carriers that will be accommodated
through forced sharing or sub-leasing arrangements. Describe how these priorities
are communicated to interested carriers.
No change since the last Plan approval.
E. Justifications for any differences in gate use requirements among tenants.
No change since the last Plan approval.
F. Usage policies for common-use gates, including where applicable, a description of
priorities for use of common-use gates. Explain how these priorities are
communicated to interested carriers.
No change since the last Plan approval.

Page | 14
G. Methods for calculating rental rates or fees for leased and common-use space.
Where applicable, provide an explanation of the basis for disparities in rental fees
for common-use versus leased gates.
No change since the last Plan approval.
FINANCIAL CONSTRAINTS
A. The major source of revenue at MSY for terminal projects.
No change since the last Plan approval.
B. Rates and charges methodology (residual, compensatory, or hybrid).
No change since the last Plan approval.
C. Past use, if any, of PFC’s for gates and related terminal projects.
No change since the last Plan approval.
D. Availability of discretionary income for airport capital improvements.
No change since the last Plan approval.
AIRPORT CONTROLS OVER AIRSIDE AND GROUNDSIDE
CAPACITY
A. Majority-in-interest (MII) or “no further rates and charges” clauses covering
groundside and airside projects
The current Airport-Airline Use and Lease Agreements contain a Majority-in-interest
(MII) provision.
B. List capital construction projects that have been delayed or prevented because an
MII was invoked
None.
C. Plans to modify existing MII agreements
The existing Use and Lease Agreement with the airlines will be extended for a period of
one year to expire December 31, 2015. This extension is necessary to complete the
negotiations of the terms of a new Use and Lease Agreement with the airlines. In

Page | 15
principal, MSY and the airlines have agreed to a modified MII provision that will not
interfere with MSY’s approved Plan and will be consistent with the FAA’s intent and
guidance provided to MSY in connection with the 2013 approval of the Plan. Further, it
was agreed in principal that MII will not be required for any airport project less than $3
million in any one year and not to exceed a total $10 million for projects over any five
year period.
AIRPORT INTENTIONS TO BUILD OR ACQUIRE GATES TO
BE USED AS COMMON FACILITIES
A. The number of common-use gates available at MSY today.
Thirteen gates with jet bridges are available for common-use or preferential leasing.
B. The number of common-use gates MSY intends to build or acquire and timeline.
Intended financing.
The New Orleans Aviation Board is in the “design development” phase for a new
terminal replacement facility that is planned to open in 2018. The new “North Terminal”
is a $650 million project that will include an approximate 650,000 square foot terminal
containing two (2) concourses, Federal Inspection Service (FIS) and thirty (30) gates, and
such other associated terminal facilities. As part of the planning efforts, there is identified
space to allow for an expansion of the terminal to accommodate twelve (12) additional
gates (for a total of forty-two (42) gates). All aspects of this project have been
thoroughly coordinated with all stakeholders, including the airlines, FAA, U.S.
Transportation Security Administration, U.S. Customs and Border Patrol. The sources of
funding include FAA Airport Improvement Program grants, TSA grants, Louisiana State
Aviation Trust Fund grants, PFC collections, and General Airport Revenue Bonds.
C. Are any air carriers that have been serving MSY for more than three years relying
exclusively on common use gates?
Frontier has been using a common-use gate since 2010 with their low frequency seasonal
nonstop flight to Denver, Colorado. The use of this gate has not impeded growth plans
and allows for MSY to maintain service by Frontier by using a common use gate for their
seasonal service.
D. Whether common-use gates will be constructed in conjunction with gates leased
through exclusive or preferential-use arrangements.
The North Terminal will have 30 gates in 2018. There will be a combination of common
use and airline preferential leased gates, with the exact numbers determined when the
design is complete.

Page | 16
E. Whether gates being used for international service are available for domestic
service.
No change since the last Plan approval.
F. Do air carriers that only serve domestic markets now operate from international
gates?
No change since the last Plan approval.
AIRFARE COMPARISON Average airfares cannot be directly compared to each other at a single airport due to the
differences in stage length, or miles flown, by each passenger. Therefore, it is appropriate to
compare the airfare on a miles flown basis in order to truly understand the differences between
the carrier fares at MSY.
When compared on a per mile basis, it is clear that there is an excellent competitive balance at
MSY among the incumbent air carriers. The range, between 8.49 – 20.69 cents for Calendar
Year (“CY”) 2013, is an acceptable range which encourages healthy competition among the
carriers. For example, United Airlines captured approximately 16% of the passenger share at
MSY in CY 2013, but its average ticket yield is in the middle of the range at 18.83 cents.
Southwest Airlines, whose average fare is among the lowest of the incumbent carriers at MSY at
$173.31, has the highest ticket yield of 20.69 cents. This is due to the fact that the average ticket
miles flown for a Southwest passenger at MSY are the lowest of all carriers, at 838 miles.
Therefore, when the fare is adjusted on a per mile basis the result is the highest ticket yield, but
still quite competitive.
MSY welcomed the entrance of Spirit Airlines into the air service picture in January 2013. This
is another positive development for competitive balance at MSY, as Spirit Airlines “ultra-low
cost carrier” strategy is one that stimulates demand based on low fares, thereby forcing other
legacy and low cost carriers to compete for these price conscious passengers. As the table
indicates, Spirit’s ticket yield, 8.49 cents, was indeed the lowest during CY 2013 at MSY. In CY
2015, MSY will welcome another ultra-low cost carrier, Allegiant Air, which will further
enhance the competitive balance at MSY.
MSY Ticket Yield by Carrier Comparison CY 2013

Page | 17
Source: Aviation DataMiner™ analysis of DOT/BTS O&D Survey
MSY Airfares vs. Comparison Airports
MSY ranked #37 in overall enplanements during CY 2013, a 6.6% increase over CY 2012.
Based on the current ranking of MSY, airports that generated similar levels of enplanements for
CY 2013 have been compared to MSY for the purposes of the airfare comparison. The airports
chosen for this comparison are as follows:
Kansas City International Airport (MCI)
Raleigh-Durham International Airport (RDU)
Pittsburgh International Airport (PIT)
Source: http://www.faa.gov/airports/planning_capacity/passenger_allcargo_stats/passenger/
When comparing the ticket yield trends at MSY to its similar sized peer airports over the last
three years, it is evident that the air carriers at MSY operate in a very competitive and fair
environment. When compared to similar sized airports (MCI, RDU, and PIT), MSY had the
lowest percent increase in year-over-year yield increase between 2013 and 2012. Furthermore,
the average yield of 19.39 cents in CY 2013 is very competitive with the peer airports.
8.49¢
12.73¢
16.74¢17.59¢
18.72¢ 18.83¢ 19.35¢20.29¢ 20.69¢
0.00¢
5.00¢
10.00¢
15.00¢
20.00¢
25.00¢
NK F9 B6 FL AA UA DL US WN
Ticket Yield
RankFAA
RegionState Locid City Airport Name
Arpt
CategoryHub
CY 13
Enplanements
CY 12
Enplanements
%
Change
35 CE MO MCI Kansas City Kansas City International P M 4,836,221 4,866,850 -0.6%
37 SW LA MSY Metairie Louis Armstrong New Orleans International P M 4,576,539 4,293,624 6.6%
39 SO NC RDU Raleigh Raleigh-Durham International P M 4,482,016 4,490,374 -0.2%
46 EA PA PIT Pittsburgh Pittsburgh International P M 3,812,460 3,892,338 -2.1%

Page | 18
MSY vs. Similar Sized Airports Ticket Yield Trend Three Year Trend: 2011 – 2013
Source: Aviation DataMiner™ analysis of DOT/BTS O&D Survey
MSY Top 25 O&D Markets: Yield/Airfare Comparison
In addition to analyzing the overall yields at MSY versus the similar sized airports, it is
instructive to examine the yields in the MSY Top 25 Origination and Destination (“O&D”)
markets as compared to the same markets at the comparison airports. As is shown in the table
below, MSY has very competitive yields to its Top 25 O&D markets compared to MCI, RDU,
and PIT.
Airport CY 2011 CY 2012 CY 2013
12 vs '11
YOY %
Increase
13 vs '12
YOY %
Increase
MSY 17.29¢ 18.96¢ 19.39¢ 9.7% 2.3%
MCI 17.15¢ 17.97¢ 19.08¢ 4.8% 6.2%
RDU 18.05¢ 19.02¢ 19.54¢ 5.4% 2.7%
PIT 16.83¢ 18.24¢ 19.20¢ 8.4% 5.3%

Page | 19 R
an
kM
ark
et
Ps
gr
Ne
t O
W
Fa
re
Tic
ke
t
Yie
ldM
ark
et
Ps
gr
Ne
t O
W
Fa
re
Tic
ke
t
Yie
ldM
ark
et
Ps
gr
Ne
t O
W
Fa
re
Tic
ke
t
Yie
ldM
ark
et
Ps
gr
Ne
t O
W
Fa
re
Tic
ke
t
Yie
ld
1HOU380,032$153.81
50.82¢
HOU130,239$197.22
28.93¢
HOU
65,307$208.18
19.27¢
HOU
56,584$201.72
16.66¢
2ATL341,364$139.77
32.23¢
ATL289,661$170.59
23.71¢
ATL
398,605$135.03
37.75¢
ATL292,677$160.89
29.81¢
3LAX
320,047$258.98
14.95¢
LAX
265,393$200.37
14.17¢
LAX
239,823$221.18
9.76¢
LAX
165,449$270.79
12.08¢
4LGA
293,444$189.07
15.36¢
LGA
189,049$268.87
23.02¢
LGA
479,321$143.25
32.29¢
LGA
281,173$211.04
62.80¢
5DAL284,734$138.76
31.45¢
DAL240,242$151.95
32.80¢
DAL
29,694$174.11
14.14¢
DAL
12,380$202.94
15.99¢
6DEN
247,740$159.43
14.47¢
DEN
462,776$113.69
21.11¢
DEN
183,843$200.02
12.92¢
DEN
163,900$235.05
17.16¢
7IAH
238,987$173.68
56.79¢
IAH
80,719$251.59
37.50¢
IAH
87,536$245.88
23.13¢
IAH
178,849$291.08
25.03¢
8MCO
237,250$157.10
25.76¢
MCO
271,731$177.60
15.66¢
MCO
271,373$131.21
23.35¢
MCO
419,985$140.95
16.45¢
9BWI235,675$190.88
18.32¢
BWI160,455$189.52
18.69¢
BWI206,336$130.32
50.77¢
BWI
68,608$125.30
57.46¢
10
JFK
233,321$199.70
16.80¢
JFK
20,527$244.38
20.09¢
JFK
237,007$130.81
30.20¢
JFK
63,191$170.32
48.39¢
11
EWR218,137$207.17
17.08¢
EWR125,091$281.27
24.83¢
EWR
153,589$221.35
47.83¢
EWR112,464$260.04
79.11¢
12
DFW
210,156$110.06
24.24¢
DFW
182,158$148.66
31.81¢
DFW
191,942$230.64
21.40¢
DFW
194,427$232.96
20.61¢
13
DCA
198,993$226.96
22.75¢
DCA
202,687$163.19
16.51¢
DCA
120,050$215.12
93.84¢
DCA
50,245$161.62
78.04¢
14
PHL192,994$202.26
17.40¢
PHL160,330$188.08
16.86¢
PHL
236,807$175.82
51.47¢
PHL163,593$242.62
87.74¢
15
TPA
181,137$142.18
26.22¢
TPA
140,581$195.45
17.27¢
TPA
178,325$149.99
24.24¢
TPA
269,540$142.07
15.72¢
16
BOS179,528$199.25
13.68¢
BOS146,818$202.48
15.34¢
BOS
417,898$140.00
22.50¢
BOS332,086$125.43
24.84¢
17
SFO
177,310$283.11
14.06¢
SFO
135,528$238.28
15.17¢
SFO
188,893$286.39
11.60¢
SFO
147,095$287.25
12.02¢
18
LAS
158,561$210.55
13.27¢
LAS
285,298$178.68
14.96¢
LAS
148,718$222.73
10.53¢
LAS
255,797$189.09
9.43¢
19
ORD154,904$230.39
24.52¢
ORD232,355$158.06
38.67¢
ORD
276,047$177.24
26.33¢
ORD
228,174$161.41
37.87¢
20
MDW
151,430$190.76
22.27¢
MDW
337,962$141.65
34.63¢
MDW
166,136$147.85
22.31¢
MDW
187,476$132.72
32.92¢
21
BNA
148,807$138.15
27.78¢
BNA
144,860$135.17
25.60¢
BNA
193,887$121.76
26.38¢
BNA
60,474$160.60
23.46¢
22
FLL
131,711$173.60
22.58¢
FLL
166,118$163.31
12.23¢
FLL
184,700$127.29
16.56¢
FLL
192,090$153.86
14.80¢
23
MIA
126,069$178.38
24.85¢
MIA
37,340$201.80
13.87¢
MIA
147,707$134.89
18.41¢
MIA
77,704$162.52
15.10¢
24
DTW
120,684$194.65
19.63¢
DTW
120,360$264.55
38.05¢
DTW
118,623$210.94
36.60¢
DTW
26,061$319.96156.90¢
25
PHX
110,975$204.33
13.96¢
PHX
279,098$182.71
16.58¢
PHX
118,815$218.04
11.15¢
PHX
163,936$223.12
11.85¢
MCI
RDU
PIT
MSY

Page | 20
CY 2013 Comparison
Carr ierCY 2013
O&D Pax
CY 2013
Pax Share
%
CY 2013
A vg. Net One
Way Fare
CY 2013
T icket
Yield
CY 2013
A vg. T icket
Miles
AA 682,582 8.3% $198.54 18.72¢ 1,061
B6 241,148 2.9% $207.75 16.74¢ 1,241
DL 1,645,161 20.1% $211.00 19.35¢ 1,090
F9 131,972 1.6% $170.72 12.73¢ 1,341
FL 125,760 1.5% $149.35 17.59¢ 849
NK 72,341 0.9% $57.57 8.49¢ 678
UA 1,303,738 15.9% $228.32 18.83¢ 1,213
US 784,514 9.6% $222.13 20.29¢ 1,095
WN 3,193,554 39.0% $173.31 20.69¢ 838
Total 8,181,002 100.0% $196.45 19.39¢ 1,013
Carr ierCY 2013
O&D Pax
CY 2013
Pax Share
%
CY 2013
A vg. Net One
Way Fare
CY 2013
T icket
Yield
CY 2013
A vg. T icket
Miles
AA 696,590 8.2% $174.45 19.28¢ 905
AS 95,933 1.1% $218.53 12.39¢ 1,764
DL 1,528,169 17.9% $214.24 20.94¢ 1,023
F9 515,276 6.0% $133.34 14.21¢ 938
FL 112,272 1.3% $163.64 15.52¢ 1,054
UA 928,016 10.9% $217.00 20.60¢ 1,053
US 713,109 8.4% $213.78 17.16¢ 1,246
WN 3,947,660 46.2% $171.62 19.37¢ 886
Total 8,537,373 100.0% $186.59 19.08¢ 978
Carr ierCY 2013
O&D Pax
CY 2013
Pax Share
%
CY 2013
A vg. Net One
Way Fare
CY 2013
T icket
Yield
CY 2013
A vg. T icket
Miles
AA 1,194,370 15.0% $197.05 17.94¢ 1,098
B6 417,288 5.3% $137.92 20.66¢ 668
DL 2,220,830 28.0% $187.89 20.31¢ 925
F9 86,638 1.1% $118.66 26.57¢ 447
FL 157,006 2.0% $138.27 17.54¢ 788
UA 752,852 9.5% $236.94 18.90¢ 1,253
US 1,166,402 14.7% $193.73 24.64¢ 786
WN 1,941,357 24.5% $164.77 17.20¢ 958
Total 7,937,663 100.0% $185.03 19.54¢ 947
Carr ierCY 2013
O&D Pax
CY 2013
Pax Share
%
CY 2013
A vg. Net One
Way Fare
CY 2013
T icket
Yield
CY 2013
A vg. T icket
Miles
AA 523,958 7.6% $222.13 16.92¢ 1,313
B6 190,095 2.8% $119.29 20.81¢ 573
DL 1,196,345 17.5% $214.03 23.47¢ 912
F9 177,836 2.6% $167.73 29.13¢ 576
FL 268,723 3.9% $149.91 16.01¢ 937
UA 1,120,451 16.3% $244.93 18.57¢ 1,319
US 1,558,078 22.7% $208.97 23.16¢ 902
WN 1,817,699 26.5% $163.96 14.94¢ 1,098
Total 6,854,516 100.0% $199.29 19.20¢ 1,038
MSY
MCI
RDU
PIT

Page | 21
CY 2012 Comparison
Carr ierCY 2012
O&D Pax
CY 2012
Pax Share
%
CY 2012
A vg. Net One
Way Fare
CY 2012
T icket
Yield
CY 2012
A vg. T icket
Miles
AA 685,117 8.8% $201.51 19.10¢ 1,055
B6 247,964 3.2% $201.27 16.22¢ 1,241
DL 1,660,709 21.3% $201.04 18.41¢ 1,092
F9 129,460 1.7% $180.42 14.65¢ 1,231
FL 327,795 4.2% $138.50 15.89¢ 872
UA 1,339,950 17.2% $221.04 17.45¢ 1,266
US 702,065 9.0% $219.93 20.52¢ 1,072
WN 2,717,035 34.8% $174.51 21.12¢ 826
Total 7,810,266 100.0% $194.15 18.96¢ 1,024
Carr ierCY 2012
O&D Pax
CY 2012
Pax Share
%
CY 2012
A vg. Net One
Way Fare
CY 2012
T icket
Yield
CY 2012
A vg. T icket
Miles
AA 757,824 8.7% $171.08 18.62¢ 919
AS 77,193 0.9% $209.26 11.93¢ 1,754
DL 1,627,174 18.6% $202.07 19.12¢ 1,057
F9 792,208 9.1% $134.89 13.88¢ 972
FL 174,789 2.0% $135.82 13.67¢ 993
UA 1,062,666 12.2% $205.95 19.19¢ 1,073
US 670,782 7.7% $204.50 16.52¢ 1,238
WN 3,573,083 40.9% $163.89 18.70¢ 876
Total 8,735,805 100.0% $177.36 17.97¢ 987
Carr ierCY 2012
O&D Pax
CY 2012
Pax Share
%
CY 2012
A vg. Net One
Way Fare
CY 2012
T icket
Yield
CY 2012
A vg. T icket
Miles
AA 1,129,566 14.2% $195.84 18.29¢ 1,071
B6 424,662 5.3% $129.88 20.49¢ 634
DL 2,124,170 26.6% $179.62 19.22¢ 935
F9 74,476 0.9% $154.81 27.45¢ 564
FL 223,384 2.8% $121.21 14.80¢ 819
UA 843,722 10.6% $227.40 18.44¢ 1,233
US 1,239,118 15.5% $178.85 22.20¢ 805
WN 1,922,574 24.1% $160.66 17.69¢ 908
Total 7,982,325 100.0% $177.64 19.02¢ 934
Carr ierCY 2012
O&D Pax
CY 2012
Pax Share
%
CY 2012
A vg. Net One
Way Fare
CY 2012
T icket
Yield
CY 2012
A vg. T icket
Miles
AA 531,256 7.5% $219.10 17.22¢ 1,272
B6 264,598 3.7% $113.76 20.48¢ 555
DL 1,260,174 17.7% $191.14 20.48¢ 933
F9 163,365 2.3% $135.68 27.74¢ 489
FL 679,913 9.5% $134.74 14.71¢ 916
UA 1,200,836 16.8% $235.86 17.38¢ 1,357
US 1,616,820 22.7% $196.02 22.67¢ 865
WN 1,404,043 19.7% $167.23 14.52¢ 1,152
Total 7,130,543 100.0% $187.80 18.24¢ 1,030
MSY
MCI
RDU
PIT
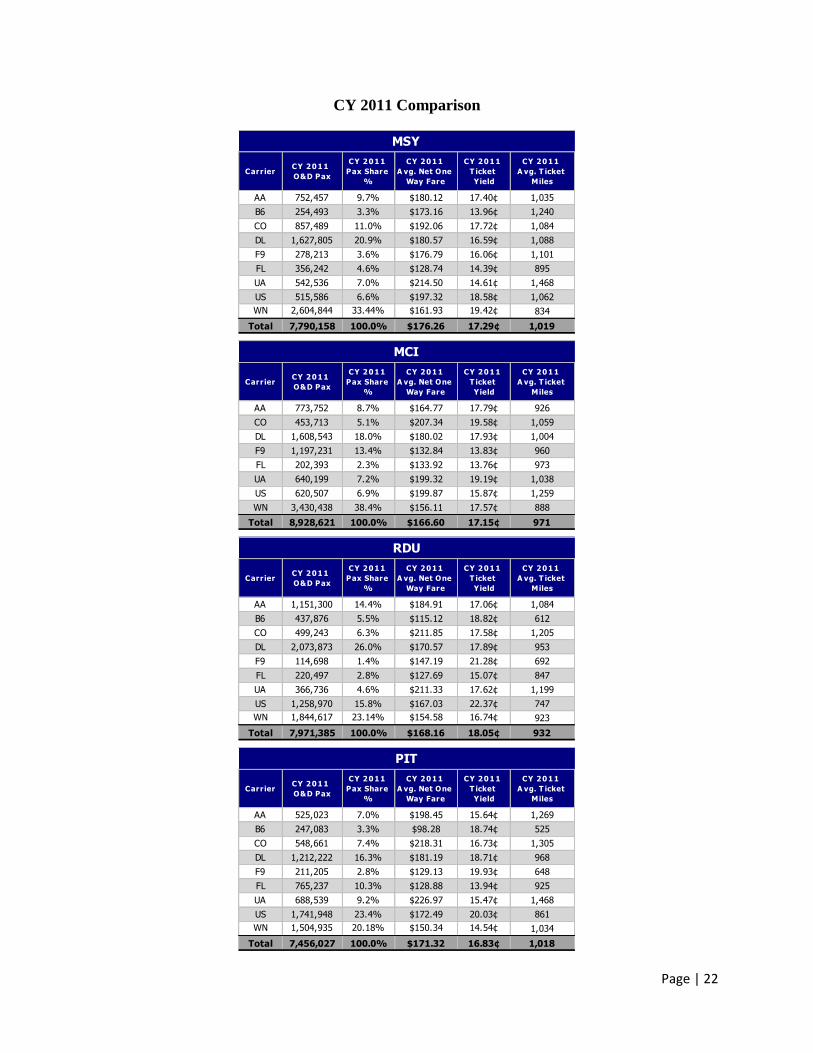
Page | 22
CY 2011 Comparison
Carr ierCY 2011
O&D Pax
CY 2011
Pax Share
%
CY 2011
A vg. Net One
Way Fare
CY 2011
T icket
Yield
CY 2011
A vg. T icket
Miles
AA 752,457 9.7% $180.12 17.40¢ 1,035
B6 254,493 3.3% $173.16 13.96¢ 1,240
CO 857,489 11.0% $192.06 17.72¢ 1,084
DL 1,627,805 20.9% $180.57 16.59¢ 1,088
F9 278,213 3.6% $176.79 16.06¢ 1,101
FL 356,242 4.6% $128.74 14.39¢ 895
UA 542,536 7.0% $214.50 14.61¢ 1,468
US 515,586 6.6% $197.32 18.58¢ 1,062
WN 2,604,844 33.44% $161.93 19.42¢ 834
Total 7,790,158 100.0% $176.26 17.29¢ 1,019
Carr ierCY 2011
O&D Pax
CY 2011
Pax Share
%
CY 2011
A vg. Net One
Way Fare
CY 2011
T icket
Yield
CY 2011
A vg. T icket
Miles
AA 773,752 8.7% $164.77 17.79¢ 926
CO 453,713 5.1% $207.34 19.58¢ 1,059
DL 1,608,543 18.0% $180.02 17.93¢ 1,004
F9 1,197,231 13.4% $132.84 13.83¢ 960
FL 202,393 2.3% $133.92 13.76¢ 973
UA 640,199 7.2% $199.32 19.19¢ 1,038
US 620,507 6.9% $199.87 15.87¢ 1,259
WN 3,430,438 38.4% $156.11 17.57¢ 888
Total 8,928,621 100.0% $166.60 17.15¢ 971
Carr ierCY 2011
O&D Pax
CY 2011
Pax Share
%
CY 2011
A vg. Net One
Way Fare
CY 2011
T icket
Yield
CY 2011
A vg. T icket
Miles
AA 1,151,300 14.4% $184.91 17.06¢ 1,084
B6 437,876 5.5% $115.12 18.82¢ 612
CO 499,243 6.3% $211.85 17.58¢ 1,205
DL 2,073,873 26.0% $170.57 17.89¢ 953
F9 114,698 1.4% $147.19 21.28¢ 692
FL 220,497 2.8% $127.69 15.07¢ 847
UA 366,736 4.6% $211.33 17.62¢ 1,199
US 1,258,970 15.8% $167.03 22.37¢ 747
WN 1,844,617 23.14% $154.58 16.74¢ 923
Total 7,971,385 100.0% $168.16 18.05¢ 932
Carr ierCY 2011
O&D Pax
CY 2011
Pax Share
%
CY 2011
A vg. Net One
Way Fare
CY 2011
T icket
Yield
CY 2011
A vg. T icket
Miles
AA 525,023 7.0% $198.45 15.64¢ 1,269
B6 247,083 3.3% $98.28 18.74¢ 525
CO 548,661 7.4% $218.31 16.73¢ 1,305
DL 1,212,222 16.3% $181.19 18.71¢ 968
F9 211,205 2.8% $129.13 19.93¢ 648
FL 765,237 10.3% $128.88 13.94¢ 925
UA 688,539 9.2% $226.97 15.47¢ 1,468
US 1,741,948 23.4% $172.49 20.03¢ 861
WN 1,504,935 20.18% $150.34 14.54¢ 1,034
Total 7,456,027 100.0% $171.32 16.83¢ 1,018
MSY
MCI
RDU
PIT

Page | 23
MSY City Pair Comparison with Similar Sized Airports
The following tables indicate the nonstop domestic city pair comparison at MSY with airports of
similar size, which for this analysis are MCI, RDU, and PIT. The data that is summarized
includes the local passengers, average passenger trip length, average passenger yield, and the city
pairs portioned off between markets of 750 miles or less and markets over 750 miles.
Furthermore, it is indicated which of these city pairs has a low fare carrier present. For this
analysis, low fare carrier has been defined as JetBlue, Frontier, Southwest/AirTran, Spirit, and
Allegiant. The following data is based on CY 2013 data.

Page | 24
O&D
Market
Rank
Market PsgrNet OW
Fare
T icket
Yield
A vg.
Passenger
T r ip Length
Nonstop
Service
< 750
Miles
> 750
Miles
Low Fare
Carr ier
Present
1 HOU 380,032 $153.81 50.82¢ 303 Y X WN
7 IAH 238,987 $173.68 56.79¢ 306 Y X -
59 BHM 29,175 $135.46 32.79¢ 413 Y X WN
2 ATL 341,364 $139.77 32.23¢ 434 Y X WN
5 DAL 284,734 $138.76 31.45¢ 441 Y X WN
66 MEM 19,363 $284.28 63.74¢ 446 Y X -
12 DFW 210,156 $110.06 24.24¢ 454 Y X NK
21 BNA 148,807 $138.15 27.78¢ 497 Y X WN
31 AUS 94,415 $184.96 37.13¢ 498 Y X WN
15 TPA 181,137 $142.18 26.22¢ 542 Y X WN
8 MCO 237,250 $157.10 25.76¢ 610 Y X WN
61 EYW 24,205 $156.87 22.98¢ 683 Y X WN
28 CLT 107,355 $184.78 26.50¢ 697 Y X -
26 STL 109,711 $179.55 25.56¢ 703 Y X WN
23 MIA 126,069 $178.38 24.85¢ 718 Y X -
22 FLL 131,711 $173.60 22.58¢ 769 Y X WN
29 MCI 101,591 $145.11 17.75¢ 818 Y X WN
53 CVG 34,812 $222.45 26.71¢ 833 Y X -
20 MDW 151,430 $190.76 22.27¢ 856 Y X WN
19 ORD 154,904 $230.39 24.52¢ 939 Y X -
24 DTW 120,684 $194.65 19.63¢ 992 Y X -
13 DCA 198,993 $226.96 22.75¢ 997 Y X -
34 MKE 68,465 $141.24 14.14¢ 999 Y X WN
38 IAD 51,313 $264.98 26.00¢ 1,019 Y X -
9 BWI 235,675 $190.88 18.32¢ 1,042 Y X WN
41 CLE 46,547 $216.85 20.62¢ 1,052 Y X -
6 DEN 247,740 $159.43 14.47¢ 1,102 Y X F9/WN
80 TTN 14,335 $91.81 8.17¢ 1,123 Y X F9
14 PHL 192,994 $202.26 17.40¢ 1,163 Y X -
30 MSP 101,395 $214.95 18.49¢ 1,163 Y X -
10 JFK 233,321 $199.70 16.80¢ 1,189 Y X B6
11 EWR 218,137 $207.17 17.08¢ 1,213 Y X WN
4 LGA 293,444 $189.07 15.36¢ 1,231 Y X -
16 BOS 179,528 $199.25 13.68¢ 1,456 Y X B6
25 PHX 110,975 $204.33 13.96¢ 1,464 Y X WN
39 SLC 50,320 $259.07 16.51¢ 1,569 Y X -
18 LAS 158,561 $210.55 13.27¢ 1,587 Y X WN
3 LAX 320,047 $258.98 14.95¢ 1,732 Y X WN
17 SFO 177,310 $283.11 14.06¢ 2,014 Y X -
MSY

Page | 25
O&D
Market
Rank
Market PsgrNet OW
Fare
T icket
Yield
A vg.
Passenger
T r ip Length
Nonstop
Service
< 750
Miles
> 750
Miles
Low Fare
Carr ier
Present
30 STL 101,490 $121.57 51.24¢ 237 Y X WN
9 ORD 232,355 $158.06 38.67¢ 409 Y X -
2 MDW 337,962 $141.65 34.63¢ 409 Y X WN
13 MSP 170,496 $184.70 45.13¢ 409 Y X WN
52 OKC 33,201 $137.22 33.09¢ 415 Y X WN
8 DAL 240,242 $151.95 32.80¢ 463 Y X WN
12 DFW 182,158 $148.66 31.81¢ 467 Y X -
28 MKE 102,328 $133.77 27.99¢ 478 Y X WN
84 MEM 14,201 $270.34 52.92¢ 511 Y X -
31 IND 100,708 $131.82 25.79¢ 511 Y X WN
20 BNA 144,860 $135.17 25.60¢ 528 Y X WN
1 DEN 462,776 $113.69 21.11¢ 538 Y X F9/WN
47 CVG 42,325 $215.49 36.00¢ 599 Y X -
38 IAH 80,719 $251.59 37.50¢ 671 Y X -
23 HOU 130,239 $197.22 28.93¢ 682 Y X WN
25 DTW 120,360 $264.55 38.05¢ 695 Y X -
3 ATL 289,661 $170.59 23.71¢ 719 Y X WN
43 CLE 61,678 $238.34 31.46¢ 758 Y X -
29 MSY 101,591 $145.11 17.75¢ 818 Y X WN
44 ABQ 56,991 $171.77 20.10¢ 855 Y X WN
27 CLT 109,135 $181.75 20.09¢ 905 Y X -
37 IAD 86,718 $194.88 20.11¢ 969 Y X -
10 DCA 202,687 $163.19 16.51¢ 988 Y X F9
34 SLC 91,187 $192.31 19.39¢ 992 Y X -
17 BWI 160,455 $189.52 18.69¢ 1,014 Y X WN
5 PHX 279,098 $182.71 16.58¢ 1,102 Y X WN
18 PHL 160,330 $188.08 16.86¢ 1,116 Y X -
21 TPA 140,581 $195.45 17.27¢ 1,132 Y X WN
24 EWR 125,091 $281.27 24.83¢ 1,133 Y X -
6 MCO 271,731 $177.60 15.66¢ 1,134 Y X WN
11 LGA 189,049 $268.87 23.02¢ 1,168 Y X -
4 LAS 285,298 $178.68 14.96¢ 1,194 Y X WN
71 JFK 20,527 $244.38 20.09¢ 1,217 Y X -
19 BOS 146,818 $202.48 15.34¢ 1,320 Y X WN
14 FLL 166,118 $163.31 12.23¢ 1,335 Y X WN
7 LAX 265,393 $200.37 14.17¢ 1,414 Y X WN
16 SAN 160,524 $195.16 13.63¢ 1,431 Y X WN
32 OAK 100,684 $193.14 12.45¢ 1,552 Y X WN
22 SFO 135,528 $238.28 15.17¢ 1,571 Y X -
15 SEA 163,235 $196.22 12.23¢ 1,605 Y X WN
26 PDX 113,525 $183.29 11.26¢ 1,627 Y X WN
MCI

Page | 26
O&D
Market
Rank
Market PsgrNet OW
Fare
T icket
Yield
A vg.
Passenger
T r ip Length
Nonstop
Service
< 750
Miles
> 750
Miles
Low Fare
Carr ier
Present
81 CLT 12,694 $143.21 109.64¢ 131 Y X -
21 DCA 120,050 $215.12 93.84¢ 229 Y X -
51 IAD 33,232 $266.17 115.21¢ 231 Y X -
9 BWI 206,336 $130.32 50.77¢ 257 Y X WN
8 PHL 236,807 $175.82 51.47¢ 342 Y X WN
3 ATL 398,605 $135.03 37.75¢ 358 Y X WN
49 TTN 39,117 $61.75 16.55¢ 373 Y X F9
29 PIT 75,495 $116.32 31.06¢ 375 Y X -
7 JFK 237,007 $130.81 30.20¢ 433 Y X B6
1 LGA 479,321 $143.25 32.29¢ 444 Y X -
45 CVG 44,690 $222.97 48.74¢ 457 Y X -
10 BNA 193,887 $121.76 26.38¢ 462 Y X WN
17 EWR 153,589 $221.35 47.83¢ 463 Y X -
39 CMH 51,582 $184.93 37.65¢ 491 Y X -
36 CLE 63,398 $197.00 37.85¢ 520 Y X -
5 MCO 271,373 $131.21 23.35¢ 562 Y X WN
23 DTW 118,623 $210.94 36.60¢ 576 Y X -
30 IND 74,322 $193.79 32.56¢ 595 Y X -
35 BDL 63,592 $179.18 29.65¢ 604 Y X -
15 TPA 178,325 $149.99 24.24¢ 619 Y X WN
2 BOS 417,898 $140.00 22.50¢ 622 Y X B6
16 MDW 166,136 $147.85 22.31¢ 663 Y X WN
4 ORD 276,047 $177.24 26.33¢ 673 Y X -
43 MEM 47,743 $204.44 30.24¢ 676 Y X -
19 MIA 147,707 $134.89 18.41¢ 733 Y X -
24 STL 109,654 $168.82 22.28¢ 758 Y X WN
13 FLL 184,700 $127.29 16.56¢ 769 Y X B6/WN
20 MSP 144,505 $204.23 19.61¢ 1,041 Y X -
27 IAH 87,536 $245.88 23.13¢ 1,063 Y X -
11 DFW 191,942 $230.64 21.40¢ 1,078 Y X -
33 HOU 65,307 $208.18 19.27¢ 1,081 Y X WN
14 DEN 183,843 $200.02 12.92¢ 1,548 Y X WN
22 PHX 118,815 $218.04 11.15¢ 1,956 Y X WN
34 SLC 65,132 $243.39 12.18¢ 1,998 Y X -
18 LAS 148,718 $222.73 10.53¢ 2,115 Y X WN
6 LAX 239,823 $221.18 9.76¢ 2,266 Y X -
12 SFO 188,893 $286.39 11.60¢ 2,470 Y X -
RDU

Page | 27
O&D
Market
Rank
Market PsgrNet OW
Fare
T icket
Yield
A vg.
Passenger
T r ip Length
Nonstop
Service
< 750
Miles
> 750
Miles
Low Fare
Carr ier
Present
285 CLE 152 $91.05 75.84¢ 120 Y X F9
67 IAD 15,887 $287.82 157.67¢ 183 Y X
51 DTW 26,061 $319.96 156.90¢ 204 Y X
38 DCA 50,245 $161.62 78.04¢ 207 Y X
27 BWI 68,608 $125.30 57.46¢ 218 Y X WN
68 CVG 15,743 $284.94 107.31¢ 266 Y X
16 PHL 163,593 $242.62 87.74¢ 277 Y X
19 EWR 112,464 $260.04 79.11¢ 329 Y X
4 LGA 281,173 $211.04 62.80¢ 336 Y X
30 JFK 63,191 $170.32 48.39¢ 352 Y X B6
25 RDU 75,495 $116.32 31.06¢ 375 Y X
10 MDW 187,476 $132.72 32.92¢ 403 Y X WN
7 ORD 228,174 $161.41 37.87¢ 426 Y X
26 BDL 72,640 $140.65 32.22¢ 437 Y X
18 CLT 120,849 $199.64 45.45¢ 439 Y X
2 BOS 332,086 $125.43 24.84¢ 505 Y X B6
3 ATL 292,677 $160.89 29.81¢ 540 Y X WN
21 STL 85,290 $157.42 24.02¢ 655 Y X
32 BNA 60,474 $160.60 23.46¢ 685 Y X WN
41 MEM 38,975 $202.65 26.15¢ 775 Y X
20 MSP 107,990 $233.25 28.25¢ 826 Y X
1 MCO 419,985 $140.95 16.45¢ 857 Y X WN
5 TPA 269,540 $142.07 15.72¢ 904 Y X WN
12 RSW 169,434 $150.35 15.12¢ 994 Y X WN
28 PBI 65,612 $157.99 15.43¢ 1,024 Y X WN
9 FLL 192,090 $153.86 14.80¢ 1,039 Y X WN
23 MIA 77,704 $162.52 15.10¢ 1,076 Y X
8 DFW 194,427 $232.96 20.61¢ 1,131 Y X
11 IAH 178,849 $291.08 25.03¢ 1,163 Y X
34 HOU 56,584 $201.72 16.66¢ 1,211 Y X WN
15 DEN 163,900 $235.05 17.16¢ 1,370 Y X WN
14 PHX 163,936 $223.12 11.85¢ 1,882 Y X WN
6 LAS 255,797 $189.09 9.43¢ 2,004 Y X WN
13 LAX 165,449 $270.79 12.08¢ 2,241 Y X
17 SFO 147,095 $287.25 12.02¢ 2,391 Y X
PIT

Page | 28
SUMMARY MSY is committed to encouraging and facilitating airline competition. MSY staff strategically
identifies markets that currently or potentially support nonstop service. Once those markets are
identified, MSY begins negotiations with carriers who might have an interest in entering one of
the individual markets with competitive service and fares.
Similarly, MSY identifies markets with potentially higher average fares and brings it to a low-
cost carrier’s attention, such as Dallas/Fort Worth and Newark which were added in 2013 by
Spirit Airlines and Southwest Airlines respectively. Chicago, Detroit and Ft. Lauderdale were
also added by Spirit Airlines in 2014 to compete with legacy carriers and another low-cost
carrier, Southwest Airlines. Allegiant Air, also known for their ultra-low cost model will begin
nonstop service to Orlando-Sanford, Columbus-Rickenbacker, Indianapolis and Cincinnati in the
first quarter of 2015.
As opportunities unfold and opportunities to increase service and improve competition further
arise, MSY is dedicated to maximizing the use of its facilities for existing and potential new
entrant carriers. At this time, MSY ticket and gate areas are not at maximum capacity, and able
to accommodate expanded or new service as needed.


![SERV1857 785C (1HW), 785D (MSY), 789C 2BS)_TXT[1].pdf](https://static.fdocuments.us/doc/165x107/5695d0e01a28ab9b029439a1/serv1857-785c-1hw-785d-msy-789c-2bstxt1pdf.jpg)