
Losing Ground at School - Harvard University
27
4 Losing Ground at School Roland G. Fryer, Jr., Harvard Society of Fellows and National Bureau of Economic Research and Steven D. Levitt, American Bar Foundation and University of Chicago The black-white test score gap is a robust empirical regularity. A simple comparison of mean test scores typically finds black students scoring roughly one standard deviation below white students on standardized tests. Even after controlling for a wide range of covariates including family struc- ture, socioeconomic status, measures of school quality, and neighborhood characteristics, a substantial racial gap in test scores persists. 1 Gaining a better understanding of the underlying causes of the test-score gap is a question of great importance. Neal and Johnson and O’Neill find that most of the observed black-white wage differentials among adults disap- pears once lower eighth-grade test scores among Blacks are taken into account. 2 Thus, eliminating the test-score gap that arises by the end of junior high school may be a critical component of reducing racial wage inequality. 3 A wide variety of possible explanations for the test-score gap have been put forth. These explanations include differences in genetic make-up (see Hernstein and Murray and Jensen), differences in family structure and pov- erty (see Armor, Brooks-Gunn and Duncan, Mayer, and Phillips, Crouse, and Ralph), differences in school quality (see Cook and Evans), racial bias in testing or teachers’ perceptions (see Delpit, Ferguson, and Rodgers and Spriggs), and differences in culture, socialization, or behavior (see Cook and Ludwig, Fordham and Ogbu, Fryer, and Steele and Aronson). 4 The appro- priate public policy choice (if any) to address the test-score gap depends crit- ically on the underlying source of the gap. In this paper, we use the Early Childhood Longitudinal Study Kindergar- PAGE 88 88 ................. 15683$ $CH4 10-05-05 08:50:08 PS
Transcript of Losing Ground at School - Harvard University
4Losing Ground at SchoolRoland G. Fryer, Jr., Harvard Society of Fellows and NationalBureau of Economic Research and Steven D. Levitt, AmericanBar Foundation and University of Chicago
The black-white test score gap is a robust empirical regularity. A simplecomparison of mean test scores typically finds black students scoringroughly one standard deviation below white students on standardized tests.Even after controlling for a wide range of covariates including family struc-ture, socioeconomic status, measures of school quality, and neighborhoodcharacteristics, a substantial racial gap in test scores persists.1
Gaining a better understanding of the underlying causes of the test-scoregap is a question of great importance. Neal and Johnson and O’Neill findthat most of the observed black-white wage differentials among adults disap-pears once lower eighth-grade test scores among Blacks are taken intoaccount.2 Thus, eliminating the test-score gap that arises by the end of juniorhigh school may be a critical component of reducing racial wage inequality.3
A wide variety of possible explanations for the test-score gap have beenput forth. These explanations include differences in genetic make-up (seeHernstein and Murray and Jensen), differences in family structure and pov-erty (see Armor, Brooks-Gunn and Duncan, Mayer, and Phillips, Crouse,and Ralph), differences in school quality (see Cook and Evans), racial bias intesting or teachers’ perceptions (see Delpit, Ferguson, and Rodgers andSpriggs), and differences in culture, socialization, or behavior (see Cook andLudwig, Fordham and Ogbu, Fryer, and Steele and Aronson).4 The appro-priate public policy choice (if any) to address the test-score gap depends crit-ically on the underlying source of the gap.
In this paper, we use the Early Childhood Longitudinal Study Kindergar-
PAGE 88
88
................. 15683$ $CH4 10-05-05 08:50:08 PS

Losing Ground at School 89
ten Cohort (ECLSK) to shed new light on the test-score gap. ECLS-K is anew data set administered by the Department of Education. The survey cov-ers a sample of more than 20,000 children entering kindergarten in the fallof 1998. An enormous amount of information is gathered for each individualincluding family background, school and neighborhood characteristics,teacher and parent assessments, and test scores. The original sample of stu-dents has subsequently been reinterviewed in the spring of kindergarten andfirst grade.
The results we obtain using these new data are informative and in somecases quite surprising. As in previous data sets, we observe substantial racialdifferences in test scores in the raw data: black kindergartners score on aver-age .64 standard deviations worse than Whites. In stark contrast to earlierstudies (including those looking at kindergartners), however, after control-ling for a small number of other observable characteristics (children’s age,child’s birth weight, a socioeconomic status measure, WIC participation,mother’s age at first birth, and number of children’s books in the home), weessentially eliminate the black-white test score gap in math and reading forstudents entering kindergarten.5 Controlling for a much larger set of charac-teristics yields the same conclusion. This same set of covariates accounts formuch but not all of the Hispanic-white difference in test scores, but cannotexplain the high test-scores of Asians.
There are three leading explanations for why our results differ so sharplyfrom earlier research such as Phillips, Crouse, and Ralph (1998): (1) nonran-dom sampling in the data sets used in earlier studies, (2) real gains by recentcohorts of Blacks, and (3) better covariates in ECLS. Based on our analysisof the Children of the National Longitudinal Survey of Youth (CNLSY) dataused by Phillips, Crouse, and Ralph, we conclude that real gains by recentcohorts of Blacks are an important part of the explanation. The raw black-white test-score gap for recent cohorts in CNLSY are comparable to thosein ECLS, in sharp contrast to earlier cohorts in CNLSY. Real gains by Blacksborn in recent years would appear to be the leading explanation. We cannot,however, fully eliminate the racial test score gap among recent CLNSYcohorts. This is due in part to better covariates in ECLS. Even when nearlyidentical covariates are included, differences persist between ECLS andCNLSY.
Despite the fact that we see no difference in initial test scores for observa-tionally equivalent black and white children when they enter kindergarten,their paths diverge once they are in school. Between the beginning of kinder-garten and the end of first grade, black students lose .20 standard deviations(approximately .10 standard deviation each year) relative to white studentswith similar characteristics.6 If the gap in test scores for these children con-tinues to grow at the same rate, by fifth grade the black students will be .50standard deviations behind their white counterparts—a gap similar in magni-
PAGE 89................. 15683$ $CH4 10-05-05 08:50:09 PS

90 Chapter 4
tude to that found in previous analyses (see Jones et al., Phillips, and Phillips,Crouse, and Ralph ).7
The leading explanation for the worse trajectory of black students in oursample is that they attend lower quality schools. When we compare thechange in test scores over time for Blacks and Whites attending the sameschool, black students lose only a third as much ground as they do relativeto Whites in the overall sample. This result suggests that differences in qual-ity across schools attended by Whites and Blacks is likely to be an importantpart of the story. Interestingly, along ‘‘traditional’’ dimensions of schoolquality (class size, teacher education, computer:student ratio, etc.), Blacksand Whites attend schools that are similar. On a wide range of nonstandardschool inputs (e.g., gang problems in school, percent of students on freelunch, amount of loitering in front of school by nonstudents, amount of lit-ter around the school, whether or not students need hall passes, and PTAfunding), Blacks do appear to be attending much worse schools even aftercontrolling for individual characteristics.8 Our story is incomplete, however,because the observable differences across schools do little to explain the wid-ening black-white gap. This could be due to the coarseness of the schoolquality variables available in the ECLS.
We explore a range of other explanations as to why black children are los-ing ground, but find very little empirical support for these alternative theo-ries. Black students do not appear to suffer bigger ‘‘summer setbacks’’ whenschool is not in session. The lower trajectories of black students are not sim-ply an artifact of standardized testing. Subjective teacher assessments of stu-dent performance yield patterns similar to the test-score data. Having a blackteacher provides no benefit to black students compared to their white class-mates, calling into question the possible role of either overt discriminationor low expectations for black children on the part of white teachers. Finally,adding proxies for behavioral problems does not alter our findings.
The structure of the paper is as follows. The first section provides a briefreview of the literature. The second section describes and summarizes thedata set. Then we present the basic results for incoming kindergartners, dem-onstrating that the black-white test score gap disappears once other con-founding factors are accounted for. In the next section we document the factthat a racial test-score gap emerges during the school-age years, and the fol-lowing section analyzes the reasons for this divergence. We present our con-clusions in the final section.
BACKGROUND AND PREVIOUS LITERATURE
The Coleman Report (Coleman et al.) was the first national study to describeethnic differences in academic achievement among children at various stagesof schooling. It documented that substantial differences in educational
PAGE 90................. 15683$ $CH4 10-05-05 08:50:10 PS
Losing Ground at School 91
achievement between Blacks and Whites not only existed at every gradelevel, but increased with student age. Since then, substantial effort has beendevoted to understanding what variables account for the gap, as well as howand why the magnitude of the gap has changed over time.9 A number of styl-ized facts have emerged. Socioeconomic status and the effects of poverty areimportant factors in explaining racial differences in educational achievement(see Brooks-Gunn and Duncan, Mayer, Brooks-Gunn et al.).10 Even aftercontrolling for socioeconomic status in conventional regression analysis, asubstantial gap still remains. That gap has generally been declining over time,although for high school students today, the gap is slightly larger than it wasin the late 1980s (see Grissmer et al., Hedges and Nowell, and Humphreys).11
Finally, the gap in test scores between Blacks and Whites historicallyemerges before children enter kindergarten and tends to widen over time (seeCarneiro and Heckman and Phillips, Crouse, and Ralph).
THE DATA
The Early Childhood Longitudinal Study Kindergarten Cohort (ECLS-K)is a nationally representative sample of over 20,000 children entering kinder-garten in 1998. Thus far, information on these children has been gathered atfour separate points in time. The full sample was interviewed in the fall andspring of kindergarten and spring of first grade. A random sample of one-fourth of the respondents were also interviewed in the fall of first grade. Thesample will eventually be followed through fifth grade.12 Roughly 1,000schools are included in the sample, with an average of more than twenty chil-dren per school in the study. As a consequence, it is possible to conductwithin-school analyses.
ESTIMATING RACIAL TEST SCORE GAPS FORINCOMING KINDERGARTNERS
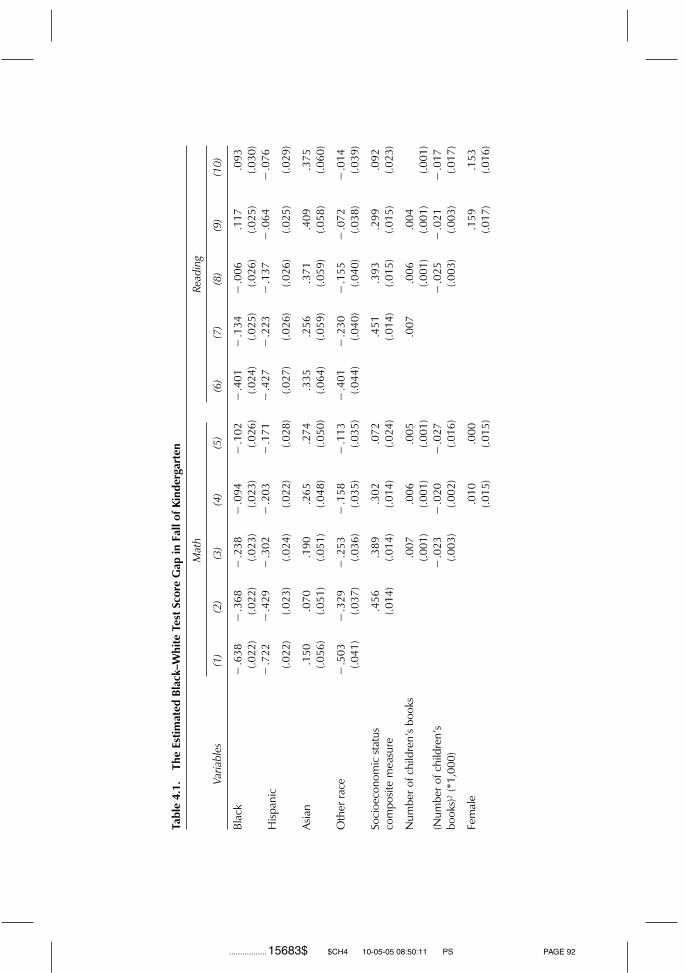
Table 4.1 presents a series of estimates of the racial test score gap for the teststaken in the fall of kindergarten. The specifications estimated are of the form
TESTSCOREi � RACEi’G � Xi’T � ei (1)
where i indexes students. A full set of race dummies are included in theregression, with White as the omitted category. Consequently, the coeffi-cients on race capture the gap between the named racial category and Whites.Our primary emphasis, is on the black-white test score gap. The vector ofother covariates included in the specification, denoted Xi, varies across col-umns in table 4.1. As one moves to the right in the table, the set of covariatessteadily grows. In all instances, the estimation is done using weighted least
PAGE 91................. 15683$ $CH4 10-05-05 08:50:10 PS
Tabl
e4.
1.Th
eEs
timat
edBl
ack–
Whi
teTe
stSc
ore
Gap
inFa
llof
Kind
erga
rten
Varia
bles
Mat
h
(1)
(2)
(3)
(4)
(5)
Read
ing
(6)
(7)
(8)
(9)
(10)
Blac
k�
.638
�.3
68�
.238
�.0
94�
.102
�.4
01�
.134
�.0
06.1
17.0
93(.0
22)
(.022
)(.0
23)
(.023
)(.0
26)
(.024
)(.0
25)
(.026
)(.0
25)
(.030
)
Hisp
anic
�.7
22�
.429
�.3
02�
.203
�.1
71�
.427
�.2
23�
.137
�.0
64�
.076
(.022
)(.0
23)
(.024
)(.0
22)
(.028
)(.0
27)
(.026
)(.0
26)
(.025
)(.0
29)
Asia
n.1
50.0
70.1
90.2
65.2
74.3
35.2
56.3
71.4
09.3
75(.0
56)
(.051
)(.0
51)
(.048
)(.0
50)
(.064
)(.0
59)
(.059
)(.0
58)
(.060
)
Oth
erra
ce�
.503
�.3
29�
.253
�.1
58�
.113
�.4
01�
.230
�.1
55�
.072
�.0
14(.0
41)
(.037
)(.0
36)
(.035
)(.0
35)
(.044
)(.0
40)
(.040
)(.0
38)
(.039
)
Soci
oeco
nom
icst
atus
.456
.389
.302
.072
.451
.393
.299
.092
com
posit
em
easu
re(.0
14)
(.014
)(.0
14)
(.024
)(.0
14)
(.015
)(.0
15)
(.023
)
Num
bero
fchi
ldre
n’s
book
s.0
07.0
06.0
05.0
07.0
06.0
04(.0
01)
(.001
)(.0
01)
(.001
)(.0
01)
(.001
)(N
umbe
rofc
hild
ren’
s�
.023
�.0
20�
.027
�.0
25�
.021
�.0
17bo
oks)
2(*
1,00
0)(.0
03)
(.002
)(.0
16)
(.003
)(.0
03)
(.017
)
Fem
ale
.010
.000
.159
.153
(.015
)(.0
15)
(.017
)(.0
16)
PAGE 92................. 15683$ $CH4 10-05-05 08:50:11 PS
Age
atki
nder
gart
enfa
ll.0
56�
2.68
0.0
41�
2.40
9(in
mon
ths)
(.002
)(.5
42)
(.002
)(.4
83)
Birt
hw
eigh
t(ou
nces
)(*1
0).0
29.0
30.0
19.0
22(.0
04)
(.004
)(.0
04)
(.004
)
Teen
age
mot
hera
ttim
eof
�.1
09�
.029
�.1
44�
.069
first
birt
h(.0
18)
(.021
)(.0
20)
(.022
)
Mot
hera
tlea
stth
irty
attim
e.1
82.1
11.2
26.1
55of
first
birt
h(.0
25)
(.028
)(.0
27)
(.030
)
WIC
part
icip
ant
�.2
11�
.120
�.1
84�
.104
(.019
)(.0
20)
(.021
)(.0
21)
R-sq
uare
d0.
108
0.22
30.
239
0.31
70.
354
0.04
50.
160.
175
0.23
30.
279
Num
bero
fobs
erva
tions
1329
012
601
Full
seto
fcov
aria
tes
incl
uded
inre
gres
sion?
NN
NN
YN
NN
NY
Not
es:
The
depe
nden
tva
riabl
eis
the
mat
hor
read
ing
test
scor
ein
the
fall
ofki
nder
gart
en.T
est
scor
esar
eIR
Tsc
ores
,no
rmal
ized
toha
vea
mea
nof
zero
and
ast
anda
rdde
viat
ion
ofon
ein
the
full,
unw
eigh
ted
sam
ple.
Non
-Hisp
anic
Whi
tes
are
the
omitt
edra
ceca
tego
ry,s
oal
loft
hera
ceco
effic
ient
sar
ega
psre
lativ
eto
that
grou
p.Th
eun
itof
obse
rvat
ion
isa
stud
ent.
Stan
dard
erro
rsar
ein
pare
nthe
ses.
Estim
atio
nis
done
usin
gw
eigh
ted
leas
tsqu
ares
,usin
gsa
mpl
ew
eigh
tspr
ovid
edin
the
data
set.
Inad
ditio
nto
the
varia
bles
incl
uded
inth
eta
ble,
indi
cato
rva
riabl
esfo
rst
uden
tsw
ithm
issin
gva
lues
onea
chco
varia
tear
eal
soin
clud
edin
the
regr
essio
ns.I
nad
ditio
n,co
lum
ns5
and
10re
port
only
asu
bset
ofth
eco
effic
ient
sfro
mre
gres
sions
with
nine
ty-e
ight
cova
riate
sin
clud
edin
the
spec
ifica
tion.
The
full
resu
ltsfo
rcol
umns
5an
d10
are
repo
rted
inFr
yera
ndLe
vitt.
Not
eth
atth
esp
ecifi
catio
nsin
colu
mns
5an
d10
incl
ude
age
and
age
squa
red;
that
isw
hyth
eco
effic
ient
onag
ech
ange
sso
dram
atic
ally
rela
tive
toot
herc
olum
nsin
the
tabl
e.
PAGE 93................. 15683$ $CH4 10-05-05 08:50:11 PS
94 Chapter 4
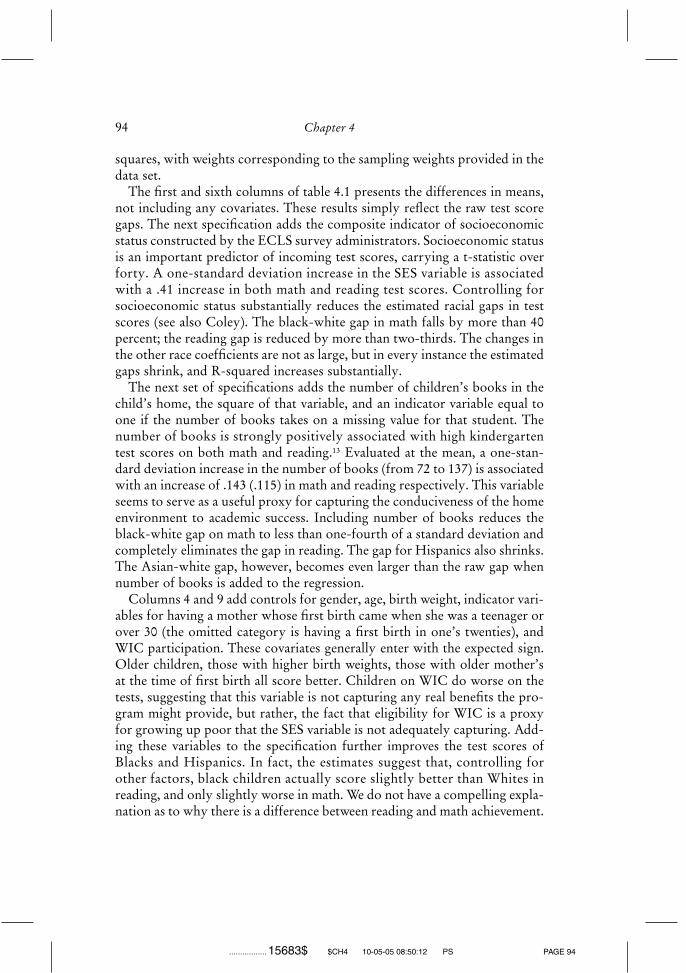
squares, with weights corresponding to the sampling weights provided in thedata set.
The first and sixth columns of table 4.1 presents the differences in means,not including any covariates. These results simply reflect the raw test scoregaps. The next specification adds the composite indicator of socioeconomicstatus constructed by the ECLS survey administrators. Socioeconomic statusis an important predictor of incoming test scores, carrying a t-statistic overforty. A one-standard deviation increase in the SES variable is associatedwith a .41 increase in both math and reading test scores. Controlling forsocioeconomic status substantially reduces the estimated racial gaps in testscores (see also Coley). The black-white gap in math falls by more than 40percent; the reading gap is reduced by more than two-thirds. The changes inthe other race coefficients are not as large, but in every instance the estimatedgaps shrink, and R-squared increases substantially.
The next set of specifications adds the number of children’s books in thechild’s home, the square of that variable, and an indicator variable equal toone if the number of books takes on a missing value for that student. Thenumber of books is strongly positively associated with high kindergartentest scores on both math and reading.13 Evaluated at the mean, a one-stan-dard deviation increase in the number of books (from 72 to 137) is associatedwith an increase of .143 (.115) in math and reading respectively. This variableseems to serve as a useful proxy for capturing the conduciveness of the homeenvironment to academic success. Including number of books reduces theblack-white gap on math to less than one-fourth of a standard deviation andcompletely eliminates the gap in reading. The gap for Hispanics also shrinks.The Asian-white gap, however, becomes even larger than the raw gap whennumber of books is added to the regression.
Columns 4 and 9 add controls for gender, age, birth weight, indicator vari-ables for having a mother whose first birth came when she was a teenager orover 30 (the omitted category is having a first birth in one’s twenties), andWIC participation. These covariates generally enter with the expected sign.Older children, those with higher birth weights, those with older mother’sat the time of first birth all score better. Children on WIC do worse on thetests, suggesting that this variable is not capturing any real benefits the pro-gram might provide, but rather, the fact that eligibility for WIC is a proxyfor growing up poor that the SES variable is not adequately capturing. Add-ing these variables to the specification further improves the test scores ofBlacks and Hispanics. In fact, the estimates suggest that, controlling forother factors, black children actually score slightly better than Whites inreading, and only slightly worse in math. We do not have a compelling expla-nation as to why there is a difference between reading and math achievement.
PAGE 94................. 15683$ $CH4 10-05-05 08:50:12 PS
Losing Ground at School 95
Only a small gap persists for Hispanics. The advantage enjoyed by Asiansbecomes even greater. R-squared increases substantially relative to the previ-ous specification.
The final specifications in table 4.1 (columns 5 and 10) include an exhaus-tive set of roughly 100 covariates capturing city size, neighborhood charac-teristics, region of the country, parental education, parental income, parentaloccupational status, family size and structure, whether the mother worked,type of preschool program participation, whether English is spoken at home,and the extent of parental involvement in a child’s life and school. We reportonly a subset of the covariates in table 4.1; full results can be seen in Fryerand Levitt.14 Almost all of the controls enter in the predicted direction andwith coefficients of plausible magnitude. Interestingly, none of the coeffi-cients on race change appreciably. Only a few of the parameters on the con-trols included in the parsimonious specifications are greatly affected either,and these are easily explained. The socioeconomic status coefficient shrinksbecause the full set of covariates includes variables that go into the construc-tion of the composite indicator such as parent’s income and occupationalstatus. The coefficient on age becomes highly negative because an age-squared term (which is positive and significant) is included in the full speci-fication. The inclusion of these additional variables does little to improve thefit of the model.
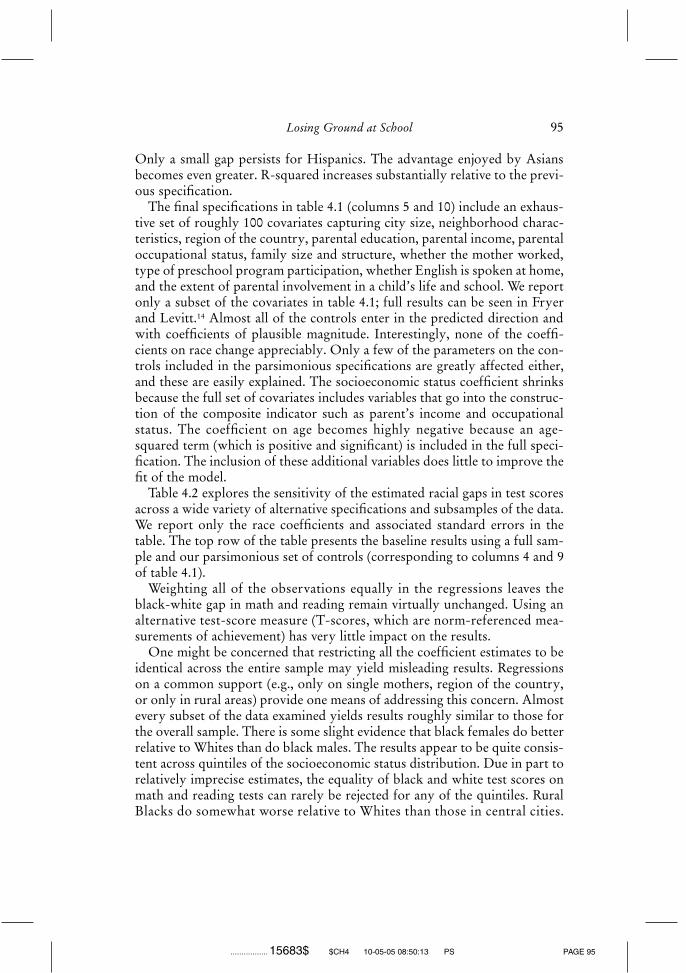
Table 4.2 explores the sensitivity of the estimated racial gaps in test scoresacross a wide variety of alternative specifications and subsamples of the data.We report only the race coefficients and associated standard errors in thetable. The top row of the table presents the baseline results using a full sam-ple and our parsimonious set of controls (corresponding to columns 4 and 9of table 4.1).
Weighting all of the observations equally in the regressions leaves theblack-white gap in math and reading remain virtually unchanged. Using analternative test-score measure (T-scores, which are norm-referenced mea-surements of achievement) has very little impact on the results.
One might be concerned that restricting all the coefficient estimates to beidentical across the entire sample may yield misleading results. Regressionson a common support (e.g., only on single mothers, region of the country,or only in rural areas) provide one means of addressing this concern. Almostevery subset of the data examined yields results roughly similar to those forthe overall sample. There is some slight evidence that black females do betterrelative to Whites than do black males. The results appear to be quite consis-tent across quintiles of the socioeconomic status distribution. Due in part torelatively imprecise estimates, the equality of black and white test scores onmath and reading tests can rarely be rejected for any of the quintiles. RuralBlacks do somewhat worse relative to Whites than those in central cities.
PAGE 95................. 15683$ $CH4 10-05-05 08:50:13 PS

Tabl
e4.
2.Se
nsiti
vity
Anal
ysis
/Ext
ensi
ons
ofth
eBa
sic
Mod
elfo
rFa
llKi
nder
gart
enTe
stSc
ores
Spec
ifica
tion
Coe
ffici
ento
nBl
ack
for:
Mat
hRe
adin
g
Coe
ffici
ento
nH
ispan
icfo
r:
Mat
hRe
adin
g
Coe
ffici
ento
nAs
ian
for:
Mat
hRe
adin
g
Base
line
�.0
94(.0
23)
.117
(.025
)�
.203
(.022
)�
.064
(.025
).2
65(.0
48)
.409
(.058
)U
nwei
ghte
d�
.100
(.023
).0
92(.0
24)
�.2
06(.0
21)
�.0
57(.0
24)
.285
(.034
).3
87(.0
35)
Oth
erte
stsc
ore
mea
sure
s
T-sc
ores
�.0
50(.0
24)
.141
(.030
)�
.057
(.022
).0
65(.0
28)
.176
(.040
).2
98(.0
48)
ByG
ende
r
Mal
es�
.126
(.034
).0
93(.0
37)
�.2
24(.0
32)
�.0
95(.0
35)
.338
(.078
).3
85(.0
87)
Fem
ales
�.0
58(.0
30)
.147
(.035
)�
.181
(.031
)�
.035
(.036
).2
03(.0
59)
.433
(.077
)
BySE
SQ
uint
ile:
Botto
m�
.092
(.044
)�
.005
(.041
)�
.202
(.044
)�
.133
(.045
).3
28(.1
43)
.043
(.111
)Se
cond
�.0
88(.0
45)
.091
(.049
)�
.179
(.046
)�
.090
(.047
).0
44(.1
06)
�.0
01(.0
90)
Third
�.0
97(.0
49)
.068
(.045
)�
.242
(.046
)�
.106
(.051
).2
49(.1
21)
.351
(.167
)Fo
urth
�.0
82(.0
58)
.292
(.077
)�
.100
(.056
).0
30(.0
57)
.207
(.088
).3
96(.1
15)
Top
�.1
69(.0
80)
.068
(.085
)�
.323
(.078
)�
.113
(.094
).4
04(.0
87)
.724
(.102
)
Byfa
mily
stru
ctur
e:
Sing
lem
othe
r�
.087
(.043
).0
70(.0
43)
�.1
97(.0
48)
�.1
19(.0
47)
.086
(.149
).1
14(.1
44)
Two
biol
ogic
alpa
rent
s�
.127
(.034
).1
41(.0
42)
�.1
76(.0
29)
�.0
33(.0
33)
.291
(.054
).4
56(.0
64)
Teen
mot
hera
t1st
birt
h�
.101
(.036
).0
14(.0
33)
�.1
99(.0
36)
�.1
27(.0
38)
.170
(.105
).2
51(.1
14)
Teen
mot
hera
tchi
ld’s
birt
h�
.062
(.046
)�
.021
(.043
)�
.196
(.045
)�
.105
(.052
).2
79(.1
41)
.281
(.135
)(c
ontin
ues)
PAGE 96................. 15683$ $CH4 10-05-05 08:50:14 PS
Tabl
e4.
2.C
ontin
ued
Spec
ifica
tion
Coe
ffici
ento
nBl
ack
for:
Mat
hRe
adin
g
Coe
ffici
ento
nH
ispan
icfo
r:
Mat
hRe
adin
g
Coe
ffici
ento
nAs
ian
for:
Mat
hRe
adin
g
Byre
gion
:
Nor
thea
st�
.087
(.060
).1
29(.0
76)
�.1
59(.0
54)
�.0
30(.0
60)
.305
(.124
).4
83(.1
56)
Mid
wes
t.0
04(.0
53)
.093
(.057
)�
.140
(.064
)�
.031
(.061
).3
37(.1
19)
.562
(.133
)So
uth
�.1
53(.0
32)
.051
(.033
)�
.217
(.040
)�
.119
(.048
).1
54(.1
04)
.368
(.111
)W
est
.098
(.077
).3
62(.0
95)
�.2
00(.0
44)
�.0
01(.0
48)
.269
(.071
).3
53(.0
88)
Bylo
catio
nty
pe:
Cen
tral
city
�.1
10(.0
35)
.147
(.040
)�
.235
(.033
)�
.073
(.037
).2
71(.0
61)
.439
(.075
)Su
burb
an�
.135
(.039
).0
30(.0
41)
�.2
61(.0
41)
�.1
45(.0
42)
.146
(.102
).3
10(.1
19)
Rura
l�
.184
(.048
)�
.032
(.050
)�
.253
(.062
)�
.124
(.072
).2
55(.1
30)
.126
(.102
)
Bysc
hool
type
:
Publ
ic�
.106
(.024
).0
98(.0
27)
�.2
14(.0
24)
�.0
81(.0
27)
.260
(.051
).3
92(.0
64)
Priv
ate
.022
(.070
).2
81(.0
74)
�.1
52(.0
58)
.015
(.066
).2
96(.1
35)
.479
(.137
)Sc
hool
�80
%Bl
ack
.053
(.269
)�
.016
(.215
)�
.084
(.298
).0
57(.2
73)
.285
(.382
).7
88(.6
41)
Scho
ol�
80%
Whi
te�
.105
(.047
).0
59(.0
53)
�.1
86(.0
25)
�.0
61(.0
28)
.288
(.054
).4
36(.0
65)
Not
es:
Spec
ifica
tions
inth
ista
ble
are
varia
tions
onth
ose
repo
rted
inco
lum
ns4
and
9of
tabl
e4.
1.O
nly
the
race
coef
ficie
nts
are
repo
rted
inth
ista
ble.
The
top
row
ofth
eta
ble
simpl
yre
prod
uces
the
base
line
resu
ltsin
colu
mns
4an
d9
ofta
ble
4.1.
The
rem
aini
ngro
ws
ofth
eta
ble
corr
espo
ndto
diffe
rent
wei
ghts
,tes
tsco
rem
easu
res,
orpa
rtic
ular
subs
ets
ofth
eda
ta.F
orfu
rthe
rdet
ails
ofth
eba
selin
esp
ecifi
catio
n,se
eth
eno
tes
tota
ble
4.1
PAGE 97................. 15683$ $CH4 10-05-05 08:50:14 PS

98 Chapter 4
Blacks in private schools appear to do especially well, consistent with Nealand Grogger and Neal.15
The fact that the black-white test score gap essentially disappears with theinclusion of sufficient controls in ECLS is a very striking result given thatin past research a substantial gap has persisted, regardless of the age of theindividuals, the particular tests, or the covariates included (e.g., Hernsteinand Murray, Neal and Johnson, Phillips, Crouse, and Ralph).16 The mostdirect comparison to our research among previous studies is Phillips,Crouse, and Ralph, which looks at test outcomes for kindergartners in theearly cohorts of CNLSY. Although Phillips, Crouse, and Ralph have thegreatest success among earlier studies in explaining the racial differences inreading (they reduce the gap by two-thirds with their covariates), their rawgap is so large compared to ECLS that the residual gap in that paper isalmost as large as the raw gap in ECLS.
Why our results differ so sharply from previous research, and Phillips,Crouse, and Ralph, in particular, is a question of critical importance. Thereare three leading explanations for the divergence: (1) the sample of birthsincluded in CNLSY, especially in the early years, may be nonrepresentative;(2) better covariates are available in ECLS; and (3) Blacks born into recentcohorts have made real gains relative to Blacks born a decade earlier. Thefirst two explanations appear to play only a small role empirically. While itis true that the sample of births in early cohorts of CNLSY analyzed byPhillips, Crouse, and Ralph is heavily skewed toward teenage mothers,because of the way the sample is generated (i.e., by births to those includedin NLSY), the nonrandom sampling, does not seem to provide the explana-tion for the differing results. When we restrict our ECLS sample to onlyinclude children born to teen mothers, our results are virtually unchanged.17
When we try to estimate specifications in ECLS using only variables that areavailable in CNLSY, Blacks do somewhat worse than in our baseline sample(a gap of �.183 on math and .034 on reading), but this is nothing like theresidual gap of �.67 on reading in Phillips, Crouse, and Ralph.
Real gains by Blacks in recent cohorts, in contrast, does appear to be animportant part of the divergence between our results and past research. Lim-iting the CNLSY to cohorts born in the same years as the ECLS sample, theraw test score gaps in the CNLSY are nearly half as large as in earlier cohortsof CNLSY used by Phillips, Crouse, and Ralph and are remarkably close tothose found in the ECLS. On the math skills test, the raw gaps are .638 and.665 respectively in ECLS and CNLSY. For reading, the gap is .401 in ECLSand .540 in the CNLSY. Real gains by Blacks in recent years could explainthis result. Interestingly, however, using the same set of controls that yieldmath and reading gaps in ECLS of �.183 and .034 respectively, in recentcohorts of the CNLSY the estimated black-white residual gaps are �.500and �.41 on math and reading. Thus, although the raw gaps are similar in
PAGE 98................. 15683$ $CH4 10-05-05 08:50:15 PS

Losing Ground at School 99
ECLS and recent cohorts of CNLSY, larger residual gaps remain in CNLSYfor reasons we cannot explain.
THE EVOLUTION OF THE RACIAL TESTSCORE GAPS AS CHILDREN AGE
The results of the previous section demonstrate that although black testscores lag Whites by a large margin, the inclusion of a small number ofcovariates eliminates any systematic differences in the math and reading per-formances of Whites and Blacks entering kindergarten. Hispanics somewhatlag Whites, and Asians exceed all of the other races. In this section, weexplore how those racial gaps change over time.
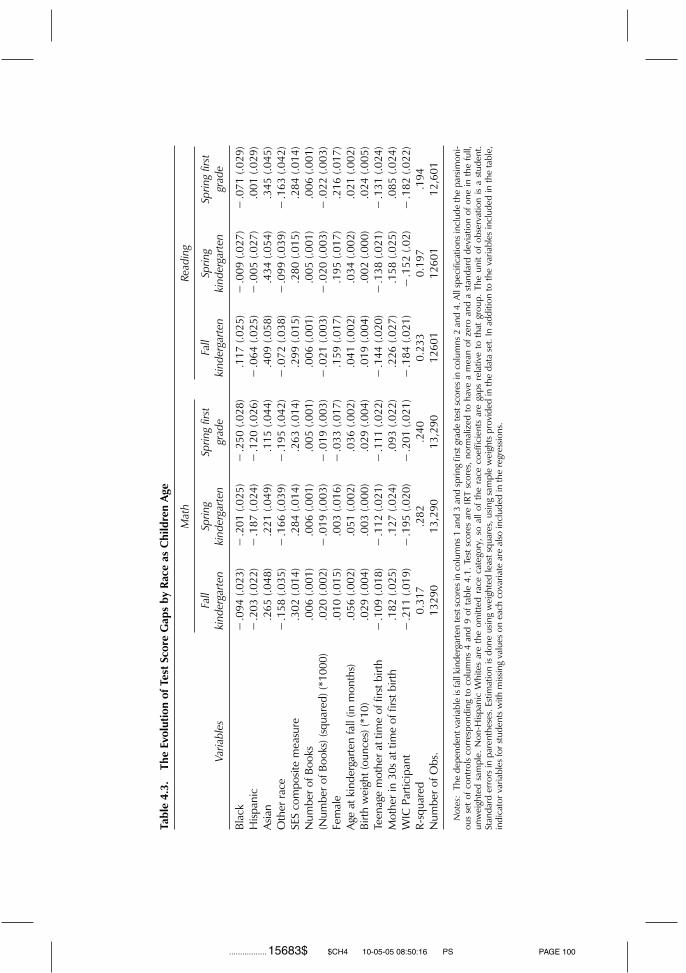
In terms of raw test scores, black students lose some ground relative toWhites between the fall of kindergarten and the spring of first grade: .090standard deviations on math and .128 standard deviations on reading. Table4.3 presents regression results for those two time periods. We report resultsonly from our ‘‘parsimonious’’ regression specification; similar racial gapsemerge when the exhaustive set of covariates is included. Controlling forother factors in the regressions, black students appear to lose much moreground than they do in the raw means: �.156 standard deviations on mathand �.188 standard deviations on reading.18 If black students in the samplecontinue to lose ground through ninth grade at the rate experienced in thefirst two years of school, they will lag white students on average by a fullstandard deviation in raw math and reading scores and over two-thirds of astandard deviation in math even after controlling for observable characteris-tics (substantially smaller for reading). Raw gaps of that magnitude would besimilar to those found in previous studies of high school age children (seeGrissmer, Flanagan, and Williamson, Hedges and Nowell, Humphreys, Phil-lips, and Phillips, Crouse, and Ralph).
In striking contrast to the black-white gap, Hispanics show gains relativeto Whites between the beginning of kindergarten and the end of first grade.Asians lose roughly as much ground as Blacks on math (although they startahead of Whites) and also fall slightly on reading. Thus, black students arenot only losing ground relative to Whites, but even more so relative to His-panics, and somewhat less compared to Asians.
WHY ARE BLACK STUDENTSLOSING GROUND IN THE FIRST TWO
YEARS OF SCHOOL?
Understanding why black students fare worse in the first two years of schoolis a question of paramount importance for two reasons. First, knowing the
PAGE 99................. 15683$ $CH4 10-05-05 08:50:16 PS
Tabl
e4.
3.Th
eEv
olut
ion
ofTe
stSc
ore
Gap
sby
Race
asC
hild
ren
Age
Varia
bles
Mat
h
Fall
kind
erga
rten
Sprin
gki
nder
gart
enSp
ring
first
grad
e
Read
ing
Fall
kind
erga
rten
Sprin
gki
nder
gart
enSp
ring
first
grad
e
Blac
k�
.094
(.023
)�
.201
(.025
)�
.250
(.028
).1
17(.0
25)
�.0
09(.0
27)
�.0
71(.0
29)
Hisp
anic
�.2
03(.0
22)
�.1
87(.0
24)
�.1
20(.0
26)
�.0
64(.0
25)
�.0
05(.0
27)
.001
(.029
)A
sian
.265
(.048
).2
21(.0
49)
.115
(.044
).4
09(.0
58)
.434
(.054
).3
45(.0
45)
Oth
erra
ce�
.158
(.035
)�
.166
(.039
)�
.195
(.042
)�
.072
(.038
)�
.099
(.039
)�
.163
(.042
)SE
Sco
mpo
site
mea
sure
.302
(.014
).2
84(.0
14)
.263
(.014
).2
99(.0
15)
.280
(.015
).2
84(.0
14)
Num
bero
fBoo
ks.0
06(.0
01)
.006
(.001
).0
05(.0
01)
.006
(.001
).0
05(.0
01)
.006
(.001
)(N
umbe
rofB
ooks
)(sq
uare
d)(*
1000
).0
20(.0
02)
�.0
19(.0
03)
�.0
19(.0
03)
�.0
21(.0
03)
�.0
20(.0
03)
�.0
22(.0
03)
Fem
ale
.010
(.015
).0
03(.0
16)
�.0
33(.0
17)
.159
(.017
).1
95(.0
17)
.216
(.017
)A
geat
kind
erga
rten
fall
(inm
onth
s).0
56(.0
02)
.051
(.002
).0
36(.0
02)
.041
(.002
).0
34(.0
02)
.021
(.002
)Bi
rth
wei
ght(
ounc
es)(
*10)
.029
(.004
).0
03(.0
00)
.029
(.004
).0
19(.0
04)
.002
(.000
).0
24(.0
05)
Teen
age
mot
hera
ttim
eof
first
birt
h�
.109
(.018
)�
.112
(.021
)�
.111
(.022
)�
.144
(.020
)�
.138
(.021
)�
.131
(.024
)M
othe
rin
30s
attim
eof
first
birt
h.1
82(.0
25)
.127
(.024
).0
93(.0
22)
.226
(.027
).1
58(.0
25)
.085
(.024
)W
ICPa
rtic
ipan
t�
.211
(.019
)�
.195
(.020
)�
.201
(.021
)�
.184
(.021
)�
.152
(.02)
�.1
82(.0
22)
R-sq
uare
d0.
317
.282
.240
0.23
30.
197
.194
Num
bero
fObs
.13
290
13,2
9013
,290
1260
112
601
12,6
01
Not
es:
The
depe
nden
tvar
iabl
eis
fall
kind
erga
rten
test
scor
esin
colu
mns
1an
d3
and
sprin
gfir
stgr
ade
test
scor
esin
colu
mns
2an
d4.
All
spec
ifica
tions
incl
ude
the
pars
imon
i-ou
sse
tof
cont
rols
corr
espo
ndin
gto
colu
mns
4an
d9
ofta
ble
4.1.
Test
scor
esar
eIR
Tsc
ores
,nor
mal
ized
toha
vea
mea
nof
zero
and
ast
anda
rdde
viat
ion
ofon
ein
the
full,
unw
eigh
ted
sam
ple.
Non
-Hisp
anic
Whi
tes
are
the
omitt
edra
ceca
tego
ry,
soal
lof
the
race
coef
ficie
nts
are
gaps
rela
tive
toth
atgr
oup.
The
unit
ofob
serv
atio
nis
ast
uden
t.St
anda
rder
rors
inpa
rent
hese
s.Es
timat
ion
isdo
neus
ing
wei
ghte
dle
asts
quar
es,u
sing
sam
ple
wei
ghts
prov
ided
inth
eda
tase
t.In
addi
tion
toth
eva
riabl
esin
clud
edin
the
tabl
e,in
dica
torv
aria
bles
fors
tude
nts
with
miss
ing
valu
eson
each
cova
riate
are
also
incl
uded
inth
ere
gres
sions
.
PAGE 100................. 15683$ $CH4 10-05-05 08:50:16 PS

Losing Ground at School 101
source of the divergence may aid in developing public policies to alleviatethe problem. Second, determining the explanation for the widening gap willhelp to determine whether the simple linear extrapolation over the academiccareer is a plausible conjecture.
There are a number of plausible explanations as to why the racial gap intest scores grows as children age: (1) black children attend lower qualityschools on average; (2) the importance of parental/environmental contribu-tions may grow over time. Since black children are on average disadvantagedin this regard, they fall behind; and (3) because of worse home and neighbor-hood environments, black students suffer worse ‘‘summer setbacks’’ whenschool is not in session.19 We address each of these hypotheses in turn.
Are Black Students Losing Ground Because They AttendWorse Schools?
There is substantial racial segregation in school attendance in the UnitedStates. Our data samples roughly twenty children each from approximately1,000 schools. In 35 percent of those schools, there is not a single black childin the sample.20 The mean black student in our sample attends a school thatis 59 percent black and 8 percent Hispanic. In contrast, the typical whitestudent goes to a school that is only 6 percent black and 5 percent Hispanic.Given that Blacks and Whites have relatively little overlap in the schools theyattend, differences in school quality are plausible explanations for why blackstudents are losing ground.21
Because our data set has many individuals from each school included inthe sampling frame, school-fixed effects can be included in the estimation.With school-fixed effects, the estimated black-white test score gap is identi-fied off of the relative performance of Blacks and Whites attending the sameschool, as opposed to across schools. To the extent that differential averageschool quality across races is the complete explanation for the wideningracial test score gap, one would predict that the gap should not widen overtime when comparing Blacks and Whites attending the same school. Thereare, of course, thorny issues of sample selection that potentially complicatethe interpretation of these results: white students who elect to attend schoolswith black students may have differential test score trajectories than otherwhite students, even if they had gone to all white schools. Nonetheless, look-ing within schools provides a first attempt at testing this hypothesis.
The comparison of changes in the black-white test score gap over timeincluding and excluding school-fixed effects is presented in table 4.4. All ofthe specifications in the table include the parsimonious set of covariates,although only the coefficient on the black-white gap is shown in the table.The first three columns reflect the full sample of students. The remainingcolumns restrict the sample to schools that have both black and white chil-
PAGE 101................. 15683$ $CH4 10-05-05 08:50:17 PS
Tabl
e4.
4.D
oes
Diff
eren
tialS
choo
lQua
lity
Expl
ain
Blac
kSt
uden
tsLo
sing
Gro
und:
AC
ompa
riso
nof
Cro
ss-s
choo
land
With
in-s
choo
lEs
timat
esof
the
Test
Scor
eTr
ajec
tory
byRa
ce(V
alue
sre
port
edin
tabl
ear
eth
eco
effic
ient
onth
eva
riab
leBl
ack)
Full
Sam
ple
ofSt
uden
ts
(1)
(2)
Excl
udin
gSt
uden
tsAt
tend
ing
All-W
hite
Scho
ols
(3)
(4)
(5)
(6)
(7)
(8)
(9)
Subj
ect
Fall
kind
erga
rten
Sprin
gfir
stgr
ade
Diff
eren
ce(2
)-(1)
Fall
kind
erga
rten
Sprin
gfir
stgr
ade
Diff
eren
ce(5
)-(4)
Fall
kind
erga
rten
Sprin
gfir
stgr
ade
Diff
eren
ce(8
)�(7
)
Mat
h�
.094
�.2
50�
.156
�.1
36�
.261
�.1
25�
.175
�.2
22�
.047
(.023
)(.0
28)
(.036
)(.0
28)
(.034
)(.0
44)
(.034
)(.0
40)
(.052
)
Read
ing
.117
�.0
71�
.188
.072
�.0
84�
.156
�.0
07�
.057
�.0
5(.0
25)
(.029
)(.0
38)
(.030
)(.0
35)
(.046
)(.0
38)
(.042
)(.0
57)
Incl
ude
scho
ol-fi
xed
effe
cts
inre
gres
sion?
NN
NN
NN
YY
Y
Num
bero
fObs
.13
,290
6,53
2
Not
es:
Entr
ies
inth
eta
ble
are
estim
ates
ofth
eBl
ack-
Whi
tete
stsc
ore
gap,
cont
rolli
ngfo
rth
epa
rsim
onio
usse
tof
regr
esso
rs.C
olum
ns3,
6,an
d9
repr
esen
tth
ees
timat
edch
ange
inth
ega
pbe
twee
nki
nder
gart
enfa
llan
dfir
stgr
ade
sprin
g.Th
efir
stth
ree
colu
mns
incl
ude
alls
tude
nts.
The
rem
aini
ngco
lum
nsre
stric
tthe
data
sett
osc
hool
sth
atha
dst
uden
tsof
diffe
rent
race
sin
clud
edin
the
ECLS
-Ksa
mpl
e.Th
efin
alth
ree
colu
mns
incl
ude
scho
ol-fi
xed
effe
cts.
Estim
atio
nis
done
usin
gw
eigh
ted
leas
tsq
uare
s,us
ing
sam
ple
wei
ghts
prov
ided
inth
eda
tase
t.
PAGE 102................. 15683$ $CH4 10-05-05 08:50:17 PS
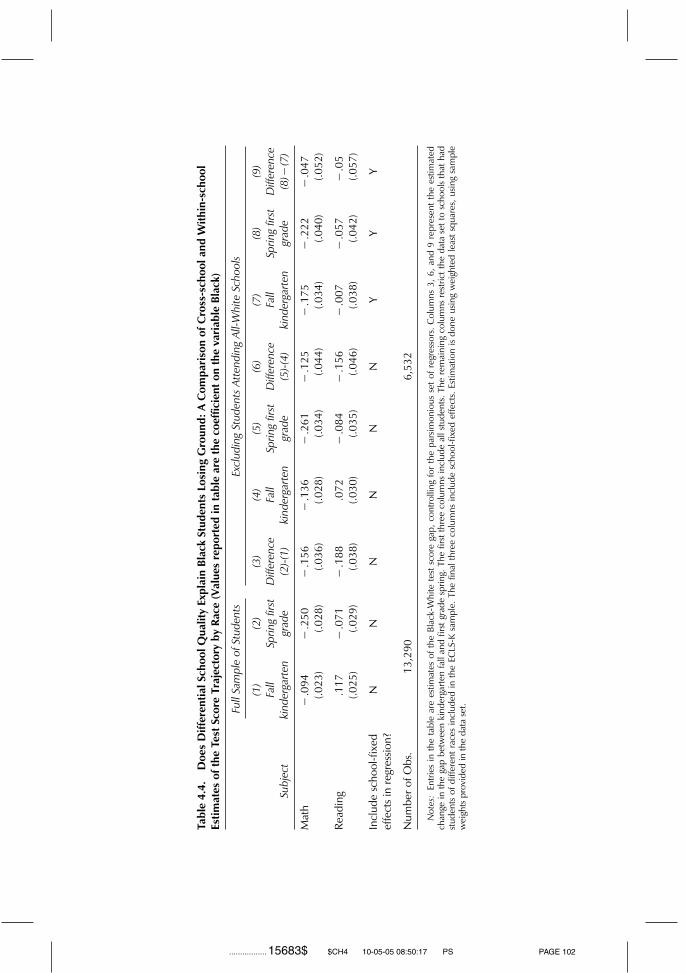
Losing Ground at School 103
dren in our sample. This set of students is relevant because only mixed-raceschools provide useful variation to identify the racial test score gap whenschool-fixed effects are included.
Column 3 of the table shows the baseline results reflecting the fact thatBlacks are losing ground in the full sample (�.156 standard deviations rela-tive to Whites in math, �.188 standard deviations in reading). When weeliminate students attending all-white schools from the sample, but other-wise estimate identical specifications, the results are not greatly affected (norare they affected by eliminating students attending all black schools). Blackscontinue to lose substantial ground by the end of first grade. When school-fixed effects are included in the regression (columns 7–9), the black-whitetest-score gap is identified off of differences between Blacks and Whitesattending the same school. The estimates of ground lost by Blacks shrinks toless than one-third of the magnitude in the full sample, and is not statisticallydifferent from zero in these specifications.22
These findings are consistent with—but not definitive proof of—the argu-ment that systematic differences in school quality for Blacks and Whites mayexplain the divergence in test scores. An alternative explanation is thatWhites who choose to attend schools with Blacks are systematically worsethan other Whites. Note, however, that a comparison of columns 1 and 4show that in the fall of kindergarten black students actually fare somewhatworse relative to Whites who attend schools with Blacks then they do withthe full sample of Whites. This finding suggests that the Whites who go toschool with Blacks (controlling for observables) actually achieve at a slightlyhigher level than do those who attend all-white schools, which is consistentwith previous research. Moreover, comparing columns 4 and 7, in kindergar-ten fall, Blacks do even worse relative to Whites attending the same schoolthan they do compared to other Whites. Thus, a simple selection story inwhich low-achieving Whites are more likely to go to school with Blacks isnot consistent with the data. On the other hand, we cannot rule out a priorithe possibility that Whites who attend school with Blacks are on lower aca-demic trajectories, despite the fact that they initially score better on teststhan other Whites.
If Blacks attend worse schools than Whites on average, one might expectthat this would be reflected in observable characteristics of the schools.Table 4.5 analyzes this issue. Each row of the table corresponds to a differ-ent measure of school quality. Column 1 presents means and standard devi-ations of each variable in the data, some of which are standard measures ofschool inputs (e.g., average class size, teacher education) and others that arenontraditional (e.g., measures of gang problems and loitering). Unfortu-nately, the nontraditional measures are subjective responses by the schoolprincipal, administrator, or other person in charge to questions of how seri-
PAGE 103................. 15683$ $CH4 10-05-05 08:50:18 PS

Tabl
e4.
5.D
iffer
ence
sac
ross
Race
sin
Mea
sura
ble
Scho
olIn
puts
Scho
olIn
put
Mea
nof
Scho
olIn
put
Coe
ffici
ento
nRa
cein
Pred
ictin
gLe
velo
fSch
oolI
nput
:
Blac
kH
ispan
icAs
ian
Oth
er
Aver
age
Cla
ssSi
ze20
.673
(3.8
75)
.591
(.340
).6
99(.2
71)
.799
(.349
)�
.259
(.343
)Te
ache
rHas
Mas
ter’s
Deg
ree
.280
(.449
).0
37(.0
28)
.012
(.025
)�
.001
(.032
)�
.080
(.032
)C
ompu
ter:
Stud
entR
atio
1.25
7(2
.050
).0
03(.1
56)
�.1
31(.1
40)
.040
(.119
).6
83(.4
43)
Inte
rnet
Hoo
kup:
Stud
entR
atio
.344
(.627
)�
.048
(.037
)�
.032
(.038
).0
20(.0
35)
.377
(.186
)Pe
rcen
tofS
tude
nts
inSc
hool
with
Free
Lunc
h29
.83
(27.
98)
19.3
2(2
.64)
8.17
(2.0
0)3.
27(2
.08)
6.81
(2.7
8)G
ang
Prob
lem
sin
Scho
ol(1
–3)
1.40
9(.5
85)
.261
(.058
).3
38(.0
44)
.128
(.044
).3
36(.0
69)
Prob
lem
sw
ithTe
ache
rTur
nove
r(1–
5)1.
811
(.943
).2
63(.0
83)
.227
(.064
).0
62(.0
78)
.132
(.092
)Li
tterA
roun
dSc
hool
(0–3
).7
41(.7
59)
.492
(.065
).3
69(.0
53)
.240
(.063
).4
12(.0
87)
Peop
leLo
iterin
gA
roun
dSc
hool
(0–3
).5
24(.7
47)
.497
(.079
).3
31(.0
64)
.171
(.063
).3
68(.0
88)
Rece
ives
PTA
Fund
ing
.733
(.442
)�
.048
(.033
)�
.050
(.026
).0
00(.0
29)
�.1
33(.0
50)
Hal
lPas
sRe
quire
d.4
25(.4
94)
.194
(.037
).1
00(.0
34)
.010
(.041
).0
59(.0
46)
Not
es:
The
valu
esin
the
first
colu
mn
ofth
eta
ble
are
the
mea
nsan
dst
anda
rdde
viat
ions
ofth
ena
med
scho
olin
put.
The
entr
ies
inth
ere
mai
ning
colu
mns
are
estim
ated
coef
ficie
ntso
nra
ce(w
ithno
n-H
ispan
icW
hite
sas
the
omitt
edca
tego
ries)
from
regr
essio
nsof
the
nam
edsc
hool
inpu
tson
the
race
dum
mie
san
dot
herc
ovar
iate
sinc
lude
din
the
pars
imon
ious
seto
fcon
trol
s.Th
em
etho
dof
estim
atio
nis
wei
ghte
dle
asts
quar
esus
ing
sam
ple
wei
ghts
prov
ided
byEC
LS.T
here
port
edst
anda
rder
rors
have
been
corr
ecte
dto
take
into
acco
untw
ithin
-sch
oolc
orre
latio
nin
the
scho
ol-le
velm
easu
res.
PAGE 104................. 15683$ $CH4 10-05-05 08:50:18 PS

Losing Ground at School 105
ous problems such as gangs are at the school. Consequently, these measuresare likely to be of poor quality. Columns 2–5 report the race coefficientsfrom regressions that are parallel to those elsewhere in the paper, exceptthat school inputs are the dependent variable rather than test scores. Thus,the entries in columns 2–5 reflect the extent to which children of other racesattend higher or lower quality schools on each of the measures, controllingfor our parsimonious set of covariates. On traditional measures of schoolquality such as class size, teacher’s education, computers in class, andInternet connections, differences between Blacks and Whites are small. Onthe other hand, the percentage of students eligible for free lunch, the degreeof gang problems in school, the amount of loitering in front of the schoolby nonstudents, and the amount of litter around the schools are muchhigher for Blacks.
There are important weaknesses in the argument that differential schoolquality explains the divergent trajectories of Whites and Blacks. First, theobservable measures of school inputs included in table 4.5 explain only asmall fraction of the variation in student outcomes. For instance, adding theschool input measures to our basic student-level test-score regressions onlyincreases the R-squared of the regression by .05. Second, even after theschool input measures are added to the test-score regressions, the gapbetween Blacks and Whites continues to widen. Third, both Hispanics andAsians also experience worse schools than Whites, but neither of thosegroups is losing ground. Because of these important weaknesses in thestory—perhaps as a consequence of poor school quality measures in thedata—the evidence linking school quality differences to the divergent trajec-tories of Blacks can be characterized as no more than suggestive. Does theimportance of parental/environmental inputs grow as children age?
Black children tend to grow up in environments less conducive to higheducational attainment. If the importance of parental/environmental inputsgrows as children age, Black students would be expected to lose ground rela-tive to Whites. The evidence in table 4.3, however, argues just the opposite.If that were true, than one would expect to observe the raw gaps wideningbetween Blacks and Whites, but to the extent our control variables ade-quately capture a child’s environment, the residual gap after including all thecovariates would remain constant. In fact, however, the residual gap increasesmore than the raw gap contradicting this explanation.23 Also, the magnitudeof the coefficients on socioeconomic status, age at kindergarten entry, andmother’s age at first birth are smaller in the first-grade test-score regressions.That suggests that the relative importance of nonschool factors decreasesover time, presumably because schools become a critical input into educa-tional gains once children enter school.24 Interestingly, the importance ofschool safety measures (e.g., gang problems, metal detectors, etc.) seem tobecome more important as children age.
PAGE 105................. 15683$ $CH4 10-05-05 08:50:18 PS
106 Chapter 4
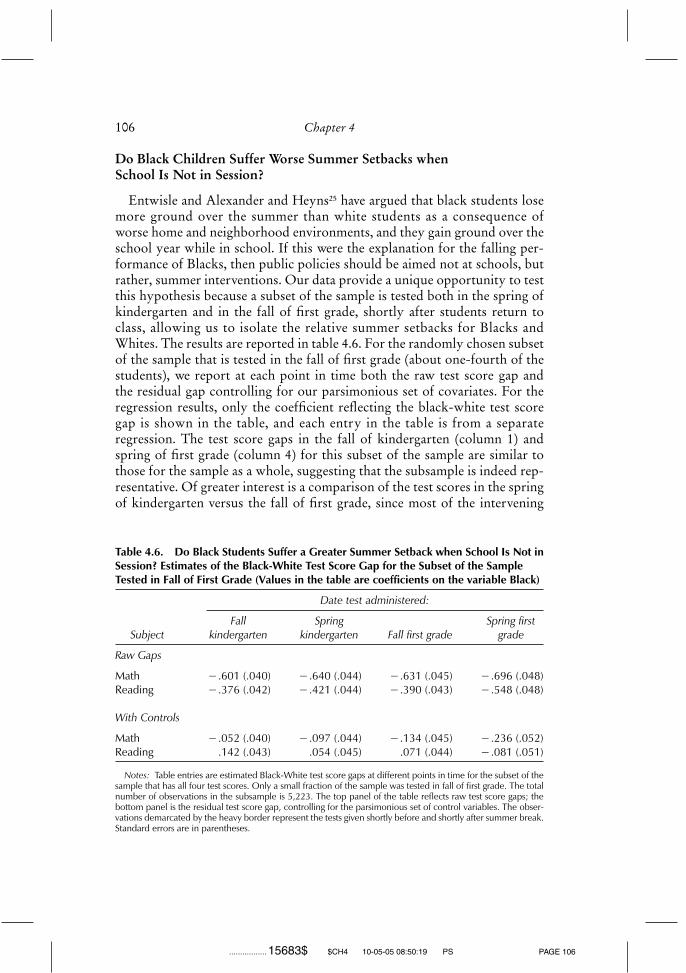
Do Black Children Suffer Worse Summer Setbacks whenSchool Is Not in Session?
Entwisle and Alexander and Heyns25 have argued that black students losemore ground over the summer than white students as a consequence ofworse home and neighborhood environments, and they gain ground over theschool year while in school. If this were the explanation for the falling per-formance of Blacks, then public policies should be aimed not at schools, butrather, summer interventions. Our data provide a unique opportunity to testthis hypothesis because a subset of the sample is tested both in the spring ofkindergarten and in the fall of first grade, shortly after students return toclass, allowing us to isolate the relative summer setbacks for Blacks andWhites. The results are reported in table 4.6. For the randomly chosen subsetof the sample that is tested in the fall of first grade (about one-fourth of thestudents), we report at each point in time both the raw test score gap andthe residual gap controlling for our parsimonious set of covariates. For theregression results, only the coefficient reflecting the black-white test scoregap is shown in the table, and each entry in the table is from a separateregression. The test score gaps in the fall of kindergarten (column 1) andspring of first grade (column 4) for this subset of the sample are similar tothose for the sample as a whole, suggesting that the subsample is indeed rep-resentative. Of greater interest is a comparison of the test scores in the springof kindergarten versus the fall of first grade, since most of the intervening
Table 4.6. Do Black Students Suffer a Greater Summer Setback when School Is Not inSession? Estimates of the Black-White Test Score Gap for the Subset of the SampleTested in Fall of First Grade (Values in the table are coefficients on the variable Black)
Date test administered:
Fall Spring Spring firstSubject kindergarten kindergarten Fall first grade grade
Raw Gaps
Math �.601 (.040) �.640 (.044) �.631 (.045) �.696 (.048)Reading �.376 (.042) �.421 (.044) �.390 (.043) �.548 (.048)
With Controls
Math �.052 (.040) �.097 (.044) �.134 (.045) �.236 (.052)Reading .142 (.043) .054 (.045) .071 (.044) �.081 (.051)
Notes: Table entries are estimated Black-White test score gaps at different points in time for the subset of thesample that has all four test scores. Only a small fraction of the sample was tested in fall of first grade. The totalnumber of observations in the subsample is 5,223. The top panel of the table reflects raw test score gaps; thebottom panel is the residual test score gap, controlling for the parsimonious set of control variables. The obser-vations demarcated by the heavy border represent the tests given shortly before and shortly after summer break.Standard errors are in parentheses.
PAGE 106................. 15683$ $CH4 10-05-05 08:50:19 PS

Losing Ground at School 107
time was spent outside of school. On the raw scores, there is little differencebefore and after the summer break; to the extent there is any gap, it favorsblack students. With controls, black students lose slightly relative to Whitesover the summer on math (the gap rises from -.097 to -.134), but the nullhypothesis of no change cannot be rejected. The point estimates for readingshow slight gains by black students relative to Whites over the summer.Thus, the empirical results lend little support to the hypothesis that differen-tial summer setbacks explain the lost ground of black students in our sample.We do observe Blacks losing ground during the school year in both subjectsin both years, in direct conflict with Entwisle and Alexander.
CONCLUSION
Previous efforts to explain the black-white test score gap have generallyfallen short—a substantial residual remained for black students, even aftercontrolling for a full set of available covariates. Using a new data set, wedemonstrate that among entering kindergartners, the black-white gap in testscores can be essentially eliminated by controlling for just a small number ofobservable characteristics of the children and their environment. Once stu-dents enter school, the gap between white and black children grows, evenconditional on observable factors. We test a number of possible explanationsfor why Blacks lose ground. We speculate that Blacks are losing ground rela-tive to Whites because they attend lower quality schools, though we recog-nize that we have not provided definitive proof. This is the only hypothesisthat receives any empirical support. To convincingly test this hypothesis, weneed more detailed data on schools, neighborhoods, and the general environ-ment kids grow up in.
Compared to previous studies, our results provide reason for optimism.Research on earlier cohorts of children found much greater black-white testscore gaps, both in the raw scores and controlling for observables. When weattempt to mimic the nonrandom sample frames in earlier research (forexample only looking at low birth-weight babies as in IHDP), we continueto find much smaller gaps in our sample. One plausible explanation for thedifferences between the current sample and cohorts attending kindergartenten to thirty years ago is that the current cohort of Blacks has made realgains relative to Whites. Recent cohorts show smaller black-white gaps inthe raw data, across multiple data sets, which gives us reason for optimism.
DATA APPENDIX
The Early Childhood Longitudinal Study Kindergarten Cohort (ECLS-K)is a nationally representative sample of 21,260 children entering kindergarten
PAGE 107................. 15683$ $CH4 10-05-05 08:50:19 PS
108 Chapter 4
in 1998. Thus far, information on these children has been gathered at fourseparate points in time. The full sample was interviewed in the fall and springof kindergarten and spring of first grade. All of our regressions and sum-mary statistics are weighted, unless otherwise noted, and we include dum-mies for missing data. We describe below how we combined and recodedsome of the ECLS variables used in our analysis.
Socioeconomic Composite Measure
The socioeconomic scale variable (SES) was computed by ECLS at thehousehold level for the set of parents who completed the parent interview infall kindergarten or spring kindergarten. The SES variable reflects the socio-economic status of the household at the time of data collection for springkindergarten. The components used for the creation of SES were: Father/male guardian’s education; Mother/female guardian’s education; Father/maleguardian’s occupation; Mother/female guardian’s occupation; and House-hold income.
Number of Children’s Books
Parents/guardians were asked ‘‘How many books does your child have inyour home now, including library books?’’ Answers ranged from 0 to 200.
Child’s Age
We used the Child’s Age at Assessment Composite variable provided byECLS. The child’s age was calculated by determining the number of daysbetween the child assessment date and the child’s date of birth. The valuewas then divided by 30 to calculate the age in months.
Birth Weight
Parents were asked how much their child weighed when they were born.We multiplied the pounds by 16 (and added it to the ounces) to calculatebirth weight in ounces.
Mother’s Age at First Birth
Mothers were asked how old they were at the birth of their first child.
Average Class Size
We computed each child’s average class size over their kindergarten yearby adding their class size in the fall and spring and dividing by two.
PAGE 108................. 15683$ $CH4 10-05-05 08:50:20 PS

Losing Ground at School 109
Teacher Has Master’s Degree
We coded a dummy variable equal to one if the child’s teacher has a mas-ter’s degree or above.
Computer-Student Ratio
The number of computers in each school and the total enrollment of eachkindergarten program is provided by the ECLS based on a survey given toeach school. We divided the number of computers in each school by the totalenrollment in kindergarten to produce this ratio.
Internet Hook-Up Student Ratio
This was constructed similar to the Computer:Student ratio, except thenumerator consists of Internet/LAN connections in the school.
Percent of Students in Child’s School Available for FreeLunch
Schools provided the percent of students in their school who were eligiblefor free lunch.
Gang Problems
Schools were asked: ‘‘How much of a problem are gangs in the neighbor-hood where the school is
located?’’ We coded this variable so that 1 implies ‘‘no problem,’’ 2 implies‘‘somewhat of a problem,’’ and 3 implies ‘‘big problem.’’
Teacher Turnover
Schools were asked how much they agreed with the statement ‘‘teacherturnover is a problem in this school.’’ Answers range from 0 to 5, 0 indicat-ing they strongly disagree and 5 indicating they strongly agree.
Litter around School
The ECLS interviewer was asked to report the amount of litter aroundeach school. The variable ranges from 0 to 3. 0 indicates no litter and 3 indi-cates ‘‘a lot.’’
PAGE 109................. 15683$ $CH4 10-05-05 08:50:20 PS
110 Chapter 4
People Loitering around School
The ECLS interviewer was asked to report the amount of loitering bynonstudents around the school. The variable ranges from 0 to 3, 0 indicatingno loitering and 3 indicating ‘‘a lot.’’
PTA Funding
Schools reported whether or not they receive supplemental funding fromtheir PTA. We recoded this variable so that 1 implies yes and 0 implies no.
Hall Pass Required
Schools were asked: ‘‘Are hall passes required to ensure the safety of thechildren in your school?’’ This variable is coded 1 if yes and 0 if no.
NOTES
This chapter originally appeared as ‘‘Understanding the Black-White Test Score Gapin the First Two Years of School,’’ The Review of Economics and Statistics 86, no. 2(May 2004):465–480. We are grateful to Josh Angrist, Janet Currie, Michael Green-stone, Christopher Jenks, Alan Krueger, James Heckman, Susan Mayer, Derek Neal,Meredith Phillips, Barbara Schneider, and two anonymous referees for helpful com-ments and suggestions. Financial support was provided by the National ScienceFoundation (Fryer and Levitt). Correspondence can be addressed either to RolandFryer, Jr., American Bar Foundation, 750 N. Lake Shore Drive, Chicago, IL 60611,or to Steven Levitt, Department of Economics 1126 E. 59th Street, University of Chi-cago, Chicago, IL 60637. E-mail: [email protected], [email protected].
1. See W. Baughman and W. Dahlstrom, Negro and White Children: A Psycholog-ical Study in the Rural South (New York: Academic Press, 1968); B. A. Braken, E.Sabers, and W. Insko, ‘‘Performance of Black and White Children on the BrackenBasic Concept Scale,’’ Psychology in Schools 24, no. 1 (1987):22–27; Jeanne Brooks-Gunn et al., ‘‘Do Neighborhoods Influence Child and Adolescent Development?’’American Journal of Sociology 99, no. 2 (1993):353–395; Jeanne Brooks-Gunn, GregJ. Duncan, and Pamela Klebanov, ‘‘Economic Deprivation and Early-ChildhoodDevelopment,’’ Child Development 65, no. 2 (1994):296–318 and ‘‘Ethnic Differ-ences in Children’s Intelligence Test Scores: Role of Economic Deprivation, HomeEnvironment and Maternal Characteristics,’’ Child Development 67 (1996):396–408;James Coleman et al., Equality of Educational Opportunity (Washington DC: U.S.Government Printing Office, 1966); Richard J. Coley, ‘‘An Uneven Start: Indicatorsof Inequality in School Readiness,’’ Educational Testing Service Report, Princeton,NJ, March 2002; Richard J. Hernstein and Charles Murray, The Bell Curve: Intelli-gence and Class Structure in American Life (New York: The Free Press, 1994); LloydHumphreys, ‘‘Trends in Levels of Academic Achievement of Blacks and Other
PAGE 110................. 15683$ $CH4 10-05-05 08:50:20 PS
Losing Ground at School 111
Minorities,’’ Intelligence 12 (1988):231–260; Arthur Jensen, ‘‘How Much Can WeBoost IQ and Scholastic Achievement?’’Harvard Educational Review 39(1969):1–123 and Educability and Group Differences (New York: The Free Press,1973); A. Kaufman and N. Kaufman, K-ABC: Kaufman Assessment Battery for Chil-dren (Circle Pines, MN: American Guidance Services, 1983); E. Krohn and R. Lamp,‘‘Current Validity of the Stanford-Binet Fourth Edition and K-ABC for Head StartChildren,’’ Journal of Psychology 27 (1989):59–67; J. Naglieri, ‘‘WISC-R and K-ABCComparison for Matched Samples of Black and White Children,’’ Journal of SocialPsychology 24 (1986):81–88; Meredith Phillips et al., ‘‘Family Background, ParentingPractices, and the Black-White Test Score Gap,’’ in The Black-White Test Score Gap,Christopher Jencks and Meredith Phillips, eds. (Washington, DC: Brookings Institu-tion Press, 1998), pp. 103–145; Meredith Phillips, ‘‘Understanding Ethnic Differencesin Academic Achievement: Empirical Lessons from National Data,’’ in AnalyticIssues in the Assessment of Student Achievement, David Grissmer and Michael Ross,eds. (Washington DC: U.S. Department of Education, National Center for EducationStatistics, 2000), pp. 103–132; and Sandra Scarr, Race, Social Class and IndividualDifferences in I. Q. (Hillsdale, NJ: Lawrence Erlbaum Associates, 1981).
2. See Derek Neal and William R. Johnson, ‘‘The Role of Pre-Market Factors inBlack-White Wage Differences,’’ Journal of Political Economy 104 (1996):869–895and June O’Neill, ‘‘The Role of Human Capital in Earnings Differences betweenBlack and White Men,’’ Journal of Economic Perspectives 4, no. 4 (1990):25–46.
3. To this effect, Jenks and Phillips write: ‘‘Reducing the black-white test scoregap would do more to promote racial equality than any other strategy that com-mands broad political support.’’
4. See Hernstein and Murray, The Bell Curve; Jensen, Educability and GroupDifferences; and Arthur Jensen, The G Factor: The Science of Mental Ability (West-port, CT: Greenwood Publishing Group, 1998); Greg Armor, ‘‘Why Is Black Educa-tional Achievement Rising?’’ Public Interest (September 1992):65–80; Jeanne Brooks-Gunn and Greg J. Duncan, eds., The Consequences of Growing Up Poor (New York:Russell Sage, 1997); Susan E. Mayer, What Money Can’t Buy: Family Income andChildren’s Life Chances (Cambridge, MA: Harvard University Press, 1997); Phillipset al. 1998; Michael Cook and William Evans, ‘‘Families or Schools? Explaining theConvergence in White and Black Academic Performance,’’ Journal of Labor Econom-ics 18, no. 4 (2000):729–754; Lisa Delpit, Other Peoples Children: Cultural Conflictin the Classroom (New York: The New Press, 1995); Ronald F. Ferguson, ‘‘Teachers’Perceptions and Expectations and the Black-White Test Score Gap,’’ in The Black-White Test Score Gap, Jencks and Phillips, eds., 273–317; William Rodgers and Wil-liam Spriggs, ‘‘What Does AFQT Really Measure: Race, Wages, Schooling and theAFQT Score,’’ The Review of Black Political Economy 24, no. 4 (1996):13–46; PhillipCook and Jens Ludwig, ‘‘The Burden of ‘Acting White’: Do Black Adolescents Dis-parage Academic Achievement?’’ in The Black-White Test Score Gap, Jencks andPhillips, eds., 375–400; Signithia Fordham and John Ogbu, ‘‘Black Students’ SchoolSuccesses: Coping with the Burden of Acting White,’’ The Urban Review 18, no. 3(1986):176–206; Roland Fryer, ‘‘An Economic Approach to Cultural Capital,’’ 2002,Working Paper (Chicago: University of Chicago Press); C. Steele and J. Aronson,‘‘Stereotype Threat and the Test Performance of Academically Successful AfricanAmericans,’’ in The Black-White Test Score Gap, Jencks and Phillips, eds., 401–430.
PAGE 111................. 15683$ $CH4 10-05-05 08:50:21 PS
112 Chapter 4
5. On a test of general knowledge, a racial test-score gap persists. On a subjectiveteacher assessment of general knowledge, however, there is no difference betweenBlacks and Whites in fall of kindergarten.
6. Neither Hispanics nor Asians experience this widening test score gap overtime. Indeed, Hispanic children systematically close the gap relative to Whites, pre-sumably because their initial scores are artificially low as a consequence of limitedEnglish proficiency among some Hispanic parents.
7. Lyle V. Jones, Nancy Burton, and Ernest Davenport, Mathematics Achieve-ment Levels of Black and White Youth (Chapel Hill: University of North Carolina,L.L. Thurstone Psychometric Laboratory, 1982); Phillips, ‘‘Understanding EthnicDifferences’’; Meredith Phillips, James Crouse, and John Ralph, ‘‘Does the Black-White Test Score Gap Widen after Children Enter School?’’ in The Black-White TestScore Gap, Jencks and Phillips, eds., 229–272.
8. This pattern is also consistent with self-selection of low-achieving Whites intoschools attended by Blacks. Casting doubt on this alternative explanation is the factthat Whites who go to school with Blacks have baseline test scores upon enteringkindergarten that are similar to those who are in all-white classes (Humphreys,‘‘Trends in Levels of Academic Achievement,’’ documents a similar finding amonghigh school students). When we eliminate from the sample Whites who have no blackchildren in their class (more than 60 percent of all white children fall into this cate-gory), we obtain similar results.
9. In particular, Hernstein and Murray’s controversial book, The Bell Curve,published in 1994, ignited interest in the subject by arguing that genetic differencesare the primary explanation for the differences between Blacks and Whites inachievement test scores. For excellent summaries of the book, see James J. Heckman,‘‘Lessons from The Bell Curve,’’ Journal of Political Economy 103, no. 5 (1995):1091–1120 and Arthur Goldberg and Charles Manski, ‘‘Review Article: The Bell Curve,’’Journal of Economic Literature 33, no. 2 (1995):762–776. Examples of the discussionthat emerged include Bernie Devlin, Daniel Resnick, and Kathryn Roeder, Intelli-gence, Genes, and Success: Scientists Respond to the Bell Curve (New York: Coperni-cus Books, 1998); Steven Fraser, The Bell Curve Wars: Race Intelligence, and theFuture of America (New York: Basic Books, 1995); and Joe Kincheloe, Shirley Stein-berg, and Aaron Gresson, Measured Lies: The Bell Curve Reexamined (New York:St. Martins Press, 1997).
10. See Brooks-Gunn and Duncan, The Consequences of Growing Up Poor;Mayer, What Money Can’t Buy; Jeanne Brooks-Gunn, P. K. Klebanov, and Greg J.Duncan, ‘‘Ethnic Differences in Children’s Intelligence Test Scores: Role of Eco-nomic Deprivation, Home Environment, and Maternal Characteristics,’’ ChildDevelopment 67, no. 2 (1995):396–408; Jeanne Brooks-Gunn and Greg J. Duncan,‘‘Family Poverty, Welfare Reform and Child Development,’’ Child Development 71,no. 1 (2000):188–196.
11. David Grissmer, Ann Flanagan, and Stephanie Williamson, ‘‘Why Did theBlack-White Score Gap Narrow in the 1970’s and 1980’s?’’ in The Black-White TestScore Gap, Jencks and Phillips, eds., 182–228; Larry Hedges and Amy Nowell,‘‘Black-White Test Score Convergence since 1965,’’ in The Black-White Test ScoreGap, Jencks and Phillips, eds., 149–181; Humphreys, ‘‘Trends in Levels of AcademicAchievement.’’
PAGE 112................. 15683$ $CH4 10-05-05 08:50:21 PS

Losing Ground at School 113
12. In addition, there is an ECLS birth cohort that tracks a nationally representa-tive sample of over 15,000 children born in 2001 through the first grade.
13. The marginal benefit associated with one additional book decreases as morebooks are added. Beyond roughly 150 books, the marginal impact turns negative.Only 16 percent of the sample lies above this cutoff point.
14. Roland Fryer and Steven Levitt, ‘‘The Black-White Test Score Gap in the FirstTwo Years of School,’’ The Review of Economics and Statistics 86 (2004):447–464, testa more exhaustive set of possibilities.
15. We have also experimented with limiting the sample to the set of children forwhom there is substantial overlap across races in background characteristics. Morespecifically, we ran probits with an indicator variable for black as the dependent vari-able and the full set of covariates as predictors. When we drop from the sample theroughly 30 percent of students whose predicted probability of being black is less than10 percent or greater than 90 percent, the black-white gap on math rises slightly andthe reading gap becomes closer to zero.
16. The exceptions we are aware of in which the black-white test score gap hasbeen made to disappear are Crane (1998)[[PLEASE SUPPLY ALL INFO FORTHIS]]; Kai Li and Dale J. Poirier, ‘‘The Roles of Birth Inputs and Outputs in Pre-dicting Health, Behavior, and Test Scores at Age Five or Six,’’ 2002[[OR 2001.WHICH IS CORRECT??),Working Paper, [[LOCATION??]]; and Pedro Carneiroand James Heckman, ‘‘Human Capital Policy,’’ 2002, Working Paper, The Universityof Chicago. Li and Poirier, ‘‘The Roles of Birth Inputs and Outputs,’’ using a Bayes-ian structural model, find no systematic differences between Blacks and Whites usingthe NLSY. Hernstein and Murray, The Bell Curve, and Meredith Phillips, JamesCrouse, and John Ralph, ‘‘Does the Black-White Test Score Gap Widen after Chil-dren Enter School?’’ in The Black-White Test Score Gap, Jencks and Phillips, eds.,229–272, using different methods on the same data, find large gaps still persists.Using CNLSY, Crane (1998)[[NOT IN REFS]] and Carneiro and Heckman,‘‘Human Capital Policy,’’ find that on some tests, racial gaps disappear with controls,although large gaps remain on other tests designed to capture similar sets of skills.
It is important to note that on the test of general knowledge in ECLS, the black-white gap does not fully disappear. Black students test almost one full standard devi-ation behind Whites in a raw comparison of means. That gap falls to .3 when controlsare included. On the subjective teacher assessments, the raw gap in general knowl-edge between Blacks and Whites is much smaller (.25 standard deviations) and doesshrink almost to zero with the inclusion of controls.
17. Our results are also unchanged when we limit our ECLS sample to low birth-weight babies, who are oversampled in IHDP, another data set analyzed by Phillips,Crouse, and Ralph, ‘‘Does the Black-White Test Score Gap Widen?’’
18. Similar results (not shown in the table) are obtained when we include the fullset of nearly 100 covariates. In those specifications, black students lose .136 standarddeviations on math and .109 standard deviations on reading. Including the fall kin-dergarten test score as a covariate predicting the spring first grade test score also haslittle impact on the results: black students lose .192 (.140) standard deviations in math(reading).
19. Fryer and Levitt, ‘‘The Black-White Test Score Gap,’’ test a more exhaustiveset of possibilities.
PAGE 113................. 15683$ $CH4 10-05-05 08:50:22 PS
114 Chapter 4
20. Black students may attend these schools, but just not be in the classrooms sam-pled.
21. Because elementary school students attend schools close to home, there is noway for us to distinguish between the impact of neighborhood and school quality inour data set. Note, however, that we are able to explain racial gaps upon entry toschool without using controls for the neighborhood environment. For neighbor-hoods rather than schools to explain the racial divergence in test scores, the qualityof the neighborhood would need to have a large impact on test scores after entry intoschool, but not before.
22. This finding in some ways parallels the findings in Janet Currie and DuncanThomas, ‘‘School Quality and the Longer Term Effects of Head Start.’’ Journal ofHuman Resources 35, no. 4 (2000):755–774, that early gains for students who attendHead Start tend to disappear due to low-quality schools that these students laterattend. Consistent with Currie and Thomas, we do not find a positive effect of HeadStart on student test scores even in kindergarten, once other factors are controlledfor. This finding is also related to Alan Krueger and Diane Whitmore, ‘‘WouldSmaller Classes Help Close the Black White Achievement Gap?’’ 2001, WorkingPaper �451 Industrial Relations Section, Princeton University and Phillips, Crouse,and Ralph, ‘‘Does the Black-White Test Score Gap Widen?,’’ who find that the black-white gap widens as a result of poorer quality schools.
23. Indeed, from a theoretical perspective, one might expect that the oppositehypothesis would hold true: the importance of parental inputs declines with age.Prior to reaching school age, the relative share of educational inputs provided by par-ents is very large. Once school starts, much of the burden for educating is shifted tothe schools. Our empirical evidence does not, however, provide much support forthis conjecture either.
24. An alternative explanation for the shrinking coefficient on the SES variable isthat socioeconomic status varies over time. Therefore, using the kindergarten valueof the SES variable in the first grade regression induces measurement error. Thatexplanation cannot explain the declining coefficients on age at school entry andmother’s age at birth. Moreover, for other variables that are time varying, like num-ber of books and WIC participation, the coefficients do not shrink in the first-graderegression.
25. Doris Entwisle and Karl Alexander, ‘‘Summer Setback: Race, Poverty, SchoolComposition, and Mathematics Achievement in the First Two Years of School,’’American Sociological Review 57 (1992):72–84 and ‘‘Winter Setback: The RacialComposition of Schools and Learning to Read,’’ American Sociological Review 59(1994):446–460; Barbara Heyns, Summer Learning and the Effects of Schooling (NewYork: Academic Press, 1978).
PAGE 114................. 15683$ $CH4 10-05-05 08:50:22 PS