
Lookout Report - us.spindices.com | 301657813. to scrutinize ISM and employment reports, in addition...
25
Recent High-Profile Economic Data Weren't Nearly As Weak As Investor Confidence Appears To Be The economy added just 69,000 nonfarm payrolls in May, the weakest monthly improvement in employment since the 54,000 rise recorded in May 2011. The three-month average payroll growth rate has fallen to 96,000, just below the 100,000 to 300,000 range that we believe is consistent with sustaining 2% to 2.5% U.S. GDP growth. This report was weak and extremely disappointing, since the Global Markets Intelligence (GMI) research team has repeatedly said since the start of this year that "the rate of employment creation in the world's largest economy (the U.S.) is the most significant indicator for determining whether 2012 will be a risk-on or risk-off year." (See "Lookout Report: Three Key Economic Topics To Follow Closely In 2012: Jobs, Housing, And Sovereign Risk," published Jan. 20, 2012, on the Global Credit Portal.) With Italy and Spain credit default swap (CDS) spreads trading above 550 basis points (bps) and 600 bps, respectively, this past week, the weaker-than-expected jobs report added to the growing list of negative developments that investors must confront. While the May employment report was a huge disappointment, the GMI research team continues to believe that the U.S. economy is not immediately at risk of falling into recession. The Institute for Supply Management (ISM) Purchasing Managers Index (PMI), reported the same day as May employment, registered 53.5 in May, suggesting that the U.S. economy continues to expand at an acceptable rate. The PMI report did not, however, support the equity market; the S&P 500 Index declined 32 points (2.5%) for the day (June 1). On June 5, the service sector PMI reported a value of 53.7, which is also inconsistent with an economy immediately at risk of recession. We believe that monthly PMI results between 52 and 55 are consistent with U.S. GDP growth between 2% and 2.5%. The relatively optimistic PMI data nonetheless did not stop the S&P 500 Index from trading earlier this week at just 12 times one-year-forward S&P Capital IQ consensus earnings. The historically cheap forward price-to-earnings (P/E) multiple is likely indicative of the existing low investor confidence environment, in our opinion. Of the last 11 U.S. economic recessions dating back to 1948, the U.S. economy entered recession with the PMI Index at or above the current level of 53.5 just once--from November 1973 to March 1975, generally regarded as an OPEC energy-shock-triggered period of economic stagflation (see table 1). As we said in the prior edition of the Lookout Report, we will continue Lookout Report from Global Markets Intelligence June 8, 2012 Michael Thompson Managing Director Global Markets Intelligence (1) 212-438-3480 [email protected] Robert Keiser Vice President Global Markets Intelligence (1) 212-438-3540 [email protected] The Lookout Report is a compendium of current data and perspectives from across S&P Capital IQ and S&P Indices covering corporate earnings, market and credit risks, capital markets activity, index investing, and proprietary data and analytics. Published bi-weekly by the Global Markets Intelligence research group, the Lookout Report offers a detailed cross-market and cross-asset view of investment conditions, risks, and opportunities. 974333 | 301657813
-
Upload
truongdieu -
Category
Documents
-
view
215 -
download
2
Transcript of Lookout Report - us.spindices.com | 301657813. to scrutinize ISM and employment reports, in addition...
Recent High-Profile Economic Data Weren't Nearly As WeakAs Investor Confidence Appears To Be
The economy added just 69,000 nonfarm payrolls in May, the weakest monthly improvement in
employment since the 54,000 rise recorded in May 2011. The three-month average payroll
growth rate has fallen to 96,000, just below the 100,000 to 300,000 range that we believe is
consistent with sustaining 2% to 2.5% U.S. GDP growth. This report was weak and extremely
disappointing, since the Global Markets Intelligence (GMI) research team has repeatedly said
since the start of this year that "the rate of employment creation in the world's largest economy
(the U.S.) is the most significant indicator for determining whether 2012 will be a risk-on or
risk-off year." (See "Lookout Report: Three Key Economic Topics To Follow Closely In 2012:
Jobs, Housing, And Sovereign Risk," published Jan. 20, 2012, on the Global Credit Portal.)
With Italy and Spain credit default swap (CDS) spreads trading above 550 basis points (bps)
and 600 bps, respectively, this past week, the weaker-than-expected jobs report added to the
growing list of negative developments that investors must confront.
While the May employment report was a huge disappointment, the GMI research team
continues to believe that the U.S. economy is not immediately at risk of falling into recession.
The Institute for Supply Management (ISM) Purchasing Managers Index (PMI), reported the
same day as May employment, registered 53.5 in May, suggesting that the U.S. economy
continues to expand at an acceptable rate. The PMI report did not, however, support the equity
market; the S&P 500 Index declined 32 points (2.5%) for the day (June 1). On June 5, the
service sector PMI reported a value of 53.7, which is also inconsistent with an economy
immediately at risk of recession. We believe that monthly PMI results between 52 and 55 are
consistent with U.S. GDP growth between 2% and 2.5%. The relatively optimistic PMI data
nonetheless did not stop the S&P 500 Index from trading earlier this week at just 12 times
one-year-forward S&P Capital IQ consensus earnings. The historically cheap forward
price-to-earnings (P/E) multiple is likely indicative of the existing low investor confidence
environment, in our opinion.
Of the last 11 U.S. economic recessions dating back to 1948, the U.S. economy entered recession
with the PMI Index at or above the current level of 53.5 just once--from November 1973 to
March 1975, generally regarded as an OPEC energy-shock-triggered period of economic
stagflation (see table 1). As we said in the prior edition of the Lookout Report, we will continue
Lookout Reportfrom Global Markets Intelligence
June 8, 2012
Michael Thompson
Managing Director
Global Markets Intelligence
(1) 212-438-3480
Robert Keiser
Vice President
Global Markets Intelligence
(1) 212-438-3540
The Lookout Report is a compendium
of current data and perspectives from
across S&P Capital IQ and S&P
Indices covering corporate earnings,
market and credit risks, capital
markets activity, index investing, and
proprietary data and analytics.
Published bi-weekly by the Global
Markets Intelligence research group,
the Lookout Report offers a detailed
cross-market and cross-asset view of
investment conditions, risks, and
opportunities.
974333 | 301657813
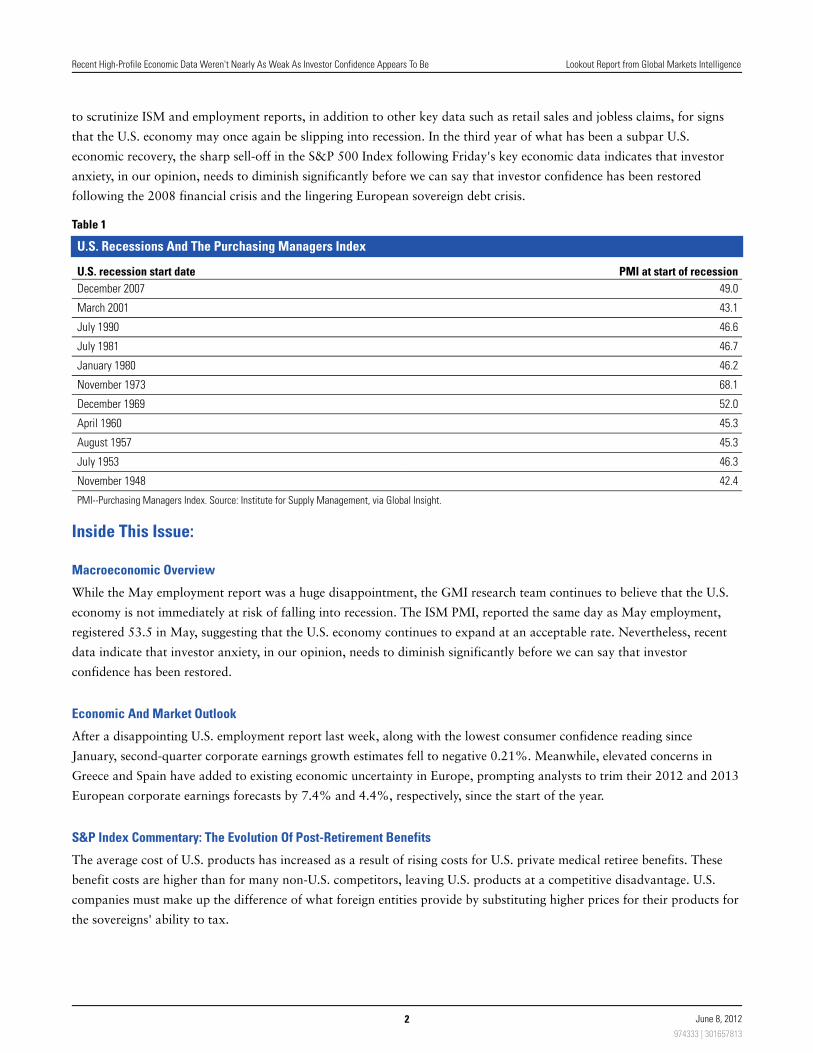
to scrutinize ISM and employment reports, in addition to other key data such as retail sales and jobless claims, for signs
that the U.S. economy may once again be slipping into recession. In the third year of what has been a subpar U.S.
economic recovery, the sharp sell-off in the S&P 500 Index following Friday's key economic data indicates that investor
anxiety, in our opinion, needs to diminish significantly before we can say that investor confidence has been restored
following the 2008 financial crisis and the lingering European sovereign debt crisis.
Table 1
U.S. Recessions And The Purchasing Managers Index
U.S. recession start date PMI at start of recession
December 2007 49.0
March 2001 43.1
July 1990 46.6
July 1981 46.7
January 1980 46.2
November 1973 68.1
December 1969 52.0
April 1960 45.3
August 1957 45.3
July 1953 46.3
November 1948 42.4
PMI--Purchasing Managers Index. Source: Institute for Supply Management, via Global Insight.
Inside This Issue:
Macroeconomic Overview
While the May employment report was a huge disappointment, the GMI research team continues to believe that the U.S.
economy is not immediately at risk of falling into recession. The ISM PMI, reported the same day as May employment,
registered 53.5 in May, suggesting that the U.S. economy continues to expand at an acceptable rate. Nevertheless, recent
data indicate that investor anxiety, in our opinion, needs to diminish significantly before we can say that investor
confidence has been restored.
Economic And Market Outlook
After a disappointing U.S. employment report last week, along with the lowest consumer confidence reading since
January, second-quarter corporate earnings growth estimates fell to negative 0.21%. Meanwhile, elevated concerns in
Greece and Spain have added to existing economic uncertainty in Europe, prompting analysts to trim their 2012 and 2013
European corporate earnings forecasts by 7.4% and 4.4%, respectively, since the start of the year.
S&P Index Commentary: The Evolution Of Post-Retirement Benefits
The average cost of U.S. products has increased as a result of rising costs for U.S. private medical retiree benefits. These
benefit costs are higher than for many non-U.S. competitors, leaving U.S. products at a competitive disadvantage. U.S.
companies must make up the difference of what foreign entities provide by substituting higher prices for their products for
the sovereigns' ability to tax.
Recent High-Profile Economic Data Weren't Nearly As Weak As Investor Confidence Appears To Be Lookout Report from Global Markets Intelligence
2 June 8, 2012
974333 | 301657813
Leveraged Commentary And Data: Leveraged Loan Technicals Cool In May Amid Macroeconomic Uncertainty
External events held the loan market captive in May as darkening global macroeconomic conditions forced the S&P/LSTA
Leveraged Loan Index to suffer its first monthly loss since November, retreating by 0.68%. High-yield bonds and equities
endured even more severe downturns, with the Bank of America Merrill Lynch High-Yield Master Index and S&P 500
Index down 1.2% and 6%, respectively.
R2P Corporate Bond Monitor
Risk-reward profiles in the corporate fixed-income market--as measured by average Risk-to-Price (R2P) scores--varied
among countries for the past two weeks (May 21 to June 5). Despite a 37% decrease in the probability of default (PD),
U.S. scores deteriorated by 9%. In Europe, scores for Italy, France, and Germany increased by 16%, 9%, and 6%,
respectively. On the other hand, scores for the U.K., Ireland, and Spain decreased by 14%, 10%, and 5%, respectively.
S&P Index Municipal Commentary: High-Yield Municipal Bonds: Is There More Room For Upside Potential
Yields for higher-yielding municipal bonds have quickly fallen in 2012. As a result, high-yield municipal bonds have
outpaced the stock market and the overall municipal bond market by returning 9.4% year to date, as measured by the
S&P Municipal Bond High-Yield Index. Investment-grade municipal bonds have returned 3.67% so far this year.
Market Derived Signal Commentary: The CDS Market Reveals Strength In Some U.S. Financial Companies
On June 1, the CDS spread for U.S. financial companies, as measured by the S&P/ISDA CDS U.S. Financials Select 10
Index, approached the widest point of 2012. Nevertheless, we were surprised that the spread hadn't widened further. But
the relatively tighter spreads for Wells Fargo & Co. and American Express Co., for example, are offsetting the credit
deterioration among diversified financial companies.
S&P/ISDA CDS Indices Commentary: May Review
With investors shedding risky assets in a massive flight to quality, it is no surprise that CDS spreads jumped across the
board in May. The S&P 500 Index dropped 6%, and the S&P GSCI Index declined nearly 13%. The U.S. dollar rallied by
more than 5% as investors piled into U.S. Treasuries. The ongoing eurozone crisis is affecting investors around the globe
as increased predictions of a recession spread.
Capital Market Commentary: IPO Activity Slows After The Facebook Debut
Since Facebook Inc.'s IPO more than three weeks ago, no IPOs (excluding two closed-end funds) have come to market,
according to S&P Capital IQ data. In addition, only five companies have since filed plans to sell common shares to the
investing public, with private equity-owned CKE Restaurants Inc.'s planned $100 million offering ranking as the largest
among them.
S&P Index Commodity Commentary: Precious Metals Limit Losses
Commodity market weakness from May carried over into June, led by declining energy prices. Reflecting flight-to-safety
fears, strength in precious metals has helped limit broad index losses. Nevertheless, weakness in the industrial metals
sector over the past 12 months has offered little economic optimism.
Recent High-Profile Economic Data Weren't Nearly As Weak As Investor Confidence Appears To Be Lookout Report from Global Markets Intelligence
3 June 8, 2012
974333 | 301657813
Economic And Market Outlook: North American And European Earnings
North America
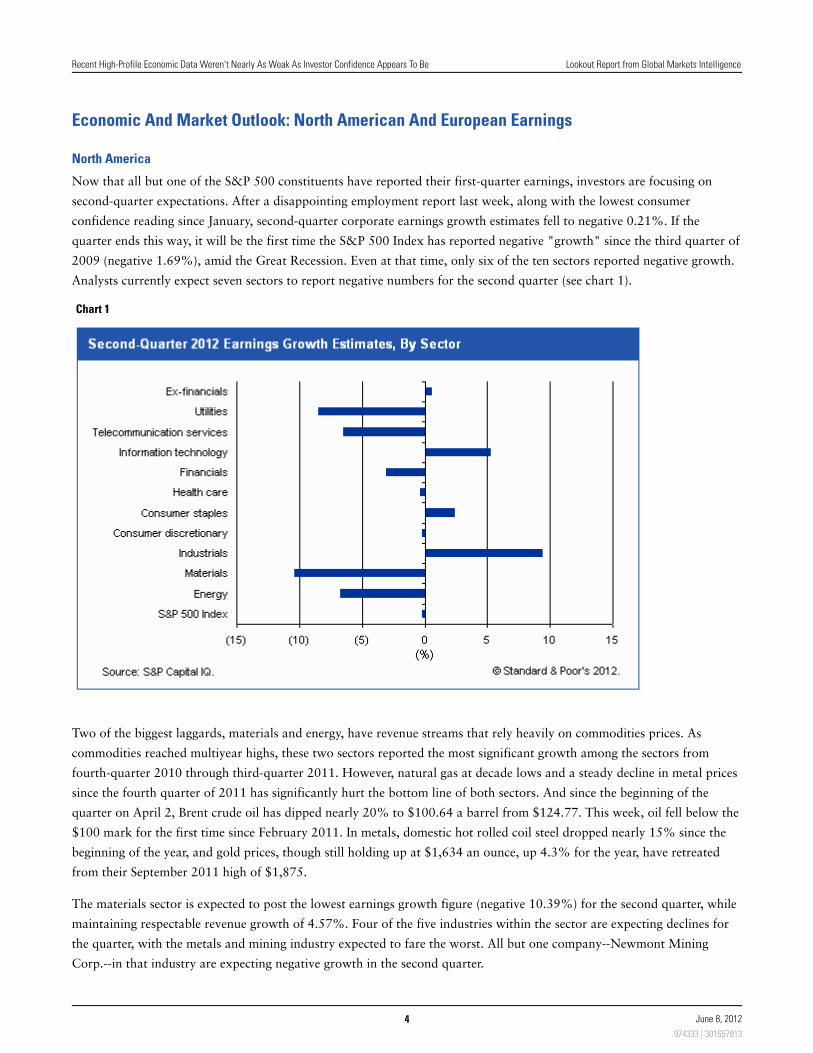
Now that all but one of the S&P 500 constituents have reported their first-quarter earnings, investors are focusing on
second-quarter expectations. After a disappointing employment report last week, along with the lowest consumer
confidence reading since January, second-quarter corporate earnings growth estimates fell to negative 0.21%. If the
quarter ends this way, it will be the first time the S&P 500 Index has reported negative "growth" since the third quarter of
2009 (negative 1.69%), amid the Great Recession. Even at that time, only six of the ten sectors reported negative growth.
Analysts currently expect seven sectors to report negative numbers for the second quarter (see chart 1).
Chart 1
Two of the biggest laggards, materials and energy, have revenue streams that rely heavily on commodities prices. As
commodities reached multiyear highs, these two sectors reported the most significant growth among the sectors from
fourth-quarter 2010 through third-quarter 2011. However, natural gas at decade lows and a steady decline in metal prices
since the fourth quarter of 2011 has significantly hurt the bottom line of both sectors. And since the beginning of the
quarter on April 2, Brent crude oil has dipped nearly 20% to $100.64 a barrel from $124.77. This week, oil fell below the
$100 mark for the first time since February 2011. In metals, domestic hot rolled coil steel dropped nearly 15% since the
beginning of the year, and gold prices, though still holding up at $1,634 an ounce, up 4.3% for the year, have retreated
from their September 2011 high of $1,875.
The materials sector is expected to post the lowest earnings growth figure (negative 10.39%) for the second quarter, while
maintaining respectable revenue growth of 4.57%. Four of the five industries within the sector are expecting declines for
the quarter, with the metals and mining industry expected to fare the worst. All but one company--Newmont Mining
Corp.--in that industry are expecting negative growth in the second quarter.
Recent High-Profile Economic Data Weren't Nearly As Weak As Investor Confidence Appears To Be Lookout Report from Global Markets Intelligence
4 June 8, 2012
974333 | 301657813
The energy sector is expecting the third lowest growth level (negative 6.7%), yet the highest revenue growth rate (18.3%).
Despite high expected sales growth, higher oil prices have raised the cost of goods sold, pressuring gross margins. Of the
two industries in the sector, the oil, gas, and consumable fuels industry is projected to report negative growth of negative
8.5%, while the energy equipment and services industry expects stronger growth of 12.5%.
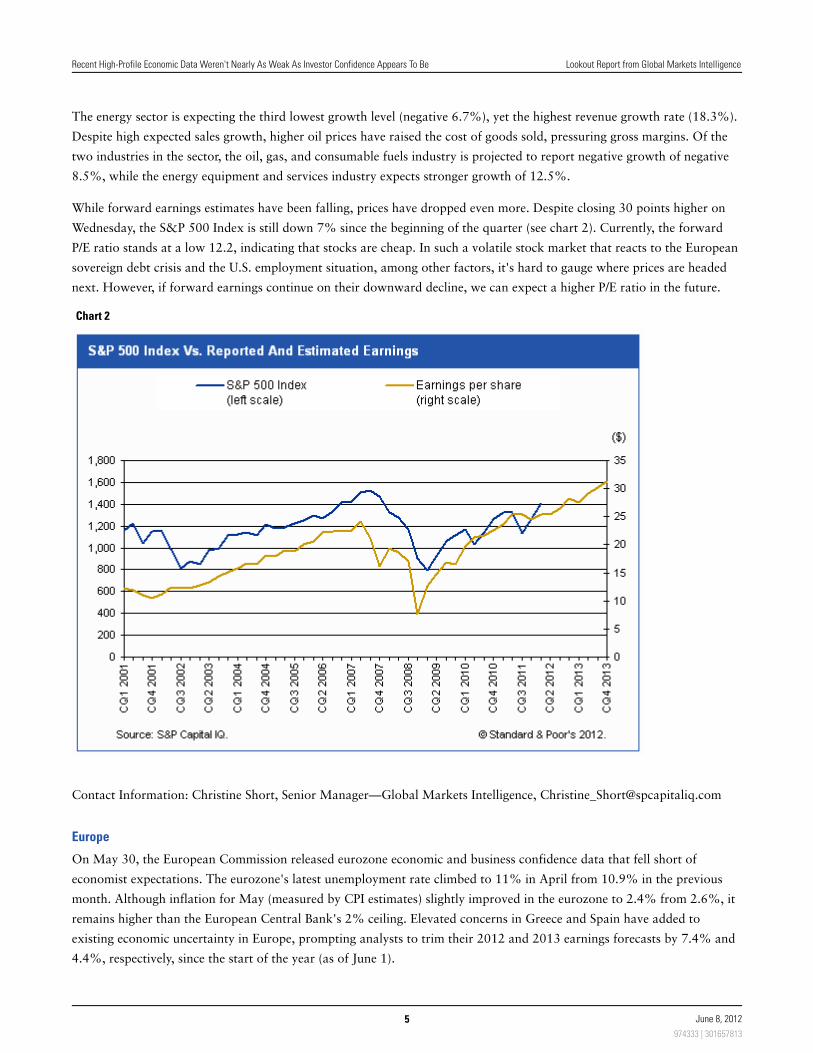
While forward earnings estimates have been falling, prices have dropped even more. Despite closing 30 points higher on
Wednesday, the S&P 500 Index is still down 7% since the beginning of the quarter (see chart 2). Currently, the forward
P/E ratio stands at a low 12.2, indicating that stocks are cheap. In such a volatile stock market that reacts to the European
sovereign debt crisis and the U.S. employment situation, among other factors, it's hard to gauge where prices are headed
next. However, if forward earnings continue on their downward decline, we can expect a higher P/E ratio in the future.
Chart 2
Contact Information: Christine Short, Senior Manager—Global Markets Intelligence, [email protected]
Europe
On May 30, the European Commission released eurozone economic and business confidence data that fell short of
economist expectations. The eurozone's latest unemployment rate climbed to 11% in April from 10.9% in the previous
month. Although inflation for May (measured by CPI estimates) slightly improved in the eurozone to 2.4% from 2.6%, it
remains higher than the European Central Bank's 2% ceiling. Elevated concerns in Greece and Spain have added to
existing economic uncertainty in Europe, prompting analysts to trim their 2012 and 2013 earnings forecasts by 7.4% and
4.4%, respectively, since the start of the year (as of June 1).
Recent High-Profile Economic Data Weren't Nearly As Weak As Investor Confidence Appears To Be Lookout Report from Global Markets Intelligence
5 June 8, 2012
974333 | 301657813
Amid the deteriorating political and economic climate in Europe in the last two weeks (ended June 1), analysts cut their
2012 and 2013 earnings forecasts for seven of the 10 sectors by 0.5% to €97.02, and for eight sectors by 0.4% to
€109.44, respectively, according to data aggregated by S&P Capital IQ.
Analysts continued to lower their 2012 and 2013 earnings expectations the most for the typically highly economy-sensitive
materials sector (decline of 1.5% and 0.9%, respectively). In addition, analysts trimmed their 2012 and 2013 earnings
forecasts for the energy (decline of 0.4% and 0.7%) and telecommunications sectors (0.6% and 1%).
In particular, BP PLC's oil rig disaster in 2010 and subsequent announcement that Mikhail Fridman resigned as chief
executive of their Russian joint venture TNK-BP will likely hurt the company's performance. The TNK-BP venture
accounts for about 29% of BP's production and a sizable portion of its reserves. As a result, analysts lowered their
earnings forecasts for the sector.
Of the 10 sectors, analysts only raised their estimates for the consumer discretionary sector as a result of some European
carmakers' extensive sales outside Europe. Since the start of 2012, analysts have cut their 2012 estimates the most for the
information technology sector. Nokia OyJ and other companies in the sector have offered profit warnings and poor
guidance. Not surprisingly, the materials and financials sectors have absorbed a lot of negative business sentiment since
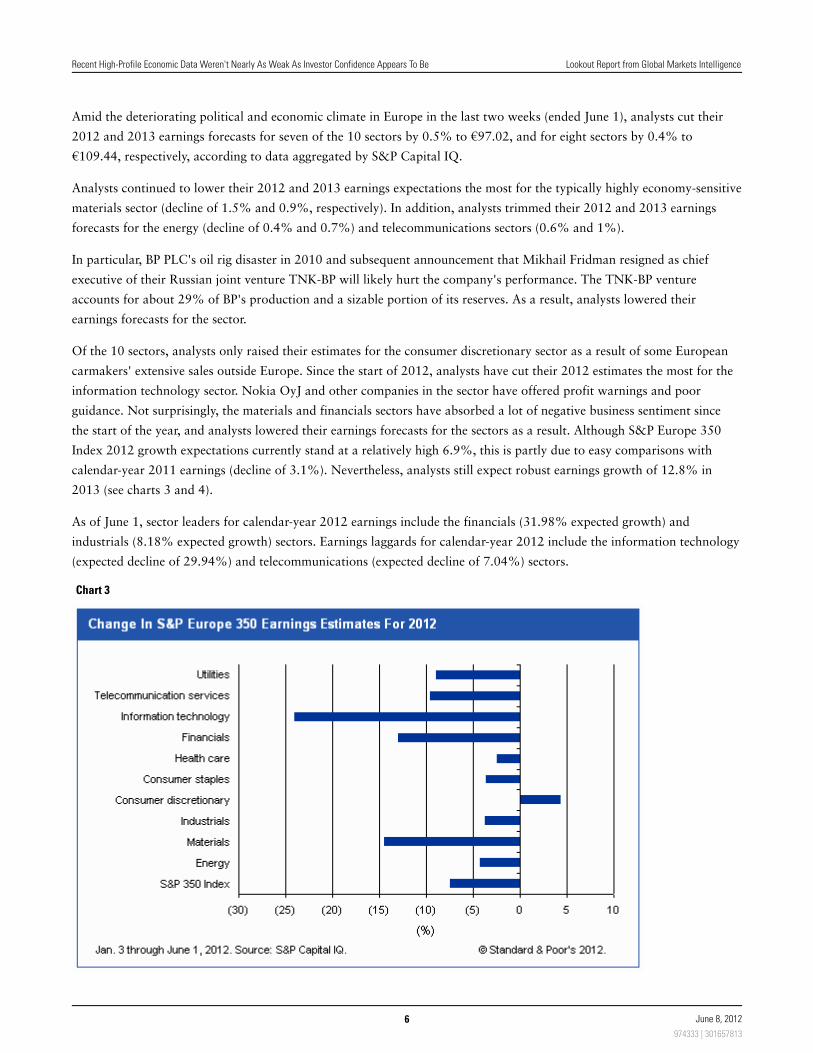
the start of the year, and analysts lowered their earnings forecasts for the sectors as a result. Although S&P Europe 350
Index 2012 growth expectations currently stand at a relatively high 6.9%, this is partly due to easy comparisons with
calendar-year 2011 earnings (decline of 3.1%). Nevertheless, analysts still expect robust earnings growth of 12.8% in
2013 (see charts 3 and 4).
As of June 1, sector leaders for calendar-year 2012 earnings include the financials (31.98% expected growth) and
industrials (8.18% expected growth) sectors. Earnings laggards for calendar-year 2012 include the information technology
(expected decline of 29.94%) and telecommunications (expected decline of 7.04%) sectors.
Chart 3
Recent High-Profile Economic Data Weren't Nearly As Weak As Investor Confidence Appears To Be Lookout Report from Global Markets Intelligence
6 June 8, 2012
974333 | 301657813

Chart 4
Contact Information: Victoria Chernykh, Director—Global Markets Intelligence, [email protected]
S&P Index Commentary: The Evolution Of Post-Employment Benefits
For more than 75 years, the relationship between employee and employer not only encompassed the exchange of services
for compensation, but extended to obligations in the form of Other Post Employment Benefits (OPEB). These benefits
became staples of the American Dream, and employers and companies subsequently built these related expenditures into
the cost of products and services. Over the last quarter of a century, globalization of markets, materials, and services has
grown dramatically. As U.S. economic dominance has shifted and the effects of the last two recessions have become more
prevalent worldwide, the ability of U.S. companies to pass along these costs to consumers--an ability that many foreign
competitors do not have--has significantly diminished to a level that endangers many companies' competitiveness.
The full breadth and scope of OPEB remains unclear because of an absence of available uniform information as well as a
lack of funding requirements. As medical and drug costs continue to outpace inflation and average life expectancy
continues to increase, the present value of OPEB has become a major concern for corporations. In 2011, the aggregate
underfunding of OPEB obligations reached $223.4 billion, a 6.3% increase from $210.1 billion in 2010 (see table 2).
Nevertheless, underfunding remains 30.4% lower than in 2005 ($320.9 billion), a result of reduced coverage for
employees and lower corporate contributions (similar to pensions, companies are shifting risk from the corporation to the
employee). The funding rate decreased to 21.8% from 23.5% in 2010.
Table 2
S&P 500 2011 OPEB Report
Assets (mil. $) Obligations (mil. $) Funding status (mil. $) Funding status ratio (%)
Consumer discretionary 647 13,899 (13,252) 4.66
Consumer staples 4,666 21,609 (16,943) 21.59
Energy 1,489 24,786 (23,296) 6.01
Financials 7,403 17,047 (9,643) 43.43
Recent High-Profile Economic Data Weren't Nearly As Weak As Investor Confidence Appears To Be Lookout Report from Global Markets Intelligence
7 June 8, 2012
974333 | 301657813
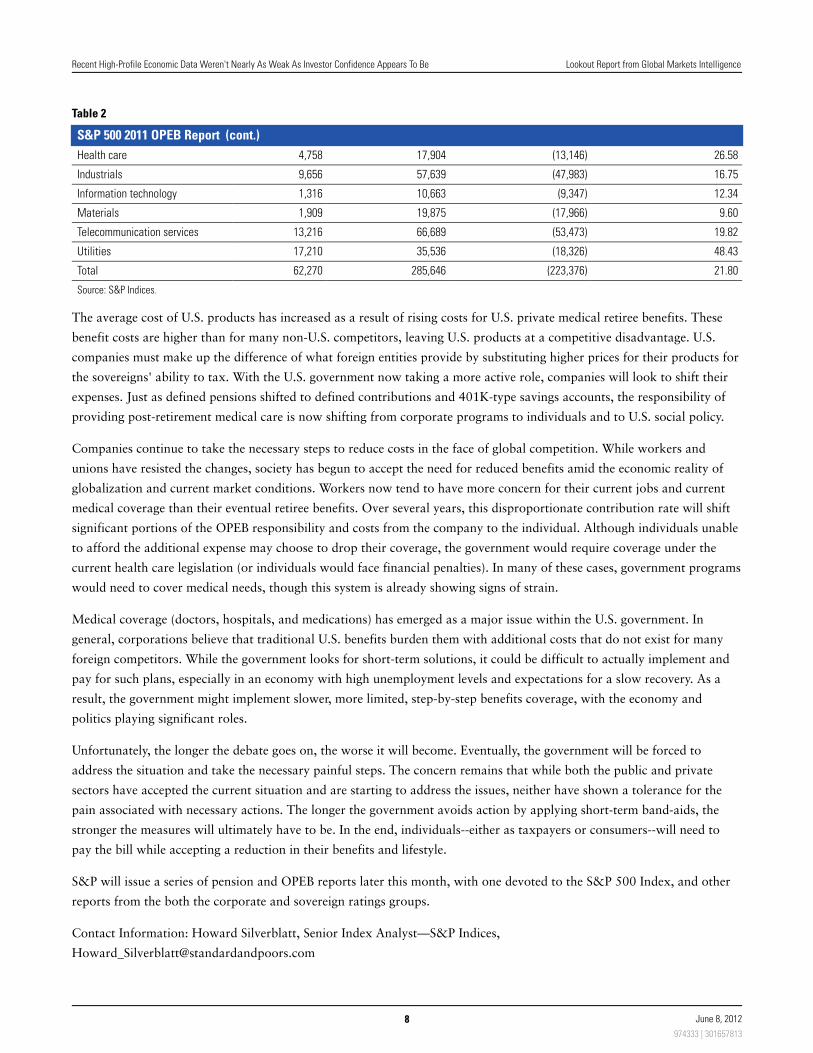
Table 2
S&P 500 2011 OPEB Report (cont.)
Health care 4,758 17,904 (13,146) 26.58
Industrials 9,656 57,639 (47,983) 16.75
Information technology 1,316 10,663 (9,347) 12.34
Materials 1,909 19,875 (17,966) 9.60
Telecommunication services 13,216 66,689 (53,473) 19.82
Utilities 17,210 35,536 (18,326) 48.43
Total 62,270 285,646 (223,376) 21.80
Source: S&P Indices.
The average cost of U.S. products has increased as a result of rising costs for U.S. private medical retiree benefits. These
benefit costs are higher than for many non-U.S. competitors, leaving U.S. products at a competitive disadvantage. U.S.
companies must make up the difference of what foreign entities provide by substituting higher prices for their products for
the sovereigns' ability to tax. With the U.S. government now taking a more active role, companies will look to shift their
expenses. Just as defined pensions shifted to defined contributions and 401K-type savings accounts, the responsibility of
providing post-retirement medical care is now shifting from corporate programs to individuals and to U.S. social policy.
Companies continue to take the necessary steps to reduce costs in the face of global competition. While workers and
unions have resisted the changes, society has begun to accept the need for reduced benefits amid the economic reality of
globalization and current market conditions. Workers now tend to have more concern for their current jobs and current
medical coverage than their eventual retiree benefits. Over several years, this disproportionate contribution rate will shift
significant portions of the OPEB responsibility and costs from the company to the individual. Although individuals unable
to afford the additional expense may choose to drop their coverage, the government would require coverage under the
current health care legislation (or individuals would face financial penalties). In many of these cases, government programs
would need to cover medical needs, though this system is already showing signs of strain.
Medical coverage (doctors, hospitals, and medications) has emerged as a major issue within the U.S. government. In
general, corporations believe that traditional U.S. benefits burden them with additional costs that do not exist for many
foreign competitors. While the government looks for short-term solutions, it could be difficult to actually implement and
pay for such plans, especially in an economy with high unemployment levels and expectations for a slow recovery. As a
result, the government might implement slower, more limited, step-by-step benefits coverage, with the economy and
politics playing significant roles.
Unfortunately, the longer the debate goes on, the worse it will become. Eventually, the government will be forced to
address the situation and take the necessary painful steps. The concern remains that while both the public and private
sectors have accepted the current situation and are starting to address the issues, neither have shown a tolerance for the
pain associated with necessary actions. The longer the government avoids action by applying short-term band-aids, the
stronger the measures will ultimately have to be. In the end, individuals--either as taxpayers or consumers--will need to
pay the bill while accepting a reduction in their benefits and lifestyle.
S&P will issue a series of pension and OPEB reports later this month, with one devoted to the S&P 500 Index, and other
reports from the both the corporate and sovereign ratings groups.
Contact Information: Howard Silverblatt, Senior Index Analyst—S&P Indices,
Recent High-Profile Economic Data Weren't Nearly As Weak As Investor Confidence Appears To Be Lookout Report from Global Markets Intelligence
8 June 8, 2012
974333 | 301657813

Leveraged Commentary And Data: Leveraged Loan Technicals Cool In May AmidMacroeconomic Uncertainty
External events held the loan market captive in May as darkening global macroeconomic conditions forced the S&P/LSTA
Leveraged Loan Index to suffer its first monthly loss since November, retreating by 0.68%. High-yield bonds and equities
endured even more severe downturns, with the Bank of America Merrill Lynch High-Yield Master Index and S&P 500
Index down 1.2% and 6%, respectively.
This grim backdrop took its toll on the loan market's technical picture, with investors quickly becoming risk-averse
(though not entirely risk-off). Thus, CLO issuance, though still robust by recent standards, fell to $2.9 billion in May from
a 4.5-year high of $5.1 billion in April. Likewise, inflows to daily access loan mutual funds fell to $133 million in
May--including a $201 million outflow during the final week of the month, the biggest net redemption in six
months--from $557 million in April, according to EPFR.
On the supply side of the ledger, an increase in new-issue activity and a slowdown in bond takeouts caused the amount of
S&P/LSTA Index loans to increase by $1.9 billion, or 0.37%. That followed an $8.1 billion (1.59%) increase in April.
Altogether, the muscular inflow surplus of $12 billion during the first quarter gave way to a slight deficit of $1.4 billion in
April and May (see chart 5).
Chart 5
Looking ahead, the bumpy ride of the past month shows no sign of abating. In fact, supply is currently set to exceed
demand in June, despite the fact that the total forward calendar of loans contracted to $21.5 billion as of May 30, from a
post-credit-crunch high of $32.9 billion a month earlier. Here's why:
First, the pipeline of M&A-driven loans remains robust, at $15.9 billion (though that is down from April's high of $19.2
Recent High-Profile Economic Data Weren't Nearly As Weak As Investor Confidence Appears To Be Lookout Report from Global Markets Intelligence
9 June 8, 2012
974333 | 301657813
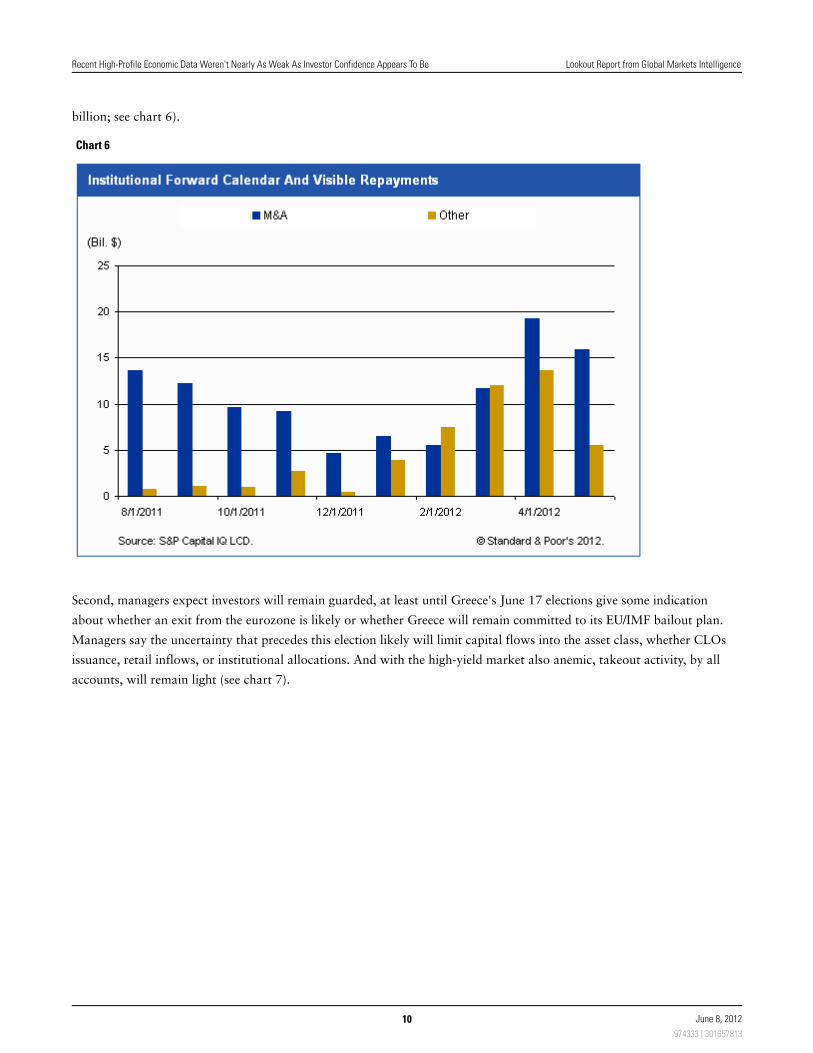
billion; see chart 6).
Chart 6
Second, managers expect investors will remain guarded, at least until Greece's June 17 elections give some indication
about whether an exit from the eurozone is likely or whether Greece will remain committed to its EU/IMF bailout plan.
Managers say the uncertainty that precedes this election likely will limit capital flows into the asset class, whether CLOs
issuance, retail inflows, or institutional allocations. And with the high-yield market also anemic, takeout activity, by all
accounts, will remain light (see chart 7).
Recent High-Profile Economic Data Weren't Nearly As Weak As Investor Confidence Appears To Be Lookout Report from Global Markets Intelligence
10 June 8, 2012
974333 | 301657813
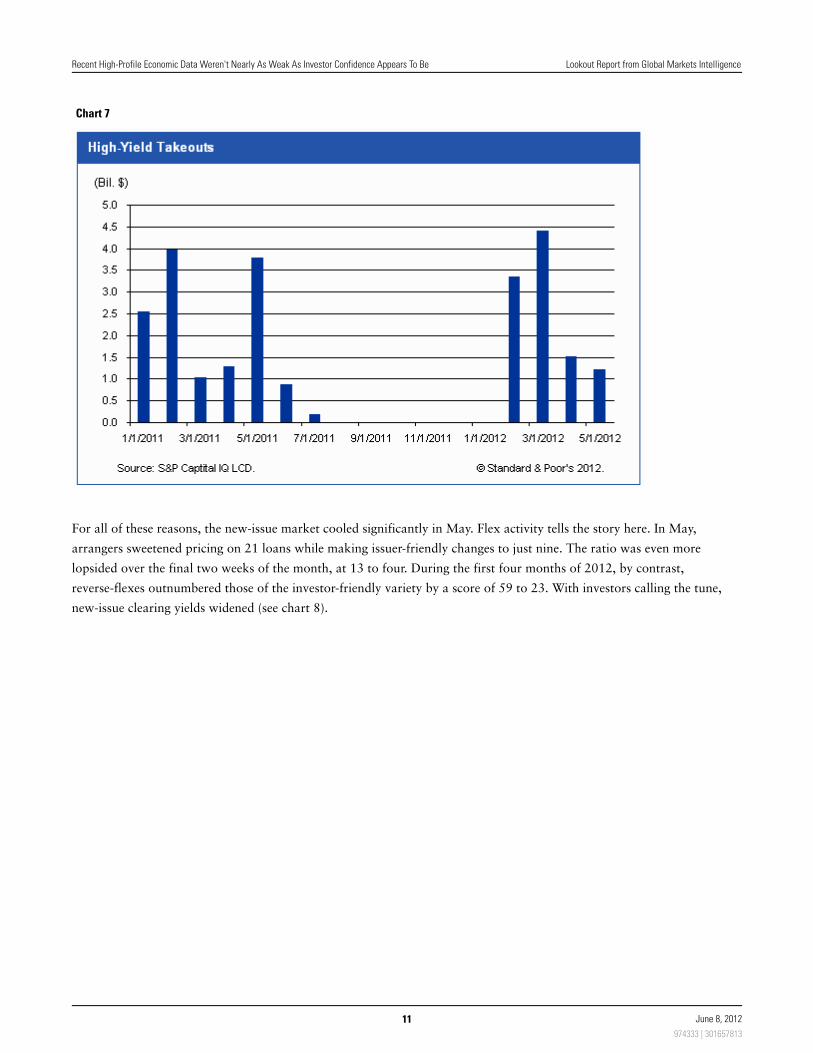
Chart 7
For all of these reasons, the new-issue market cooled significantly in May. Flex activity tells the story here. In May,
arrangers sweetened pricing on 21 loans while making issuer-friendly changes to just nine. The ratio was even more
lopsided over the final two weeks of the month, at 13 to four. During the first four months of 2012, by contrast,
reverse-flexes outnumbered those of the investor-friendly variety by a score of 59 to 23. With investors calling the tune,
new-issue clearing yields widened (see chart 8).
Recent High-Profile Economic Data Weren't Nearly As Weak As Investor Confidence Appears To Be Lookout Report from Global Markets Intelligence
11 June 8, 2012
974333 | 301657813
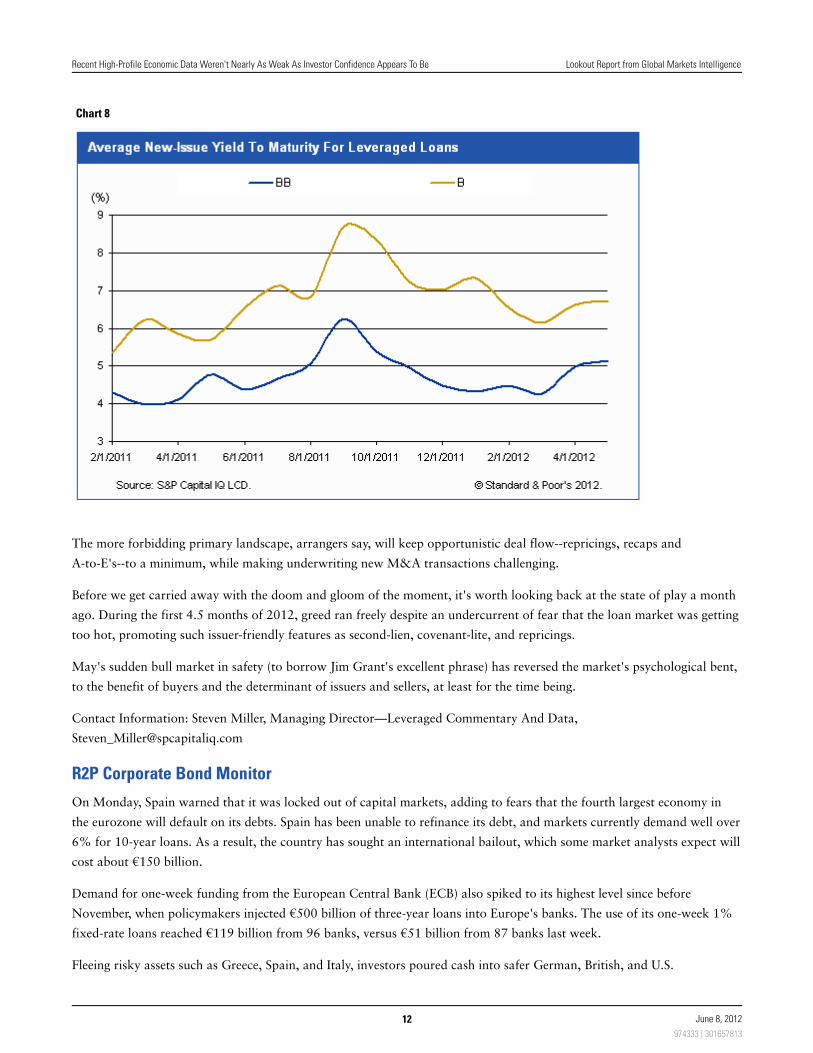
Chart 8
The more forbidding primary landscape, arrangers say, will keep opportunistic deal flow--repricings, recaps and
A-to-E's--to a minimum, while making underwriting new M&A transactions challenging.
Before we get carried away with the doom and gloom of the moment, it's worth looking back at the state of play a month
ago. During the first 4.5 months of 2012, greed ran freely despite an undercurrent of fear that the loan market was getting
too hot, promoting such issuer-friendly features as second-lien, covenant-lite, and repricings.
May's sudden bull market in safety (to borrow Jim Grant's excellent phrase) has reversed the market's psychological bent,
to the benefit of buyers and the determinant of issuers and sellers, at least for the time being.
Contact Information: Steven Miller, Managing Director—Leveraged Commentary And Data,
R2P Corporate Bond Monitor
On Monday, Spain warned that it was locked out of capital markets, adding to fears that the fourth largest economy in
the eurozone will default on its debts. Spain has been unable to refinance its debt, and markets currently demand well over
6% for 10-year loans. As a result, the country has sought an international bailout, which some market analysts expect will
cost about €150 billion.
Demand for one-week funding from the European Central Bank (ECB) also spiked to its highest level since before
November, when policymakers injected €500 billion of three-year loans into Europe's banks. The use of its one-week 1%
fixed-rate loans reached €119 billion from 96 banks, versus €51 billion from 87 banks last week.
Fleeing risky assets such as Greece, Spain, and Italy, investors poured cash into safer German, British, and U.S.
Recent High-Profile Economic Data Weren't Nearly As Weak As Investor Confidence Appears To Be Lookout Report from Global Markets Intelligence
12 June 8, 2012
974333 | 301657813
government debt, pushing the countries' 10-year borrowing costs to record lows: 1.27% for Germany, 1.65% for the
U.K., and 1.63% for the U.S. The borrowing costs for Greece, Spain, and Italy soared to 30.13%, 6.66%, and 5.94%,
respectively.
Nevertheless, all four of the largest eurozone economies contracted last month. Markit's composite PMI fell to a
three-year low of 46 from 46.7 in April, indicating an accelerating decline in private-sector activity far below the "no
change" level of 50. Spain led the decline, with a six-month low of 41.2, while Italy registered a two-month high of 43.5.
France's PMI fell to a 37-month low of 44.6, and Germany's dipped below the breakeven level of 50 to a 34-month low of
49.3.
The U.S. also joined the global slowdown with another unexpected rise in jobless claims and a downward revision to GDP
growth last week. The number of Americans that filed requests for jobless benefits climbed for the fourth consecutive time,
by 10,000 in May to 383,000, the highest level in five weeks, according to the U.S. Labor Department. Meanwhile, the
Commerce Department revised its first-quarter GDP estimate to 1.9% from 2.2% after lower-than-expected consumer and
government spending results. This represents a slowdown from the 3% GDP growth in fourth-quarter 2011.
European concerns resulted in a decrease in debt issuance from governments and financial institutions as well as an
increase in corporate debt issuance in the fixed-income markets. Euro-denominated issues fell 22% to $635.5 billion, the
lowest level since 2004 and the lowest percentage of European debt issued in euros since the single currency began. On the
other hand, corporate debt issuance in Europe rose 12% since last year to $237 billion, as more firms spurn bank loans in
favor of bond issues.
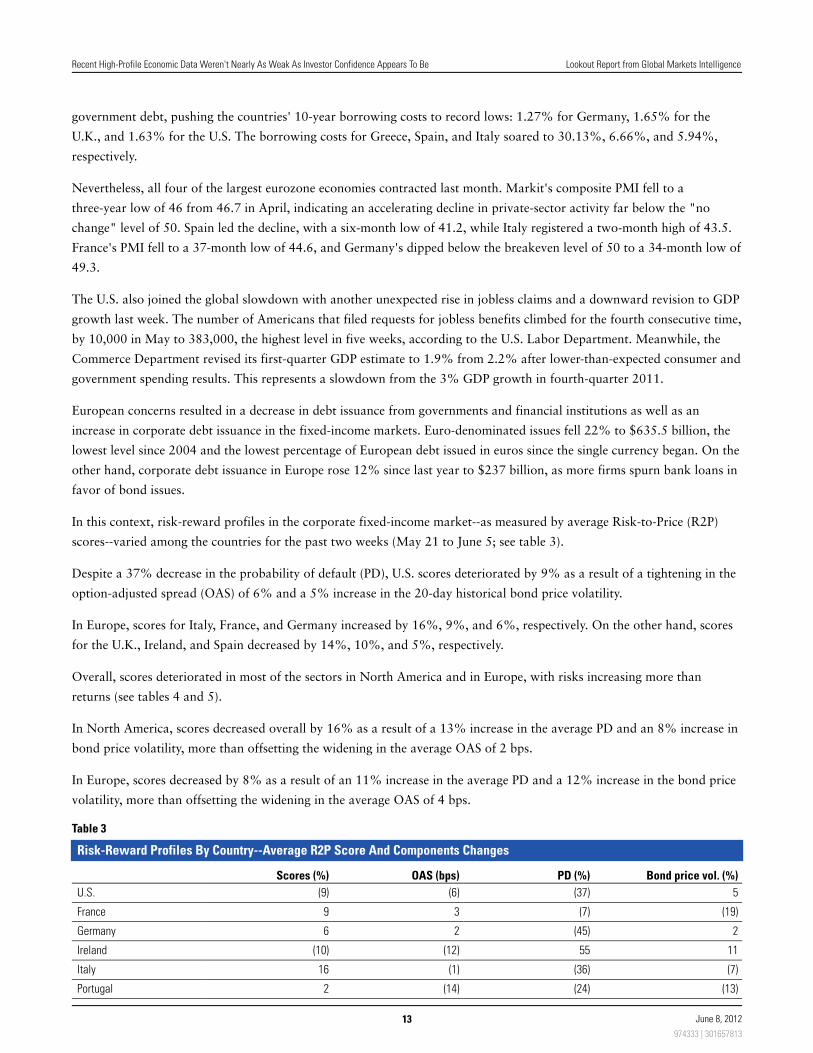
In this context, risk-reward profiles in the corporate fixed-income market--as measured by average Risk-to-Price (R2P)
scores--varied among the countries for the past two weeks (May 21 to June 5; see table 3).
Despite a 37% decrease in the probability of default (PD), U.S. scores deteriorated by 9% as a result of a tightening in the
option-adjusted spread (OAS) of 6% and a 5% increase in the 20-day historical bond price volatility.
In Europe, scores for Italy, France, and Germany increased by 16%, 9%, and 6%, respectively. On the other hand, scores
for the U.K., Ireland, and Spain decreased by 14%, 10%, and 5%, respectively.
Overall, scores deteriorated in most of the sectors in North America and in Europe, with risks increasing more than
returns (see tables 4 and 5).
In North America, scores decreased overall by 16% as a result of a 13% increase in the average PD and an 8% increase in
bond price volatility, more than offsetting the widening in the average OAS of 2 bps.
In Europe, scores decreased by 8% as a result of an 11% increase in the average PD and a 12% increase in the bond price
volatility, more than offsetting the widening in the average OAS of 4 bps.
Table 3
Risk-Reward Profiles By Country--Average R2P Score And Components Changes
Scores (%) OAS (bps) PD (%) Bond price vol. (%)
U.S. (9) (6) (37) 5
France 9 3 (7) (19)
Germany 6 2 (45) 2
Ireland (10) (12) 55 11
Italy 16 (1) (36) (7)
Portugal 2 (14) (24) (13)
Recent High-Profile Economic Data Weren't Nearly As Weak As Investor Confidence Appears To Be Lookout Report from Global Markets Intelligence
13 June 8, 2012
974333 | 301657813
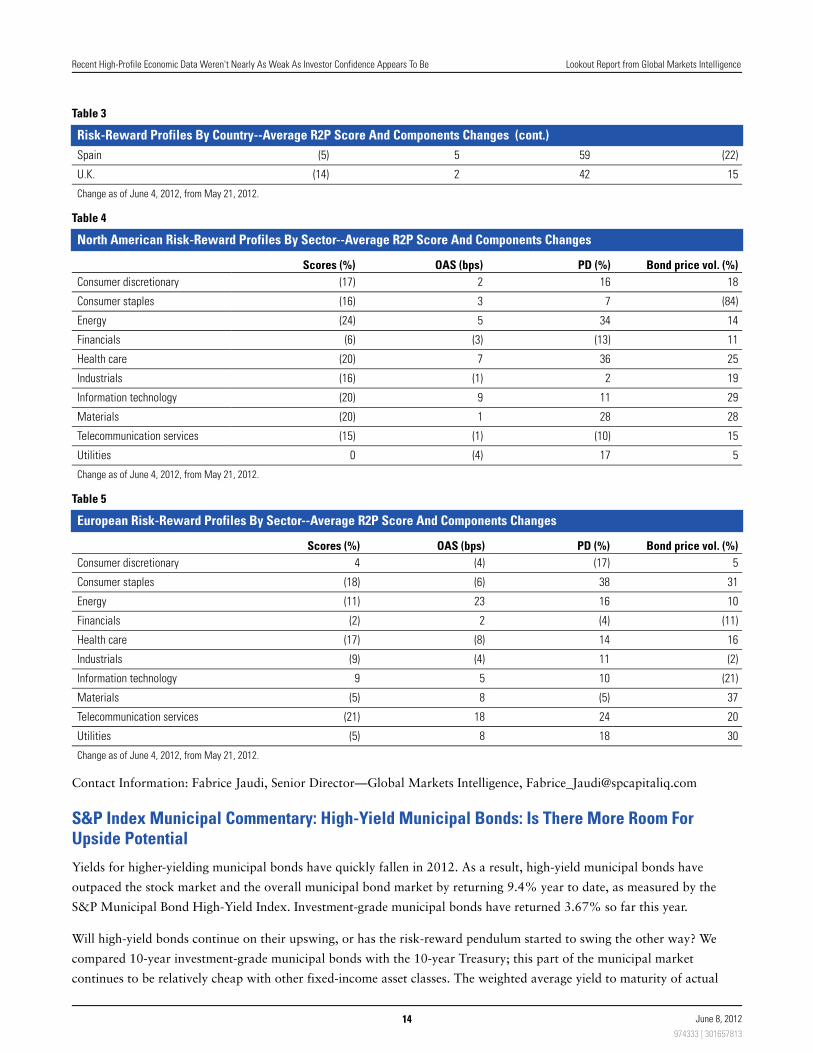
Table 3
Risk-Reward Profiles By Country--Average R2P Score And Components Changes (cont.)
Spain (5) 5 59 (22)
U.K. (14) 2 42 15
Change as of June 4, 2012, from May 21, 2012.
Table 4
North American Risk-Reward Profiles By Sector--Average R2P Score And Components Changes
Scores (%) OAS (bps) PD (%) Bond price vol. (%)
Consumer discretionary (17) 2 16 18
Consumer staples (16) 3 7 (84)
Energy (24) 5 34 14
Financials (6) (3) (13) 11
Health care (20) 7 36 25
Industrials (16) (1) 2 19
Information technology (20) 9 11 29
Materials (20) 1 28 28
Telecommunication services (15) (1) (10) 15
Utilities 0 (4) 17 5
Change as of June 4, 2012, from May 21, 2012.
Table 5
European Risk-Reward Profiles By Sector--Average R2P Score And Components Changes
Scores (%) OAS (bps) PD (%) Bond price vol. (%)
Consumer discretionary 4 (4) (17) 5
Consumer staples (18) (6) 38 31
Energy (11) 23 16 10
Financials (2) 2 (4) (11)
Health care (17) (8) 14 16
Industrials (9) (4) 11 (2)
Information technology 9 5 10 (21)
Materials (5) 8 (5) 37
Telecommunication services (21) 18 24 20
Utilities (5) 8 18 30
Change as of June 4, 2012, from May 21, 2012.
Contact Information: Fabrice Jaudi, Senior Director—Global Markets Intelligence, [email protected]
S&P Index Municipal Commentary: High-Yield Municipal Bonds: Is There More Room ForUpside Potential
Yields for higher-yielding municipal bonds have quickly fallen in 2012. As a result, high-yield municipal bonds have
outpaced the stock market and the overall municipal bond market by returning 9.4% year to date, as measured by the
S&P Municipal Bond High-Yield Index. Investment-grade municipal bonds have returned 3.67% so far this year.
Will high-yield bonds continue on their upswing, or has the risk-reward pendulum started to swing the other way? We
compared 10-year investment-grade municipal bonds with the 10-year Treasury; this part of the municipal market
continues to be relatively cheap with other fixed-income asset classes. The weighted average yield to maturity of actual
Recent High-Profile Economic Data Weren't Nearly As Weak As Investor Confidence Appears To Be Lookout Report from Global Markets Intelligence
14 June 8, 2012
974333 | 301657813
municipal bonds maturing in 2021 tracked by the S&P AMT-Free Municipal Series 2021 Index (nine-year noncallable
investment-grade bonds) ended June 6 at 2.46%, or 80 bps higher than the yield on the 10-year U.S. Treasury. Using a
35% tax rate, the taxable equivalent yield of these same bonds is 3.78%, or about 212 bps higher than the yield on the
10-year U.S. Treasury.
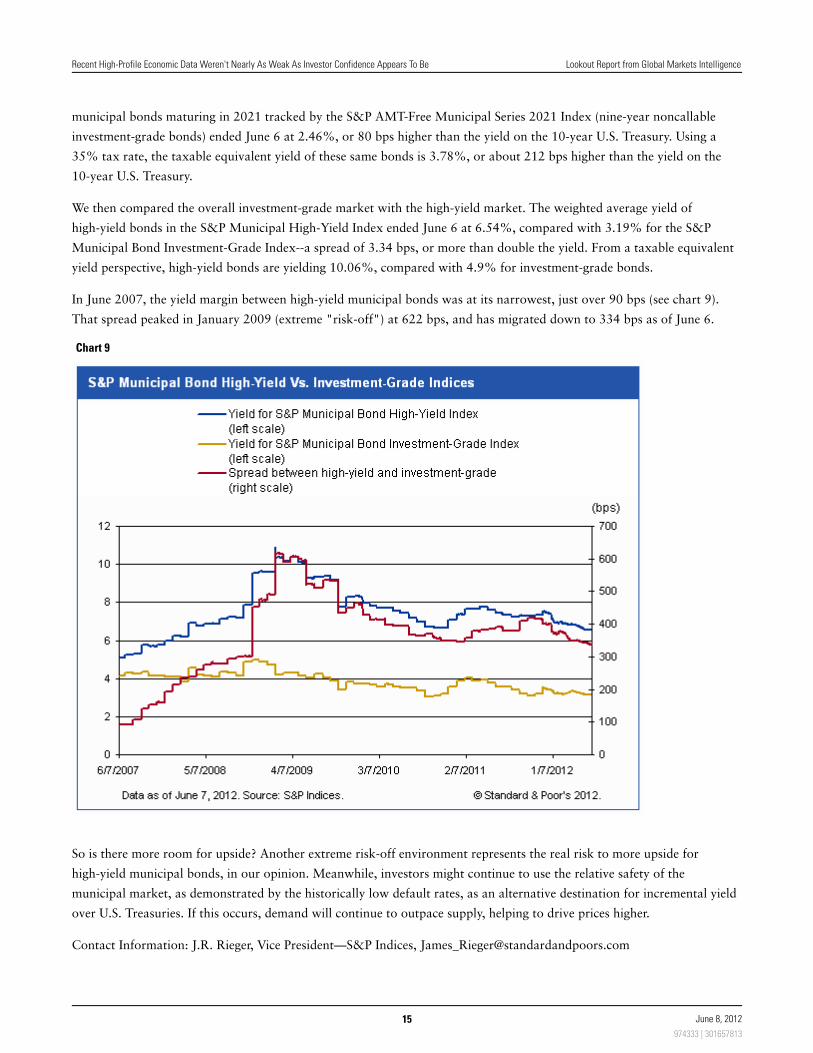
We then compared the overall investment-grade market with the high-yield market. The weighted average yield of
high-yield bonds in the S&P Municipal High-Yield Index ended June 6 at 6.54%, compared with 3.19% for the S&P
Municipal Bond Investment-Grade Index--a spread of 3.34 bps, or more than double the yield. From a taxable equivalent
yield perspective, high-yield bonds are yielding 10.06%, compared with 4.9% for investment-grade bonds.
In June 2007, the yield margin between high-yield municipal bonds was at its narrowest, just over 90 bps (see chart 9).
That spread peaked in January 2009 (extreme "risk-off") at 622 bps, and has migrated down to 334 bps as of June 6.
Chart 9
So is there more room for upside? Another extreme risk-off environment represents the real risk to more upside for
high-yield municipal bonds, in our opinion. Meanwhile, investors might continue to use the relative safety of the
municipal market, as demonstrated by the historically low default rates, as an alternative destination for incremental yield
over U.S. Treasuries. If this occurs, demand will continue to outpace supply, helping to drive prices higher.
Contact Information: J.R. Rieger, Vice President—S&P Indices, [email protected]
Recent High-Profile Economic Data Weren't Nearly As Weak As Investor Confidence Appears To Be Lookout Report from Global Markets Intelligence
15 June 8, 2012
974333 | 301657813
Market Derived Signal Commentary: The CDS Market Reveals Strength In Some U.S. FinancialCompanies
On June 1, the credit default swap (CDS) spread for U.S. financial companies, as measured by the S&P/ISDA CDS U.S.
Financials Select 10 Index (Financials Index), approached the widest point of 2012. At an average spread of 229 bps, the
benchmark index is only 12 bps tight of its year-to-date high of 241 bps and 17 bps wide of 195 bps on April 11 (see
"Credit Market Commentary: Market Derived Signal: Eurozone Sovereign Risk Taints U.S. Financials," published April
12, 2012).
The move is unsurprising, given JPMorgan Chase & Co.'s significant trading loss and Bank of America Corp.'s failure to
disclose to shareholders that acquiring Merrill Lynch would lead to huge losses at the bank. These recent events add to
significant eurozone sovereign contagion fears and have renewed concerns about a recession in the U.S. after a
disappointing jobs report last week.
Nevertheless, we were surprised that the CDS spread for the Financials Index hadn't widened further. In the equity
market, financial companies have given back more than all of their gains so far this year (through June 4). The GMI
research team took a closer look at the five-year CDS spreads for the 10 companies that constitute the Financials Index for
more information (see table 6).
Table 6
S&P/ISDA CDS U.S. Financials Select 10 Index
Company CDS (bps) Benchmark (bps) S&P credit rating/outlook Market Derived Signal
Morgan Stanley 450.5 223.1 A-/Negative bb-
The Goldman Sachs Group Inc. 337.4 223.1 A-/Negative bb+
General Electric Capital Corp. 182.3 122.3 AA+ Stable bbb
American Express Co. 113.6 254.4 BBB+/Stable a+
HSBC Finance Corp. 198.8 195.6 A/Negative bbb
Bank of America Corp. 309.0 223.1 A-/Negative bb+
JPMorgan Chase & Co. 167.6 195.6 A/Negative bbb+
Citigroup Inc. 279.4 223.1 A-/Negative bb+
Capital One Financial Corp. 132.6 290.2 BBB/Negative a
Wells Fargo & Co. 133.1 178.0 A+/Negative a
Source: CMA DataVision.
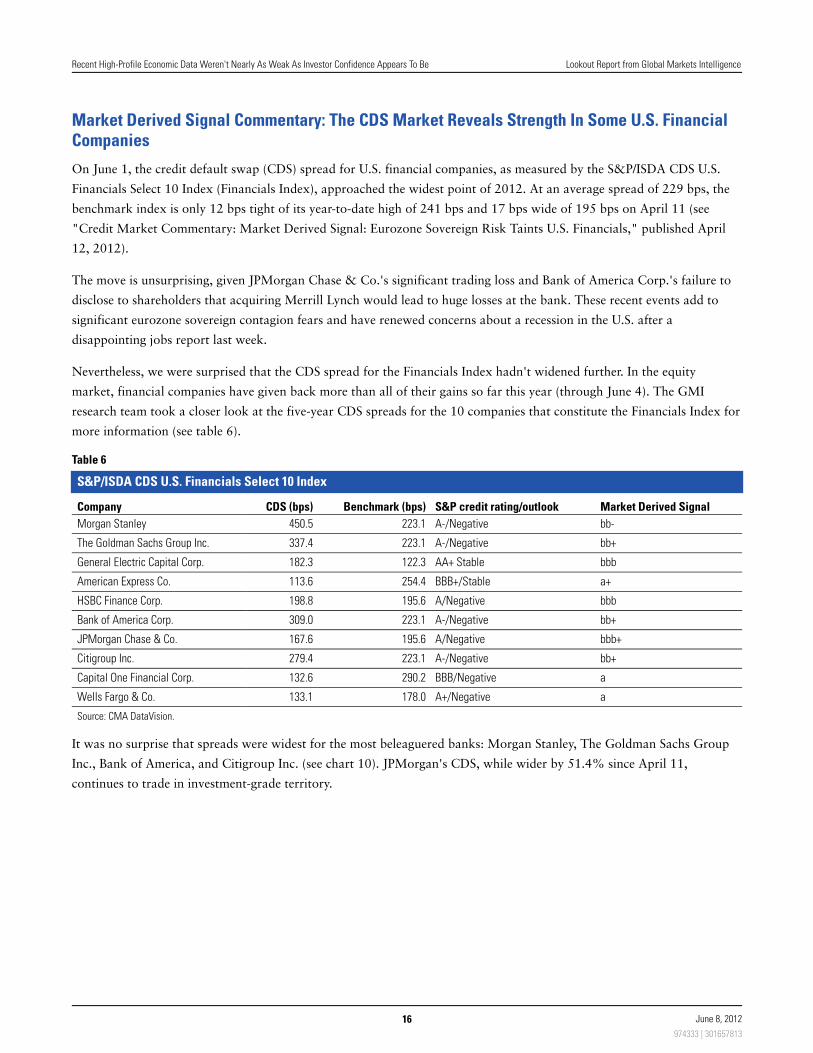
It was no surprise that spreads were widest for the most beleaguered banks: Morgan Stanley, The Goldman Sachs Group
Inc., Bank of America, and Citigroup Inc. (see chart 10). JPMorgan's CDS, while wider by 51.4% since April 11,
continues to trade in investment-grade territory.
Recent High-Profile Economic Data Weren't Nearly As Weak As Investor Confidence Appears To Be Lookout Report from Global Markets Intelligence
16 June 8, 2012
974333 | 301657813
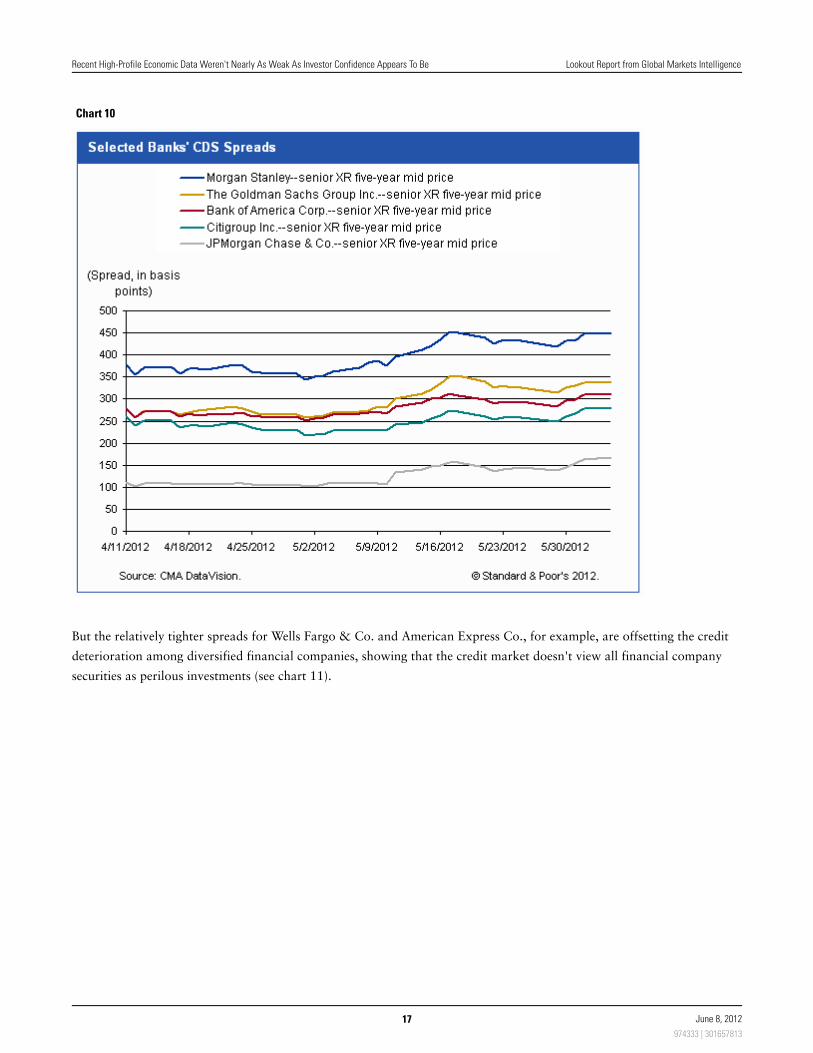
Chart 10
But the relatively tighter spreads for Wells Fargo & Co. and American Express Co., for example, are offsetting the credit
deterioration among diversified financial companies, showing that the credit market doesn't view all financial company
securities as perilous investments (see chart 11).
Recent High-Profile Economic Data Weren't Nearly As Weak As Investor Confidence Appears To Be Lookout Report from Global Markets Intelligence
17 June 8, 2012
974333 | 301657813
Chart 11
Contact Information: Lisa Sanders, Director—Global Markets Intelligence, [email protected]
S&P/ISDA CDS Indices Commentary: May Review
With investors shedding risky assets in a massive flight to quality, it is no surprise that CDS spreads jumped across the
board in May. The S&P 500 Index dropped 6%, and the S&P GSCI Index declined nearly 13%. The U.S. dollar rallied by
more than 5% as investors piled into U.S. Treasuries. The ongoing eurozone crisis is affecting investors around the globe
as increased predictions of a recession spread.
The eurozone continues to be the problem area for sovereign and bank CDS spreads, which deteriorated further in May.
The S&P/ISDA Eurozone Developed Nation Sovereign CDS Index jumped to 324 bps, and the S&P/ISDA CDS European
Banks Select 15 Index rose to 349 bps. The 72-basis-point jump in European bank spreads (a 26% rise) was the highest
percentage move in the CDS index family. Only the S&P/ISDA CDS U.S. High-Yield Index increased more (75 bps), as
investors shed their riskiest assets.
As is usually the case when the equity markets fall, CDS spreads rose. On May 18, the S&P/ISDA 100 CDS Index spread
rose to 95 bps before drifting lower to close the month at 93 bps, a 19% rise for the month. At month-end, 26 out of 84
reference entities had a spread north of 100 bps. On $10 million face value of bonds, 100 bps is equivalent to paying
$100,000 per year for the life of the swap for protection against default. On April 30, only 21 reference entities had a
spread over 100 bps.
Recent High-Profile Economic Data Weren't Nearly As Weak As Investor Confidence Appears To Be Lookout Report from Global Markets Intelligence
18 June 8, 2012
974333 | 301657813
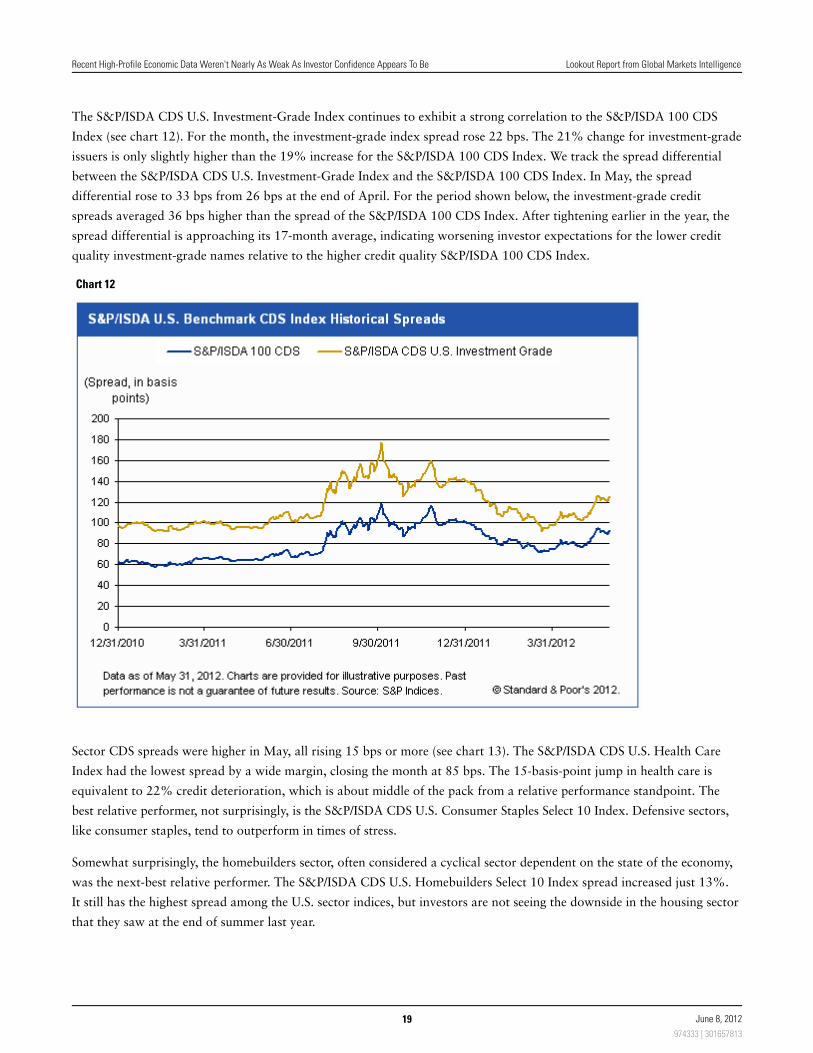
The S&P/ISDA CDS U.S. Investment-Grade Index continues to exhibit a strong correlation to the S&P/ISDA 100 CDS
Index (see chart 12). For the month, the investment-grade index spread rose 22 bps. The 21% change for investment-grade
issuers is only slightly higher than the 19% increase for the S&P/ISDA 100 CDS Index. We track the spread differential
between the S&P/ISDA CDS U.S. Investment-Grade Index and the S&P/ISDA 100 CDS Index. In May, the spread
differential rose to 33 bps from 26 bps at the end of April. For the period shown below, the investment-grade credit
spreads averaged 36 bps higher than the spread of the S&P/ISDA 100 CDS Index. After tightening earlier in the year, the
spread differential is approaching its 17-month average, indicating worsening investor expectations for the lower credit
quality investment-grade names relative to the higher credit quality S&P/ISDA 100 CDS Index.
Chart 12
Sector CDS spreads were higher in May, all rising 15 bps or more (see chart 13). The S&P/ISDA CDS U.S. Health Care
Index had the lowest spread by a wide margin, closing the month at 85 bps. The 15-basis-point jump in health care is
equivalent to 22% credit deterioration, which is about middle of the pack from a relative performance standpoint. The
best relative performer, not surprisingly, is the S&P/ISDA CDS U.S. Consumer Staples Select 10 Index. Defensive sectors,
like consumer staples, tend to outperform in times of stress.
Somewhat surprisingly, the homebuilders sector, often considered a cyclical sector dependent on the state of the economy,
was the next-best relative performer. The S&P/ISDA CDS U.S. Homebuilders Select 10 Index spread increased just 13%.
It still has the highest spread among the U.S. sector indices, but investors are not seeing the downside in the housing sector
that they saw at the end of summer last year.
Recent High-Profile Economic Data Weren't Nearly As Weak As Investor Confidence Appears To Be Lookout Report from Global Markets Intelligence
19 June 8, 2012
974333 | 301657813
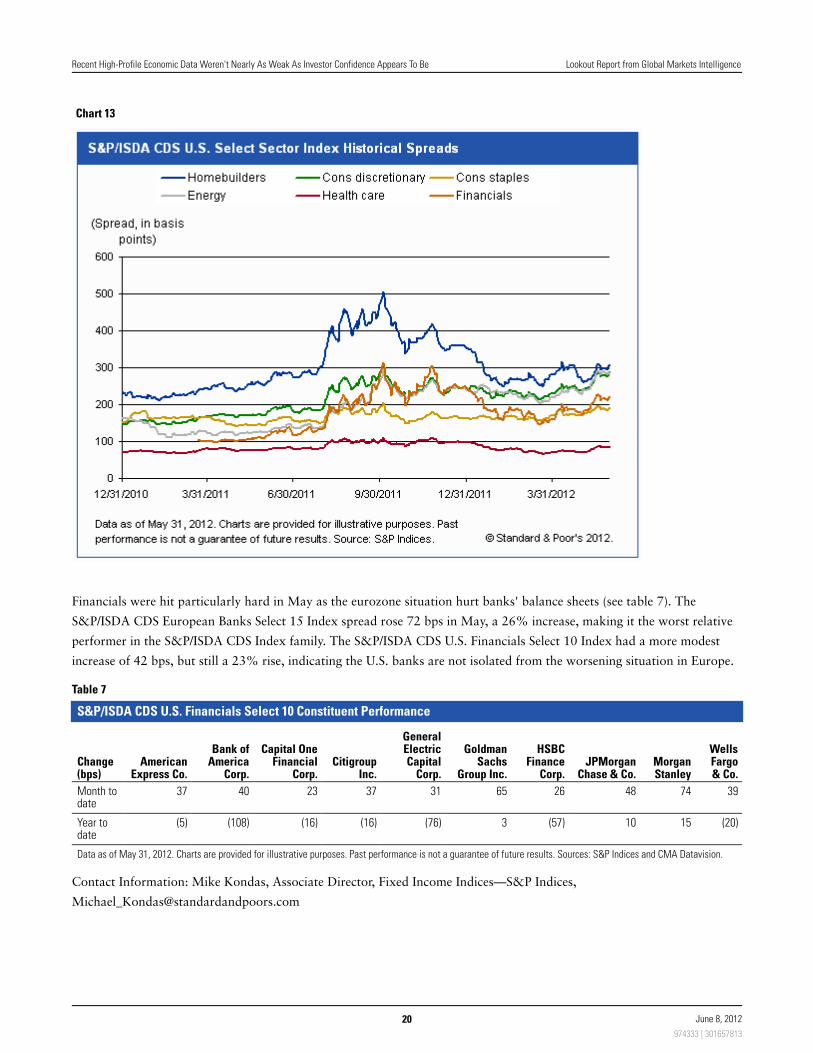
Chart 13
Financials were hit particularly hard in May as the eurozone situation hurt banks' balance sheets (see table 7). The
S&P/ISDA CDS European Banks Select 15 Index spread rose 72 bps in May, a 26% increase, making it the worst relative
performer in the S&P/ISDA CDS Index family. The S&P/ISDA CDS U.S. Financials Select 10 Index had a more modest
increase of 42 bps, but still a 23% rise, indicating the U.S. banks are not isolated from the worsening situation in Europe.
Table 7
S&P/ISDA CDS U.S. Financials Select 10 Constituent Performance
Change(bps)
AmericanExpress Co.
Bank ofAmerica
Corp.
Capital OneFinancial
Corp.Citigroup
Inc.
GeneralElectricCapital
Corp.
GoldmanSachs
Group Inc.
HSBCFinance
Corp.JPMorgan
Chase & Co.MorganStanley
WellsFargo& Co.
Month todate
37 40 23 37 31 65 26 48 74 39
Year todate
(5) (108) (16) (16) (76) 3 (57) 10 15 (20)
Data as of May 31, 2012. Charts are provided for illustrative purposes. Past performance is not a guarantee of future results. Sources: S&P Indices and CMA Datavision.
Contact Information: Mike Kondas, Associate Director, Fixed Income Indices—S&P Indices,
Recent High-Profile Economic Data Weren't Nearly As Weak As Investor Confidence Appears To Be Lookout Report from Global Markets Intelligence
20 June 8, 2012
974333 | 301657813
Capital Market Commentary: IPO Activity Slows After The Facebook Debut
IPOs
Since Facebook Inc.'s IPO more than three weeks ago, no IPOs (excluding two closed-end funds) have come to market,
according to S&P Capital IQ data. In addition, only five companies have since filed plans to sell common shares to the
investing public, with private equity-owned CKE Restaurants Inc.'s planned $100 million offering ranking as the largest
among them.
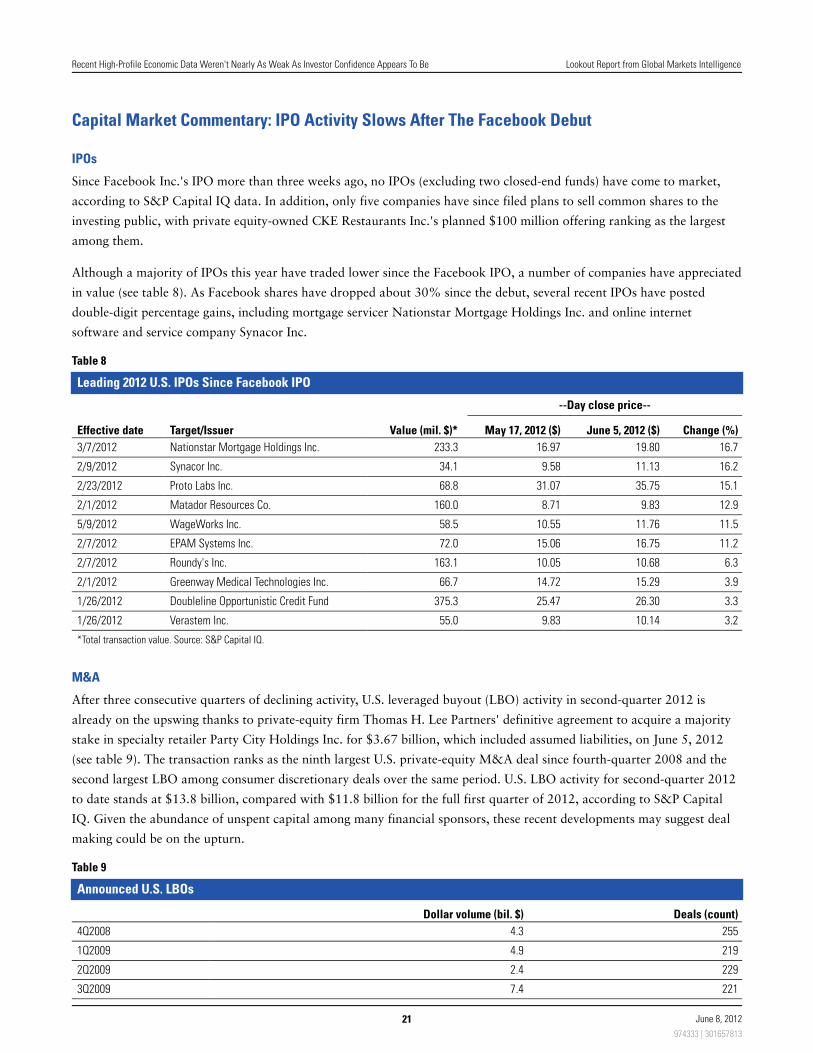
Although a majority of IPOs this year have traded lower since the Facebook IPO, a number of companies have appreciated
in value (see table 8). As Facebook shares have dropped about 30% since the debut, several recent IPOs have posted
double-digit percentage gains, including mortgage servicer Nationstar Mortgage Holdings Inc. and online internet
software and service company Synacor Inc.
Table 8
Leading 2012 U.S. IPOs Since Facebook IPO
--Day close price--
Effective date Target/Issuer Value (mil. $)* May 17, 2012 ($) June 5, 2012 ($) Change (%)
3/7/2012 Nationstar Mortgage Holdings Inc. 233.3 16.97 19.80 16.7
2/9/2012 Synacor Inc. 34.1 9.58 11.13 16.2
2/23/2012 Proto Labs Inc. 68.8 31.07 35.75 15.1
2/1/2012 Matador Resources Co. 160.0 8.71 9.83 12.9
5/9/2012 WageWorks Inc. 58.5 10.55 11.76 11.5
2/7/2012 EPAM Systems Inc. 72.0 15.06 16.75 11.2
2/7/2012 Roundy's Inc. 163.1 10.05 10.68 6.3
2/1/2012 Greenway Medical Technologies Inc. 66.7 14.72 15.29 3.9
1/26/2012 Doubleline Opportunistic Credit Fund 375.3 25.47 26.30 3.3
1/26/2012 Verastem Inc. 55.0 9.83 10.14 3.2
*Total transaction value. Source: S&P Capital IQ.
M&A
After three consecutive quarters of declining activity, U.S. leveraged buyout (LBO) activity in second-quarter 2012 is
already on the upswing thanks to private-equity firm Thomas H. Lee Partners' definitive agreement to acquire a majority
stake in specialty retailer Party City Holdings Inc. for $3.67 billion, which included assumed liabilities, on June 5, 2012
(see table 9). The transaction ranks as the ninth largest U.S. private-equity M&A deal since fourth-quarter 2008 and the
second largest LBO among consumer discretionary deals over the same period. U.S. LBO activity for second-quarter 2012
to date stands at $13.8 billion, compared with $11.8 billion for the full first quarter of 2012, according to S&P Capital
IQ. Given the abundance of unspent capital among many financial sponsors, these recent developments may suggest deal
making could be on the upturn.
Table 9
Announced U.S. LBOs
Dollar volume (bil. $) Deals (count)
4Q2008 4.3 255
1Q2009 4.9 219
2Q2009 2.4 229
3Q2009 7.4 221
Recent High-Profile Economic Data Weren't Nearly As Weak As Investor Confidence Appears To Be Lookout Report from Global Markets Intelligence
21 June 8, 2012
974333 | 301657813
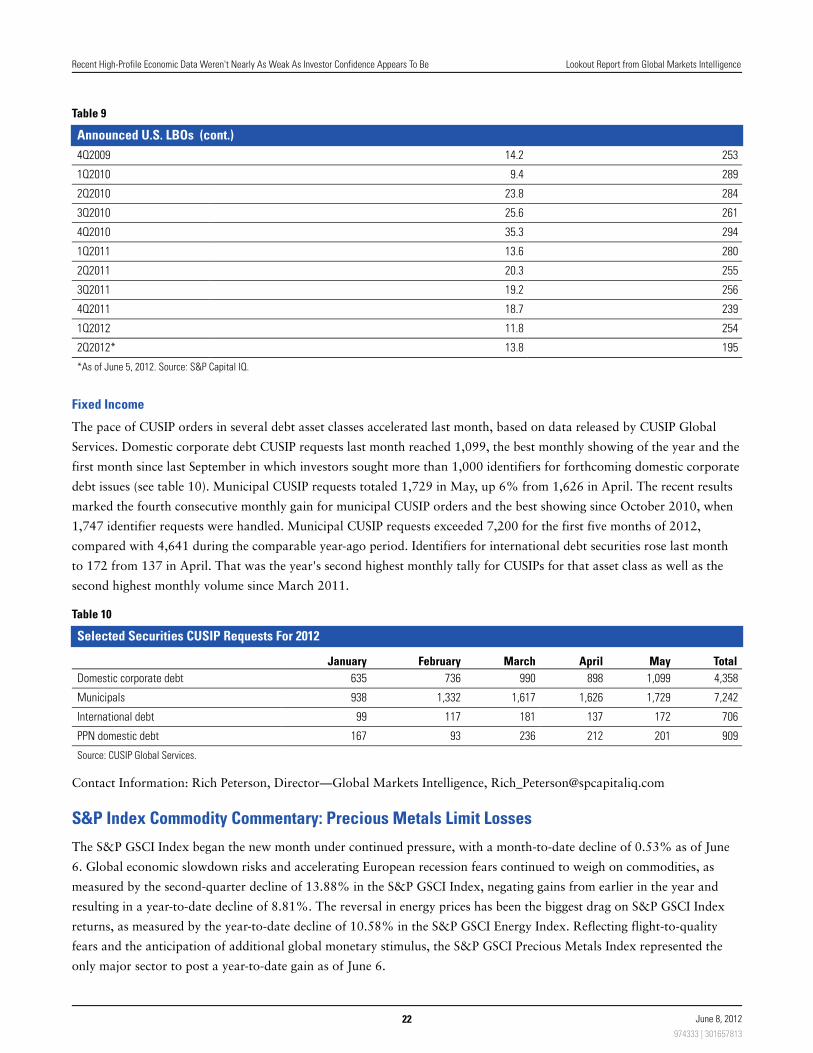
Table 9
Announced U.S. LBOs (cont.)
4Q2009 14.2 253
1Q2010 9.4 289
2Q2010 23.8 284
3Q2010 25.6 261
4Q2010 35.3 294
1Q2011 13.6 280
2Q2011 20.3 255
3Q2011 19.2 256
4Q2011 18.7 239
1Q2012 11.8 254
2Q2012* 13.8 195
*As of June 5, 2012. Source: S&P Capital IQ.
Fixed Income
The pace of CUSIP orders in several debt asset classes accelerated last month, based on data released by CUSIP Global
Services. Domestic corporate debt CUSIP requests last month reached 1,099, the best monthly showing of the year and the
first month since last September in which investors sought more than 1,000 identifiers for forthcoming domestic corporate
debt issues (see table 10). Municipal CUSIP requests totaled 1,729 in May, up 6% from 1,626 in April. The recent results
marked the fourth consecutive monthly gain for municipal CUSIP orders and the best showing since October 2010, when
1,747 identifier requests were handled. Municipal CUSIP requests exceeded 7,200 for the first five months of 2012,
compared with 4,641 during the comparable year-ago period. Identifiers for international debt securities rose last month
to 172 from 137 in April. That was the year's second highest monthly tally for CUSIPs for that asset class as well as the
second highest monthly volume since March 2011.
Table 10
Selected Securities CUSIP Requests For 2012
January February March April May Total
Domestic corporate debt 635 736 990 898 1,099 4,358
Municipals 938 1,332 1,617 1,626 1,729 7,242
International debt 99 117 181 137 172 706
PPN domestic debt 167 93 236 212 201 909
Source: CUSIP Global Services.
Contact Information: Rich Peterson, Director—Global Markets Intelligence, [email protected]
S&P Index Commodity Commentary: Precious Metals Limit Losses
The S&P GSCI Index began the new month under continued pressure, with a month-to-date decline of 0.53% as of June
6. Global economic slowdown risks and accelerating European recession fears continued to weigh on commodities, as
measured by the second-quarter decline of 13.88% in the S&P GSCI Index, negating gains from earlier in the year and
resulting in a year-to-date decline of 8.81%. The reversal in energy prices has been the biggest drag on S&P GSCI Index
returns, as measured by the year-to-date decline of 10.58% in the S&P GSCI Energy Index. Reflecting flight-to-quality
fears and the anticipation of additional global monetary stimulus, the S&P GSCI Precious Metals Index represented the
only major sector to post a year-to-date gain as of June 6.
Recent High-Profile Economic Data Weren't Nearly As Weak As Investor Confidence Appears To Be Lookout Report from Global Markets Intelligence
22 June 8, 2012
974333 | 301657813
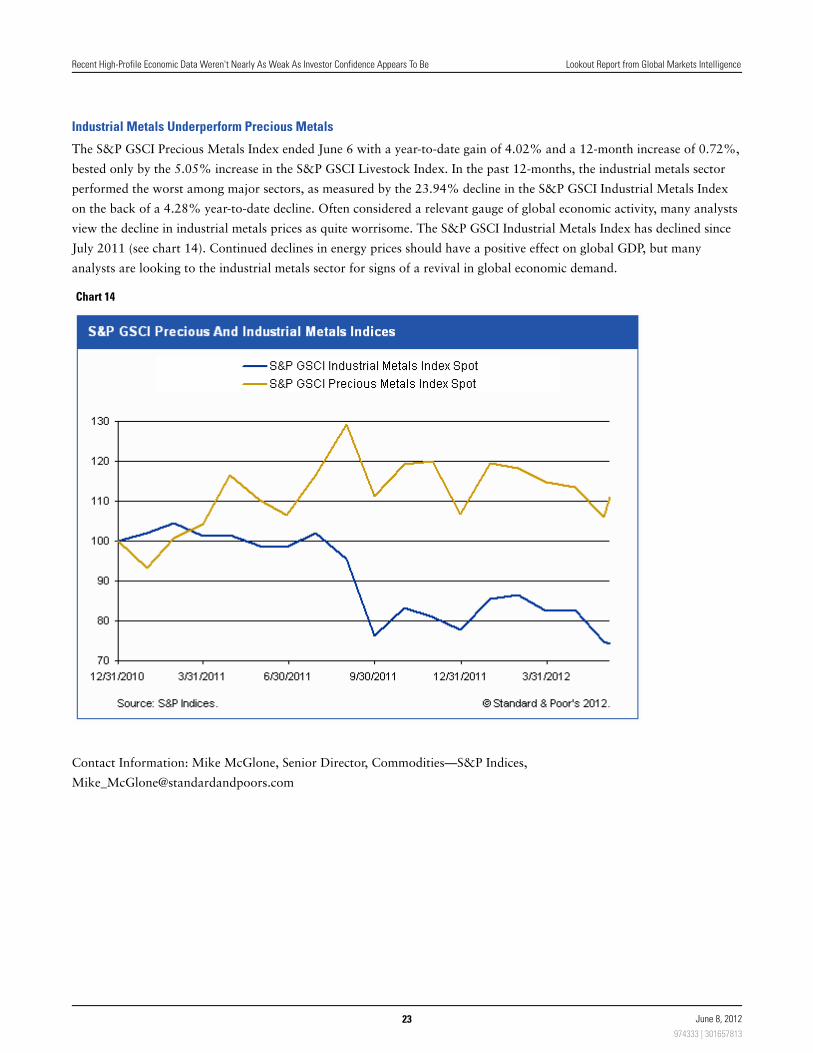
Industrial Metals Underperform Precious Metals
The S&P GSCI Precious Metals Index ended June 6 with a year-to-date gain of 4.02% and a 12-month increase of 0.72%,
bested only by the 5.05% increase in the S&P GSCI Livestock Index. In the past 12-months, the industrial metals sector
performed the worst among major sectors, as measured by the 23.94% decline in the S&P GSCI Industrial Metals Index
on the back of a 4.28% year-to-date decline. Often considered a relevant gauge of global economic activity, many analysts
view the decline in industrial metals prices as quite worrisome. The S&P GSCI Industrial Metals Index has declined since
July 2011 (see chart 14). Continued declines in energy prices should have a positive effect on global GDP, but many
analysts are looking to the industrial metals sector for signs of a revival in global economic demand.
Chart 14
Contact Information: Mike McGlone, Senior Director, Commodities—S&P Indices,
Recent High-Profile Economic Data Weren't Nearly As Weak As Investor Confidence Appears To Be Lookout Report from Global Markets Intelligence
23 June 8, 2012
974333 | 301657813
About S&P Capital IQ and S&P Indices Research & Analytics
S&P Capital IQ Research & Analytics
Global Markets Intelligence
Provides event-driven, multi-asset class market commentary and analysis; model development, and investment advisory services.
Research
Provides global company and funds research including insight into the performance of the world's leading investment funds.
Leveraged Commentary and Data
Delivers insight into the leveraged loan market through a combination of data, commentary, analysis, and real-time news.
S&P Indices
The world's leading index provider maintaining a wide variety of investable and benchmark indices to meet an array of investor
needs.
Sign up for your complimentary subscription: www.standardandpoors.com/lookout
Recent High-Profile Economic Data Weren't Nearly As Weak As Investor Confidence Appears To Be Lookout Report from Global Markets Intelligence
24 June 8, 2012
974333 | 301657813
S&P may receive compensation for its ratings and certain analyses, normally from issuers or underwriters of securities or from obligors. S&P reserves the right to disseminateits opinions and analyses. S&P's public ratings and analyses are made available on its Web sites, www.standardandpoors.com (free of charge), and www.ratingsdirect.comand www.globalcreditportal.com (subscription), and may be distributed through other means, including via S&P publications and third-party redistributors. Additionalinformation about our ratings fees is available at www.standardandpoors.com/usratingsfees.
S&P keeps certain activities of its business units separate from each other in order to preserve the independence and objectivity of their respective activities. As a result,certain business units of S&P may have information that is not available to other S&P business units. S&P has established policies and procedures to maintain theconfidentiality of certain nonpublic information received in connection with each analytical process.
To the extent that regulatory authorities allow a rating agency to acknowledge in one jurisdiction a rating issued in another jurisdiction for certain regulatory purposes, S&Preserves the right to assign, withdraw, or suspend such acknowledgement at any time and in its sole discretion. S&P Parties disclaim any duty whatsoever arising out of theassignment, withdrawal, or suspension of an acknowledgment as well as any liability for any damage alleged to have been suffered on account thereof.
Credit-related and other analyses, including ratings, and statements in the Content are statements of opinion as of the date they are expressed and not statements of fact.S&P's opinions, analyses, and rating acknowledgment decisions (described below) are not recommendations to purchase, hold, or sell any securities or to make anyinvestment decisions, and do not address the suitability of any security. S&P assumes no obligation to update the Content following publication in any form or format. TheContent should not be relied on and is not a substitute for the skill, judgment and experience of the user, its management, employees, advisors and/or clients when makinginvestment and other business decisions. S&P does not act as a fiduciary or an investment advisor except where registered as such. While S&P has obtained information fromsources it believes to be reliable, S&P does not perform an audit and undertakes no duty of due diligence or independent verification of any information it receives.
No content (including ratings, credit-related analyses and data, model, software or other application or output therefrom) or any part thereof (Content) may be modified,reverse engineered, reproduced or distributed in any form by any means, or stored in a database or retrieval system, without the prior written permission of Standard & Poor'sFinancial Services LLC or its affiliates (collectively, S&P). The Content shall not be used for any unlawful or unauthorized purposes. S&P and any third-party providers, as wellas their directors, officers, shareholders, employees or agents (collectively S&P Parties) do not guarantee the accuracy, completeness, timeliness or availability of theContent. S&P Parties are not responsible for any errors or omissions (negligent or otherwise), regardless of the cause, for the results obtained from the use of the Content, orfor the security or maintenance of any data input by the user. The Content is provided on an "as is" basis. S&P PARTIES DISCLAIM ANY AND ALL EXPRESS OR IMPLIEDWARRANTIES, INCLUDING, BUT NOT LIMITED TO, ANY WARRANTIES OF MERCHANTABILITY OR FITNESS FOR A PARTICULAR PURPOSE OR USE, FREEDOM FROM BUGS,SOFTWARE ERRORS OR DEFECTS, THAT THE CONTENT'S FUNCTIONING WILL BE UNINTERRUPTED, OR THAT THE CONTENT WILL OPERATE WITH ANY SOFTWARE ORHARDWARE CONFIGURATION. In no event shall S&P Parties be liable to any party for any direct, indirect, incidental, exemplary, compensatory, punitive, special orconsequential damages, costs, expenses, legal fees, or losses (including, without limitation, lost income or lost profits and opportunity costs or losses caused by negligence)in connection with any use of the Content even if advised of the possibility of such damages.
This report was prepared by the S&P Capital IQ Global Markets Intelligence group, formerly known as the Global Markets Intelligence research group. This group isanalytically and editorially independent from any other analytical group at S&P.
Copyright © 2012 by Standard & Poor's Financial Services LLC. All rights reserved.
25 June 8, 2012
974333 | 301657813