EUC2866 View Troubleshooting: Looking Under the Hood Name, Title, Company.
LOOKING UNDER THE HOOD OF COMPETENCY-BASED EDUCATION:The Relationship Between Competency-Based Education Practices and Students’ Learning Skills, Behaviors, and Dispositions
Erin HaynesKristina ZeiserWendy SurrAlison Hauser
Lauren ClymerJill WalstonCatherine BitterRui Yang

CBE settings offer students greater opportunities for personalized learning, autonomy, flexibility, and responsibility for their own learning (Patrick & Sturgis, 2013). These factors are theorized to contribute to improved learning behaviors.
TABLE OF CONTENTS

Introduction ..............................................................................................................p. 4
Methods School and Respondent Sample ............................................................................p. 6
Data Collection .....................................................................................................p. 6
Survey Data and Analysis ......................................................................................p. 7
Study Findings How Do School Policies and Classroom Practices Differ Between
Competency-Based Education (CBE) and Comparison Schools? ...............................p. 9
What Are Students’ Experiences of Competency-Based Education (CBE) and How Are These Experiences Related to Changes in Learning Capacities Over Time? ..........................................................p. 21
Conclusion ................................................................................................................p. 30
References ................................................................................................................p. 31
TABLE OF CONTENTS

4 American Institutes for Research
Competency-based education (CBE), an approach to instruction that places emphasis on what students learn and master rather than how much time they spend in school, is gaining popularity nationwide. CBE encompasses a range of practices and policies that vary across settings, but it typically includes the following features:
• Specific learning targets for what studentsshould know and be able to do to get credit.
• Assessment, support, and monitoring ofindividual students’ progress as they work towardmeeting these targets.
• Requirements that students demonstratemastery of competencies before they can earncredit and advance.
• Flexible pacing and progression (both extendedor accelerated).
CBE settings offer students greater opportunities for personalized learning, autonomy, flexibility, and responsibility for their own learning, which are theorized to contribute to improved learning behaviors (Patrick & Sturgis, 2013).
The goal of this study was to rigorously examine the relationship between CBE practices and changes in such learning capacities (i.e., the skills, behaviors, and dispositions that enhance student capacity to learn in school). Researchers administered surveys to Grade 9 students, core content teachers, and administrators in high schools identified by state education administrators and local school administrators as implementing CBE and a set of comparison high schools identified as not implementing CBE in three states.
The study found that the implementation of CBE practices varied greatly across and within schools, regardless of whether the school was categorized as implementing CBE. Significantly, more teachers in the study’s CBE schools reported using CBE practices than teachers in the comparison schools. However, the responses of teachers in CBE schools varied considerably, suggesting that implementation was not consistent in settings deemed “competency-based.” Furthermore, many teachers in schools that had not explicitly adopted a CBE approach nonetheless reported using elements of CBE practices. Similarly, students in both CBE and comparison schools reported that they experienced practices normally associated with CBE.
INTRODUCTIONWE USED SURVEY DATA TO
DO THE FOLLOWING
² Examine the extent to which educators reported implementing CBE practices in mathematics and English language arts (ELA) classes in CBE and comparison high schools.
² Assess the extent to which students experienced CBE practices in their first year of high school.
² �Explore the relationship between students’ experiences of CBE practices and changes in their learning capacities during their first year of high school.
5 Looking Under the Hood of Competency-Based Education
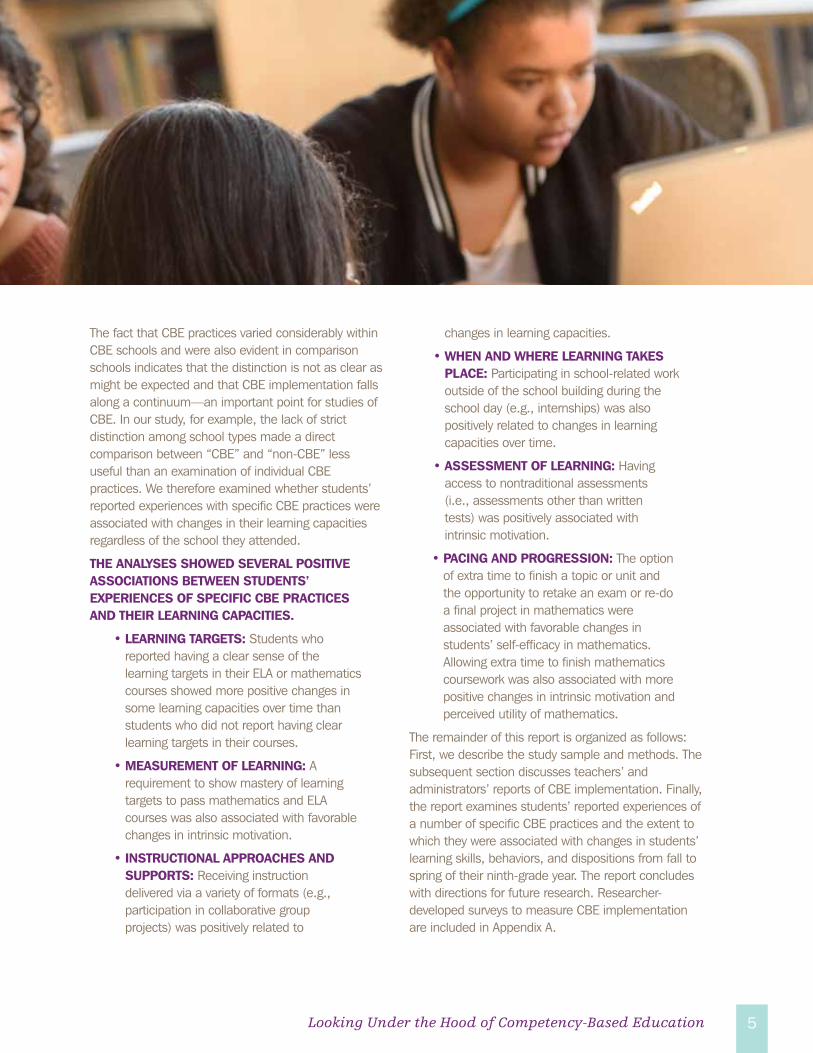
INTRODUCTIONThe fact that CBE practices varied considerably within CBE schools and were also evident in comparison schools indicates that the distinction is not as clear as might be expected and that CBE implementation falls along a continuum—an important point for studies of CBE. In our study, for example, the lack of strict distinction among school types made a direct comparison between “CBE” and “non-CBE” less useful than an examination of individual CBE practices. We therefore examined whether students’ reported experiences with specific CBE practices were associated with changes in their learning capacities regardless of the school they attended.
THE ANALYSES SHOWED SEVERAL POSITIVE ASSOCIATIONS BETWEEN STUDENTS’ EXPERIENCES OF SPECIFIC CBE PRACTICES AND THEIR LEARNING CAPACITIES.
• LEARNING TARGETS: Students whoreported having a clear sense of thelearning targets in their ELA or mathematicscourses showed more positive changes insome learning capacities over time thanstudents who did not report having clearlearning targets in their courses.
• MEASUREMENT OF LEARNING: Arequirement to show mastery of learningtargets to pass mathematics and ELAcourses was also associated with favorablechanges in intrinsic motivation.
• INSTRUCTIONAL APPROACHES ANDSUPPORTS: Receiving instructiondelivered via a variety of formats (e.g.,participation in collaborative groupprojects) was positively related to
changes in learning capacities.
• WHEN AND WHERE LEARNING TAKESPLACE: Participating in school-related workoutside of the school building during theschool day (e.g., internships) was alsopositively related to changes in learningcapacities over time.
• ASSESSMENT OF LEARNING: Havingaccess to nontraditional assessments(i.e., assessments other than writtentests) was positively associated withintrinsic motivation.
• PACING AND PROGRESSION: The optionof extra time to finish a topic or unit andthe opportunity to retake an exam or re-doa final project in mathematics wereassociated with favorable changes instudents’ self-efficacy in mathematics.Allowing extra time to finish mathematicscoursework was also associated with morepositive changes in intrinsic motivation andperceived utility of mathematics.
The remainder of this report is organized as follows: First, we describe the study sample and methods. The subsequent section discusses teachers’ and administrators’ reports of CBE implementation. Finally, the report examines students’ reported experiences of a number of specific CBE practices and the extent to which they were associated with changes in students’ learning skills, behaviors, and dispositions from fall to spring of their ninth-grade year. The report concludes with directions for future research. Researcher-developed surveys to measure CBE implementation are included in Appendix A.

6 American Institutes for Research
METHODSSchool and Respondent Sample We studied the implementation of CBE and associated changes in learning capacities in a group of high schools participating in the Innovation Lab Network facilitated by the Council of Chief State School Officers (CCSSO). The sample spanned three states and included 10 public schools that state education administrators as well as local district and school administrators identified as implementing CBE, and eight comparison high schools.
For each CBE school selected, we identified a comparison school in the same district or county that served a similar population of students but whose principal indicated that the school was not implementing
CBE. CBE schools were matched to comparison schools based on the percentage of students qualifying for free or reduced-price lunch and the percentage of students belonging to the largest racial or ethnic groups.2 Eight comparison schools participated in the study. In one district, a large high school served as the comparison for two small CBE schools. In another district, the comparison school dropped out of the study. For more information on sample selection and student population characteristics, please refer to Appendix B.
Data Collection Teacher and administrator surveys were administered in all of the sample schools between April and June 2015. Pre and post student surveys were administered to Grade 9 students in a subset of four CBE and four comparison schools, selected because they enrolled the largest number of Grade 9 students who were not exposed to CBE practices prior to high school. Baseline data assessing students’ learning capacities were collected between September and October 2014. Follow-up student data related to both their learning capacities and educational experiences were collected between April and June 2015. For more information about the types of data collected and constructs measured in the surveys, see Appendix C.
Within each school, the teacher and administrator samples included all core content teachers and at least
For our CBE sample, we sought schools with the following characteristics1:
• Reported current implementation of CBE policies and practices schoolwide.
• Had implemented CBE for at least two years (i.e., since the 2011–12 academic year).
• Served students in Grade 9 who had not attended a CBE middle school.
• Enrolled at least 200 ninth-grade students.
1 In some instances, we had to relax these requirements, such as allowing for more recently implemented CBE programs or schools with smaller Grade 9 enrollment, to identify a sufficient number of CBE schools to participate in each state. In addition, for schools that only completed the teacher and administrator surveys, we included schools that may have a CBE feeder middle school as well as schools that had a much smaller Grade 9 enrollment. Finally, in one state, there was only one high school in most counties, and so the degree of urbanization of the school (e.g., rural, urban, and suburban) was given greater consideration than the geographic closeness of the comparison school to the CBE school.
2 For each comparison school, the percentage of students qualifying for free or reduced-price lunch and the percentage of students belonging to the majority and largest minority racial or ethnic groups were within 10 percentage points of the CBE school population, with one exception. Within one school pair, the percentage of students qualifying for free or reduced-price lunch exceeded the percentage at the comparison school by 13 percentage points. However, this comparison school was deemed to be the best-matched comparison school because it is another large, comprehensive high school within the same school district.

7 Looking Under the Hood of Competency-Based Education
METHODSone administrator (typically the principal and assistant principal[s]). In all, 380 core content classroom teachers and 40 school administrators across the 18 sample schools were invited to complete a survey of educational policies and practices. In the four CBE and four comparison schools in which we also administered the student survey, the sample included 1,419 ninth-grade students. Approximately 10 percent of sampled students did not consent to participate in the study, and due to absences and transfers, there were different response rates in the fall and spring. Only students who responded to both the fall and spring surveys were included in our analytic sample so that we could measure changes in their learning capacities over timeSee Table 1 for a summary of the sample size drawn for each targeted group of respondents, number of individuals who responded, and response rate.
To account for the possibility that students attending CBEschools differed systematically from students attending comparison schools, we collected student demographic and achievement background data from district and state data systems. For all of the students who responded to the fall and spring surveys (n = 1,054), we obtained information about gender, race/ethnicity, special education status, English language learner (ELL) status, and Grade 8 mathematics and ELA achievement test scores. Students with missing background
information were excluded from the final analysis sample (approximately 8 percent of student respondents in comparison schools and 4 percent of respondents in CBE schools). See Appendix D for more information regarding the composition of our student sample.
Survey Data and Analyses
CBE Practices
To examine CBE practices, we administered additional surveys to teachers, administrators, and students in
CBE and comparison schools. Survey items were designed to measure CBE practices in six domains: learning targets, instructional approaches, and supports, when and where learning takes place, assessment strategies, measurement of learning, and pathways and progression. For many of the CBE constructs measured in
the surveys, we combined information from three or more survey items into scales. See Appendix D for a more detailed description of the creation of survey scales. To compare differences in practices as reported by teachers in CBE schools and teachers in comparison schools, as well as differences in student experiences in CBE and comparison schools, we performed statistical tests that allowed us to determine whether observed differences were statistically significant.3
TARGET RESPONDENT
GROUPS
NUMBER SAMPLED
NUMBER RESPONDING
RESPONSE RATES
NUMBER SAMPLED
NUMBER RESPONDING
RESPONSE RATES
Studentsa 737 508 69% 682 546 80%
Teachers 161 111 73% 219 146 72%
Administrators 19 16 84% 21 14 71%
To account for the possibility that students attending CBE schools
differed systematically from students attending comparison
schools, we collected student demographic and achievement background data from district
and state data systems.
3 Because of the large number of comparisons made within this report, we applied the Bonferroni correction within each domain of CBE practices and policies. This correction is used to reduce the probability of identifying differences that are statistically significant by chance. The p values used to determine significance (described in Appendix E) therefore differ between analyses of teacher survey and student survey data and across the domains of CBE practices and policies.
a These numbers are based on the number of students who responded to both the fall and spring survey. The total pool of student respondents includes all students enrolled in the ninth grade in participating schools.
Table 1. Student, Teacher, and Administrator Survey Sample Sizes
CBE SCHOOLS COMPARISON SCHOOLS

8 American Institutes for Research
Student Learning Capacities
Students responded to survey items measuring 16 learning capacities in three domains (see circles below for descriptions of the domains). For our analysis, we measured students’ learning capacities using scales developed from items in a survey administered in both fall 2014 and spring 2015. Surveys measuring students’ experiences of CBE features were administered late in spring 2015, so their experiences
would reflect the entire 2014–15 academic year. To determine whether changes in learning capacities (i.e., scale values from the spring survey administration minus the scale values from the fall administration) were related to specific CBE practices and policies, we performed regression analyses that controlled for student demographic characteristics and Grade 8 achievement test scores. For more information on scale development and data analysis, please refer to Appendix D.
Students’ academic mindsets and dispositions include attitudes and
beliefs about oneself as a learner, as well as feelings of connection with and engagement in school. They
include intrinsic motivation, self-efficacy in mathematics
and ELA, and sense of belonging in school.
Self-regulated learning strategies are the self-directed, meta-cognitive, and self-control strategies students use to engage in learning, including making
an explicit effort to connect new learning to what they already know
and directing attention towards key learning tasks.
Academic behaviors are the observable, outward signs that a student is engaged and putting
forth effort to learn and participate in school. Examples include
preparation for class and active interest in learning.
DOMAIN 1: STUDENT ACADEMIC
MINDSETS AND DISPOSITIONS
DOMAIN 2: SELF-REGULATED LEARNING SKILLS
DOMAIN 3: ACADEMIC BEHAVIOR

9 Looking Under the Hood of Competency-Based Education
Section 1:
How Do School Policies and Classroom Practices Differ Between Competency-Based Education (CBE) and Comparison Schools? Overall, teachers in CBE schools were more likely than teachers in comparison schools to report implementing some CBE-aligned practices, such as establishing learning targets, providing individualized support, and offering flexibility in assessment and instructional pacing. However, teachers in schools categorized as CBE were no more likely than comparison school teachers to report engaging in other CBE-aligned practices, such as having students take primary responsibility for keeping track of their own learning and progress. In addition, implementation of CBE-aligned practices was not uniform within CBE schools; variation in teacher-reported practices within schools was about the same as (and for some features much greater than) variation among schools.
STUDY FINDINGS
4 In the surveys, teachers were asked to consider one of their classes, either Grade 9 mathematics or ELA. If they did not teach Grade 9 mathematics or ELA, they were asked to consider a core subject that they taught for Grade 9 students. If they did not teach Grade 9 students, then they were asked to consider a core subject taught to Grade 10–12 students.
5 We did not perform statistical tests of administrator survey data due to the small number of administrators who took the survey.
The findings from the study are presented in two sections. First, we describe the reported implementation of CBE practices in CBE and comparison schools. We then examine students’ experiences of CBE practices and describe how these experiences are related to changes in their learning capacities.
The first goal of this study was to measure the implementation of CBE practices at both the school and classroom level from the perspectives of administrators and teachers.4 (Student perspectives are presented in the next section of the report.) The teacher survey results, which include statistical comparisons between CBE and comparison schools, were the focus of our analysis because they provide insight about practices at the classroom level. Administrator survey results provided additional information about the policy contexts in which teachers operate.5
This section is organized by the six domains of CBE implementation addressed in each survey: learning targets, measurement of learning, instructional approaches and supports, when and where learning takes place, assessment strategies, and pathways and progression. Box 2 provides descriptions of these domains. Findings are presented from survey items that represent the defining elements of each domain. (The full surveys, as well as comparison results for all survey items and scales, are provided in Appendix A.)

10 American Institutes for Research
Box 1. Description of Learning Capacities and Measures
LEARNING TARGETS
In a CBE setting, learning targets (or competencies) are explicit, shared with students, and based on rigorous college and career readiness standards (CCSSO, 2013; New Hampshire Department of Education [NHDOE], 2007; Patrick & Sturgis, 2013). Students are expected to demonstrate mastery of these targets in order to advance academically. In more personalized CBE settings, students may negotiate the means by which they obtain and demonstrate mastery.
MEASUREMENT OF LEARNING In CBE settings, what counts toward course grades, course credit, and evaluation of proficiency is demonstrated mastery, not participation, effort, or how long learning takes (e.g., CCSSO, 2013; NHDOE, 2007; Patrick & Sturgis, 2013).
INSTRUCTIONAL APPROACHES AND SUPPORTS
Because learning in CBE settings is more individualized than in traditional settings, teachers may make greater use of technology and more flexible and student-centered instructional strategies (CCSSO, 2013; NHDOE, 2007). In some CBE models, students have considerable autonomy, responsibility, and choice regarding their learning. Individualized guidance about meeting learning targets is also considered a key feature of CBE environments (Patrick & Sturgis, 2013).
WHEN AND WHERE LEARNING TAKES PLACE
The focus in CBE settings is on students’ learning and the mastery of competencies, with less emphasis on class and school attendance (i.e., seat time) (CCSSO, 2013; Le, Wolfe, & Steinberg, 2014; Patrick & Sturgis, 2013). As a result, students may have more flexibility regarding when and where they complete their work and greater opportunities to earn credit through activities, projects, online coursework, and internships that are completed outside of the traditional school setting and schedule.
ASSESSMENT STRATEGIESAssessment of learning is considered a core feature of CBE. In a CBE setting, learning is continuously tracked and shared with students, and students receive feedback and support based on individual needs identified through assessment (Le et al., 2014; NHDOE, 2007; Patrick & Sturgis, 2013). Students in CBE settings are generally given greater latitude in retaking assessments and greater choice regarding the types of assessments used to demonstrate mastery.
PACING AND PROGRESSIONIn a traditional school setting, students complete required courses on a prescribed schedule. In contrast, students in CBE settings may progress at their own pace, with progression contingent on demonstrating mastery of learning targets rather than the amount of time spent in classrooms. Grade-level advancement and graduation are based on demonstrated mastery of required competencies, with students given flexibility, support, and opportunities for an accelerated pace or extended time if necessary (CCSSO, 2013).
Domains of CBE Implementation

11 Looking Under the Hood of Competency-Based Education
Learning Targets In a CBE environment, what determines mastery of learning targets (i.e., what counts toward course grades, course credit, and evaluation of mastery) is clearly defined and communicated to students (e.g., CCSSO, 2013; NHDOE, 2007; Patrick & Sturgis, 2013). The findings of our study suggest that requiring mastery of learning targets is a common practice in both CBE and comparison schools. A majority of administrators at both CBE (14 of 16) and comparison schools (10 of 14) reported that students in their school were expected to meet specific learning targets. Teachers in CBE schools were more likely than teachers in comparison schools to report requiring that students demonstrate proficiency of learning targets. Still, more than half of comparison teachers reported the same requirement (see Table 2), suggesting that this practice is fairly common in traditional as well as CBE schools.
Table 2. Teachers’ Reported Requirements for Mastering Learning Targets
ITEM
Q. Do students need to demonstrate proficiency (or mastery) of a specific set of learning targets (i.e., specific skills, knowledge, or abilities) in order to
pass and get credit? (Yes/No)
Comparison54
CBE72a
PERCENTAGE WHO REPLIED YES
Measurement of Learning A related component of CBE is how mastery of learning targets is measured and used to determine progression through grade levels and graduation (i.e., “what counts” toward grades and credit). In an ideal CBE setting, what counts toward credit is students’ mastery of competencies, not their attendance, level of participation, or effort.
In fact, we found that teachers and administrators from CBE schools reported the use of a mix of traditional and CBE-aligned practices for measuring learning and determining school progress. The pattern of responses suggests that CBE schools use traditional measurement of learning practices in addition to CBE-aligned practices. For example, six of the 16 administrators at CBE schools (compared with three of the 14 administrators at comparison schools) reported a seat-time requirement, and six of the 16 administrators at CBE schools (compared with one administrator at the comparison schools) reported an attendance requirement for graduation. In addition, all of the CBE school administrators reported that demonstration of competencies was required for graduation, compared with 10 of the 14 administrators in comparison schools.
To examine how learning was measured at the classroom level, teachers were asked which factors, such as attendance and participation, counted in determining a student’s grade or whether a student would receive credit for a course. There were no
significant differences between teachers in CBE and comparison schools in their reported use of different measures of learning to determine whether students would pass and get credit for a course, including more traditional measures of learning, such as attendance, class participation, homework, and completion of work by a due date, as well as the CBE-aligned practice of measuring students’ level of mastery in meeting course learning targets.
Another potentially distinguishing feature of CBE is that students may be required to demonstrate mastery of their learning targets multiple times and in multiple ways in order to show deep or thorough understanding. However, they are given flexibility in how they do so. Figure 1 shows that, among the 72 percent of teachers in CBE schools and 54 percent of teachers in comparison schools who reported having learning targets for their classes:
• A substantial number of teachers from bothgroups reported that they require all students todemonstrate mastery in the same way (nodifference between school types). In otherwords, teachers did not tailor the type ofassessment to student needs or interests.
• Teachers in CBE schools were more likely toreport requiring students to demonstrate masteryof a given learning target multiple times.
• There was no difference in requiring students todemonstrate mastery in multiple ways.
a Significant difference: p <.05.

12 American Institutes for Research
Figure 1. How Teachers Require Students to Demonstrate Proficiency of Learning Targets
6 Teachers were asked about six specific uses of technology in their classroom: three items addressed uses of technology to customize instruction, assessment, and proficiency tracking (to provide customized assessment, to provide customized instructional supports, to track student progress or proficiency), and three items address more traditional uses of technology (to track assignment completion, to track student grades or credits, and to post course resources and materials for students to access). Three scales were created from these items: the number of “traditional” uses of technology (Cronbach’s alpha = .52), the number of uses of technology related to customizing instruction, assessment and proficiency tracking (Cronbach’s alpha = .53), and a scale counting the total number of uses of technology (Cronbach’s alpha = .61).
0% 20% 40% 60% 80% 100%
63%
81%
46%
35%
61%*
33%
Students must demonstrate pro�ciency of a speci�c set of learning targets in order to pass and get credit.
Students are required to demonstrate mastery or pro�ciency of learning targets in the same way in my course
Students must demonstrate their mastery or pro�ciency of the learning target in multiple ways in my course
Students must demonstrate mastery or pro�ciency of the learning target more than once in my course
Among the teachers who reported having learning targets for their classes...
CBE
Comparison
0% 20% 40% 60% 80% 100%
72%*
54%
Instructional Approaches and Supports Another distinguishing characteristic of CBE is that learning is more individualized than in traditional settings. CBE settings may employ more supportive technology, a wider range of learning opportunities, and more flexible instructional strategies to meet the varying needs of individual students (CCSSO, 2013; NHDOE, 2007). CBE settings may also provide more individualized guidance for students about meeting learning targets (Patrick & Sturgis, 2013).We asked teachers and administrators about technology use,6 individualized student guidance and support, customized learning activities, instructional practices, and opportunities for student decision making. We found that teachers in CBE schools, when compared with teachers in comparison schools, were more likely to do the following:
• Use technology to customize instruction and track student proficiency—although all teachers, regardless ofschool type, reported frequent use of technology in general
• Meet with students formally and develop individualized learning plans, regardless of their success in school
• Provide opportunities for students to make their own decisions about learning—although the number of CBEteachers implementing this practice was still fairly low
When asked about other typical CBE instructional approaches, teachers in the two types of schools reported similar
13 Looking Under the Hood of Competency-Based Education
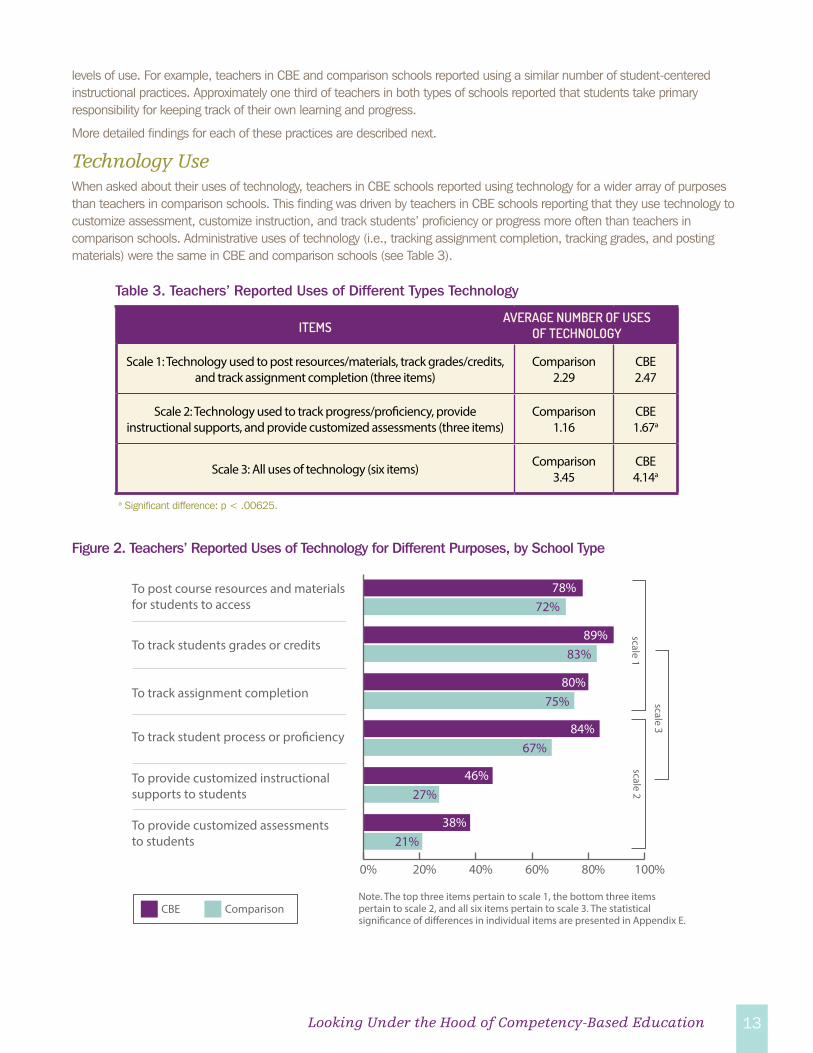
Figure 2. Teachers’ Reported Uses of Technology for Different Purposes, by School Type
ITEMS
Scale 1: Technology used to post resources/materials, track grades/credits, and track assignment completion (three items)
Comparison2.29
CBE2.47
Scale 2: Technology used to track progress/proficiency, provide instructional supports, and provide customized assessments (three items)
Comparison1.16
CBE1.67a
Scale 3: All uses of technology (six items) Comparison3.45
CBE4.14a
AVERAGE NUMBER OF USES OF TECHNOLOGY
To post course resources and materials for students to access
To track students grades or credits
To track assignment completion
To track student process or proficiency
To provide customized instructional supports to students
To provide customized assessments to students
Note. The top three items pertain to scale 1, the bottom three items pertain to scale 2, and all six items pertain to scale 3. The statistical significance of differences in individual items are presented in Appendix E.
CBE Comparison
0 20 40 60 80 100% % % % % %
21%38%
27%46%
67%84%
75%80%
72%78%
83%89%
Table 3. Teachers’ Reported Uses of Different Types Technology
levels of use. For example, teachers in CBE and comparison schools reported using a similar number of student-centered instructional practices. Approximately one third of teachers in both types of schools reported that students take primary responsibility for keeping track of their own learning and progress.
More detailed findings for each of these practices are described next.
Technology Use When asked about their uses of technology, teachers in CBE schools reported using technology for a wider array of purposes than teachers in comparison schools. This finding was driven by teachers in CBE schools reporting that they use technology to customize assessment, customize instruction, and track students’ proficiency or progress more often than teachers in comparison schools. Administrative uses of technology (i.e., tracking assignment completion, tracking grades, and posting materials) were the same in CBE and comparison schools (see Table 3).
a Significant difference: p < .00625.

14 American Institutes for Research
Individualized Student Guidance and Support The next set of survey items asked teachers whether they had formal meetings with students and whether their students had individualized learning plans. Teachers in CBE schools were more likely than teachers in comparison schools to report meeting with students regardless of how well the students were doing in school. This difference was likely due to school culture or policy in CBE schools; 15 of 16 administrators in CBE schools reported that teachers met with students regardless of achievement levels, compared with seven of 14 comparison administrators. CBE teachers also were more likely to report that all students had learning plans: 32 percent of teachers in CBE schools reported that all students had an individualized learning plan, compared with 10 percent of teachers in comparison schools (see Table 4).7
Opportunities for Student Decision Making Student autonomy, responsibility, and decision making is another important feature of the CBE instructional environment. Survey items on this topic asked respondents how decisions are made about the topics students learn, the activities students undertake for homework, and how students demonstrate what they learned. Although CBE schools reported opportunities for student decision making at a higher rate than comparison schools, the rates were low overall.
All comparison school administrators reported that ninth-grade students get to choose which courses they take, as did 15 of the 16 CBE administrators. However, only six of the CBE administrators reported that ninth-grade students could choose the kinds of learning experiences they wanted to participate in, compared with one comparison school administrator.
7 Teachers were asked in a separate question whether learning plans were provided just for students who were struggling and needed extra support. Teachers in CBE and comparison settings were similarly likely to meet with students who were struggling academically.
ITEMS
Q. Do you have formal meetings with students (individually or insmall groups) to discuss how they are doing in school overall (i.e.,not just how they are doing in your specific course), regardless of
how well they are doing in school? (Yes/No)
Comparison32
CBE68a
Q. Do all or most students in your school have written,individualized learning plans? (Yes/No)
Comparison10
CBE32a
Table 4. Teachers’ Reported Use of Individualized Guidance and Support
PERCENTAGE WHO REPLIED YES
a Significant difference: p < .00625.

15 Looking Under the Hood of Competency-Based Education
Figure 3 shows teacher responses to question about who makes instructional decisions at the classroom level. Although some student participation in decision making occurs, the primary takeaway from this figure is that teachers reported making the majority of instructional decisions in both types of schools. However, in most cases, CBE teachers report that students play a greater role in decision making about their learning.
Teachers in CBE and comparison schools responded similarly on a survey item about the extent to which students take primary responsibility for keeping track of their own learning and progress (34 percent in comparison schools and 36 percent in CBE schools, not a significant difference).
Figure 3. Percentage of CBE and Comparison Teachers Reporting Substantial Student Input in Various Aspects of Instructional Decision Making
What kind of help and support each student needs
The student and I decide together or the student decides...
How fast or slow each student moves through the course content
How each student will show what he or she learned
What activities or coursework a student does outside of class
The due date for each student’s coursework
Which activities or coursework a student does during class
Which topics each student learns in class every day
Which each student will take a final exam or assessment
CBE Comparison
0% 20% 40% 60% 80% 100%
59%57%
24%35%
17%35%
19%29%
12%22%
10%17%
5%16%
4%13%
Note: Statistical significance of differences in individual items are presented in Appendix E. The percentages reported here include three response options: “the student and teacher decide together,” “the student decides with some teacher input,” and “the student decides on his/her own.” Responses not included in this figure include “the teacher decides” and “the teacher decides with some student input.”

Teacher surveys also asked teachers to report the frequency with which they used varied and flexible instructional practices in the classroom, including having students give presentations in front of the class, having students collaborate on assignments and projects, having students participate in activities outside the school building during the school day, and having students complete independent studies. Figure 4 shows the percentage of teachers in each set of schools who
reported using specific instructional practices at least once per week.
For each teacher, we counted the number of the practices in Figure 4 (ranging from zero to seven) that teachers reported using at least once a week. Teachers in CBE schools reported using an average of 2.8 of these practices each week; comparison teachers used an average of 3.2 practices each week. This difference was not statistically significant.
Students help each other with school work
Students participate in applied learning activities in class
Students work together in groups on a project
Students review and discuss another student’s work
Students work on an independent study of project as part of the course
Students give presentations in front of the class or a group
CBE Comparison
0% 20% 40% 60% 80% 100%
Note. Statistical significance of differences in individual items are presented in Appendix E.
96%
86%
55%
73%
47%
51%
41%
51%
16%
23%
18%
16%
Figure 4. Teachers Reporting Use of Various Instructional Practices at Least Once per Week, by CBE and Comparison Schools
Instructional Practices

17 Looking Under the Hood of Competency-Based Education
The focus of CBE settings is generally on students’ mastery of competencies, regardless of where and when this learning takes place. Schools with a CBE focus often place less emphasis on traditional class time and, instead, offer more opportunities for students to learn outside of the classroom through online and applied learning options. In this study, we found that, while CBE schools were more likely to allow non-classroom opportunities for earning credit, these practices were not widespread for Grade 9 students in either CBE or comparison schools.
Teacher survey items examined opportunities for students to earn credit through activities, projects, online coursework, and internships completed outside of the traditional school setting and hours. Figure 5 shows the percentage of CBE and comparison teachers reporting that these opportunities are part of regular school practices. For each teacher, we counted how many of these four opportunities regularly count towards credit. On average, teachers in comparison schools reported that one of the four opportunities count towards credit, and teachers in CBE schools reported about one and a half (0.97 vs. 1.44, p < 0.05).
Figure 5. Percentage of Teachers Reporting Regular Opportunities to Earn Credit for Learning Outside of the Classroom, by CBE and Comparison Teachers
Students take an on-line course for credit in lieu of an in-person course
Students earn full course credit for courses they take outside of school
Students earn full course credit for doing an independent study
Students earn full course credit for activities they do outside of school
Note. Statistical significance of differences in individual scale items are presented in Appendix E.
0% 20% 40% 60% 80% 100%
CBE Comparison
30%
52%
50%
44%
29%
15%
14%
9%
When and Where Learning Takes Place
These classroom-level findings may be a result of school-level policies. A large majority of administrators in both CBE and comparison schools (13 of 16 CBE administrators and 12 of 14 comparison school administrators) reported that their Grade 9 students had to be in the building for a set time during the school day. One administrator each in both CBE and comparison schools reported that the school offers a regular time during the school day when Grade 9 students can participate in activities outside of class.
Assessment Strategies In an ideal CBE setting, learning is continuously tracked and results shared with students (Le et al., 2014; NHDOE, 2007; Patrick & Sturgis, 2013). Such schools have explicit strategies for measuring mastery of learning targets and offer greater flexibility and choice in demonstrating mastery (Le et al., 2014; NHDOE, 2007). Typically, students in CBE settings can attempt a summative assessment as many times as necessary without negative consequences as long as they ultimately demonstrate mastery. We found that in the CBE schools in this study, teachers were no more

18 American Institutes for Research
likely to provide different types of summative assessments than in comparison schools. However, CBE teachers did report offering students greater flexibility in retaking summative assessments or demonstrating competency in alternative ways if they performed poorly on the original assessment.
Teachers were asked about the use of alternative summative assessment strategies such as performance assessments, end-of-course papers or presentations, rating of student work samples, and student self-assessments. Figure 6 shows the percentage of teachers who reported using each type of summative assessment regularly in their classroom.
Figure 6. Frequency of Summative Assessment Types as Reported by CBE and Comparison Teachers
Performance assessment
End-of-unit of end-of-course project or presentation
End-of-unit of end-of-course paper
Review and rating(s) of student work
Student self-assessment results
Note. Statistical significance of differences in individual scale items are presented in Appendix E.
0% 20% 40% 60% 80% 100%
CBE Comparison
33%
36%
41%
34%
39%
32%
18%
21%
14%
15%
The average number of these assessment options offered, 1.4 in CBE schools and 1.5 in comparison schools, did not differ significantly. However, teachers in comparison schools were significantly more likely to use end-of-course final exams relative to CBE teachers (93 percent compared with 63 percent). In addition, 69 percent of CBE teachers reported allowing students to retake or re-do a summative assessment, compared with 43 percent of comparison teachers (Table 5).
ITEMS
Q. Are students allowed to retake or re-do a summative assessment (without points off) (Yes/No)?
Comparison43
CBE69a
Q. How often do you use end-of-course final exams? (Is a regular classroom practice, Yes/No)
Comparison93a
CBE63
Table 5. Teachers’ Reported Assessment Strategies
PERCENTAGE WHO REPLIED YES
a Significant difference: p < .0125.

19 Looking Under the Hood of Competency-Based Education
We examined the consequences of students’ poor summative assessment performance, asking teachers if they offered students any of the following three options:
• Arranging for the student to receive additional instructional support
• Allowing students to demonstrate their understanding in a different way
• Allowing students to re-do the assignment (or retake the assessment) at a later date without taking points off
On average, teachers in CBE schools reported offering students 2.8 of these options most or all of the time, while comparison school teachers offered 2.5 of these options. Although the use of alterative assessments was significantly higher in CBE schools (p < .0125), the rate was high overall in both.
8 For comparison purposes, we developed a scale from these three items. The scale had high internal consistency with a Cronbach’s alpha of .62.
As discussed previously, course credit, grade-level advancement, and graduation are based on demonstrated mastery of required competencies in a prototypical CBE setting. An important component of this approach is flexible pacing—the time students need to achieve mastery may vary. On this topic, our sample teachers were asked whether students were allowed to move on to the next topic regardless of mastery, whether students could take extra time to finish a topic even if other students have moved on, and whether a student who understood a topic could move ahead of other students—or whether students were required to stay on pace with their peers. Overall, CBE teachers reported higher levels of flexible pacing relative to comparison teachers.
Table 6 shows the percentage of teachers in CBE and comparison schools who reported providing different degrees of flexibility in pacing. Teachers in CBE schools were more likely than teachers in comparison schools to report giving students extra time to finish a topic and to allow students to move on ahead of classmates if they had mastered a topic (although this practice was less common overall). Comparison school teachers were more likely to report that students needed to move onto the next topic regardless of mastery.
ITEMS
Students can take extra time to finish a topic, unit, or competency area if they need to, even if other students have already moved on.
Comparison28
CBE50a
Students who show that they understand a topic, unit, or competency area can move ahead of other students.
Comparison10
CBE29a
Students move on to the next topic, unit or competency area along with their classmates, regardless of whether they achieved mastery.
Comparison63a
CBE38
Table 6. Classroom Practices Related to Pathways and Progression
PERCENTAGE REPORTING AS A REGULAR CLASSROOM PRACTICE
Pacing and Progression
a Significant difference: p < .01667.

20 American Institutes for Research
At the school level, 10 of the 16 CBE administrators and seven of the 14 comparison administrators reported that students can progress at their own pace as an occasional or regular school practice in their schools; five of the 14 comparison administrators said that self-paced progression was never employed in their schools.
Findings across the six CBE domains indicate that CBE practices were not implemented universally in CBE schools, nor were they exclusive to CBE schools. We therefore examined how much of the variation in reported practices occurred among teachers within the same school versus how much variation in reported practices occurred among schools. This analysis, called a variance-decomposition analysis, is described in greater detail in Appendix D. Overall, we found high levels of variation of teacher reports within schools, particularly for features
that may be classroom specific (e.g., how teachers measure student learning). The amount of variation observed within schools was almost equal to the amount of variation observed among schools, even for features that we would expect to see implemented schoolwide (e.g., students having written learning plans and the use of technology to customize instruction). This suggests uneven implementation of CBE practices within most schools.
Variation in CBE Implementation

21 Looking Under the Hood of Competency-Based Education
This study found many areas in which teachers in CBE schools were more likely than teachers in comparison schools to report implementing CBE-aligned practices in their classrooms, such as establishing learning targets, providing individualized support, and offering flexibility in assessment and instructional pacing. However, many comparison school teachers reported using the CBE-aligned practices as well. Importantly, findings show variation in implementation within both CBE and comparison schools, even when the overall difference between the two school types was significant. In other words, CBE practices were not implemented universally in the CBE schools, and teachers in comparison schools have adopted some CBE practices.
These findings highlight complications with categorizing schools as “CBE” or “non-CBE.” A true CBE setting is characterized by a wide variety of school policies and classroom practices that focus on the mastery of competencies, but there is a lot of latitude in how these policies and practices are implemented, and, as our study revealed, many of these practices may also occur in traditional educational settings. The findings suggest that examinations of how CBE influences student outcomes must also include examinations of which CBE practices are in place. We suggest that the surveys developed for this study can be helpful measures of a variety of CBE practices.
In the next section, we further investigate CBE practices by examining students’ reported experiences of CBE practices and the extent to which they influence, as hypothesized, changes in students’ learning capacities over time.
Implementation Summary
In this section, we examine students’ reported experiences of CBE practices, discussing the extent to which students attending CBE schools were more likely to experience each practice relative to students attending comparison schools. We then explore the extent to which students’ experience of these CBE practices is associated with positive changes in three learning domains: 1) academic mindsets and dispositions, 2) self-regulated learning skills, and 3) academic behaviors. Individual attributes within these domains and how they were measured in student surveys are described in Box 2.
Due to the extent to which students in the comparison schools also reported experiencing CBE-aligned practices, we examine the relationship between experiences of CBE practices and change in learner capacity regardless of
school type.9 Analyses were performed based on assumptions about which CBE features should be related to which student learning capacities. Table 7 shows which analyses were performed and which relationships were found to be significant. (If a cell contains the word “n/a,” then no relationship was hypothesized, and therefore no analysis was performed.) Note that all significant relationships were positive in the direction of CBE practices; in other words, students who experienced the CBE practice were more likely to experience a positive change in their learning dispositions, skills, or behaviors.
The remainder of this section presents information about these relationships. In the subsequent section of the report, we discuss the findings overall.
Section 2: What Are Students’ Experiences of Competency-Based Education (CBE) and How Are These Experiences Related to Changes in Learning Capacities Over Time?
Ninth-grade students in both CBE and comparison schools reported experiencing classroom practices commonly associated with CBE. An examination of the relationship between students’ experiences of CBE and changes in their learning capacities suggests that several CBE practices were associated with positive changes for students during their first year in high school.
9 Our study design did not allow us to match students to specific teachers or examine the links between CBE implementation and students’ experiences. This is an important direction for future study.
22 American Institutes for Research
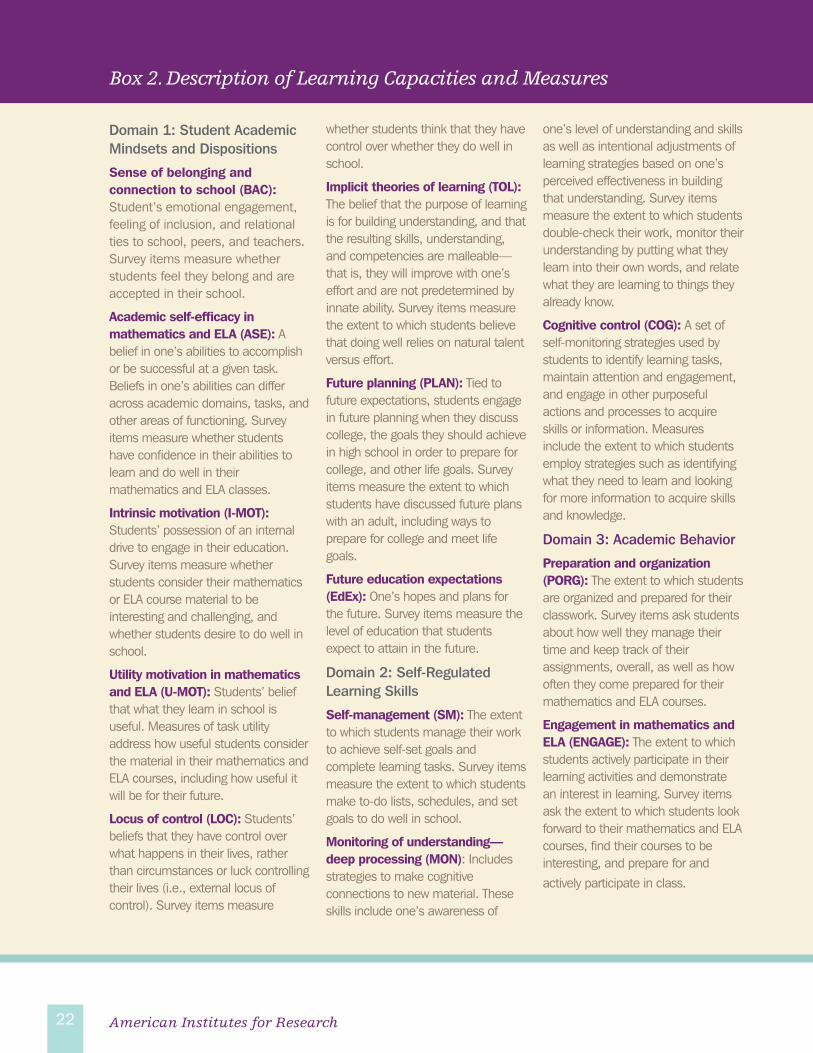
Box 2. Description of Learning Capacities and Measures
Domain 1: Student Academic Mindsets and Dispositions
Sense of belonging and connection to school (BAC): Student’s emotional engagement, feeling of inclusion, and relational ties to school, peers, and teachers. Survey items measure whether students feel they belong and are accepted in their school.
Academic self-efficacy in mathematics and ELA (ASE): A belief in one’s abilities to accomplish or be successful at a given task. Beliefs in one’s abilities can differ across academic domains, tasks, and other areas of functioning. Survey items measure whether students have confidence in their abilities to learn and do well in their mathematics and ELA classes.
Intrinsic motivation (I-MOT): Students’ possession of an internal drive to engage in their education. Survey items measure whether students consider their mathematics or ELA course material to be interesting and challenging, and whether students desire to do well in school.
Utility motivation in mathematics and ELA (U-MOT): Students’ belief that what they learn in school is useful. Measures of task utility address how useful students consider the material in their mathematics and ELA courses, including how useful it will be for their future.
Locus of control (LOC): Students’ beliefs that they have control over what happens in their lives, rather than circumstances or luck controlling their lives (i.e., external locus of control). Survey items measure
whether students think that they have control over whether they do well in school.
Implicit theories of learning (TOL): The belief that the purpose of learning is for building understanding, and that the resulting skills, understanding, and competencies are malleable—that is, they will improve with one’s effort and are not predetermined by innate ability. Survey items measure the extent to which students believe that doing well relies on natural talent versus effort.
Future planning (PLAN): Tied to future expectations, students engage in future planning when they discuss college, the goals they should achieve in high school in order to prepare for college, and other life goals. Survey items measure the extent to which students have discussed future plans with an adult, including ways to prepare for college and meet life goals.
Future education expectations (EdEx): One’s hopes and plans for the future. Survey items measure the level of education that students expect to attain in the future.
Domain 2: Self-Regulated Learning Skills
Self-management (SM): The extent to which students manage their work to achieve self-set goals and complete learning tasks. Survey items measure the extent to which students make to-do lists, schedules, and set goals to do well in school.
Monitoring of understanding—deep processing (MON): Includes strategies to make cognitive connections to new material. These skills include one’s awareness of
one’s level of understanding and skills as well as intentional adjustments of learning strategies based on one’s perceived effectiveness in building that understanding. Survey items measure the extent to which students double-check their work, monitor their understanding by putting what they learn into their own words, and relate what they are learning to things they already know.
Cognitive control (COG): A set of self-monitoring strategies used by students to identify learning tasks, maintain attention and engagement, and engage in other purposeful actions and processes to acquire skills or information. Measures include the extent to which students employ strategies such as identifying what they need to learn and looking for more information to acquire skills and knowledge.
Domain 3: Academic Behavior
Preparation and organization (PORG): The extent to which students are organized and prepared for their classwork. Survey items ask students about how well they manage their time and keep track of their assignments, overall, as well as how often they come prepared for their mathematics and ELA courses.
Engagement in mathematics and ELA (ENGAGE): The extent to which students actively participate in their learning activities and demonstrate an interest in learning. Survey items ask the extent to which students look forward to their mathematics and ELA courses, find their courses to be interesting, and prepare for and actively participate in class.

23 Looking Under the Hood of Competency-Based Education
Learning TargetsStudents in both CBE and comparison schools were asked three questions about the clarity of learning targets in their mathematics and their ELA courses. Specifically, they were asked the extent to which they agree that they understand what they need to learn to complete assignments, prepare for assessments, and get course credit. We then created two scales by averaging students’ responses with respect to their mathematics and ELA courses. Table 8 shows that students in CBE schools reported higher levels of clarity in learning targets in ELA, but students in comparison schools reported higher levels of clarity in learning targets in their mathematics courses. However, reported clarity was high overall (between 3 = agree and 4 = strongly agree) for all students.
CBE Domain
Student Experience of CBE-Aligned
Practice
Response Type
Student Academic Mindsets and Dispositions Self-Reg. Learning Academic Behavior
BAC ASE math
ASE ELA I-MOT U-MOT
mathU-MOT ELA LOC TOL PLAN EdEx SM MON COG PORG ENGAGE
mathENGAGE
ELA
Learning Targets
Clarity of goals (math)
Scale N/A N/A N/A + + N/A + N/A N/A N/A + N/A N/A + + N/A
Clarity of goals (ELA)
Scale N/A N/A N/A + N/A + + N/A N/A N/A + N/A N/A + N/A +
Measurement of Learning
Meet every target (math)
Yes/No N/A + N/A + N/A N/A N/A N/A N/A N/A
Meet every target (ELA)
Yes/No N/A N/A + N/A N/A N/A + N/A N/A N/A
Flexible pacing and Progression
Extra time allowed (math)
Yes/No N/A + N/A + + N/A N/A N/A N/A N/A
Extra time allowed (ELA)
Yes/No N/A N/A N/A N/A N/A N/A N/A
Assessment of Learning
Retakes allowed (math)
Yes/No N/A + N/A N/A N/A N/A N/A + N/A N/A N/A
Retakes allowed (ELA)
Yes/No N/A N/A N/A N/A N/A N/A N/A N/A N/A
Non- traditional assessment type (math)
Count N/A N/A + N/A N/A N/A N/A N/A N/A N/A
Non- traditional assessment type (ELA)
Count N/A N/A N/A N/A N/A N/A N/A N/A N/A
When/Where Learning Happens
Activity outside school for
creditYes/No N/A N/A N/A + + N/A N/A N/A N/A N/A N/A N/A N/A N/A N/A
Online course Yes/No N/A N/A N/A N/A N/A N/A N/A N/A N/A N/A
Individualized Instruction
and Support
Student decision-
making (math)Yes/No N/A N/A N/A N/A N/A N/A N/A
Student decision-
making (ELA)Yes/No N/A N/A N/A N/A N/A N/A N/A
Meets one-on-one with teacher
Yes/No N/A N/A
Has written learning plan
Yes/No N/A N/A N/A N/A N/A N/A N/A N/A
Variety of instructional
practicesCount N/A + + N/A N/A N/A N/A + + N/A N/A N/A
Table 7. Matrix Showing Relationships Between Students’ Experiences of CBE Practices and Positive Changes in Learning Capacities
Note. + indicates a significant positive relationship. None of the students’ experiences of CBE practices were negatively related to changes in learning capacities. Refer to Box 3 for definitions of abbreviations used in the table.

24 American Institutes for Research
Independent of school setting, students’ experience of clarity of course learning targets was related to favorable changes in the following learning capacities: intrinsic motivation, utility in mathematics and ELA, locus of control, self-management, preparation overall, and preparation in mathematics and ELA.
Measurement of LearningStudent survey responses reveal that students attending CBE schools were more likely to report that their teachers in ELA require them to show that they had met every learning target to pass the course (Table 9). However, most students in both sets of schools agreed or strongly agreed with the statement that they must meet every learning target to pass.
Independent of school setting, students’ report that they need to meet every learning target to pass their mathematics course was positively related to changes in self-efficacy in mathematics and intrinsic motivation. Similarly, students’ report that they need to meet every learning target to pass their ELA course was positively related to changes in intrinsic motivation and self-control.
Instructional Approaches and Supports
One-on-One Meetings With Adults and Individualized Learning Plans
Students in CBE schools were more likely to report having an individualized learning plan than students in comparison schools (35 percent versus 20 percent) and were more likely to report having regular opportunities to meet with an adult to talk about their learning than students in comparison schools (59 percent versus 46 percent) (see Table 10). However, independent of school setting, students’ reports of meeting with teachers and having an individualized learning plan were not related to changes in their learning capacities during the first year of high school.
ITEM
Scale: Average clarity of learning goals (1 = strongly disagree, 2 = disagree,
3 = agree, and 4 = strongly agree)
MathematicsComparison
3.15a
CBE
3.03
ELAComparison
3.07
CBE
3.21a
Table 8. Students’ Experiences of Clarity of Learning Targets
AVERAGE
ITEM
I need to show that I have met every learning target, standard, or
competency to pass my course.
MathematicsComparison
80
CBE
83
ELAComparison
81
CBE
86a
Table 9. Students’ Experiences of Mastery of Learning Targets
PERCENTAGE WHO AGREE OR STRONGLY AGREE
a Significant difference: p < .025.
a Significant difference: p < .00625

25 Looking Under the Hood of Competency-Based Education
Opportunities for Student Decision Making
Students were asked about the extent to which they were given opportunities to make decisions about their own learning in the following five areas: (1) which topics they learn in class, (2) which activities or coursework they do during class, (3) the due dates for their coursework, (4) how they will show what they learned, and (5) when they will take the final exam or assessment.
Students were asked the same series of questions for both their Grade 9 mathematics and ELA courses. For each item, and across both mathematics and ELA courses, the majority of students reported that their teacher decides how, what, and when they learn. Students in CBE and comparison schools reported similar levels of decision making in their mathematics and ELA courses (about one third of each group reported involvement in at least one type of instructional decision).
To examine differences in student decision making between CBE and comparison schools, we identified students who reported that they were involved in the decision-making process (i.e., the student decided, or the teacher and student decided together) for at least one of the five areas. Independent of school setting, none of the measures of students’ decision-making power in mathematics or ELA were related to changes
in their learning capacities from fall to spring during ninth grade.
Instruction Delivered via a Variety of Practices
Students were asked to report about the types of instructional practices they experienced in their courses, including the following:
• Working on an independent project
• Meeting with another student to help each other with school work
• Working with a group of students on a project or assignments
• Presenting work to other students and adults/teachers
• Reviewing and talking about another student’s work
• Participating in course activities, volunteering, or doing an internship outside of the school building during the school day
Students from both types of schools reported participating in most of these activities at least once weekly at rates of approximately 40 percent to 50 percent, with the exception of participating in outside activities, which approximately 30 percent of students reported doing weekly (Figure 7).
Table 8. Students’ Experiences of Clarity of Learning Targets
Table 9. Students’ Experiences of Mastery of Learning Targets
ITEMS
Q33. Have you ever met one-on-one with an adult from your school to talk about your learning? (Yes/No)
Comparison46
CBE59a
Q37. Have you put any of this information about your learning into a written plan? (Some schools call these plans an Individualized Learning Plan [ILP] or Personalized Learning Plan [PLP]). (Yes/No)
Comparison20
CBE35a
Table 10. Students’ Experiences of Individualized Guidance and Support
PERCENTAGE WHO REPLIED YES
a Significant difference: p < .00833.

26 American Institutes for Research
To look at students’ experiences across a variety of instructional practices, we summed the number of practices that students experienced at least once a week. Students in CBE schools and comparison schools reported participating in a similar number of student-centered activities at least once a week—about three activities.
Our analysis indicated that exposure to these practices (regardless of the type of school) was positively related to changes in students’ efficacy in mathematics, intrinsic motivation, self-monitoring, and self-control during the first year of high school.
When and Where Learning Takes Place Students were asked whether they participate in classroom activities, volunteer, or do an internship outside of the school building during the school day. Students in CBE and comparison schools were similarly likely to report participating in these activities at least once per week –approximately one third of students in each group. In addition, approximately 12 percent of students in CBE schools and comparison schools reported taking courses entirely online (Table 11).
While online course taking was not related to changes in students’ learning capacities, participating in activities outside of school was positively related to changes in intrinsic motivation and perceived utility of mathematics.
ITEMS
During the school day, I participate in course activities, volunteer, or participate in an internship outside of the school building during the
school day (at least once weekly).
Comparison31
CBE32
Have you taken any of your courses completely on-line this year (in other words, instead of taking an in-person class)?
Comparison12
CBE12
Table 11. Students’ Reports of Where Learning Takes Place
PERCENTAGE WHO REPLIED YES
Figure 7. Percentage of Students Who Reported Experiencing Specific Instructional Practices at Least Once per Week
Note. Statistical significance of differences in individual scale items are presented in Appendix E.
0% 20% 40% 60% 80% 100%
CBE Comparison
Work on an independent project
Meet with another student to help each other with school work
Work with a group of students on a project or assignment
Present my work to other studentsand adults/teachers
Review and talk about anotherstudent’s work
Participate in course activities, volunteer, or do an internship outside of the school building during the day
52%
59%
50%
51%
50%
49%
40%41%
39%
46%
32%
31%
27 Looking Under the Hood of Competency-Based Education
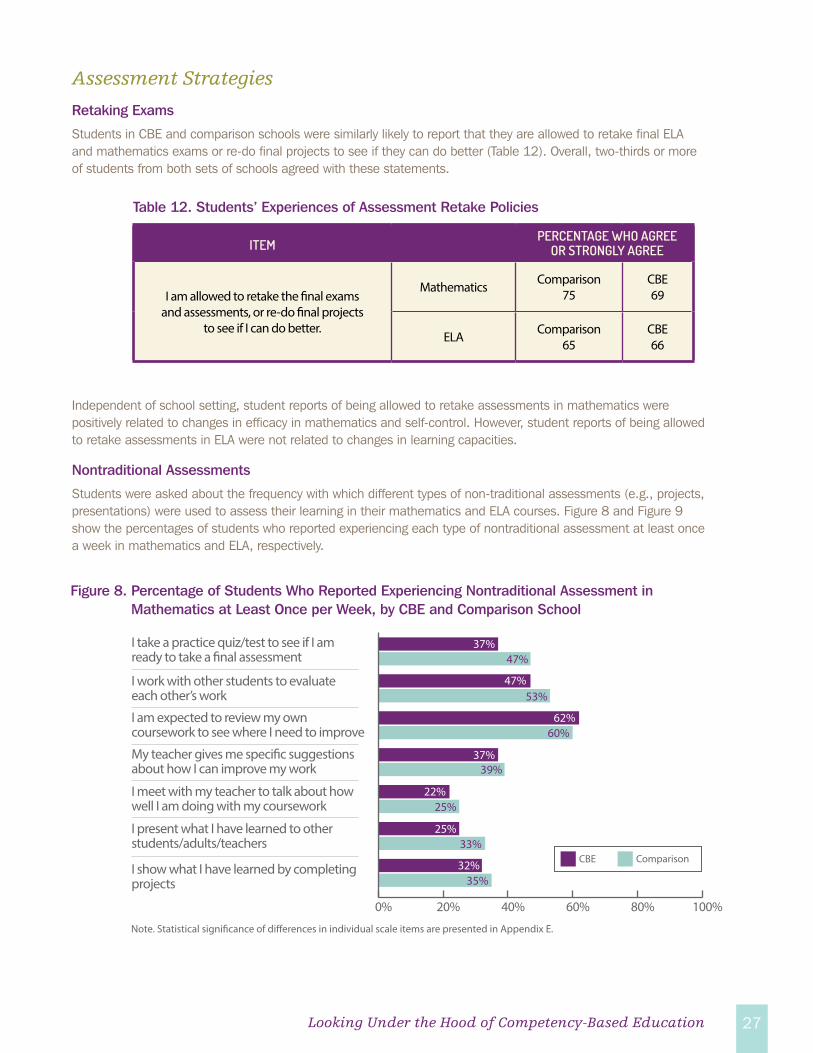
Assessment Strategies
Retaking Exams
Students in CBE and comparison schools were similarly likely to report that they are allowed to retake final ELA and mathematics exams or re-do final projects to see if they can do better (Table 12). Overall, two-thirds or more of students from both sets of schools agreed with these statements.
Independent of school setting, student reports of being allowed to retake assessments in mathematics were positively related to changes in efficacy in mathematics and self-control. However, student reports of being allowed to retake assessments in ELA were not related to changes in learning capacities.
Nontraditional Assessments
Students were asked about the frequency with which different types of non-traditional assessments (e.g., projects, presentations) were used to assess their learning in their mathematics and ELA courses. Figure 8 and Figure 9 show the percentages of students who reported experiencing each type of nontraditional assessment at least once a week in mathematics and ELA, respectively.
ITEM
I am allowed to retake the final exams and assessments, or re-do final projects
to see if I can do better.
Mathematics Comparison75
CBE69
ELA Comparison65
CBE66
Table 12. Students’ Experiences of Assessment Retake Policies
PERCENTAGE WHO AGREE OR STRONGLY AGREE
Figure 8. Percentage of Students Who Reported Experiencing Nontraditional Assessment in Mathematics at Least Once per Week, by CBE and Comparison School
I take a practice quiz/test to see if I am ready to take a final assessment
I work with other students to evaluate each other’s work
I am expected to review my owncoursework to see where I need to improve
My teacher gives me specific suggestions about how I can improve my work
I meet with my teacher to talk about how well I am doing with my coursework
I present what I have learned to other students/adults/teachers
I show what I have learned by completing projects
0% 20% 40% 60% 80% 100%
CBE Comparison
Note. Statistical significance of differences in individual scale items are presented in Appendix E.
37%47%
47%53%
62%60%
37%39%
22%25%
25%33%
32%35%

We also counted the number of nontraditional types of assessments that students reported experiencing at least once weekly. Students in CBE and comparison schools reported a similar number of nontraditional assessment types (between two and three) every week in both their mathematics and their ELA courses (Table 13).
Independent of school setting, students who reported experiencing a larger number of nontraditional assessment types at least once per week also experienced favorable changes in intrinsic motivation during their first year of high school.
Figure 9. Percentage of Students Who Reported Experiencing Nontraditional Assessment in ELA at Least Once per Week, by CBE and Comparison School
Note. Statistical significance of differences in individual items are presented in Appendix E.
0% 20% 40% 60% 80% 100%
27%32%
44%44%
55%51%
33%33%
23%23%
31%30%
36%37%
CBE Comparison
I take a practice quiz/text to see if I am ready to take a final assessment
I work with other students to evaluate each other’s work
I am expected to review my owncoursework to see where I need to improve
My teacher gives me specific suggestions about how I can improve my work
I meet with my teacher to talk about how well I am doing with my coursework
I present what I have learned to other students/adults/teachers
I show what I have learned by completing projects
ITEM
Count of nontraditional assessment strategies used at least once a week to track student progress (count of up to seven possible assessment types).
Mathematics Comparison2.92
CBE2.63
ELA Comparison2.51
CBE2.50
Table 13. Students’ Experiences of Nontraditional Assessment Strategies
AVERAGE NUMBER OF ASSESSMENT TYPES

29 Looking Under the Hood of Competency-Based Education
Pacing and ProgressionOverall, approximately half of students in CBE schools and comparison schools reported that they can take extra time to finish a topic or unit if they need to (Table 14). There was no significant difference between the two groups of students (CBE and comparison) in either subject.
Independent of the school setting, students who reported being allowed to take extra time to finish mathematics course material experienced favorable changes in mathematics efficacy, perceived utility of mathematics, and intrinsic motivation. However, students’ reports of having extra time to complete their ELA coursework was not related to changes in their learning capacities.
Discussion of Overall Student Findings
Table 13. Students’ Experiences of Nontraditional Assessment Strategies
ITEM
I can take extra time to finish a topic or unit if I need to, even if other students have already
moved ahead.
Mathematics Comparison53
CBE53
ELA Comparison55
CBE62
Table 14. Students’ Experiences of Course Pacing
PERCENTAGE WHO AGREE OR STRONGLY AGREE
As described previously, students’ experiences of CBE practices did not differ markedly by CBE and comparison schools. Regardless of school type, students’ experiences of CBE-aligned practices were positively associated with changes in learning capacities in several areas. Also, several overarching patterns of results were observed in these student data. These are presented next.
Intrinsic motivation appears to be one of the learning capacities most strongly associated with CBE practices. Several CBE features are positively related to changes in students’ intrinsic motivation during Grade 9. Having clear learning targets and requiring students to meet all learning targets to earn course credit in mathematics and ELA were both positively related to changes over time in intrinsic motivation. In addition, providing a variety of student-centered instructional practices, allowing students to participate in activities outside of school for course credit, allowing extra time to complete coursework (in mathematics), and providing a wider variety of assessment types (in mathematics) are positively related to changes in students’ intrinsic motivation.
Students’ perceived clarity of learning targets were positively associated with the greatest number of favorable changes in learning capacities. Students’ perceived clarity of learning targets in their mathematics and ELA courses were related to favorable changes in intrinsic motivation, perceived utility of mathematics and ELA, locus of control, self-management, and preparation for courses (both overall and specifically within
mathematics and ELA classes). These findings suggest that students’ clarity of learning targets may be an important instructional feature.
Some CBE practices appear to be related to positive change in learning capacities from fall to spring in one academic subject area only. In mathematics classes, requiring students to meet all learning targets in order to receive course credit, providing students extra time to complete coursework when necessary, allowing students to retake assessments without taking points off, and offering a variety of instructional practices were all positively related to changes over time in efficacy in mathematics. Having clear learning targets, allowing extra time to complete coursework, and allowing students to participate in activities outside of school for course credit were also positively related to changes in perceived utility of mathematics during students’ ninth-grade year. In contrast, none of the CBE features we examined were related to efficacy in ELA, and only the clarity of ELA learning targets was positively related to changes in students’ perceived utility of ELA.
Providing varied and flexible instructional practices appears to be one of the only CBE practices positively related to changes from fall to spring in students’ self-regulated learning skills. Although commonly associated with CBE, offering a variety of instructional practices is not exclusive to CBE. Yet, this area was the only one that appeared to be positively associated with both self-monitoring of understanding and cognitive control.

30 American Institutes for Research
Some of the measured learning capacities do not appear to be strongly associated with any individual CBE practices. Students’ sense of belonging, perceived utility of ELA, efficacy in ELA, locus of control, theory of intelligence, planning for the future, expectations for future education, self-management, and preparation for courses (both overall and specifically within mathematics and ELA courses) were not related to individual CBE practices. Aside from the aforementioned positive relationships with clarity of learning targets in mathematics and ELA courses, other individual CBE practices did not seem to be related to changes in measured learning capacities, with a few exceptions.
This study revealed that school-level CBE implementation is neither comprehensive nor uniform in schools that may be identified or self-identify as practicing competency-based approaches; a school’s designation as CBE may reflect a wide range of policies and practices. In some cases, we found that CBE schools were simply raising the bar for students—expecting high student attendance and timely completion of work in addition to mastery of competencies. This finding suggests that the CBE model is still evolving and may not be consistently interpreted or practiced in many schools using the CBE label.
To best understand how CBE may be positively influencing the learning of students, we need to more closely examine the implementation of specific CBE practices. Taking that approach, this study found promising evidence that students’ experiences of specific CBE practices are indeed associated with positive changes in learning dispositions, skills, and behaviors.
There is still much to learn. We conclude this report with several directions for future research.
• APPLICATIONS FOR UNDERSERVED ANDUNDERREPRESENTED STUDENT GROUPS. There islittle or no previous research regarding the influenceof CBE practices on outcomes for students fromlow-income households, traditionallyunderrepresented racial/ethnic groups, and ELLs. Thisstudy sought to address the need for research in thiscritical area, but our ability to do so was limited bythe student composition of the sampled schools andthe availability of student background characteristics.ELL status was excluded from statistical models due
to the small number of students in our sample who were ELLs. In addition, we were unable to obtain students’ free or reduced-price lunch status from schools in one of our three study states, so our main statistical models did not include this indicator of socioeconomic status. Understanding the impact for these subpopulations remains an important area for future research.
• LINKS BETWEEN CBE IMPLEMENTATION,STUDENT EXPERIENCES, AND OUTCOMES. Withthe data collected, we were unable to establish linksbetween the practices teachers reported using andwhat students actually experienced. Future researchdesigns should link students to teachers withinschools, thereby examining the relationships amongCBE implementation at the classroom level, students’own experiences, and student outcomes.
• RELATIONSHIPS AMONG CBE PRACTICES. It ispossible that some CBE practices must beimplemented together to positively influence studentlearning. It is also likely that certain CBE practices,and certain student outcomes, are actually mediatingfactors in larger constellations of practices andoutcomes that have important effects on studentlearning. Future studies with larger populationsshould further explore interactions among thesevariables.
• SURVEYS OF CBE PRACTICES. The surveysdeveloped for this study allowed us to examine CBEimplementation and students’ CBE experiences.Nonetheless, additional qualitative research isneeded to capture additional details about CBEpractices and strengthen these instruments.
CONCLUSION

31 Looking Under the Hood of Competency-Based Education
CONCLUSION
Council of Chief State School Officers (CCSSO). (2013). Knowledge, skills, and dispositions: The Innovation Lab Network state framework for college, career, and citizenship readiness, and implications for state policy. Washington, DC: Author. Retrieved from http://www.ccsso.org/Documents/ILN%20Knowledge%20Skills%20and%20Dispositions%20CCR%20Framework%20February%202013.pdf
Gliem, J. A., & Gliem, R. R. (2003, October). Paper presented at the Midwest Research-to-Practice Conference in Adult, Continuing, and Community Education: Calculating, interpreting, and reporting Cronbach’s alpha reliability coefficient for Likert-type scales. Columbus, OH: Author.
Le, C., Wolfe, R. E., & Steinberg, A. (2014). The past and the promise: Today’s competency education movement. Boston, MA: Jobs for the Future. Retrieved from http://www.jff.org/sites/default/files/publications/materials/The-Past-The-Promise-091514.pdf
New Hampshire Department of Education. (2007). New Hampshire’s vision for redesign: Moving from high schools to learning communities. Concord, NH: Author. Retrieved from http://www.education.nh.gov/innovations/hs_redesign/documents/vision.pdf
Patrick, S., & Sturgis, C. (2013). Necessary for success: Building mastery of world-class skills. Vienna, VA: International Association for K–12 Online Learning. Retrieved from http://www.competencyworks.org/wp-content/uploads/2013/02/inacol_cw_issuebrief_building_mastery_final.pdf
You can find the appendices to this report online here: http://bit.ly/2x0p5zW
REFERENCES

Nellie Mae Education Foundation | 1250 Hancock St., Suite 205N | Quincy, MA 02169Phone: 781.348.4239 | Email: [email protected]
The Nellie Mae Education Foundation is the largest philanthropic organization in New England that focuses exclusively on education. The Foundation supports the promotion and integration of student-centered approaches to learning at the middle and high school levels across New England—where learning is personalized; learning is competency-based; learning takes place anytime, anywhere; and students exert ownership over their own learning. To elevate student-centered approaches, the Foundation utilizes a four-part strategy that focuses on: building educator ownership, understanding and capacity; advancing quality and rigor of SCL practices; developing effective systems designs; and building public understanding and demand. Since 1998, the Foundation has distributed over $180 million in grants.
1000 Thomas Jefferson Street NW Washington, DC 20007-3835202.403.5000 • www.air.orgCopyright © 2016 American Institutes for Research. All rights reserved.
AIR is one of the world’s largest behavioral and social science research and evalu-ation organizations. Our overriding goal is to use the best science available to bring the most effective ideas and approaches to enhancing everyday life. For us, making the world a better place is not wishful thinking. It is the goal that drives us. Found-ed in 1946 as a not-for-profit organization, we conduct our work with strict inde-pendence, objectivity and non-partisanship. The intellectual diversity of our 1,800 employees enables us to bring together experts from many fields in the search for innovative answers to challenges that span the human life course.