Looking Back and Looking Forward - Health Quality … Back and Looking Forward A sneak peek for the...
47
Looking Back and Looking Forward A sneak peek for the 2018/19 hospital quality improvement plans (QIPs) KAREN SEQUEIRA, DANYAL MARTIN, SUDHA KUTTY | SEPTEMBER 26, 2017
Transcript of Looking Back and Looking Forward - Health Quality … Back and Looking Forward A sneak peek for the...

Looking Back and Looking Forward
A sneak peek for the 2018/19 hospital quality improvement plans (QIPs)
KAREN SEQUEIRA, DANYAL MARTIN, SUDHA KUTTY | SEPTEMBER 26, 2017
1
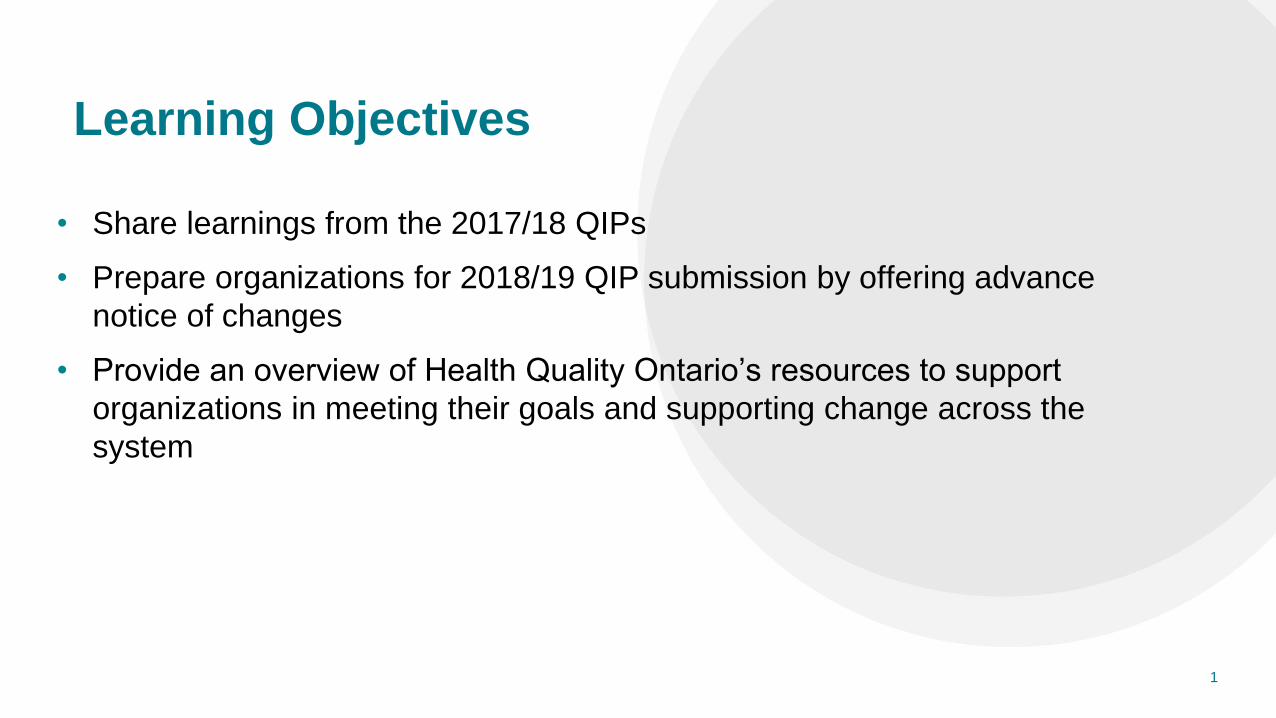
Learning Objectives
• Share learnings from the 2017/18 QIPs
• Prepare organizations for 2018/19 QIP submission by offering advance
notice of changes
• Provide an overview of Health Quality Ontario’s resources to support
organizations in meeting their goals and supporting change across the
system

2
Quality Matters

3
…Looking Back
Provincial Results
4
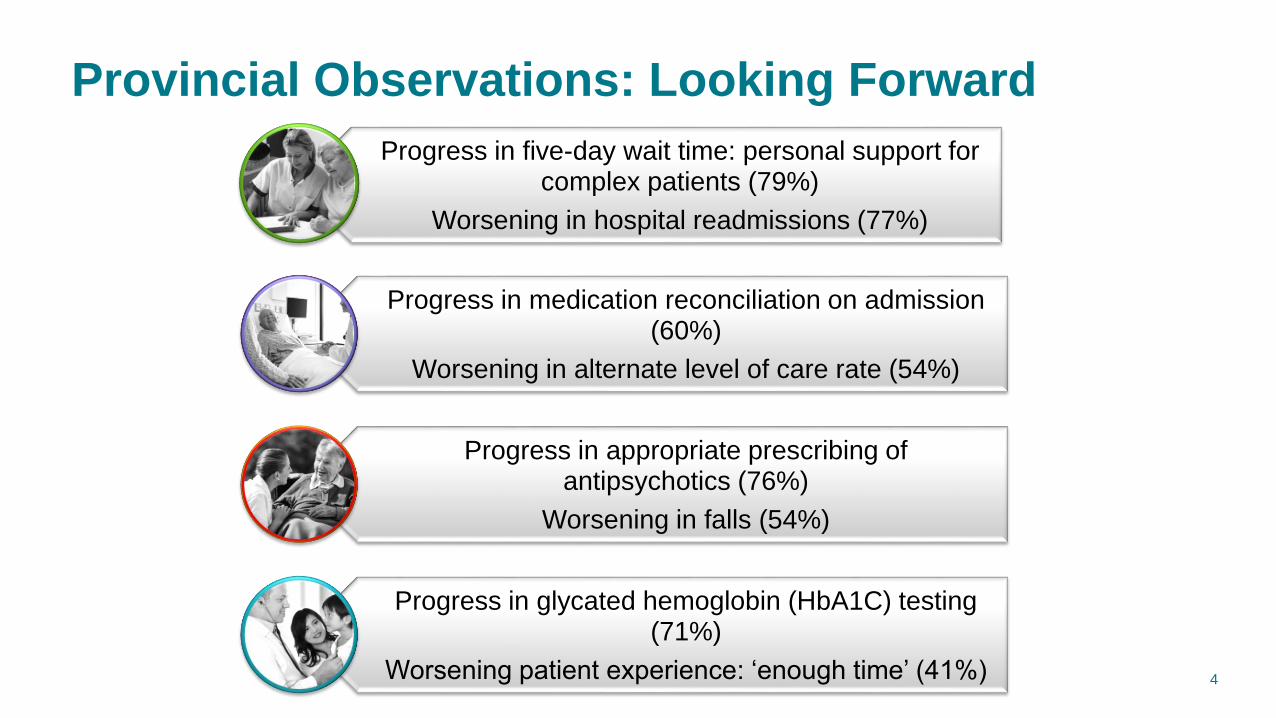
Provincial Observations: Looking Forward
Progress in five-day wait time: personal support for complex patients (79%)
Worsening in hospital readmissions (77%)
Progress in medication reconciliation on admission (60%)
Worsening in alternate level of care rate (54%)
Progress in appropriate prescribing of antipsychotics (76%)
Worsening in falls (54%)
Progress in glycated hemoglobin (HbA1C) testing (71%)
Worsening patient experience: ‘enough time’ (41%)

5
Provincial Observations: Looking Forward
of organizations selected at least one priority indicator
of organizations are working on at least one of the effective transition indicators
of organizations are working on at least one patient experience indicator
is the most common target range set for improvement
94%
84%
78%
1-5%
6
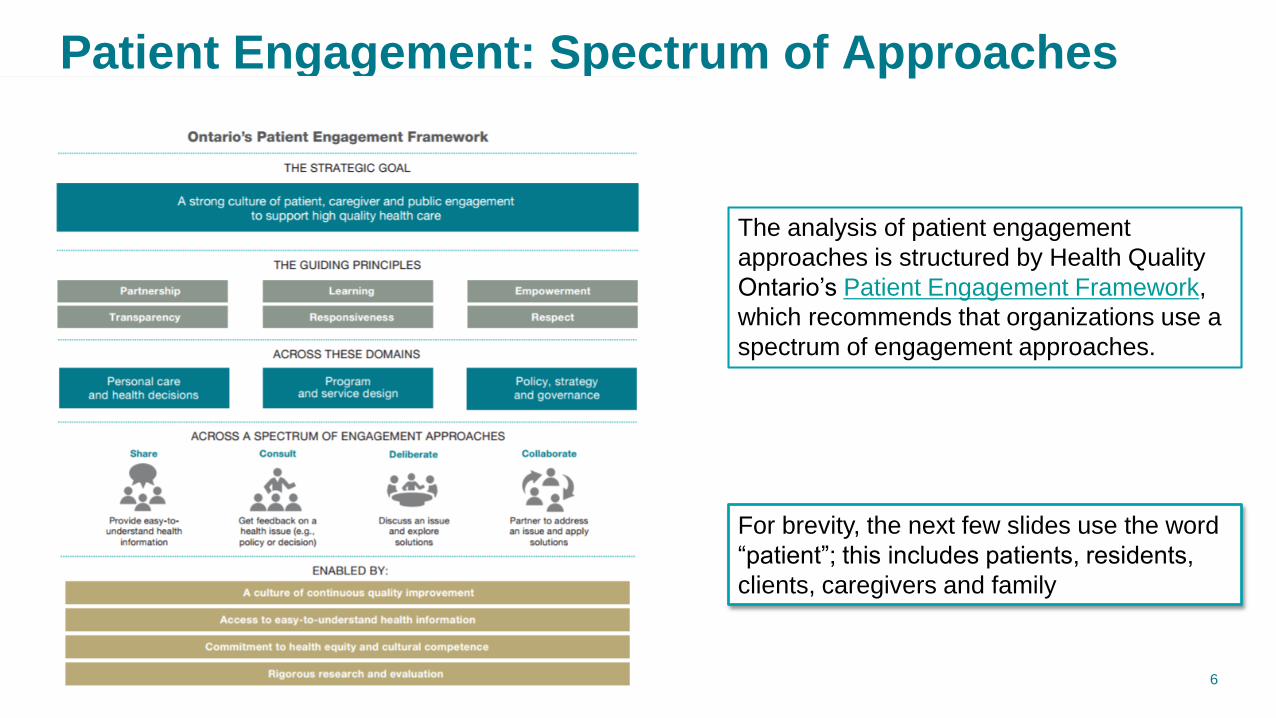
Patient Engagement: Spectrum of Approaches
For brevity, the next few slides use the word
“patient”; this includes patients, residents,
clients, caregivers and family
The analysis of patient engagement
approaches is structured by Health Quality
Ontario’s Patient Engagement Framework,
which recommends that organizations use a
spectrum of engagement approaches.

7
Patient Engagement: Spectrum of Approaches
Engagement is a continuum and organizations are encouraged to use a variety of methods to
engage patients and their families. The approaches described to the right are more
participatory. There will be overlap (e.g., councils may be deliberating or consulting).
8
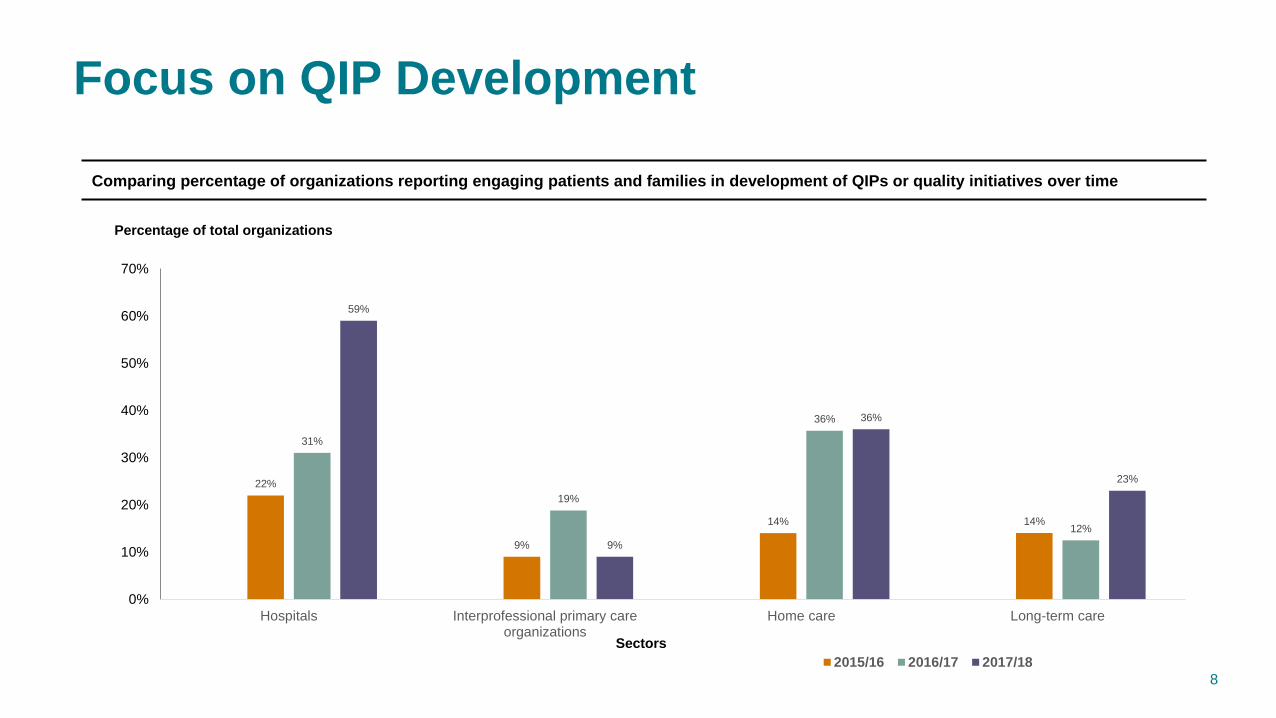
Focus on QIP Development
Comparing percentage of organizations reporting engaging patients and families in development of QIPs or quality initiatives over time
22%
9%
14% 14%
31%
19%
36%
12%
59%
9%
36%
23%
0%
10%
20%
30%
40%
50%
60%
70%
Hospitals Interprofessional primary careorganizations
Home care Long-term care
Percentage of total organizations
Sectors
2015/16 2016/17 2017/18

9
Key Observations: Patient Engagement
Overall view of spectrum of patient engagement approach in the 2017/18 QIP Narratives
4%
35%
66%
33%
72%
59%
4%
33%
38%
3%
14%
74%
23%
80%
23%
2%
14% 14%
0%
11%
79%
23% 23%
9%10%
12%9%
21%
57%
93%
14%
71%
36%
7%
43%
14%
0%
10%
20%
30%
40%
50%
60%
70%
80%
90%
100%
Critical incidentsdata
Complaints process Surveys Focus groups, townhalls, cty mtgs
Advisory Council,etc
Engage *patients indeveloping QIP
*Patients on theBoard
*Patient advisors onQI committees
*Patients involvedin co-design
% of organizations reporting approach Hospital
Long-term care
Interprofessional primary care organizations
Home care

10
Staff Engagement Link to Patient Experience
• Several hospitals are linking staff engagement to the achievement
of their quality improvement goals, particularly patient satisfaction
• Using engagement surveys delivered through the National
Research Corporation Canada (NRCC), North York General
Hospital was recognized as having the most engaged staff (overall
78.5%, physician engagement 89.4%)
“In a health care setting where patient experience and great
care is at the forefront of every hospital, employee, physician
and volunteer engagement goes hand-in-hand with patients
receiving high quality care.”- North York General Hospital
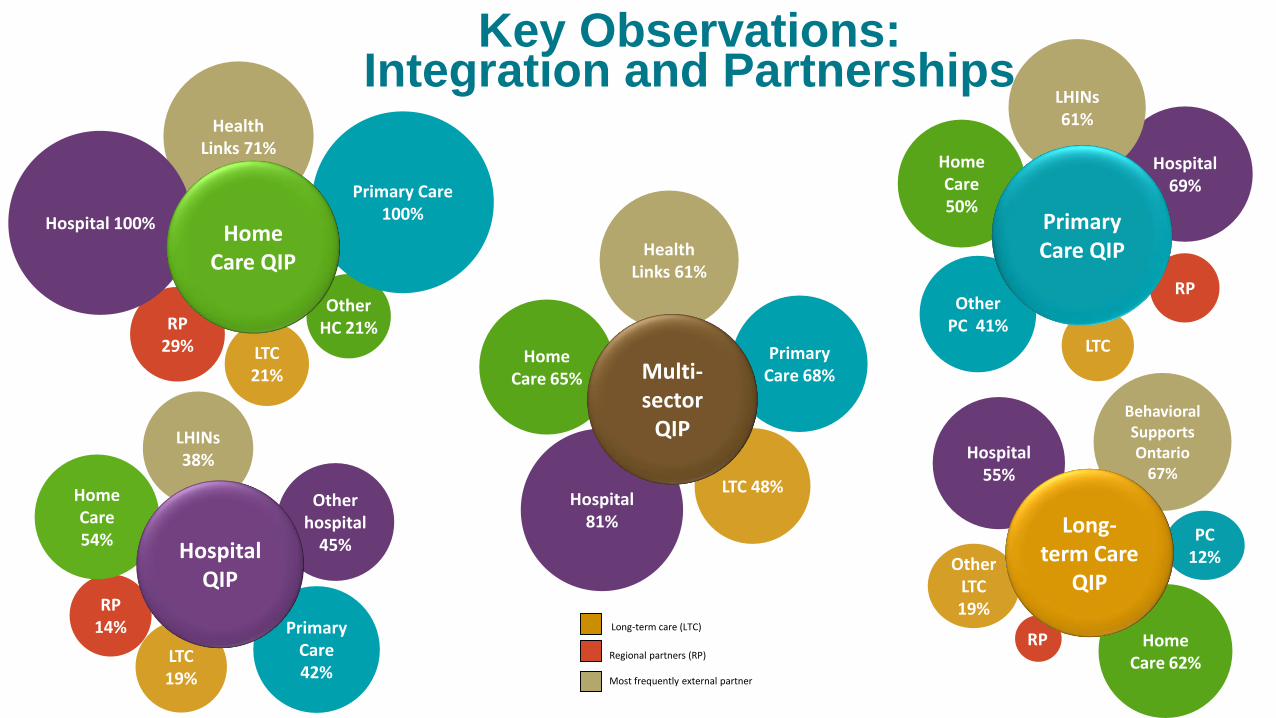
Other LTC19%
Primary Care 42%
LTC19%
RP14%
Home Care 54%
LHINs 38%
Other hospital
45%
Home Care 62%
PC 12%
Behavioral Supports Ontario
67%
Other PC 41%
LTC
Home Care 50%
RP
Hospital 69%
LHINs 61%
Hospital 81%
LTC 48%
Primary Care 68%
Home Care 65%
Health Links 61%
OtherHC 21%
LTC 21%
RP29%
Primary Care 100%
Health Links 71%
Hospital 100%
Hospital 55%
Long-term Care
QIP
Home Care QIP
Multi-sector
QIP
HospitalQIP
Primary Care QIP
RP
Key Observations: Integration and Partnerships
Most frequently external partner
Long-term care (LTC)
Regional partners (RP)

12
Key Observations: Equity Strategies
Percentage of organizations citing various equity strategies in their 2017/18 QIP Narratives
39%
47%
38%
25%
20%
27%
16%
6% 5% 4%
47%
34%
19%
13%
9%
16% 16%
8%
19%
3%
32%30%
52%
28%
23%20%
9% 10%
2%
8%
50%
57% 57% 57%
36%
7%
21%
29%
0%
7%
0%
10%
20%
30%
40%
50%
60%
Hospital Long-term care Interprofessional primary care Home care

w w w . H Q O n t a r i o . c a 13

14
…Looking Back
Hospital Results

15
Key Observations: Hospitals
• Overall hospitals reported a decrease in progress in 2017/18 for most
of the indicators– Slight increase in medication reconciliation at admission (58% to 60%).
• Hospitals are making improvements in the area of transitions – Forty hospitals highlighted transitions initiatives as quality improvement
achievements over the past year.
• Nearly half the hospitals described initiatives that take social
determinants of health into account in their Narratives– For example, income, rurality and immigration status.
• Increasing numbers of retrograde targets being set in the Workplans– ALC indicator had the largest number of retrograde targets set (21%). Hospitals
cited systemic issues in the health care system and the need to work with
multiple stakeholders within their LHINs.

16
Progress Made
Percentage of Ontario hospitals that progressed, maintained or worsened in their performance on priority indicators, compared over two QIP
years
58% 60%55% 55%
61%
37%44%
23%
60%
34%
11% 10%10% 6%
3%
2%
9%
24% 24%
19%19%
39%
49% 28%
42%
15%
31%
7% 6%16% 19%
14%
25%35%
23% 26%
0%
10%
20%
30%
40%
50%
60%
70%
80%
90%
100%
2016/17 (n=89) 2017/18 (n=82) 2016/17 (n=31) 2017/18 (n=32) 2016/17 (n=62) 2017/18 (n=78) 2016/17 (n=36) 2017/18 (n=26) 2016/17 (n=48) 2017/18 (n=35)
Medication Reconciliation atAdmission
Medication Reconciliation atDischarge
Emergency Department Length of Stay Patient Experience - RecommendEmergency Department
Patient Experience - RecommendHospital
Percent
Progressed Maintained Worsened Progress Made N/A

17
Progress in Medication Reconciliation
• The vast majority of hospitals that focused on MedRec upon
admission or discharge have improved. Most hospitals self-
reported improvements of 1-5%.
• Avoidance of medication errors reaching the patient a common
theme in the change ideas
The most commonly implemented change ideas
• Audit and feedback
• Staff education
• Developing/improving the process
• Pharmacist/pharmacy technician completes MedRec
• Develop best possible medication history process (BPMH)
18
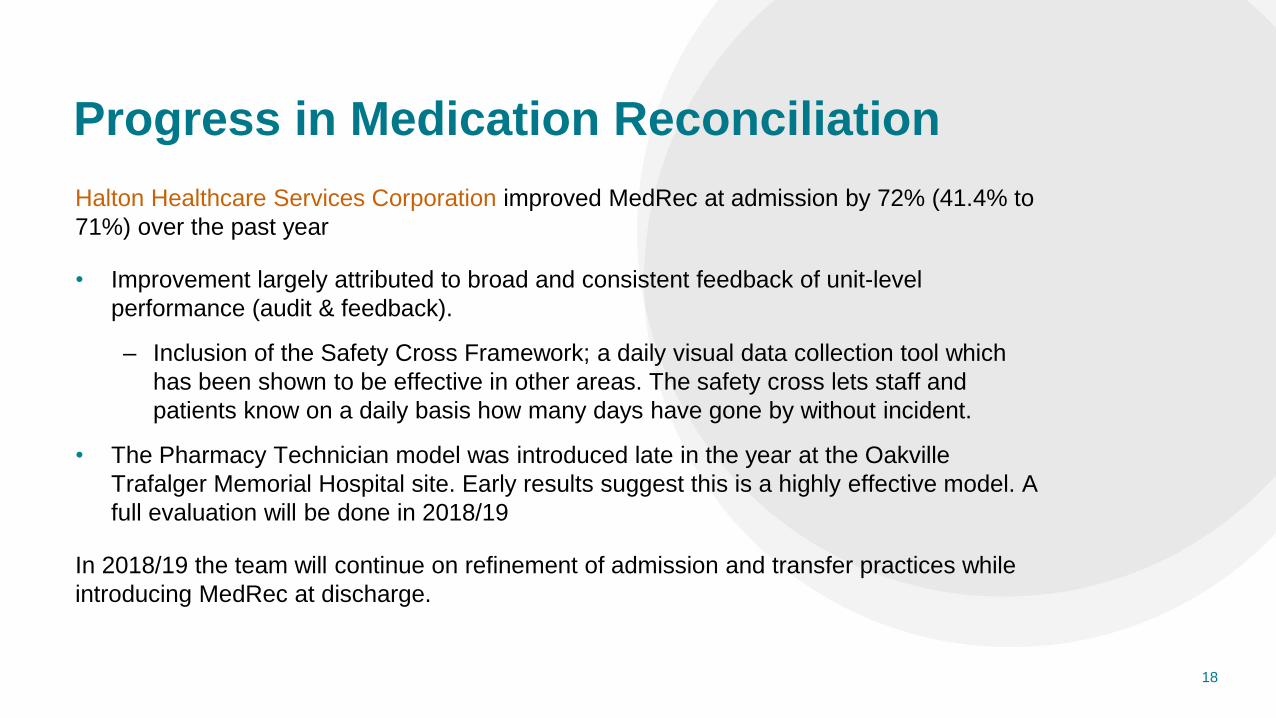
Progress in Medication Reconciliation
Halton Healthcare Services Corporation improved MedRec at admission by 72% (41.4% to
71%) over the past year
• Improvement largely attributed to broad and consistent feedback of unit-level
performance (audit & feedback).
– Inclusion of the Safety Cross Framework; a daily visual data collection tool which
has been shown to be effective in other areas. The safety cross lets staff and
patients know on a daily basis how many days have gone by without incident.
• The Pharmacy Technician model was introduced late in the year at the Oakville
Trafalger Memorial Hospital site. Early results suggest this is a highly effective model. A
full evaluation will be done in 2018/19
In 2018/19 the team will continue on refinement of admission and transfer practices while
introducing MedRec at discharge.
19
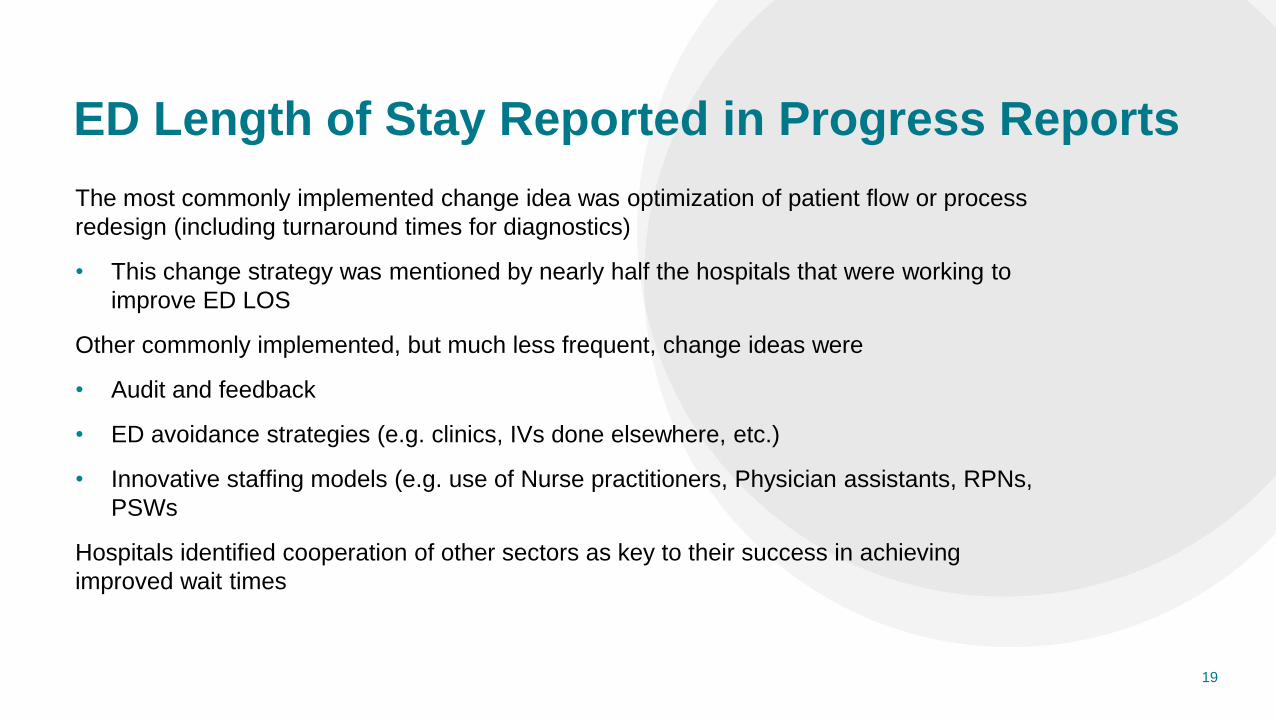
ED Length of Stay Reported in Progress Reports
The most commonly implemented change idea was optimization of patient flow or process
redesign (including turnaround times for diagnostics)
• This change strategy was mentioned by nearly half the hospitals that were working to
improve ED LOS
Other commonly implemented, but much less frequent, change ideas were
• Audit and feedback
• ED avoidance strategies (e.g. clinics, IVs done elsewhere, etc.)
• Innovative staffing models (e.g. use of Nurse practitioners, Physician assistants, RPNs,
PSWs
Hospitals identified cooperation of other sectors as key to their success in achieving
improved wait times

20
Progress on ED Avoidance by Sector
Percentage of organizations in Ontario that progressed, maintained or worsened in their performance on ED visits by sector
49%
69%
54%
10%
27%
31%
41%
9%
5%
0%
10%
20%
30%
40%
50%
60%
70%
80%
90%
100%
2017/18 (n=78) 2017/18 (n=13) 2017/18 (n=465)
PCED VISITS
HOME CAREED VISITS
LTCED VISITS
Percent
PROGRESSED MAINTAINED WORSENED PROGRESS MADE N/A

21
Progress in ED Length of Stay
• Women’s College Hospital partnered with the University Health Network (UHN) to
provide ED patients, rapid follow-up at the Acute Ambulatory Care Unit (AACU)
• The population involved general internal medicine (GIM) patients and eligibility and
exclusion criteria were defined
• PDSA cycles used to improve the model of care delivery over time
Results
• Accommodating an average of 5.3 patients per day from UHN ED, approximately 1000
patients have been referred over the past year.
• The perception of the ED physicians was that 34% of the time a referral to GIM was
avoided and 27% of the time an inpatient admission was prevented.
• 92% of patients would recommend the AACU to another patient.
The two hospitals are continuing to expand this successful initiative based on resource and
capacity optimization
• The focus is increasing efficiency by identifying patients at triage.

22
Priority Indicator Selection: Workplans
Number of hospitals that selected priority indicators, using the original definition of the indicators, in the 2017/18 QIPs (n=141)
8680
7268
5854 54
5144
31
18
0
10
20
30
40
50
60
70
80
90
100
Me
dR
ec a
t D
ischa
rge
Me
dR
ec a
t A
dm
issio
n
ALC
Rate
Rece
ive e
nou
gh
info
rma
tion?
Wo
uld
yo
u r
eco
mm
end
ho
spita
l?
Wo
uld
yo
u r
eco
mm
end
ED
?
ED
LO
S
Palli
ative
CO
PD
Rea
dm
issio
ns
CH
F R
ea
dm
issio
ns
Str
oke R
ea
dm
issio
ns
Number of hospitals
Priority Indicator

23
Additional Indicator Selection: Workplans
Number of hospitals that selected additional indicators, using the original definition of the indicators, in the 2017/18 QIPs (n=141)
18
13
8 8
54
0
2
4
6
8
10
12
14
16
18
20
Discharge Summaries Health Links HIG Readmissions MH&A Readmissions Pressure Ulcers Physical Restraints
Number of hospitals
Additional Indicator

24
Retrograde Targets: Workplans - ALC Example
Distribution of targets set for alternate level of care indicator selected by hospitals in comparison to their current performance, QIP 2017/18
1 ,2%
11,16%
3,4%
5,7%
8,12%
15,22%14,21%
6,9%
2,3%3,4%
0
5
10
15
20
>5% Between 1% -5%
Within 1% Maintain Within 1% Between 1% -5%
Between 5% -10%
Between 10% -15%
Between 15% -20%
>20%
Number
Target set in direction of improvement (better than CP)
Target set to maintain
Calculated as TP-CP = 12.7 - 44.15 the absolute difference is 31.45% which falls into '>20% interval'
n=68
15 hospitals have set retrograde target
Target set worse than CP
25
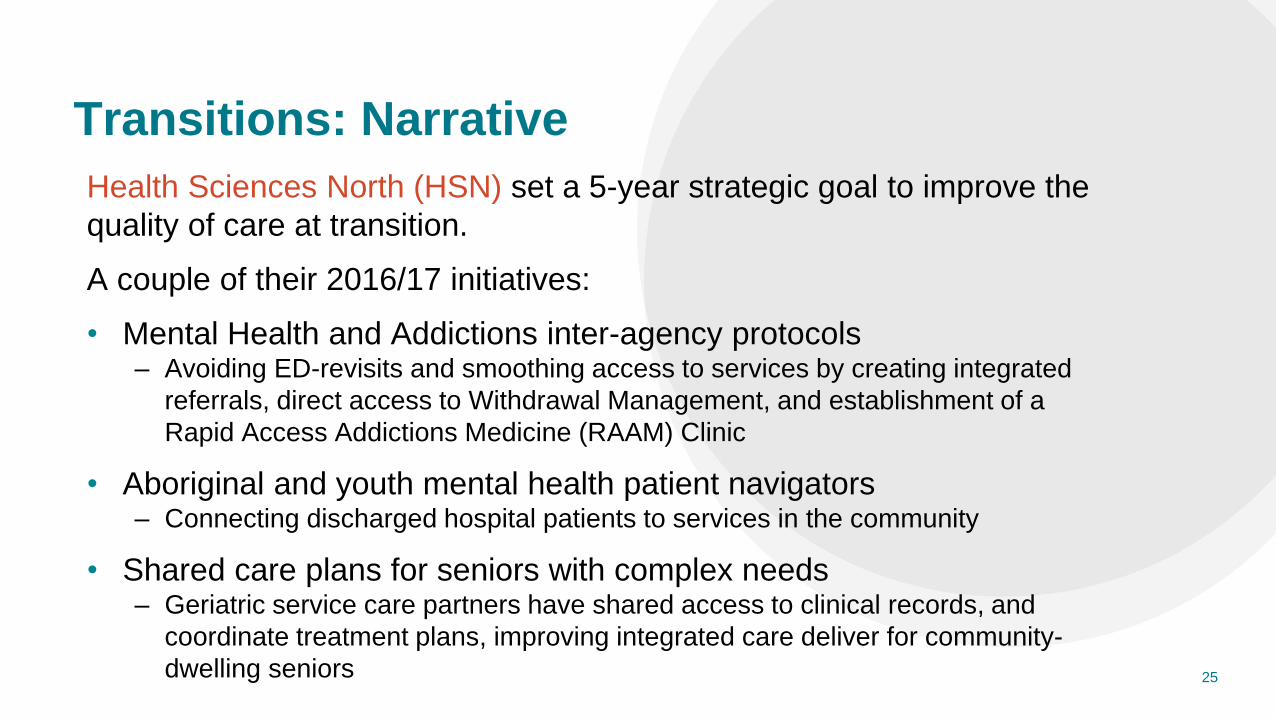
Transitions: Narrative
Health Sciences North (HSN) set a 5-year strategic goal to improve the
quality of care at transition.
A couple of their 2016/17 initiatives:
• Mental Health and Addictions inter-agency protocols– Avoiding ED-revisits and smoothing access to services by creating integrated
referrals, direct access to Withdrawal Management, and establishment of a
Rapid Access Addictions Medicine (RAAM) Clinic
• Aboriginal and youth mental health patient navigators – Connecting discharged hospital patients to services in the community
• Shared care plans for seniors with complex needs– Geriatric service care partners have shared access to clinical records, and
coordinate treatment plans, improving integrated care deliver for community-
dwelling seniors

26
Equity Example: Narrative
Children’s Hospital of Eastern Ontario (CHEO) provided special
attention to Syrian refugee children and their families in 2016/17
• CHEO has implemented a Refugee Navigator program that has
been recognized nationally for its patient-centred focus and
integration with several community partners
• Several CHEO leaders have also been engaged in developing
national care guidelines for paediatric refugee health through the
Canadian Paediatric Society and other organizations

27
Looking Forward
2018/19 QIPs

28
The QIP Consultation Process
2018/19 QIP
issues &
indicators
Initial issues and indicator matrix Ongoing
consultations
Patient, Family, and Public Advisors Council
QIP Advisory Committee
Branches and departments at Health Quality Ontario
Sector associations
External data organizations
QI leads from various organizations

29
Determining 2018/19 QIP Priorities
The Narrative
• Is an executive summary of your QIP and is intended to introduce specific
context for your QIP
• Is a means for engaging your patients and staff in QI planning
The Narrative is also a way to capture and understand emerging
quality issues
• For example, equity and workplace violence

30
QIP Workplan: Indicators
There are four types of indicators:
• Mandatory (NEW)
– REQUIRED in QIP; tied to issues where province-wide improvement is urgently required
– set by Minister upon consideration of advice from Health Quality Ontario (regulation 187/15 under
the Excellent Care for All Act, 2010; only applies to Hospital sector)
• Priority
– reflect organizational and sector-specific priorities, as well as system-wide, transformational
priorities where improved performance is co-dependent on collaboration with other sectors.
– Recommended, not required. Must justify decision not to include in QIP
• Additional
– measure important areas for QI and can be included in your QIP to reflect your organization’s
specific QI goals and opportunities
• Custom
– any other indicators your organization includes in your QIP

32
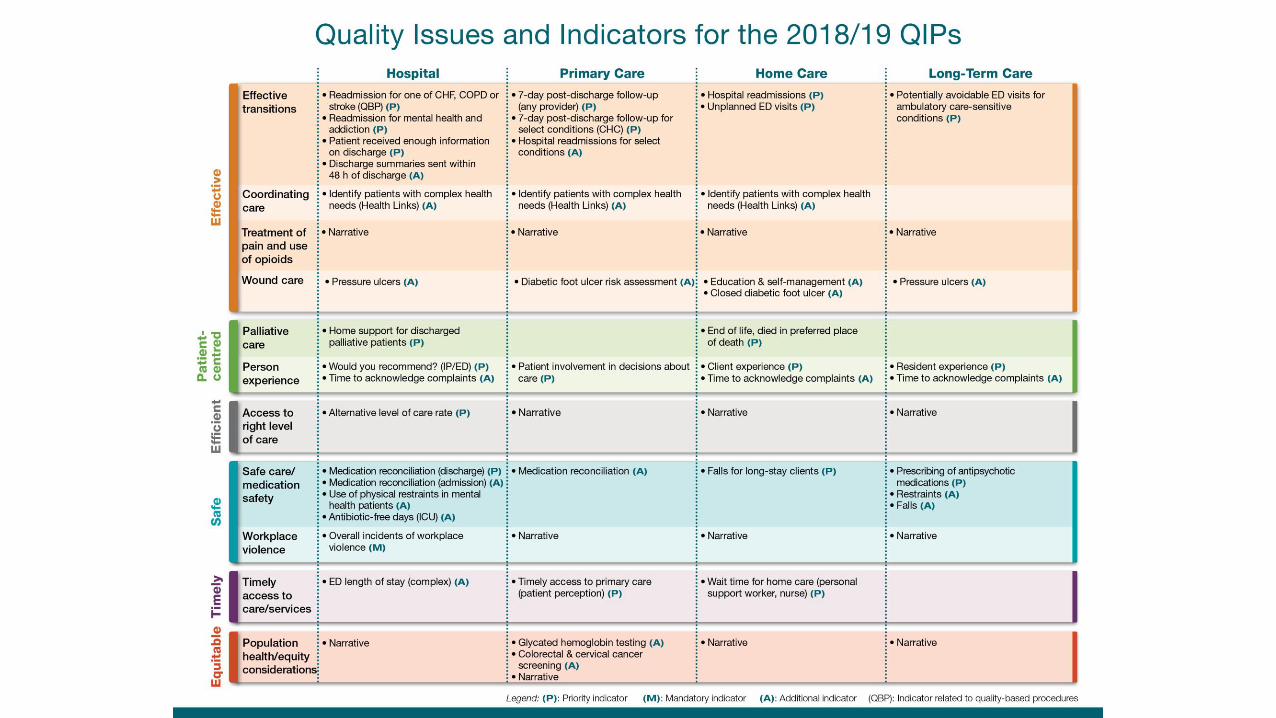
2018/19 QIP Indicators: Hospitals
• Readmission select conditions
• Readmission QBP (CHF, COPD, stroke)
• Readmission mental health
• Patient experience: receive enough
information at discharge
• Discharge summaries sent within 48 hours
• Identify complex patients (Health Links)
• Home support for discharged palliative
patients
• Patient experience: would you recommend?
• Alternate level of care rate
• Pressure ulcers (CCC)
• Use of physical restraints (mental health)
• Medication reconciliation: admission
• Medication reconciliation: discharge
• ED length of stay (complex)
RETIRED
• Readmissions for select conditions (HIG)
MODIFIED
• Readmissions mental health now a priority indicator
• Medication reconciliation at admission now additional
NEW
• Overall Incidence Workplace Violence (MANDATORY)
• Percent complaints acknowledged (Additional)
• Antimicrobial stewardship: Antibiotic free days (ICU) (A)• Overall incidence of workplace violence
• Percent complaints acknowledged
• Antimicrobial stewardship: Antibiotic free days
(ICU)

33
QIP Narrative
2018/19
• Overview
• QI achievements from the past year
• Collaboration and integration
• Engagement of leadership, clinicians and staff
• Patient/resident engagement and relations
• Workplace violence and prevention
• Population health and equity
• Alternate level of care
• Opioid prescribing and opioid use disorder in the treatment of pain
34
Patient/Resident Engagement and Relations
34
There is a spectrum of approaches for engaging patients / clients /
residents, including sharing, consulting, deliberating, and
collaborating with advisors.
Describe how your organization has engaged your patients / clients /
residents in the development and implementation of your quality
improvement plan and quality improvement activities over the past
year. What do you have planned for the year ahead?

35
Workplace Violence and Prevention
Please describe how workplace violence prevention is a strategic
priority for your organization. For example, is it included in your
strategic plan or do you report on it to your board?
Upcoming resources
• Quality Improvement Plan Guidance: Workplace Violence Prevention
• Insights into Quality Improvement: Workplace Violence Prevention from the
2017/18 Quality Improvement Plans
• Health Quality Compass section on workplace violence prevention
• Webinar
w w w . H Q O n t a r i o . c a35

36
Population Health and Equity (collapsed)
How has your organization addressed/recognized the needs of
unique populations in its quality improvement efforts including, for
example, indigenous and francophone communities? How has your
organization worked to promote health equity through your quality
improvement initiatives?
w w w . H Q O n t a r i o . c a36

37
Opioids Prescribing and Opioid Use
Disorder in the Treatment of Pain
Describe what steps your organization is taking to support the
effective treatment of pain including opioids treatment practices and
promoting alternatives to treatment.
Prompts: Think about access to addiction services, social services,
(sub) populations, etc.
w w w . H Q O n t a r i o . c a37

38
Looking Forward
Changes to Navigator

39
Navigator Key Dates and Timelines
• Navigator will launch by November 30, 2017
• Log in before March to ensure there are no surprises
• There will be Navigator training sessions this fall and winter to highlight the
new functionalities
• Navigator closes briefly in February so that the indicator current performance
values can be prepopulated
• Ensure the QIP is on your Board’s calendar prior to April 1, 2018 submission.

40
• Current performance in Progress
Report and Workplan
automatically linked
• Ability to add new change ideas
• Ability to export full Progress
Report template
• Format change of Progress
Report – change ideas moved up,
comments optional
• Ability to add graphic/results
(graphs)
Navigator Enhancements: Progress Report (PR)

41
• Addition of resources (links) to
change ideas window
• Ability to change order of
change ideas
• Automated calculations for
surveys
• Ability to export full workplan
template
Navigator Enhancements: Workplan
Other Enhancements Improved automated password
reset process
Ability to export full Narrative
template
New ‘simplified’ Query QIP report
(issue + sector)
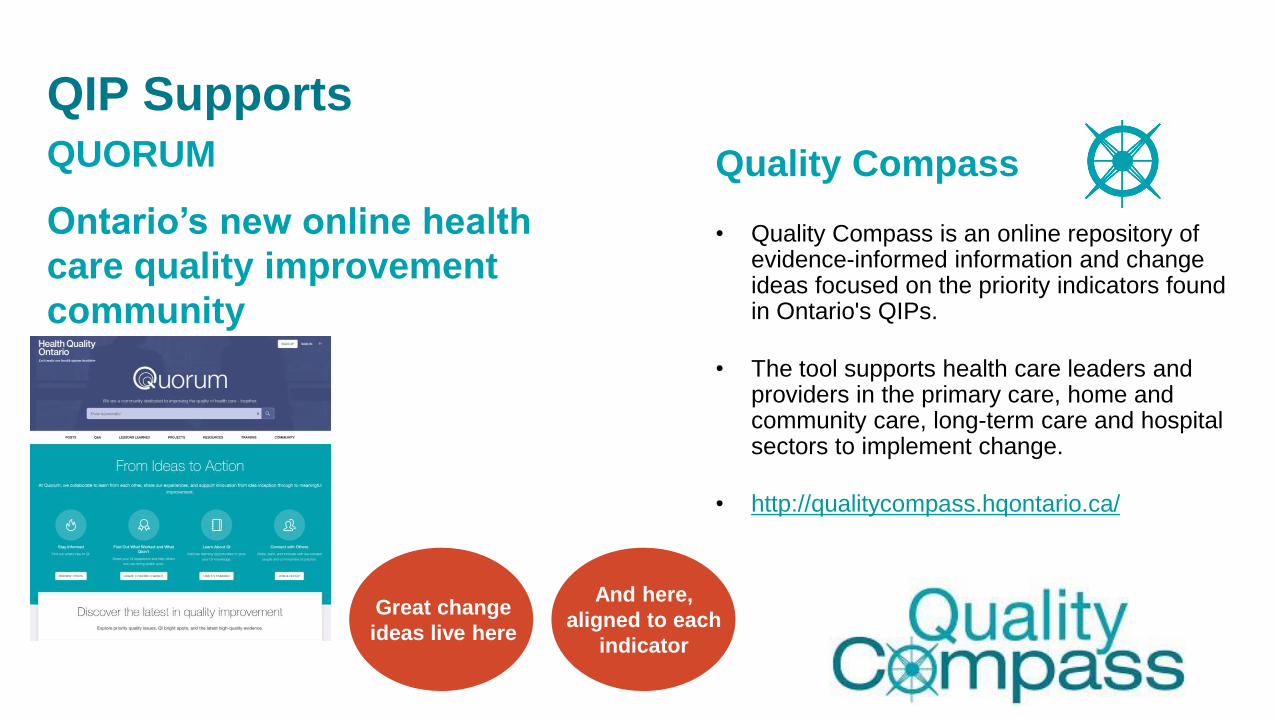
QUORUM
Ontario’s new online health
care quality improvement
community
Great change
ideas live here
QIP Supports
Quality Compass
• Quality Compass is an online repository of evidence-informed information and change ideas focused on the priority indicators found in Ontario's QIPs.
• The tool supports health care leaders and providers in the primary care, home and community care, long-term care and hospital sectors to implement change.
• http://qualitycompass.hqontario.ca/
And here,
aligned to each
indicator


44
Learn about shareable ideas
in 5 Steps using Query QIP
1. Go to HQO’s Navigator website. Search for “HQO Navigator” in your internet browser and click on this site. You don’t
need to login, as Query QIP is publically available.
2. Click on the “Query QIP” tab at the top of the webpage, and you will see a drop down menu of options.
3. Decide if you want to search by text or by indicator, and if you want to search the Narrative, Workplan or Progress
Report. Each report is created separately.
4. If you select “text” (and not indicator), enter the term / text you want to search in the first field. If you select “indicator”
( and not text), consider if this indicator is a priority, additional or custom QIP indicator. Select this as a parameter
before selecting the indicator you want to search. If you don’t know if the indicator is a priority, addition or custom
indicator, simply select all three. Answer each of the other fields in turn to complete your report parameters.
5. To see each use of the term / text in the report you are creating, make sure you say “yes” to the last question, which
highlights your text word with every instance of its use in the report.
If you have any trouble using Query QIP, or any of the Navigator functionality email: [email protected] .

45
Get connected to Quality Standards. Each quality standard focuses
on a certain health care issue and consists of:
Clinical Guide
Patient Guide
Recommendations for Adoption
Information and Data BriefData Infographic
Venous and Mixed Venous/Arterial Leg Ulcers Care for Patients in All Settings
www.HQOntario.ca
INFORMATION AND DATA BRIEF: WHY THIS QUALITY STANDARD IS NEEDED
A Getting Started
Guide and Action
Plan Template to
assist providers,
teams and
organizations to use
the quality standard
and prioritize quality
statements to guide
improvement.

46
Helping patients
and the system
engage through
tools and
resources
Patient Engagement