Long&lived geomagnetic storms and coronal mass ejections
17
Long-lived geomagnetic storms and coronal mass ejections H. Xie, 1,2 N. Gopalswamy, 3 P. K. Manoharan, 4 A. Lara, 5 S. Yashiro, 1,2 and S. Lepri 6 Received 24 June 2005; revised 17 October 2005; accepted 28 October 2005; published 13 January 2006. [1] Coronal mass ejections (CMEs) are major solar events that are known to cause large geomagnetic storms (Dst < 100 nT). Isolated geomagnetic storms typically have a main phase of 3–12 hours and a recovery phase of around 1 day. However, there are some storms with main and recovery phases exceeding 3 days. We trace the origin of these long-lived geomagnetic storms (LLGMS) to frontside halo CMEs. We studied 37 LLGMS events with Dst < 100 nT and the associated CMEs which occurred during 1998–2002. It is found that LLGMS events are caused by (1) successive CMEs, accounting for 64.9% (24 of 37); (2) single CMEs, accounting for 21.6% (8 of 37); and (3) high- speed streams (HSS) in corotating interaction regions (CIRs) with no related CME, accounting for 13.5% (5 of 37). The long duration of the LLGMS events was found to be due to successive CMEs and HSS events; the high intensity of the LLGMS events was related to the interaction of CMEs with other CMEs and HSS events. We find that the duration of LLGMS is well correlated to the number of participating CMEs (correlation coefficient r = 0.78). We also find that the intensity of LLGMS has a good correlation with the degree of interaction (the number of CMEs interacting with a HSS event or with themselves) (r = 0.67). The role of preconditioning in LLGMS events, where the Dst development occurred in multiple steps in the main and recovery phases, has been investigated. It is found that preconditioning does not affect the main phase of the LLGMS events, while it plays an important role during the recovery phase of the LLGMS events. Citation: Xie, H., N. Gopalswamy, P. K. Manoharan, A. Lara, S. Yashiro, and S. T. Lepri (2006), Long-lived geomagnetic storms and coronal mass ejections, J. Geophys. Res., 111, A01103, doi:10.1029/2005JA011287. 1. Introduction [2] Intense geomagnetic storms generally occur when solar wind with intense, long-duration southward interplan- etary magnetic field (IMF) impacts Earth’s magnetosphere. During geomagnetic storms, southward IMF reconnects with Earth’s geomagnetic field at the dayside magneto- pause, resulting in a chain of events leading to the dramatic increase of the ring current westward, which induces a magnetic field opposite to the geomagnetic field and causes global depression in the horizontal component (H) of the geomagnetic field. It has been known since the work of Burton et al. [1975] that the intensity of geomagnetic storms is proportional to the interplanetary dawn-dusk electric field E = V sw B s /c, where V sw is the solar wind flow speed and B s is the southward component of the IMF [e.g., Tsurutani and Gonzalez, 1997; Gonzalez et al., 1994]. Burton et al. [1975] provided a simple formula describing the dependence of the energy injection into the ring current system as a function of the solar wind electric field E, indicating that the duskward E is generally associated with the observed negative Dst peak (an index proportional to the kinetic energy of the ring current particles) during the storm. Using an empirical model, O’Brien and McPherron [2000] found that this energy injection is proportional to E E c , where the threshold to the electric field E c = 0.49 mV/m. Large-intensity storms are expected to be a more direct response to the interplanetary conditions, where their long life is mainly from the large value reached by jDstj. [3] The Dst (disturbance storm time) index is based on the H-component of the geomagnetic field averaged over four near-equatorial observatories. The strength of geomag- netic storms can be measured by the Dst index. In the case of an isolated magnetic storm, the Dst decreases drastically in the main phase and then recovers gradually to its quiet time level in the recovery phase. An isolated magnetic storm normally lasts for 1 day with a typical main phase of 3–12 hours and a recovery phase lasting 14 ± 4 hours [e.g., Dasso et al., 2002; Tsurutani and Gonzalez, 1997]. However, there are some geomagnetic storms, which have more complex structure and show multiple-step decreases in Dst in the main phase and/or recovery phases. These geomagnetic storms often have longer duration and higher intensity. We refer to geomagnetic storms with total dura- tion exceeding 3 days as long-lived geomagnetic storms (LLGMS). JOURNAL OF GEOPHYSICAL RESEARCH, VOL. 111, A01103, doi:10.1029/2005JA011287, 2006 1 Catholic University of America, Washington, D.C., USA. 2 Also at NASA Goddard Space Flight Center, Greenbelt, Maryland, USA. 3 NASA Goddard Space Flight Center, Greenbelt, Maryland, USA. 4 National Center for Radio Astronomy, Tata Institute of Fundamental Research, Ooty, India. 5 Instituto de Geofisica, National Autonomous University of Mexico, Mexico City, Mexico. 6 Atmospheric, Oceanic, and Space Sciences, University of Michigan, Ann Arbor, Michigan, USA. Copyright 2006 by the American Geophysical Union. 0148-0227/06/2005JA011287 A01103 1 of 17
Transcript of Long&lived geomagnetic storms and coronal mass ejections

Long-lived geomagnetic storms and coronal mass ejections
H. Xie,1,2 N. Gopalswamy,3 P. K. Manoharan,4 A. Lara,5 S. Yashiro,1,2 and S. Lepri6
Received 24 June 2005; revised 17 October 2005; accepted 28 October 2005; published 13 January 2006.
[1] Coronal mass ejections (CMEs) are major solar events that are known to cause largegeomagnetic storms (Dst < �100 nT). Isolated geomagnetic storms typically have a mainphase of 3–12 hours and a recovery phase of around 1 day. However, there are somestorms with main and recovery phases exceeding �3 days. We trace the origin of theselong-lived geomagnetic storms (LLGMS) to frontside halo CMEs. We studied 37 LLGMSevents with Dst < �100 nT and the associated CMEs which occurred during 1998–2002.It is found that LLGMS events are caused by (1) successive CMEs, accounting for�64.9% (24 of 37); (2) single CMEs, accounting for �21.6% (8 of 37); and (3) high-speed streams (HSS) in corotating interaction regions (CIRs) with no related CME,accounting for �13.5% (5 of 37). The long duration of the LLGMS events was found tobe due to successive CMEs and HSS events; the high intensity of the LLGMS events wasrelated to the interaction of CMEs with other CMEs and HSS events. We find that theduration of LLGMS is well correlated to the number of participating CMEs (correlationcoefficient r = 0.78). We also find that the intensity of LLGMS has a good correlation withthe degree of interaction (the number of CMEs interacting with a HSS event or withthemselves) (r = 0.67). The role of preconditioning in LLGMS events, where the Dstdevelopment occurred in multiple steps in the main and recovery phases, has beeninvestigated. It is found that preconditioning does not affect the main phase of the LLGMSevents, while it plays an important role during the recovery phase of the LLGMS events.
Citation: Xie, H., N. Gopalswamy, P. K. Manoharan, A. Lara, S. Yashiro, and S. T. Lepri (2006), Long-lived geomagnetic storms
and coronal mass ejections, J. Geophys. Res., 111, A01103, doi:10.1029/2005JA011287.
1. Introduction
[2] Intense geomagnetic storms generally occur whensolar wind with intense, long-duration southward interplan-etary magnetic field (IMF) impacts Earth’s magnetosphere.During geomagnetic storms, southward IMF reconnectswith Earth’s geomagnetic field at the dayside magneto-pause, resulting in a chain of events leading to the dramaticincrease of the ring current westward, which induces amagnetic field opposite to the geomagnetic field and causesglobal depression in the horizontal component (H) of thegeomagnetic field. It has been known since the work ofBurton et al. [1975] that the intensity of geomagnetic stormsis proportional to the interplanetary dawn-dusk electric fieldE = �Vsw � Bs/c, where Vsw is the solar wind flow speedand Bs is the southward component of the IMF [e.g.,Tsurutani and Gonzalez, 1997; Gonzalez et al., 1994].
Burton et al. [1975] provided a simple formula describingthe dependence of the energy injection into the ring currentsystem as a function of the solar wind electric field E,indicating that the duskward E is generally associated withthe observed negative Dst peak (an index proportional to thekinetic energy of the ring current particles) during the storm.Using an empirical model, O’Brien and McPherron [2000]found that this energy injection is proportional to E � Ec,where the threshold to the electric field Ec = 0.49 mV/m.Large-intensity storms are expected to be a more directresponse to the interplanetary conditions, where their longlife is mainly from the large value reached by jDstj.[3] The Dst (disturbance storm time) index is based on
the H-component of the geomagnetic field averaged overfour near-equatorial observatories. The strength of geomag-netic storms can be measured by the Dst index. In the caseof an isolated magnetic storm, the Dst decreases drasticallyin the main phase and then recovers gradually to its quiettime level in the recovery phase. An isolated magneticstorm normally lasts for 1 day with a typical main phase of3–12 hours and a recovery phase lasting �14 ± 4 hours[e.g., Dasso et al., 2002; Tsurutani and Gonzalez, 1997].However, there are some geomagnetic storms, which havemore complex structure and show multiple-step decreasesin Dst in the main phase and/or recovery phases. Thesegeomagnetic storms often have longer duration and higherintensity. We refer to geomagnetic storms with total dura-tion exceeding 3 days as long-lived geomagnetic storms(LLGMS).
JOURNAL OF GEOPHYSICAL RESEARCH, VOL. 111, A01103, doi:10.1029/2005JA011287, 2006
1Catholic University of America, Washington, D.C., USA.2Also at NASA Goddard Space Flight Center, Greenbelt, Maryland,
USA.3NASA Goddard Space Flight Center, Greenbelt, Maryland, USA.4National Center for Radio Astronomy, Tata Institute of Fundamental
Research, Ooty, India.5Instituto de Geofisica, National Autonomous University of Mexico,
Mexico City, Mexico.6Atmospheric, Oceanic, and Space Sciences, University of Michigan,
Ann Arbor, Michigan, USA.
Copyright 2006 by the American Geophysical Union.0148-0227/06/2005JA011287
A01103 1 of 17

[4] It is now well established that coronal mass ejections(CMEs) are the major causes for large geomagnetic storms(Dst < �100 nT) [Brueckner et al., 1998; Cane et al., 2000;Gopalswamy et al., 2000, 2005; Wang et al., 2002; Webb etal., 2000; Zhang et al., 2003]. High-speed streams (HSS) incorotating interaction regions (CIRs) cause only moderate toweak storms (�100 nT < Dst < �50 nT). CMEs on the Sunare intrinsically magnetic entities with large fields; they alsocompress any IMF at their leading regions when they travelthrough the interplanetary (IP) medium and interact withother IP CMEs (ICMEs) and/or the ambient solar winddriving IP shocks. Manoharan et al. [2004] studied theinfluence of CME interaction on propagation of IP shocksand found that the CME interaction tends to slow the shock.Southward magnetic field (Bs) in shock sheaths and ICMEsor magnetic clouds (MCs) contribute to the generation ofthe geomagnetic storms. Burlaga et al. [2001] studied a setof fast ejecta observed at 1 AU from 5 February 1998 to29 November 1999 and found all MC events and twocomplex ejecta resulting from the interaction of multipleCMEs produced geomagnetic storms. When HSS encounterand interact with CMEs, they can further compress Bz andenhance geoeffectiveness [e.g., Burlaga et al., 1987;Burlaga, 1995; Gopalswamy et al., 2005].[5] Severe LLGMS events are often associated with com-
plex interplanetary interaction regions [e.g., Burlaga et al.,1987; Cane and Richardson, 1997; Crooker et al., 1998;Burlaga et al., 2002, 2003]. The common feature of theinteraction regions is that they have relatively high andcomplex magnetic fields, which may consist of two or moreBs structures and cause amultistepDst decrease. Such a stormis the so-called multistep storm [Tsurutani and Gonzalez,1997; Kamide et al., 1998;Gonzalez et al., 2001]. In general,multistep storms result from consecutive impacts of south-ward Bs in different regions on the magnetosphere.Kamide etal. [1998] performed a statistical analysis of more than 1200geomagnetic storms for the period from 1957 to 1991 andfound that geomagnetic storms with two-step intensificationslast longer and have larger storm size than the single-stepstorms.Grande et al. [1996] studied the 23 March 1991 two-step magnetic storm and found that the first event wasdominated by Fe+9 while the second by Fe+16. The possibleexplanation for this is that the first event was caused by the Bs
in the shocked sheath region, while the second was caused bythe intrinsic fields in the MC since high charge states areassociated with ICMEs [Fenimore, 1980; Henke et al., 1998;Gloeckler et al., 1999; Lepri et al., 2001]. Gonzalez et al.[2001] showed that for some events the main phase mightdevelop in more than two consecutive steps; these stormsexhibit a slowly developed long-duration main phase andrelate to complex southward Bs structure.[6] Kamide et al. [1998] argued that the two-step storm
may result from the superposition of two successive modeststorms. However, this assumption might be oversimplified.More studies indicate that the multistep storms could not bethe result of simple superposition of individual ring currentdevelopments [e.g., Chen et al., 2000; Kozyra et al., 1998,2002]. Chen et al. [2000] demonstrated that two intervals ofenhanced convection are not inherently more effective atproducing a strong ring current than one longer interval.Kozyra et al. [1998] showed that the inner magnetosphereretains little or no memory of previous injections since earlier
injections are swept out of the dayside magnetopause as newpopulation for the plasma sheet moves into the inner mag-netosphere. The authors suggested that preconditioningoccurs in a multistep storm through the cumulative effectsof the successive storms on the plasma sheet population[Kozyra et al., 1998, 2002]. Another possibility is thatprevious storms prime the inner magnetosphere through thesubstorm-associated accumulation of O+ ions injected fromthe ionosphere during intense storms [Hamilton et al., 1988;Daglis, 1997].[7] In this paper, we conduct a statistical study of LLGMS,
successive CMEs, and interaction regions of complex ejecta,IP shocks, and HSS to investigate their effects on the durationand intensity of these storms. We identified 37 LLGMSevents with Dst < �100 nT during 1998–2002. We studiedthe storm duration, storm intensity, IP driver of the storm, andthe cause of associated Bs structures. We found that when thedriver of the LLGMS is associated with multiple CMEs(64.9% of the cases), the duration of LLGMS events is wellcorrelated with the number of participating CMEs in anLLGMS and the intensity of LLGMS has a good correlationwith the degree of interaction (the number of CMEs interact-ing with a HSS event or with themselves, see definition insection 3). Also, we investigated the role of cumultivepreconditioning from consecutive storms in the multistepring current intensifications in LLGMS events.
2. Methodology
[8] We used theDst index data from theWorld Data Centerin Kyoto (http://swdcwww.kugi.kyoto-u.ac.jp/dstdir/) toidentify the geomagnetic storms. The associated CMEsobserved by the Solar and Heliospheric Observatory (SOHO)mission’s coronagraphs were obtained from the CME catalog(http://cdaw.gsfc.nasa.gov/CME_list) [Yashiro et al., 2004].The solar source regions of the CMEwere identified from theonline Solar Geophysical Data (SGD) as the location of theassociated GOES X-ray flares in order to see if CMEs werefrontside and traveling toward Earth. When GOES X-rayflare information was not available, we used movies from theExtreme-ultraviolet Imaging Telescope (EIT) on boardSOHO and Yohkoh mission’s soft X-ray telescope to identifythe location of the eruption. In order to identify the ICMEs,we use Fe charge state data from Advanced CompositionExplorer/Solar Wind Ion Composition Spectrometer (ACE/SWICS), the solar wind plasma density, temperature, andflow speed from the Solar Wind Experiment (SWE) aboardthe Wind spacecraft; and the magnitude jBj and the Bz
component of the interplanetary magnetic field from WindMagnetic Field Investigation (MFI). Also, we used the IPshocks from Wind online shock list (http://pwg.gsfc.nasa.gov/wind/current_listIPS.htm), the MC list from Lepping etal. [2005], the MC-like (MCL) structures from Wind MFIonline list (http://lepmfi.gsfc.nasa.gov/mfi/MCL1.html), andthe CME trajectories obtained from empirical CME arrival(ECA)model [Gopalswamy et al., 2000, 2001] to identify thearrival of successive CMEs at 1 AU.[9] The ECA model is based on the empirical interplan-
etary acceleration of CME, which was found to be
a ¼ 2:193� 0:0054u0 s < d1ð Þa ¼ 0 s > d1ð Þ ð1Þ
A01103 XIE ET AL.: LLGMS AND CMES
2 of 17
A01103

where a is acceleration in units of m s�2, and u0 is initialCME speed in units of km s�1, s is the heliocentric distancealong the line of sight, d1 is the acceleration ceasingdistance. The ECA model assumed that the accelerationceases at a distance d1 in interplanetary space when theCME speed is the same as the ambient solar wind speed.Assuming d2 = 1 AU � d1, the CME travel time iscomputed as the sum of time t1 to travel d1 and t2 to d2: t =t1 + t2, where
t1 ¼�uþ
ffiffiffiffiffiffiffiffiffiffiffiffiffiffiffiffiffiffiffiffiu2 þ 2ad1
p
a; t2 ¼
d2ffiffiffiffiffiffiffiffiffiffiffiffiffiffiffiffiffiffiffiffiu2 þ 2ad1
p : ð2Þ
[10] The CME trajectories can be obtained from the basickinematic equations:
s ¼ u0t þ at2=2 t < t1ð Þs ¼ u1t þ d1 t > t1ð Þ ð3Þ
The ECA model requires the initial radial speed of a CMEas input parameter. One of the difficulties in obtaining theCME initial speed is the uncertainty due to projectioneffects. Even though Earth-impacting CMEs typicallyoriginate from close to the Sun center [Gopalswamy et
al., 2000], there is no easy way to determine whether a haloor partial halo CME would reach Earth. In this work, weattempt to correct for the projection effect and resolve thecriterion for a CME to reach Earth by an improved CMEcone model [Xie et al., 2004]. In the cone model, theorientation of a CME is defined by the longitude angle a (orj) and the latitude angle q (or l); the angular width of theCME is defined by 2w, as shown in Figure 1. The actualradial speed of the CME is given by
Vr ¼dr
dt¼ Vxc 0
cosw cos q� sinw sin q sin d
or
Vr ¼dr
dt¼
Vyc 0
sinw cos d
; ð4Þ
where Vxc0 and Vyc0 are the components of the CMEprojection speed along xc0 and yc0 axes in the plane of the sky(POS), respectively, d is the azimuthal angle defined as d =
Figure 1. Topology of the cone model. The coordinate (xh,yh, zh) is the heliocentric coordinate system, where zh pointsto Earth, yh points north, and the xh - yh plane defines theplane of the sky (POS). The coordinate (xc, yc, zc) is thecone coordinate system, where xc is the cone axis, and the yc- zc plane is parallel to the base of the right cone. The angles(f, l) are the longitude and latitude relative to the eclipticplane. l is the angle between the cone axis xc and the xh - yhplane and f is the angle between projection of xc on the xh -yh plane and the zh - axis. The angles (a, q) are defined asthe longitude and latitude relative to POS for convenientlydetermining the cone model parameters, where q is the anglebetween xc and POS and a is the angle between the coneaxis projection on POS and xh–axis.
Figure 2. Illustration of the constraint w � b + D betweenthe angular width 2w and orientation (b, D) for a front-sidehalo (D = 0) or partial halo CME to encounter Earth. O isthe solar disk center. O0 is any arbitrary point on the solarsurface near the disk center. Here b is the angle between thecone central axis and the line-of-sight (LOS). Here q is theangle between the cone central axis and the plane of the sky.L is the distance of O0 to the LOS, and D is the anglebetween the LOS and one (Earth-directed) of the conelateral projections.
A01103 XIE ET AL.: LLGMS AND CMES
3 of 17
A01103

Table 1. Successive CME Association With Long-Lived Geomagnetic Storms
NumDst_minTime,a UT
Dst_min,b nT
Start,c
UTEnd,d
UTDur,e
day IP Driverf CMEgSourceLoc.h
Categoryand Commentsi
19981 0218 0100 �100 0217 1200 0221 0100 �3.5 MC + HSS 0214 0655 (pH) S24E23 S: (1, 1, h)2 0307 0000 �116 0310 1100 0317 1000 �8.1 HSS in CIR - - C: (0, 0, h)3 0504 0600 �205 0502 0200 0508 0000 �5.9 Sh. + C. ICME 0429 1658 (H) S18E20 M: (5, 3)
0501 2340 (H) S18W050502 0531 (H) S20W070502 1406 (H) S15W150503 2202 (pH) S13W34
4 0806 1200 �138 0806 0000 0809 1400 �3.6 MC + HSS DG - S: (1, 1, h)5 0827 1000 �155 0826 0900 0901 0900 �6.0 Sh. + MCL+ HSS DG - S: (1, 1, h)6 0925 1000 �207 0925 0100 0929 1300 �4.5 Sh. + MC + HSS DG - S: (1, 1, h)7 1019 1600 �112 1019 0000 10/23 1400 �4.6 MC + HSS 10/15 1004 (H) N22W01 S: (1, 0, h)8 1108 0700 �149 1108 2100 1112 0800 �3.5 C. ICME 11/05 0202 (H) N19W10 M: (3, 2)
11/05 2044 (H) N22W1811/06 0218 (pH) N19W24
9 1113 2200 �131 1113 0000 1117 1200 �4.5 Sh. + 2 MCL + HSS 11/09 1818 (pH) N18W02 M: (2, 1, h)11/10 0618 (pH) N17W08
199910 0218 1800 �123 0218 400 0221 1400 �3.5 Sh. + C. ICME DG - M: (3, 2)11 1022 0700 �237 1021 0400 1029 1900 �8.6 MCL + HSS 10/19 0550 (pH) S24E18 S: (1, 1, h)12 1113 2300 �106 1110 2300 1115 2100 �4.9 HSS + C. ICME DG - M: (2, 0, h)
200013 O212 1200 �133 0211 0400 0216 0100 �4.9 C. ICME + Sh. + HSS 02/08 0930 (H) N25E26 M: (4, 3, h)
02/09 1954 (H) S17W4002/10 0230 (H) N31E0402/12 0431 (H) N26W26
14 0407 0100 �288 0406 1800 0412 1200 �5.8 MCL + HSS 0404 1632 (H) N16W66 S: (1, 2, h)15 0524 900 �147 0523 2000 0526 2200 �3.1 C. Sh. + ICME 0522 0126 (H) S20W48 M: (2, 2)
0520 1450 (pH) S21W3016 0716 0200 �301 0715 1600 0718 2000 �3.2 Sh. + MC 07/14 1054 (H) N22W07 S: (1, 2)17 0812 1000 �235 0810 300 0814 2200 �4.8 2 MCs 08/09 1630 (H) N11W11 M: (3, 2)
08/06 1830(pH) N10E300810 0654 (pH) N18E00
18 0918 0000 �201 0917 2000 0921 2200 �4.1 Sh. + 3 MCLs 09/15 2150 (H) N12E04 M: (4, 2)09/16 0518 (H) N14W070915 1206 (pH) N13E080915 1526 (pH) N12E07
19 1005 1400 �182 1002 0700 1008 1300 �6.3 Sh. + 4 MCLs 1002 0350 (H) S09E07 M: (6, 3)1002 2026 (H) S09E000929 2150 (pH) S11E130930 1806 (pH) S20E421001 1350 (pH) S10E151003 0806 (pH) N27W59
20 1107 0200 �159 1105 1400 1108 1100 �3.1 Sh. + 3 ICMEs (2 MCLs) 1103 1826 (H) N02W02 M: (3, 2)11/02 1626 (pH) N23W581104 0150 (100) S27 W30
21 1129 1400 �119 1126 1600 1202 900 �5.4 Sh. + C. ICME 10 Halos - M: (10, 2)
200122 0331 0900 �387 0330 2300 0403 2100 �3.9 Sh. + MCL 03/28 0127 (H,) N20E22 M: (4, 4)
03/28 1250 (H) N18E0203/29 1026 (H) N20W1903/29 0026 (106) N17W04
23 1003 1500 �166 0925 2200 1005 1400 �9.7 Sh. + HSS + C. ICME 0924 1030 (H) S16E23 M: (4, 2, h)0928 0854 (H) N10E180929 1154 (H) S13E030928 1030 (pH) S18W36
24 1021 2200 �187 1021 1800 1025 1000 �3.7 Sh. + C. ICME 1019 0127 (H) N16W18 M: (3, 2)1019 1650 (H) N15W291018 2026 (pH) S17E69
25 1028 1200 �157 1028 400 1031 1400 �3.4 Sh. + C. ICME 1025 1526 (H) S16W21 M: (2, 0)1026 2050 (105) N09E08
26 1106 0700 �292 1105 1900 1112 1000 �6.6 Sh. + C. ICME +HSS 11/01 2230 (H) N12W23 M: (3, 3, h)11/03 1920 (H) N03W1611/04 1635 (H) N06W18
27 1124 1700 �221 1124 0700 1128 0900 �4.1 Sh. + C. ICME (2 MCL) 1121 1406 (H) S14W19 M: (3, 3)1122 2030 (H) S25W671122 2330 (H) S17W24
A01103 XIE ET AL.: LLGMS AND CMES
4 of 17
A01103

tan�1(zc/yc) in the cone coordinate. The projection speed Vr0on POS along the position angle (PA) is related to Vxc0 andVyc0 as follows: Vxc0 = Vr0 sin(a � PA) and Vyc0 = Vr0 cos(a �PA).[11] The criterion for a CME to arrive at Earth is given by
w � bþ D; ð5Þ
where b is the angle between the cone central axis and theline-of-sight (LOS), L is the displacement of the CMEsource region to LOS, and D is the angle between theLOS and one (earthward) of the cone lateral projections, D =L/1 AU (see Figure 2) [Xie et al., 2004].
3. Data
[12] Table 1 lists the 37 LLGMS events. In the table, theDst minimum (Dstmin) time, Dstmin value, storm onset time,storm end time, storm duration, IP driver, CME firstappearance time in C2, associated solar source location,storm category, and comments are listed. The storm onsettime is defined by the occurrence time of storm suddencommencement (SSC), which is caused by an intensifica-tion of the magnetopause current as the enhanced solar winddynamic pressure (due to the IP shock) drives the magne-topause inward. The SSC is normally associated with the
occurrence of IP shocks but may not be recognizable whenthe geomagnetic field is already depressed (precondition-ing). When there is no clear identification of an SSC, wedefine the storm onset time as the time when Dst startsdecreasing. The storm end time is defined by the time whenthe Dst recovers to Dst0(1/e), where Dst0 is �50 nT, theminimum intensity of modest storms. The LLGMS eventsare classified as (1) multiple CME (M) type, (2) single CME(S) type, and (3) CIR (C) type. In column 10, the firstnumber in parentheses represents the number of participat-ing CMEs in an LLGMS. The criterion to determine thenumber of participating CMEs in the LLGMS is to examinewhether the arrival time of CMEs from the ECA model fallsinto the interval of LLGMS plus an error of ±21.4 hours,i.e., two times of root-mean-square (rms) of ECA model,where the average prediction error (rms) was estimated as10.7 hours [Gopalswamy et al., 2001]. The second numberin column 10 represents the degree of interaction, which isdefined as follows: if the interaction occurs between a CMEand a HSS, the interaction is of degree 1; otherwise, thedegree is equal to the number of CMEs involved in thepossible interaction. We applied criterion (5) to identify if aCME has a component heading toward Earth [Xie et al.,2004] and extrapolated the CME trajectories from the Sunto 1 AU (see bottom panel of Figures 3a and 3b ). If thetrajectories of two CMEs intersect, then it indicates that an
NumDst_minTime,a UT
Dst_min,b nT
Start,c
UTEnd,d
UTDur,e
day IP Driverf CMEgSourceLoc.h
Categoryand Commentsi
200228 0420 0900 �149 0417 1200 0423 0500 �5.7 Sh. + MC +HSS + MCL 0415 0350 (H) S15W01 M: (2, 1, h)
0417 0826 (H) S14W3429 0523 1800 �109 0522 0200 0526 0200 �4.0 C. Sh. + HSS 0522 0350 (H) S30W34 M: (3, 0, h)
0521 2150 (pH) N17E380522 0006 (pH) S20W70
30 0821 0700 �106 0819 0000 0822 1900 �3.8 Sh. + C. ICME (2 MCs) 0816 1230 (H) S14E20 M: (4, 0)0818 2154 (pH) S08W280819 1106 (pH) S12W190820 0154 (pH) S11W35
31 0904 0600 �109 0903 2000 0907 0000 �3.2 HSS in CIR - - C: (0, 0, h)32 0908 0100 �181 0907 0100 0915 1000 �10.4 Sh. + C. ICME + HSS 0905 1654 (H) N09E28 M: (4, 2, h)
0906 1331 (H) N11W45 Pre. – 27 nT0904 1331 (pH) S15E070908 1506 (pH) N12E76
33 1001 1700 �176 0930 200 1003 1000 �3.3 Sh. + MC 0928 0131(89) N11E36 M: (3, 3)0928 1106(79) N12E330929 0806 (106) S08W70
34 1004 0900 �146 1003 1000 1006 1500 �3.2 Sh. + 2 MCs 1002 0731 (pH) S18E20 M: (3, 0)1003 0354 (pH) S19E06 Pre. – 45 nT1003 0554 (pH) N13W29
35 1007 0800 �115 1006 1500 1013 1300 �6.9 HSS in CIR - - C: (0, 0, h)36 1014 1400 �100 1013 1300 1021 0600 �7.7 HSS in CIR - - C: (0, 0, h)37 1121 1100 �128 1121 300 1126 2200 �5.8 HSS in CIR - - C: (0, 0, h)aDst minimum time of the LLGMS.bDst minimum value of the LLGMS.cStart time of the LLGMS.dEnd time of the LLGMS.eDuration of the LLGMS.fInterplanetary driver causing southward IMFs. MCL = Magnetic Cloud Like, Sh. = Sheath, C. = Compressed or Compound.gAssociated CME first appearance time in C2. Halo = Full Halo CME, pH = Partial Halo CME. If related CMEs are neither Halo or partial Halo, then
their angular width are listed. DG = Data Gap.hSolar source location of the associated CMEs.iM = Multiple CME, S = Single CME, C = CIR. The first number in parentheses is the number of associated CMEs, second number is the degree of
interaction: the degree of 1 represents interaction between a CME and a HSS, otherwise, the degree is equal to the number of CMEs involved in the possibleinteraction, h = cases involving HSS events.
Table 1. (continued)
A01103 XIE ET AL.: LLGMS AND CMES
5 of 17
A01103

interaction has occurred between the two CMEs (the dis-tance where the CME interaction occurs is indicated in they-axis of the CME height-time plot). The third letter ‘‘h’’ inparentheses of column 10 denotes cases involving an HSSevent.[13] Figures 3a, 3b, 5, and 6 present four examples of
LLGMS events, in which we show the associated Dstvariation and related solar wind parameters. Figure 3ashows the Dst index, Fe charge state data hQFei, jBj andBz, solar wind density N, temperature T, flow velocity V, andthe trajectories (height-time profiles) of the associatedCMEs for the 12 February 2000 event. In this event theLLGMS lasted for �4.9 days (11–16 February). There weretwo dips (dip ‘‘A’’ and dip ‘‘B’’) in the main phase and twodips (dip ‘‘C’’ and dip ‘‘D’’) in the recovery phase (seearrows in the Dst plot). Four CMEs (labeled with numbers
on the CME trajectories of Figure 3a) have been found to beassociated with this event. Three forward fast shocks F1 (on11 February at 0233 UT related to CME 1), F2 (on 11February at 2338 UT resulting from the possible interactionof CME 2 and CME 3), and F3 (on 14 February at 0718 UTcorresponding to CME 4), were present in this event. CME2 and CME 3 arrived at about the same time at �1 AU. It islikely that CME 3 has caught up with CME 2 and the twoCMEs merged, resulting in a single complex ejecta (ICME2). A MC (12 February, 1706 to 13 February, 0036) with acomplex leading sheath region formed part of ICME 2. Ananomalous high Fe charge state interval in the eventcorresponds to this complex ICME 2. Figure 3a shows thatthe ICME 2 has run into the rear part of ICME 1, causingcompressed Bs in the trailing region of ICME 1. Possibleinteraction occurred between CME 1, CME 2, and CME 3.
Figure 3a. A LLGMS associated with successive CMEs. From top to bottom: the panels are Dst Index,Fe charge state, jBj, Bz, N, T, V and CME height-time profile, respectively. The vertical solid lines indicatethe ICME shock front (F1, 2, 3, 4, F denotes forward fast shock). The number on the bottom panelindicates the associated CMEs. The arrows show the dips in complex structures of Dst and Bz. Note thatthe drop in hQFei near F2 is due to the instrumental noise produced by the impact of the shock.
A01103 XIE ET AL.: LLGMS AND CMES
6 of 17
A01103

Dip ‘‘A’’ in the main phase was caused by the compressedBs in the rear part of ICME 1. Dip ‘‘B’’ followed by a smalldip was produced by the Bs structures in the sheath regionand the MC, respectively. The MC was followed by a HSS-like structure with high T and low N, causing Dip ‘‘C’’ inthe recovery phase, where the Dst value was nearly constantfor more than 10 hours. However, this HSS-like structurecould also likely be the extension of the ICME 2, since noapparent coronal hole was observed at low latitude near theSun disk (ICME interval is typically featured with low Tand reduced field fluctations, but such features may not bepresent in some ICMEs [Cane and Richardon, 2003]). CME1, CME 3, and CME 4 originated from the active regionAR8858 when it was at N25E26, N31E04, and N26W26 as
the Sun rotated westward. CME 2 originated from AR8853at S17W40. Figure 3b shows the LASCO images of the foursuccessive CMEs associated with this event, superposedwith EIT images.[14] Figures 4a and 4b shows the Dst index, hQFei, jBj,
Bz, N, T, V, the trajectories of the associated CMEs and CMEC2 images for the 20 April 2002 event. In this event theLLGMS extended from 17 April to 23 April and the stormlasted for �5.7 days. The LLGMS consists of two consec-utive storms, which are associated with two successiveMCs: MC 1 (18 April, 0418 to 19 April, 0218) and MC 2(20 April, 1148 to 21 April, 1648). Two forward shocks F1
(17 April at 1101 UT), F2 (19 April at 2222 UT), and onereverse shock R2 (20 April at 0440 UT) were found ahead of
Figure 3b. LASCO C2 images of CMEs associated with the event. From top left to bottom right: CME1, CME2, CME3, and CME 4.
A01103 XIE ET AL.: LLGMS AND CMES
7 of 17
A01103
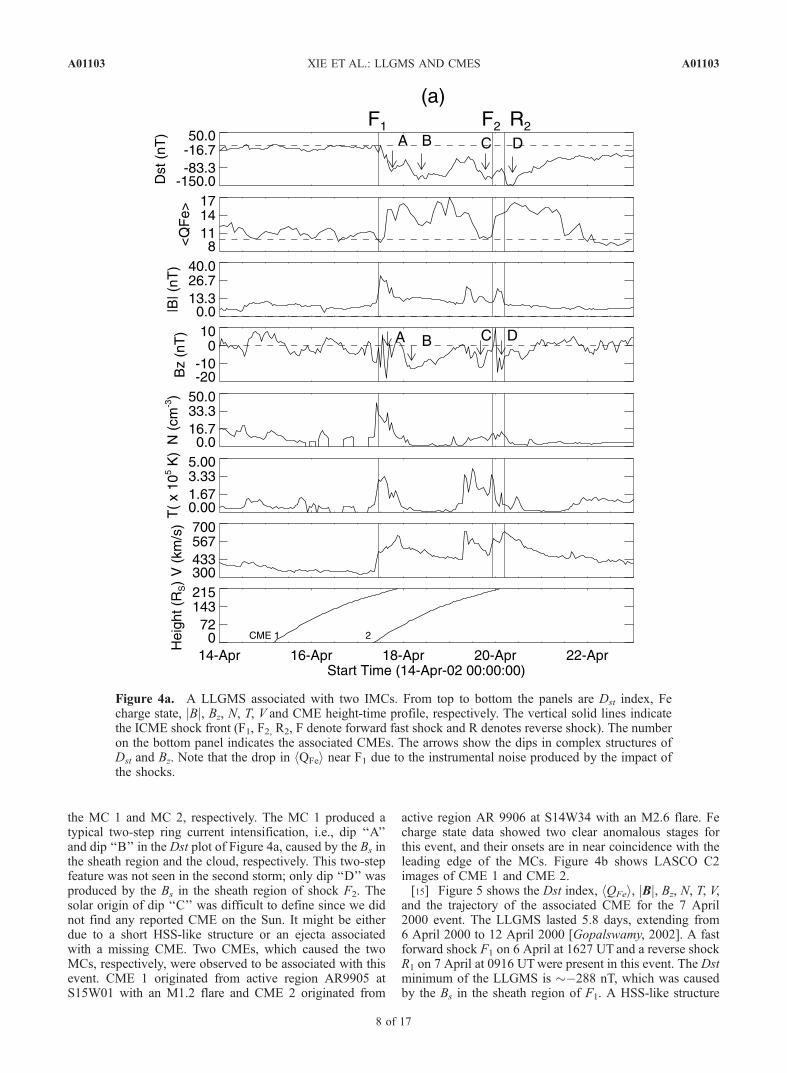
the MC 1 and MC 2, respectively. The MC 1 produced atypical two-step ring current intensification, i.e., dip ‘‘A’’and dip ‘‘B’’ in the Dst plot of Figure 4a, caused by the Bs inthe sheath region and the cloud, respectively. This two-stepfeature was not seen in the second storm; only dip ‘‘D’’ wasproduced by the Bs in the sheath region of shock F2. Thesolar origin of dip ‘‘C’’ was difficult to define since we didnot find any reported CME on the Sun. It might be eitherdue to a short HSS-like structure or an ejecta associatedwith a missing CME. Two CMEs, which caused the twoMCs, respectively, were observed to be associated with thisevent. CME 1 originated from active region AR9905 atS15W01 with an M1.2 flare and CME 2 originated from
active region AR 9906 at S14W34 with an M2.6 flare. Fecharge state data showed two clear anomalous stages forthis event, and their onsets are in near coincidence with theleading edge of the MCs. Figure 4b shows LASCO C2images of CME 1 and CME 2.[15] Figure 5 shows the Dst index, hQFei, jBj, Bz, N, T, V,
and the trajectory of the associated CME for the 7 April2000 event. The LLGMS lasted 5.8 days, extending from6 April 2000 to 12 April 2000 [Gopalswamy, 2002]. A fastforward shock F1 on 6 April at 1627 UT and a reverse shockR1 on 7 April at 0916 UTwere present in this event. The Dstminimum of the LLGMS is ��288 nT, which was causedby the Bs in the sheath region of F1. A HSS-like structure
Figure 4a. A LLGMS associated with two IMCs. From top to bottom the panels are Dst index, Fecharge state, jBj, Bz, N, T, V and CME height-time profile, respectively. The vertical solid lines indicatethe ICME shock front (F1, F2, R2, F denote forward fast shock and R denotes reverse shock). The numberon the bottom panel indicates the associated CMEs. The arrows show the dips in complex structures ofDst and Bz. Note that the drop in hQFei near F1 due to the instrumental noise produced by the impact ofthe shocks.
A01103 XIE ET AL.: LLGMS AND CMES
8 of 17
A01103

has caused the long recovery phase of the LLGMS. ShockF1 was associated with a fast halo CME with actual speed of1139 km/s and actual angular width of 128 obtained by thecone model.[16] Figure 6 shows the corresponding data for the
LLGMS from 6 October 2002 to 13 October 2002. TheLLGMS had lasted for �6.9 days with modest intensity ofthe minimum Dst � �115 nT. It was produced by a HSSemanating from a low-latitude coronal hole, which waspresent a few days earlier near the disk center at 2200 UTon the 5 October 2002 EIT image.
4. Statistical Results
4.1. Associations
[17] First of all we find that the LLGMS events wereproduced by complex Bs structures in various interactionregions: (1) IP shocks and complex ICMEs related tosuccessive CMEs; (2) single IP shock and ICME (MC);(3) HSS events in CIRs. Note that both type 1 and type 2might be mixing with possible HSS events. Of the37 LLGMS events, 24 (64.9%) were associated with multipleCMEs, 8 (21.6%) were caused by single CMEs, and5 (13.5%) were related to CIRs with no CME involvement.
4.2. LLGMS Properties
4.2.1. LLGMS Duration[18] In order to study the relationship between the dura-
tion of LLGMS and successive CMEs and their interactionwith HSS events, the LLGMS events were divided into thefollowing six groups: (1) all multiple CME cases; (2) allsingle CME cases; (3) all CIR cases with no related CME;(4) multiple CME cases with >3 CMEs; (5) all casesinvolving HSS; (6) cases with no HSS and � 2 CMEs.Note that the classification of the groups (1–6) does notimply disjunct sets, e.g., in this case group 4 is a subset ofgroup 1. We use group 4 to study the effects of multiple
CMEs (>3) on the duration (Dur) of LLGMS, and group 5to study the effects of HSS events on Dur. Group 6 is usedto study the cases without either multiple CMEs or HSS.Figure 7 presents the distribution of the duration of LLGMSfor six different groups. The median durations for the abovesix groups are 4.1, 4.6, 6.9, 5.4, 5.8, and 3.4 days,respectively. In the multiple CME group, the LLGMSevents were associated with more than one Bs structureand the Dst developed in multiple consecutive steps, caus-ing the long duration. The median durations for the multipleCME type 1 and 4 are 4.1 and 5.4 days, respectively. Themedian duration for the CIR group is the longest with amedian value of 6.9 days. The second-longest duration isfor all the LLGMS events involving HSS. The nature of theduration in the events involving HSS is due to the longperiods of Bs fluctuations within HSS. As expected, themedian duration for group 6 with no HSS and �2 CME isthe shortest among the six groups, with a median value of3.5 days. Therefore the CIRs and HSS are associated withthe largest duration LLGMS events. If an LLGMS isassociated with successive CMEs, the duration of the stormincreases with the number of the participating CMEs.Figure 9a shows the relationship between the LLGMSduration and the number (nc) of participating CMEs. Wefind that there is a good correlation between the durationand nc with correlation coefficient (r) of 0.78.[19] Note that some single CMEs (with no HSS) events
can reach long durations (�3 days) because of the very largestorm intensity in these events, which caused relatively longrecovery phase of the storms.4.2.2. LLGMS Intensity[20] To study the effect of the interaction CMEs with
other CMEs and HSS on the intensity of LLGMS, we groupthe LLGMS events as in subsection 4.2.1, except that group6 is classified as cases with no CME interaction. Weextrapolated the CME trajectories from the Sun to 1 AU(see bottom panel in Figure 3a) to decide if two CMEs
Figure 4b. LASCO C2 images of CME 1 and CME 2 associated with the event.
A01103 XIE ET AL.: LLGMS AND CMES
9 of 17
A01103

interact and applied criterion 5 to identify if a CME wouldreach Earth [Xie et al., 2004]. Figure 8 presents thehistogram of the Dstmin of LLGMS of the above groups.The median values of Dstmin for the six groups are �157,�155, �115, �181, �133, and �116 nT, repectively. Themultiple CME groups possessed relatively large medianDstmin values with a median value of �157 nT for group 1(all multiple CME cases) and �181 nT for group 4 (multipleCME with >3 CMEs). Group 3 (CIR cases) and group 5(cases with HSS involved) exhibited modest median inten-sity with a median Dstmin of �115 nT and �133 nT,respectively. In the multiple CME group 4, the CMEinteraction may play an important role in enhancing theintensity of the LLGMS events. Figure 9a shows therelationship between the LLGMS intensity and the degreeof interaction (ni) (see definition in section 3). It is foundthat the correlation coefficient (r) between the intensity andni is 0.67.
4.3. Preconditioning in LLGMS Events
[21] The relationship of the intensity of magnetic stormsto solar wind parameters can be examined using the Burtonequation [Burton et al., 1975]. Burton’s equation has beentested and improved by numerous authors [e.g., Clua deGonzalez and Gonzalez, 1998; Fenrich and Luhmann,1998; O’Brien and McPherron, 2000; Wang et al., 2003].It is given by O’Brien and McPherron in a slightly differentform:
dDst*
dt¼ Q tð Þ � Dst* tð Þ
t; ð6Þ
where the energy injection term
Q ¼a VBs � Ecð Þ VBs > Ec
0 VBs < Ec
8<: ;
Figure 5. A LLGMS associated with a single CME event: corresponding solar wind data, IMF, and theDst index from 2 April 2000 to 11 April 2000. The associated CME is a fast halo with an actual speed of1139 km/s.
A01103 XIE ET AL.: LLGMS AND CMES
10 of 17
A01103

Figure 6. A LLGMS associated with a HSS event: corresponding solar wind data, IMF, and the Dst
index from 4 October 2002 to 13 October 2002. There was a coronal hole a few days earlier near the diskcenter at 2200 UT in the 5 October 2002 EIT image (not shown).
A01103 XIE ET AL.: LLGMS AND CMES
11 of 17
A01103

Figure 7. Histograms of durations for the six groups of LLGMS events. These six groups are (a) allmultiple CME cases; (b) all single CME cases; (c) all CIR cases with no related CME; (d) multiple CMEcases with >3 CMEs; (e) all cases with HSS involved; (f) cases with no HSS and � 2 CMEs.
A01103 XIE ET AL.: LLGMS AND CMES
12 of 17
A01103

Figure 8. Histograms of Dst minimums (absolute value) for the six groups of LLGMS events. These sixgroups are (a) all multiple CME cases; (b) all single CME cases; (c) all CIR cases with no related CME;(d) Multiple CME cases with > 3 CMEs; (e) all cases with HSS involved; (f) cases with no CMEinteraction.
A01103 XIE ET AL.: LLGMS AND CMES
13 of 17
A01103

V is the solar wind flow speed, VBs is the solar wind dawn-dusk electric field, the proportional constant a is �4.4 nT/h(mV/m)�1 and the electric field threshold Ec is 0.49 mV/m.The pressure-corrected index Dst* = Dst � b
ffiffiffip
p+ c, from
which the contribution of the magnetopause current to Dsthas been removed, p is the solar wind dynamic pressure, b isa constant of proportionality, and c is a constant represent-ing the changes of both the quiet time magnetopause and thering currents, and t is the decay time of the ring current,associated with loss processes in the inner magnetosphere.O’Brien and McPherron’s improved model has alsoconsidered the influence of VBs on t as follows: t = 2.40exp [(9.74/4.69 + VBs)] with VBs in mV/m. More recently,Wang et al. [2003] suggested that the O’Brien andMcPherron’s model can be further improved by Q =a(VBs � Ec)(p/p0)
g, where the index g and the constant p0are optimized by minimizing the root-mean-square (RMS)errors.[22] The empirical Dst model combined with the statisti-
cally derived decay time have had remarkable success inpredicting the strength of geomagnetic storms (see reviewby Gonzalez et al. [1994]). However, Burton’s formula andits variations [e.g., O’Brien and McPherron, 2000; Wang etal., 2003] depend only on the solar wind coupling value VBs
and does not take into account any preexisting condition inthe magnetosphere, so they might not be applicable for themultistep Dst development of LLGMS events when pre-conditioning occurs due to the presence of successivestorms. In order to investigate whether Burton’s formula
and its variations are applicable for the Dst development ofLLGMS, we studied the relationship between Bs, VBs, andDstmin. We divided the LLGMS events as individual ringcurrent intensifications, i.e., individual Dst dips in the mainand recovery phases. We identify the Dst dips according tothe following conditions: (1) Dstmin must be less than�50 nT; (2) two consecutive dips must be separated bymore than 3 hours; (3) the magnitude of the decrease ofDstmin in a dip must be less than �30 nT or Dstmin remainsthe same level (see Figure 3a as an example) for more than 6hours. We use the first criterion to exclude weak storms,which are mostly caused by HSS events. The secondcriterion excludes cases in which apparent decreases inDst were caused by substorm effects such as the so-calledcurrent wedge, not a true increase in the storm time ringcurrent [Kamide et al., 1998]. The third criterion isemployed to help distinguish a well-defined dip.[23] Figure 10 shows the relationship between Dstmin, Bs,
and VBs. From top to bottom, this figure shows the resultsfor: all Dst dips, Dst dips in the main phase, and Dst dips inthe recovery phase, respectively. As expected, in general,Dstmin is well correlated with Bs (r = 0.79) and VBs (r =0.80). In the main phase, Dstmin has a better correlation withboth Bs (r = 0.79) and VBs (r = 0.84). In the recovery phase,however, the correlation relation between Dstmin, Bs, andVBs is relatively poor, with coefficients of 0.59 and 0.60,respectively. The results imply that in the main phase thepreconditioning of previous storms may not play a signif-icant role in the multiple development of Dst since each Dstdip acts as a separately existing storm in this stage.However, in the recovery phase the effect of precondition-ing on the Dst development cannot be ignored. This is dueto the fact that in the recovery phase the Dst recovery andDst decay (of later consecutive storms after Dst negativepeak) occurs at the same time in the LLGMS events. Afterthe maximum intensification of the ring current, the cumu-lative effects of prior storms on plasma sheet characteristicswill change the response of the magnetosphere to solar winddrivers, as proposed by Kozyra et al. [1998, 2002].
5. Summary and Discussion
[24] We investigated 37 LLGMS events from 1998 to2002. We find three causes of LLGMS events: (1) multipleCMEs (64.9%, 24 of 37); (2) single CME (21.6%, 7 of 37);(3) HSS in CIRs (13.5%, 5 of 37). The first two causes ofLLGMS events involved possible HSS events, causingcomplex interaction regions in the interplanetary medium.In the multiple CME cases, the associated IP driver is amerged interaction region involving IP shock, complexejecta, and HSS. The LLGMS events involving multipleCME have medium long duration and high intensity due tosuccessive CMEs and various interactions. The single CMEcases generally involve a fast halo CME associated with avery strong interplanetary shock, which produces superintensity (>�280 nT) storm. In the CIR cases, the LLGMSevents have modest intensity (�100 nT) but the longestduration due to extended periods of the highly fluctuating Bs
within HSS.[25] If an LLGMS is associated with interacting CMEs,
there is a good correlation between the number of CMEsinvolved in an LLGMS and the LLGMS duration with
Figure 9. Relationships and correlation coefficients for(a) LLGMS duration and the number of associated CMEs(nc); (b) LLGMS intensity and the degree of interaction (ni).
A01103 XIE ET AL.: LLGMS AND CMES
14 of 17
A01103

Figure 10. Relationships of Dstmin with Bs and VBs. From top to bottom, panels are the results for alldips in LLGME events, dips in main phases, and dips in recovery phases, respectively.
A01103 XIE ET AL.: LLGMS AND CMES
15 of 17
A01103

correlation coefficient r = 0.78. Interaction between succes-sive CMEs plays an important role in enhancing theintensity of the LLGMS events. The intensity of LLGMSis well correlated with the degree of interaction (i.e., thenumber of CMEs interacting with HSS or with themselvesin the associated interaction region) with r = 0.67. Of the37 LLGMS events we studied, there were 20 (54.1%)events involving possible CME interaction. The largestLLGMS during 1998–2002 is the 31 March 2001 eventwith Dstmin � �387 nT, which was involved four succes-sive CMEs interacting with one another. Note that there arecases of interacting CMEs which do not trigger LLGMSdue to unfavorable northward IMF conditions. Our analysisdoes not include these cases because we are interested in thesolar origin of the existing LLGMS.[26] As we expected, there is a good correlation between
Dstmin, Bs, and VBs. The correlation of Dstmin with Bs for allthe dips in LLGMS events is 0.77 and for the dips in themain phases it is 0.79. The correlation of Dstmin with VBs isslightly better than with Bs with r = 0.80 and 0.84,respectively, for all dips and main phase dips. However,in the recovery phases, the correlation relation is relativelypoor, with coefficients of 0.59 and 0.60 between Dstmin andBs, VBs, respectively.[27] Our results suggest that the preconditioning may
have little effect on multiple Dst development in the mainphase of LLGMS, while it does affect the recovery phase.The reason is that the recovery phase involves both the ringcurrent decay of prior storms and intensification of laterstorms in an LLGMS event. After the Dst negative peak, thecumulative effects of prior storms on plasma sheet charac-teristics will alter the response of the magnetosphere tosubsequent solar wind drivers, as suggested by Kozyra et al.[1998, 2002]. However, how the plasma sheet responds tothe solar wind driver and how it is affected by the preexist-ing storms are still not well understood. Further detailedinvestigation on the preconditioning is needed.
[28] Acknowledgments. The authors would like to thank the supportof ACE/SWICS, ACE/SWEPAM, WIND/MFI teams, and NSSDC centerfor processing data. This work was supported by NASA LWS and NSFSHINE (ATM 0204558) program. AL thanks UNAM grant PAPIITIN119402 for partial support.[29] Shadia Rifai Habbal thanks Tamitha L. Mulligan and another
referee for their assistance in evaluating this paper.
ReferencesBrueckner, G. E., J. P. Delaboudiniere, R. A. Howard, S. E. Paswaters, O. C.St. Cyr, R. Schwenn, P. L. Lamy, G. M. Simnett, B. Thompson, andD. Wang (1998), Geomagnetic storms caused by coronal mass ejections(CMEs): March 1996 through June 1997, Geophys. Res. Lett., 25, 3019.
Burlaga, L. F. (1995), Interplanetary Magnetohydrodynamics, Oxford Univ.Press, New York.
Burlaga, L. F., K. W. Behannon, and L. W. Klein (1987), Compoundstreams, magnetic clouds, and major geomagnetic storms, J. Geophys.Res., 92, 5725.
Burlaga, L. F., et al. (2001), Fast ejecta during the ascending phase of solarcycle 23: ACE observations, J. Geophys. Res., 106, 20,957.
Burlaga, L. F., S. P. Plunkett, and O. C. St. Cyr (2002), Compound streams,successive CMEs and complex ejecta, J. Geophys. Res., 107(A10), 1266,doi:10.1029/2001JA000255.
Burlaga, L., D.Berdichevsky,N.Gopalswamy,R. Lepping, andT. Zurbuchen(2003), Merged interaction regions at 1 AU, J. Geophys. Res., 108(A12),1425, doi:10.1029/2003JA010088.
Burton, R. K., R. L. McPherron, and C. T. Russell (1975), An empiricalrelationship between interplanetary conditions and Dst, J. Geophys. Res.,80, 4204.
Cane, H. V., and I. G. Richardson (1997), What caused the large geomag-netic storm of November 1978?, J. Geophys. Res., 120, 17,445.
Cane, H. V., and I. G. Richardon (2003), Interplanetary coronal mass ejec-tions in the near-Earth solar wind during 1996–2002, J. Geophys. Res.,108(A4), 1156, doi:10.1029/2002JA009817.
Cane, H. V., I. G. Richardson, and O. C. St. Cyr (2000), Coronal massejections, interplanetary ejecta and geomagnetic storms, Geophys. Res.Lett., 27, 3591.
Chen, M. W., L. R. Lyons, and M. Schulz (2000), Stormtime ring-currentformation: A comparison between single-and double-dip model stormswith similar transport characteristics, J. Geophys. Res., 106, 27,755.
Clua de Gonzalez, A. L., and W. D. Gonzalez (1998), Analytical study ofthe energy rate balance equation for the magnetospheric storm-ring cur-rent, Ann. Geophys., 16, 1445.
Crooker, N. U., J. T. Gosling, and S. W. Kahler (1998), Magnetic clouds atsector boundaries, J. Geophys. Res., 103, 301.
Daglis, I. A. (1997), The role of magnetosphere-ionosphere coupling inmagnetic storm dynamics, in Magnetic Storms, Geophys. Monogr. Ser.,vol. 98, edited by B. T. Tsurutani et al., pp. 107, AGU, Washington, D. C.
Dasso, S., D. Gomez, and C. H. Mandrini (2002), Ring current decay ratesof magnetic storms: a statistical study for 1957 to 1998, J. Geophys. Res.,107(A5), 1059, doi:10.1029/2000JA000430.
Fenimore, E. E. (1980), Solar wind flows associated with hot heavy ions,Astrophys. J., 235, 245.
Fenrich, F. R., and J. G. Luhmann (1998), Geomagnetic response to mag-netic clouds of different polarity, Geophys. Res. Lett., 25, 2999.
Gloeckler, G., et al. (1999), Unusual composition of the solar wind in the2–3 May 1998 CME observed with SWICS on ACE, Geophys. Res.Lett., 26, 157.
Gonzalez, W. D., J. A. Joselyn, Y. Kamide, H. W. Kroehl, G. Rostoker, B. T.Tsurutani, and V. M. Vasyliunas (1994), What is a geomagnetic storm?,J. Geophys. Res., 99, 5771.
Gonzalez, W. D., A. L. Clua de Gonzalez, J. H. A. Sobral, A. Dal Lago, andL. E. Vieira (2001), Solar and interplanetary causes of very intense geo-magnetic storms, J. Atmos. Terr. Phys., 63, 403.
Gopalswamy, N. (2002), Relation between coronal mass ejections and theirinterplanetary counterparts, in Solar-Terrestrial Magnetic Activity andSpace Environment, COSPAR Colloq. Ser., vol. 14, edited by H. Wangand R. Xu, p. 157, Springer, New York.
Gopalswamy, N., A. Lara, R. P. Lepping, M. L. Kaiser, D. Berdichevsky,and O. C. St. Cyr (2000), Interplanetary acceleration of coronal massejections, Geophys. Res. Lett., 27, 145.
Gopalswamy, N., A. Lara, S. Yashiro, M. L. Kaiser, and R. A. Howard(2001), Predicting the 1-AU arrival times of coronal mass ejections,J. Geophys. Res., 106, 29,207.
Gopalswamy, N., S. Yashiro, G. Michalek, H. Xie, R. P. Lepping, and R. A.Howard (2005), Solar source of the largest geomagnetic storm of cycle23, Geophys. Res. Lett., 32, L12S09, doi:10.1029/2004GL021639.
Grande, M., C. H. Perry, J. B. Blake, M. W. Chen, J. F. Fennell, andB. Wilken (1996), Observations of iron, silicon, and other heavy ionsin the geostationary altitude region during late March 1991, J. Geophys.Res., 101, 24,707.
Hamilton, D. C., G. Gloeckler, F. M. Ipavich, B.Wilken, andW. Stuedemann(1988), Ring current development during the great geomagnetic storm ofFebruary 1986, J. Geophys. Res., 93, 14,343.
Henke, T., et al. (1998), Differences in the O7/O6 ratio in magnetic cloudand non-cloud coronal mass ejections, Geophys. Res. Lett., 25, 3465.
Kamide, Y., N. Yokoyama, W. Gonzalez, B. T. Tsurutani, I. A. Daglis,A. Brekke, and S. Masuda (1998), Two-step development of geomagneticstorms, J. Geophys. Res., 103, 6917.
Kozyra, J. U., J. E. Borovsky, M. W. Chen, M.-C. Fok, and V. K. Jordanova(1998), Plasma sheet preconditioning, enhanced convection and ring cur-rent development, in Substorms-4, edited by S. Kokubun and Y. Kamide,pp. 755–760, Terra Sci., Tokyo.
Kozyra, J. U., M. W. Liemohn, C. R. Clauer, A. J. Ridley, M. F. Thomsen,J. E. Borovsky, J. L. Roeder, V. K. Jordanova, and W. D. Gonzalez(2002), Multistep Dst development and ring current compositionchanges during the 4–6 June 1991 magnetic storm, J. Geophys. Res.,107(A8), 1224, doi:10.1029/2001JA000023.
Lepping, R. P., D. B. Berdichevsky, C.-C. Wu, A. Szabo, T. Narock,F. Mariani, A. J. Lazarus, and A. J. Quivers (2005), A summary of WINDmagnetic clouds for the years 1995–2003: Model-fitted parameters,associated errors, and classifications, Ann. Geophys., in press.
Lepri, S. T., T. H. Zurbuchen, L. A. Fisk, I. G. Richardson, H. V. Cane, andG. Gloeckler (2001), Fe charge distributions as an identifier of interpla-netary coronal mass ejections, J. Geophys. Res., 106, 29,231.
Manoharan, P. K., N. Gopalswamy, S. Yashiro, A. Lara, G. Michalek, andR. A. Howard (2004), Influence of coronal mass ejection interaction onpropagation of interplanetary shocks, J. Geophys. Res., 109, A06109,doi:10.1029/2003JA010300.
A01103 XIE ET AL.: LLGMS AND CMES
16 of 17
A01103

O’Brien, T. P., and R. L. McPherron (2000), An empirical phase spaceanalysis of ring current dynamics: Solar wind control of injection anddecay, J. Geophys. Res., 105, 7707.
Tsurutani, B. T., and W. D. Gonzalez (1997), The interplanetary causes ofmagnetic storms, in Magnetic Storms, Geophys. Monogr. Ser., vol. 98,edited by B. T. Tsurutani et al., p. 77, AGU, Washington, D. C.
Wang, C. B., J. K. Chao, and C.-H. Lin (2003), Influence of the solar winddynamic pressure on the decay and injection of the ring current, J. Geo-phys. Res., 108(A9), 1341, doi:10.1029/2003JA009851.
Wang, Y. M., P. Z. Ye, S. Wang, G. P. Zhou, and J. X. Wang (2002),Statistical study on the geoeffectiveness of Earth-directed coronal massejections from March 1997 to December 2000, J. Geophys. Res.,107(A11), 1340, doi:10.1029/2002JA009244.
Webb, D. F., E. W. Cliver, N. U. Crooker, O. C. St. Cry, and B. J. Thompson(2000), Relationship of halo coronal mass ejections, magnetic clouds, andmagnetic storms, J. Geophys. Res., 105, 7491.
Xie, H., L. Ofman, and G. Lawrence (2004), Cone model for halo CMEs:Application to space weather forecasting, J. Geophys. Res., 109, A03109,doi:10.1029/2003JA010226.
Yashiro, S., N. Gopalswamy, G. Michalek, O. C. St.Cyr, S. P. Plunkett,N. B. Rich, and R. A. Howard (2004), A catalog of white light coronal
mass ejections observed by the SOHO spacecraft, J. Geophys. Res., 109,A07105, doi:10.1029/2003JA010282.
Zhang, X., et al. (2003), Identification of solar sources of major geomag-netic storms between 1996 and 2000, Astrophys. J., 582, 520.
�����������������������N. Gopalswamy, NASA Goddard Space Center, Code 695, Greenbelt,
MD 20771, USA.A. Lara, Instituto de Geofisica, National Autonomous University of
Mexico, D.F. 04510 Mexico City, Mexico.S. Lepri, Atmospheric, Oceanic, and Space Sciences, University of
Michigan, 2455 Hayward Street, Ann Arbor, MI 48109, USA.P. K. Manoharan, National Center for Radio Astronomy, Tata Institute of
Fundamental Research, P. O. Box B, Udhagamandalam, Ooty 843 001,Tamilnadu, India.H. Xie and S. Yashiro, Physics Department, Catholic University of
America, 200 Hannan Hall, 640 Michigan Avenue NE, Washington, DC20064, USA. ([email protected])
A01103 XIE ET AL.: LLGMS AND CMES
17 of 17
A01103