Unexpected enhancement of ozone exposure and health risks ...

Long-Term Ozone Exposure Increases the Risk of Developing the Acute
Respiratory Distress Syndrome
Lorraine B. Ware,1,2 Zhiguo Zhao,3 Tatsuki Koyama,3 Addison K. May4, Michael A. Matthay,5,6 Fred W. Lurmann,7 John R. Balmes,5,8 Carolyn S. Calfee5,6
1. Department of Medicine, Vanderbilt University School of Medicine, Nashville,
TN 2. Department of Pathology, Microbiology and Immunology, Vanderbilt
University School of Medicine, Nashville, TN 3. Department of Biostatistics, Vanderbilt University, Nashville, TN 4. Division of Trauma and Surgical Critical Care, Vanderbilt University, Nashville,
TN 5. Department of Medicine, University of California, San Francisco, CA 6. Department of Anesthesia and Cardiovascular Research Institute, University of
California, San Francisco, CA 7. Sonoma Technology Inc., Petaluma, CA 8. Division of Environmental Health Sciences, School of Public Health, University
of California, Berkeley
Corresponding Author: Lorraine B. Ware M.D. Allergy, Pulmonary and Critical Care Medicine Vanderbilt University School of Medicine T1218 MCN, 1161 21st Avenue S. Nashville, TN 37232-2650 Phone 615 322 3412 Fax 615 343 8780 Email [email protected] Author Contributions: All authors made substantial contributions to the design of the study and data acquisition and interpretation. ZZ and TK were primarily responsible for the data analysis. LBW drafted the manuscript and all authors critically revised it. All authors provided final approval for the version submitted for publication and are accountable for all aspects of the work. Supported by: NIH P30 ES000267 (LBW), HL110969 (CSC), HL51856 (MAM) Running Title: Ozone and Risk of ARDS Descriptor: 4.2 ALI/ARDS: Diagnosis & Clinical Issues Word Count: 2803
Page 1 of 50 AJRCCM Articles in Press. Published on 17-December-2015 as 10.1164/rccm.201507-1418OC
Copyright © 2015 by the American Thoracic Society
At a Glance Commentary
Scientific Knowledge on the Subject. Ozone induces lung inflammation and oxidative
stress in humans and experimental models. In population-based studies, ozone exposure
has been implicated in hospital admissions and mortality related to heart and lung disease.
Recent evidence suggests that environmental exposures such as tobacco smoke and
alcohol abuse may enhance the risk of developing ARDS, but the effect of exposure to
ambient levels of environmental pollutants such as ozone on risk of ARDS has not been
investigated.
What this Study Adds to the Field. We found that long-term ozone exposure, even at
relatively low levels, is associated with development of ARDS in at-risk critically ill
patients. These findings suggest that ozone exposure, like other environmental exposures
such as alcohol and tobacco, may represent an important and previously unrecognized
risk factor for development of ARDS.
This article has an online data supplement, which is accessible from this issue's table of
contents online at www.atsjournals.org
Page 2 of 50 AJRCCM Articles in Press. Published on 17-December-2015 as 10.1164/rccm.201507-1418OC
Copyright © 2015 by the American Thoracic Society

1
ABSTRACT
Rationale: The contribution of air pollution to the risk of ARDS is unknown.
Methods: We studied 1558 critically ill patients enrolled in a prospective observational
study at a tertiary medical center who lived <50 km from an air quality monitor and had
an ARDS risk factor. Pollutant exposures (ozone, NO2, SO2, PM2.5, PM10) were assessed
by weighted average of daily levels from the closest monitors for the prior 3 years.
Associations between pollutant exposure and ARDS risk were evaluated by logistic
regression controlling for age, race, sex, smoking, alcohol, insurance status, rural vs.
urban residence, distance to study hospital and APACHEII.
Main Results: The incidence of ARDS increased with increasing ozone exposure: 28% in
the lowest exposure quartile vs. 32%, 40% and 42% in the 2nd, 3rd and 4th quartiles,
P<0.001. In a logistic regression model controlling for potential confounders, ozone
exposure was associated with risk of ARDS in the entire cohort (OR 1.58 [95% CI 1.27,
1.96]) and more strongly associated in the subgroup with trauma as their ARDS risk
factor (OR 2.26 [1.46, 3.50]). There was a strong interaction between ozone exposure and
current smoking status (p = 0.007). NO2 exposure was also associated with ARDS but not
independently of ozone exposure. SO2, PM2.5, and PM10 were not associated with ARDS.
Conclusions: Long-term ozone exposure is associated with development of ARDS in at-
risk critically ill patients, particularly in trauma patients and current smokers. Ozone
exposure may represent a previously unrecognized environmental risk factor for ARDS.
Abstract Word Count: 247
Key Words: air pollution, ozone, acute lung injury, pulmonary edema
Page 3 of 50 AJRCCM Articles in Press. Published on 17-December-2015 as 10.1164/rccm.201507-1418OC
Copyright © 2015 by the American Thoracic Society
2
INTRODUCTION
The Acute Respiratory Distress Syndrome (ARDS) is a common syndrome of acute lung
inflammation, non-cardiogenic pulmonary edema and acute respiratory failure (1). With a
U.S. incidence of 190,000 cases per year and mortality of 30–40% (2), ARDS is an
important and costly public health problem. The most common clinical risk factors for
ARDS are sepsis, pneumonia, severe trauma, aspiration of gastric contents, and multiple
transfusions (3). However, ARDS develops in only a subset of patients with these risk
factors. The mechanisms that predispose to ARDS in some, but not all, at-risk patients
are not understood.
Recent evidence suggests that environmental exposures such as tobacco smoke (4-6) and
alcohol abuse (7) may enhance the risk of developing ARDS, but the effect of exposure
to ambient levels of environmental pollutants on risk of ARDS has not been investigated.
We hypothesized that long-term exposure to high levels of ambient pollutants primes the
lung to develop ARDS in the setting of another clinical risk factor. To test this hypothesis,
we analyzed the association between ARDS and long-term exposure to air pollutants
including ozone, NO2, particulate matter (PM)2.5, PM10, and SO2 in a large cohort of
critically ill patients at risk for ARDS.
Some of the results of these studies have been previously reported in the form of an
abstract (8).
METHODS
A complete description of methods is in the online supplement.
Page 4 of 50 AJRCCM Articles in Press. Published on 17-December-2015 as 10.1164/rccm.201507-1418OC
Copyright © 2015 by the American Thoracic Society

3
Patients. We studied patients from Validating Acute Lung Injury biomarkers for
Diagnosis, a prospective observational cohort of critically ill medical, surgical and
trauma patients admitted to Vanderbilt University Medical Center (VUMC) (9-12).
Subjects enrolled 2006-2012 were included if a residential address was available, they
lived within 50 km of at least one U.S. Environmental Protection Agency (EPA)-
approved air quality monitor and had an ARDS risk factor.
Clinical Data. Clinical data included demographics, insurance status, current smoking,
alcohol use, medical history, medications, APACHE II (13), hemodynamics, ventilator
settings, laboratory values and outcomes. Patients were coded as metro or non-metro
dwellers using USDA 2003 and 2013 Rural-Urban Continuum Codes. Patients were
phenotyped at enrollment and on subsequent 3 days for sepsis (14), organ dysfunction
(15) and ARDS. Patients were classified as having ARDS if they met American European
Consensus Conference (16) criteria for acute lung injury (ALI) or ARDS on two or more
consecutive days and as having no ARDS if they did not meet criteria on any day.
Patients meeting criteria on a single or on two non-consecutive days were deemed
“indeterminate” ARDS status and were included only in a sensitivity analysis.
Air pollutant exposure estimates. Daily measurements of ozone, NO2, SO2, PM2.5, and
PM10 were obtained from the EPA’s Aerometric Information Retrieval System. The 24-
hour average was computed for each pollutant except for ozone. Because ozone levels
are typically elevated only during daylight hours, the highest 8-hour average was used.
Since ozone levels are monitored only in warmer months in Tennessee, ozone data were
restricted to April through September.
Page 5 of 50 AJRCCM Articles in Press. Published on 17-December-2015 as 10.1164/rccm.201507-1418OC
Copyright © 2015 by the American Thoracic Society
4
Patient addresses were geocoded and distances to all monitors calculated (Haversine
formula). Daily pollutant exposures were estimated by the inverse-distance-squared
weighted average of daily levels from monitors within 50km (17). Long-term exposures
were estimated using average pollutant levels for the 1-, 3-, and 5-year periods prior to
ICU admission and short-term exposures using levels for the prior 3 days and 6 weeks.
Findings for 1-, 3- and 5-year ozone exposures were similar; 3-year data are presented.
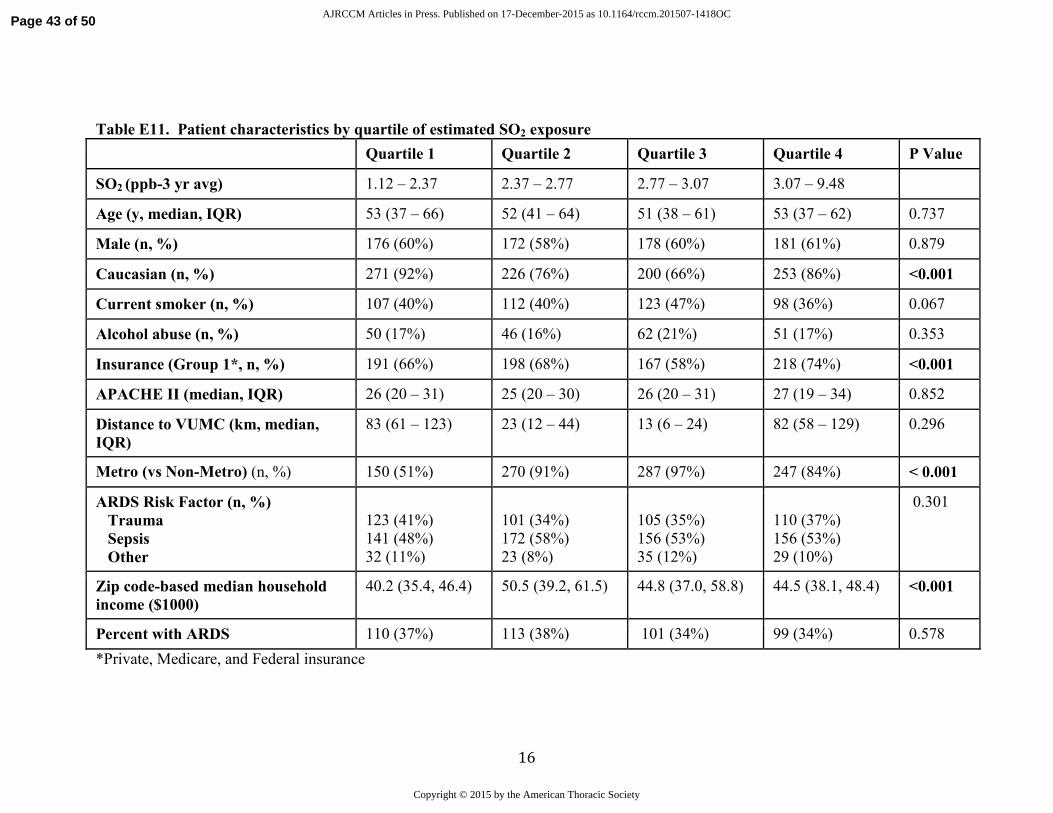
Because no significant associations between long-term exposures to SO2, PM2.5 and PM10
and risk of ARDS were observed, these are presented in the Supplement. As there were
no associations between any short-term air pollutant exposure and ARDS, these data are
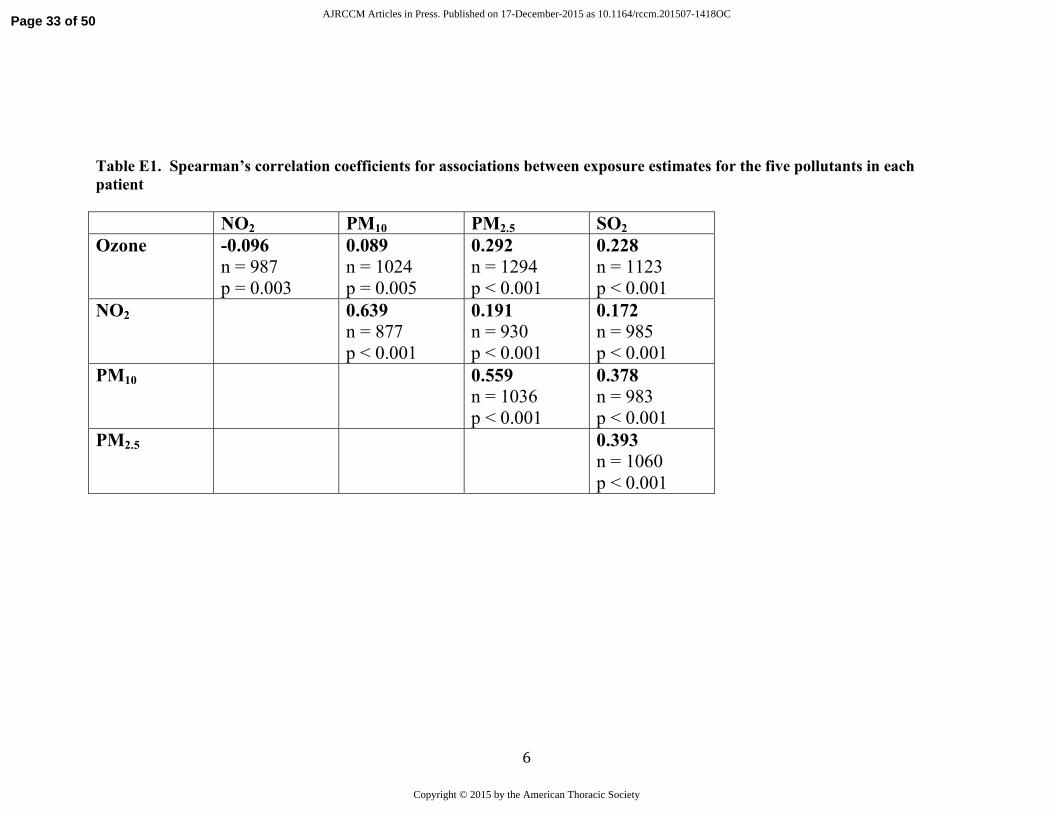
not shown. For reference, correlations between pollutant levels are shown in
Supplementary Table E1.
Statistical Analysis. Demographic and clinical data were compared between ARDS and
non-ARDS patients using Pearson’s chi-squared tests and Wilcoxon rank-sum tests
Missing values of regression covariates were multiply imputed with predictive mean
matching (18) to avoid case-wise deletion of patient records. We fit logistic regression
models to examine the relationship between ARDS and pollutant levels controlling for
pre-specified confounders including age, race, sex, enrollment month (to control for
season), current smoking, alcohol use, insurance status (as a proxy for socioeconomic
status), median household income, metro vs. non-metro residence, distance to VUMC,
APACHE-II, injury severity score (ISS, trauma subset only) and blunt vs. penetrating
trauma. A restricted cubic spline with 3 knots was used for age, month, and APACHE-II
to permit nonlinear associations. Data analyses were performed using R Version 3 (R
Core Team).
Page 6 of 50 AJRCCM Articles in Press. Published on 17-December-2015 as 10.1164/rccm.201507-1418OC
Copyright © 2015 by the American Thoracic Society

5
RESULTS
Patients. Differences between patients who were eligible for inclusion in the study
compared to those who were not eligible related to the requirement for living within
50km of an air pollution monitor, leading to more non-metro dwellers and a farther
distance to Vanderbilt among excluded patients (Supplemental Table E2). There were
1558 patients who met the inclusion criteria for the ozone analysis and 1257 who met the
inclusion criteria for the NO2 analysis (Figure 1). There were 1350, 1355, and 1130
patients available for the SO2, PM2.5, and PM10 analyses, respectively; levels of the
individual air pollutants were only moderately correlated (Table E1 in the Online
Supplement).
Patient characteristics for the ozone analysis are in Table E3 in the Online Supplement.
Of the 1558 patients, 563 met criteria for ARDS. Patients with ARDS were older, were
more likely to have sepsis as their ARDS risk factor and had a higher severity of illness
compared to patients who did not develop ARDS.
Ozone exposure and ARDS. The geographic distribution of the ozone monitors that were
included in the study is shown in Figure 2. The median distance from a patient’s
residence to the nearest air quality monitor was 19 km. Three-year average ozone
exposure levels were lower than current EPA standards (19) (median 51.5 ppb, range
41.5 to 58.2). Despite these low levels of exposure, the incidence of ARDS increased
significantly with increasing long-term ozone exposure (Table 1 and Figure 3A). In a
logistic regression model that controlled for potential confounders, long-term ozone
Page 7 of 50 AJRCCM Articles in Press. Published on 17-December-2015 as 10.1164/rccm.201507-1418OC
Copyright © 2015 by the American Thoracic Society

6
exposure was independently associated with risk of ARDS (Table 2 and Figure 4A).
The findings were not different if 24-hour average levels of ozone were utilized rather
than the highest daily 8-hour average (Table E4 in the Online Supplement)
The association between ARDS and ozone exposure was strongest in the subgroup of
patients (n = 552) with trauma as their ARDS risk factor (Figure 3B). In a logistic
regression model that controlled for potential confounders, long-term ozone exposure
was independently associated with risk of ARDS in trauma patients (Table E5 in the
Online Supplement). The interaction between trauma and ozone exposure was
statistically significant (P=0.039).
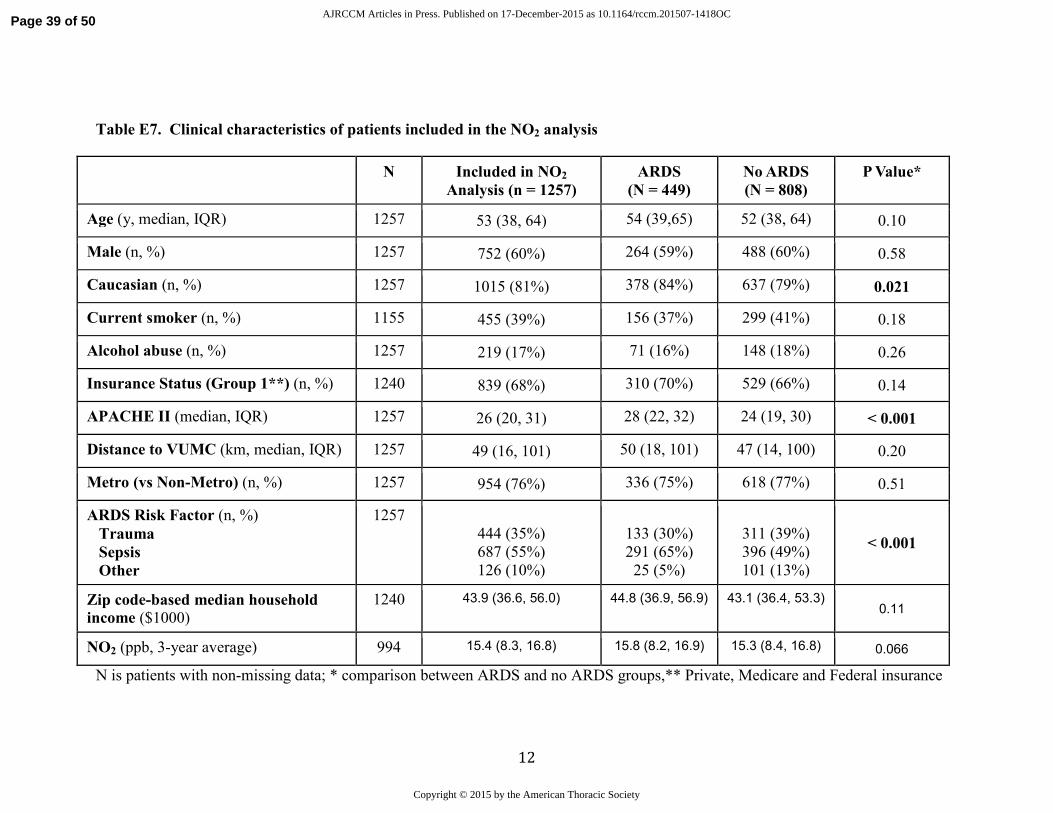
NO2 exposure and ARDS. Patient characteristics for the NO2 analysis are in Table E6 in
the Online Supplement. NO2 exposure levels were relatively low (median 15.4 ppb,
range 1.7 to 17.7). Although overall rates of ARDS across quartiles of NO2 exposure
were not significantly different in an unadjusted analysis (Table E7 in the Online
Supplement), NO2 exposure was associated with risk of ARDS in a logistic regression
model that controlled for potential confounders (Table E8 in the Online Supplement). As
with ozone, the effect was strongest in trauma patients (n = 419, OR per 5 ppb increase
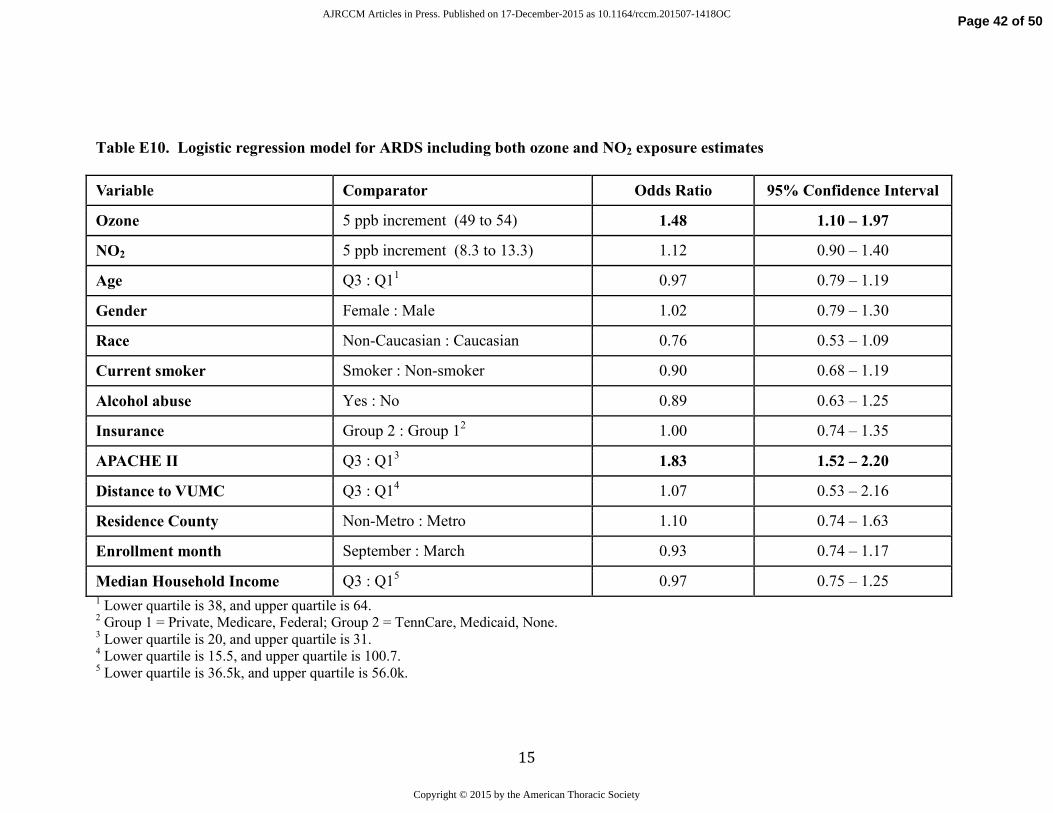
1.92 [95% CI 1.25, 2.94]). When 3-year ozone and NO2 exposure were included in the
same model, only ozone exposure remained significantly associated with ARDS (Table
E9 in the Online Supplement).
Interaction with smoking and alcohol. Since exposure of the lung to cigarette smoke
could be synergistic with ozone for increasing the risk of ARDS, we tested for an
interaction between current smoking and ozone exposure. The interaction term was
Page 8 of 50 AJRCCM Articles in Press. Published on 17-December-2015 as 10.1164/rccm.201507-1418OC
Copyright © 2015 by the American Thoracic Society
7
highly significant (p = 0.007). Ozone was significantly associated with ARDS only in
current smokers and not in non-smokers (Figure 4B). There was no association between
alcohol and ARDS in this study and no interaction between alcohol and ozone (p-value
for interaction: 0.60) or any other pollutant.
Sensitivity analyses. To determine if accuracy of exposure estimates affected the findings,
we restricted analysis to patients living within 15 km of a monitor. None of the analyses
were substantively changed (not shown). In a second sensitivity analysis, we included
the 80 patients with “indeterminate” ARDS status as controls. Ozone exposure was still
associated with ARDS (OR 1.56, 95% CI 1.25, 1.94) especially in trauma patients (OR
2.27, 95% CI 1.46, 3.51). The interaction of ozone exposure with smoking was
unchanged (p < 0.001).
DISCUSSION
In critically ill patients at risk for ARDS, long-term exposure estimates for ozone based
on residential address were associated with development of ARDS. Importantly, this
association was independent of other known risk factors for ARDS such as age and
severity of illness. In addition, this association persisted after adjustment for potential
confounders including metro versus non-metro dwelling, source of insurance and median
household income as indicators of socioeconomic status, and distance of residence from
the study hospital, which was included to control for possible unmeasured differences in
severity of illness that could lead to transfer to VUMC of sicker patients from remote
hospitals with different levels of pollutant exposure. We also found an association of
long-term exposure to NO2 and risk of ARDS; however, in two pollutant models with
Page 9 of 50 AJRCCM Articles in Press. Published on 17-December-2015 as 10.1164/rccm.201507-1418OC
Copyright © 2015 by the American Thoracic Society

8
ozone and NO2, only ozone remained significant. There was no association between
exposure estimates for other pollutants (SO2, PM2.5 and PM10) and ARDS. To our
knowledge, this is the first report of an association between ambient air pollution and risk
of ARDS. Furthermore, the observed association occurred at relatively low levels of
exposure that fall within current EPA standards, suggesting that these observations, if
reproduced, could be relevant even in areas with low levels of ambient ozone. Based on
these findings, long-term exposure to ozone could represent a previously unrecognized
risk factor for development of ARDS.
Although ozone exposure has not previously been associated with ARDS, both acute and
chronic ozone exposure have been associated with respiratory disease in experimental
and clinical studies. Acute ozone exposure induces acute lung injury in animals, primarily
by producing an oxidant-mediated injury to the lung epithelium that leads to increased
permeability and lung inflammation (20). Controlled short-term exposure to ozone (at
doses that are much higher than ambient pollutant levels) in humans also causes airway
inflammation and oxidant injury (21-23). In epidemiologic studies, acute exposure to
high ozone levels has been associated with asthma exacerbations (24). Both ozone and
NO2 exposure over the preceding 6 weeks were associated with acute exacerbation of
idiopathic pulmonary fibrosis (25), a syndrome that shares pathologic features with
ARDS. Chronic ozone exposure has been associated with decreased lung growth in
children (26, 27) and decreased small airways function in young adults (28). In a study of
over 400,000 subjects, chronic ozone exposure was associated with mortality from
respiratory causes (29); data on ARDS as a cause of respiratory mortality were not
available in that study.
Page 10 of 50 AJRCCM Articles in Press. Published on 17-December-2015 as 10.1164/rccm.201507-1418OC
Copyright © 2015 by the American Thoracic Society

9
In the current study, the association between ARDS and ozone exposure was strongest in
patients at risk for ARDS from severe trauma. Since it is well established that trauma-
associated ARDS is clinically and pathophysiologically different from ARDS from other
causes (30), ambient ozone exposure may uniquely prime the lung to develop ARDS in
the setting of severe trauma. The higher rate of smoking in the trauma group (54%)
compared to the non-trauma group (34%, P < 0.0001) may have potentiated the effects of
ambient ozone exposure. Since the incidence of ARDS in the trauma group was lower
(32%) than in the non-trauma patients (40%), another potential explanation is that other
ARDS risk factors such as sepsis represent such a potent and overwhelming stimulus for
acute lung injury that the contribution of chronic ozone exposure to risk of ARDS is less
apparent. Finally, it is possible that patients who develop ARDS as a result of trauma
spend more time outdoors than patients with other ARDS risk factors leading to higher
exposure levels to ambient pollutants.
Smoking has only recently been recognized to be an independent risk factor for ARDS.
Prospective studies report a strong association between cigarette smoking and risk of
ARDS in severe trauma (4), non-pulmonary sepsis (6), lung transplant recipients (31) and
patients receiving blood transfusions (5). Indeed, given the low levels of ambient ozone
exposure in the VALID cohort, it is somewhat surprising that the effect of smoking on
development of ARDS does not overwhelm the signal from ozone exposure. Potential
mechanisms for potentiation of ARDS by smoking have considerable overlap with
mechanisms of ozone-induced lung injury (32). These include harmful effects on lung
epithelial and endothelial permeability and function (33, 34), pro-inflammatory effects
due to changes in neutrophil alveolar macrophage trafficking and function, and effects on
Page 11 of 50 AJRCCM Articles in Press. Published on 17-December-2015 as 10.1164/rccm.201507-1418OC
Copyright © 2015 by the American Thoracic Society

10
cell-mediated and humoral immunity (35, 36). Smoking and air pollutant exposure have
previously been shown to have synergistic effects on risk of obesity, pulmonary function
deficits and lung cancer (37-39). The strong interaction between smoking and ozone
exposure in the current study suggests that ozone exposure may also potentiate the
harmful effects of tobacco smoke on the lung with regard to ARDS risk. This
observation is important since both smoking and air pollution exposure are potentially
modifiable environmental risk factors for developing ARDS.
Although we found an association between long-term NO2 exposure and ARDS, this
association was not significant after controlling for ozone levels. There are several
potential explanations. First, since nitrogen oxides are the most prevalent ambient
reactant for ozone formation, the association between NO2 and risk of ARDS may only
be indicative of ozone exposure. Second, since nitrogen oxides are predominantly traffic-
related pollutants, exposure estimates based on regional monitors may not be accurate.
Studies that analyze distance to roadway might be better suited to determine the
relationship between NO2 or other traffic-related pollutants such as PM2.5 and PM10 and
development of ARDS. Finally, since there were fewer monitoring stations for NO2 than
for ozone, this analysis had less power.
This study has several strengths. First, we studied a large heterogeneous cohort of
critically ill medical, surgical, and trauma patients, enhancing the potential
generalizability of the findings. Second, the patients were rigorously phenotyped
prospectively for both ARDS risk factors and development of ARDS by physician
investigators. This is in sharp contrast to many epidemiologic studies that have relied on
inherently less reliable death certificate data or administrative coding for patient
Page 12 of 50 AJRCCM Articles in Press. Published on 17-December-2015 as 10.1164/rccm.201507-1418OC
Copyright © 2015 by the American Thoracic Society

11
phenotyping. Third, residential addresses and dates of admissions were used for exposure
estimates, allowing for individualized rather than population or neighborhood-based
exposure estimates. Finally, the extensive prospective data collection in the VALID study
allowed us to control for a large number of potential confounders, decreasing but not
eliminating the possibility of residual confounding.
This study has some limitations. First, patients were drawn from only one geographic
region, and air pollutant effects may differ by geographic region. Second, as in any study
that does not directly measure air pollutant levels, there is the possibility of exposure
misclassification. To mitigate the concern of exposure misclassification, a sensitivity
analysis included only patients who lived within 15 km of a monitor with similar results.
Exposure misclassification could also be caused by reliance on the address provided at
hospital admission; information about prior addresses during the exposure period was not
available. Exposure misclassification may also arise from exposures that occur away
from the residence including at the place of occupation. Number of hours spent outdoors
versus indoors could also affect total exposure and would not be captured in our estimates.
Third, the possibility of residual confounding and in particular residual spatial
confounding remains. We attempted to mitigate this concern by including socioeconomic
status (measured by insurance source and zip code-based median household income),
metro versus non-metro residence and distance to the study hospital in the regression
models. However, given the concern for potential unmeasured confounders, it will be
important to confirm these findings in geographically diverse patient groups with both
higher and lower levels of ozone exposure. Fourth, in this exploratory study, we did not
aim to strictly control the type I error rate. In order to minimize the likelihood of
Page 13 of 50 AJRCCM Articles in Press. Published on 17-December-2015 as 10.1164/rccm.201507-1418OC
Copyright © 2015 by the American Thoracic Society
12
identifying false positive associations, we pre-specified the variables and interaction
terms to include in the primary models prior to data examination. Subgroup analyses
such as trauma/non-trauma were also pre-specified. Although we did not adjust for
multiple comparisons, our primary finding of ozone-ARDS association has a p-value of
<0.001, which would be significant with post-hoc significance adjustment using a
conservative Bonferroni method. Finally, because this was an observational study,
causality cannot be inferred.
In summary, in a large group of rigorously phenotyped critically ill patients, we report an
association between long-term ozone exposure levels and risk of developing ARDS. This
risk was potentiated by cigarette smoking and was strongest in patients with severe
trauma as their ARDS risk factor. These findings indicate that ozone exposure may be a
previously unrecognized environmental risk factor for ARDS.
Page 14 of 50 AJRCCM Articles in Press. Published on 17-December-2015 as 10.1164/rccm.201507-1418OC
Copyright © 2015 by the American Thoracic Society

13
LITERATURE CITED
1. Matthay MA, Ware LB, Zimmerman GA. The acute respiratory distress syndrome. The
Journal of Clinical Investigation 2012; 122: 2731-2740.
2. Rubenfeld GD, Caldwell E, Peabody E, Weaver J, Martin DP, Neff M, Stern EJ,
Hudson LD. Incidence and outcomes of acute lung injury. N Engl J Med 2005;
353: 1685-1693.
3. Ware LB, Matthay MA. Medical progress: The acute respiratory distress syndrome. N
Engl J Med 2000; 342: 1334-1349.
4. Calfee CS, Matthay MA, Eisner MD, Benowitz N, Call M, Pittet JF, Cohen MJ. Active
and passive cigarette smoking and acute lung injury after severe blunt trauma. Am
J Respir Crit Care Med 2011; 183: 1660-1665.
5. Toy P, Gajic O, Bacchetti P, Looney MR, Gropper MA, Hubmayr R, Lowell CA,
Norris PJ, Murphy EL, Weiskopf RB, Wilson G, Koenigsberg M, Lee D, Schuller
R, Wu P, Grimes B, Gandhi MJ, Winters JL, Mair D, Hirschler N, Sanchez Rosen
R, Matthay MA. Transfusion-related acute lung injury: incidence and risk factors.
Blood 2012; 119: 1757-1767.
6. Calfee CS, Matthay MA, Benowitz N, Kangelaris KN, Siew ED, Janz DR, Bernard GR,
May AK, Jacob P, Havel C, Ware LB. Cigarette smoke exposure and the acute
respiratory distress syndrome. Critical care medicine 2015; in press.
7. Moss M, Parsons PE, Steinberg KP, Hudson LD, Guidot DM, Burnham EL, Eaton S,
Cotsonis GA. Chronic alcohol abuse is associated with an increased incidence of
acute respiratory distress syndrome and severity of multiple organ dysfunction in
patients with septic shock. Crit Care Med 2003; 31: 869-877.
Page 15 of 50 AJRCCM Articles in Press. Published on 17-December-2015 as 10.1164/rccm.201507-1418OC
Copyright © 2015 by the American Thoracic Society

14
8. Ware LB, Zhao Z, Koyama T, Matthay MA, Lurmann F, Balmes JR, Calfee CS, .
Long-Term Ozone Exposure Levels Are Associated with Development of Acute
Respiratory Distress Syndrome (ARDS) in Critically Ill Patients. Am J Respir Crit
Care Med 2015; 191: A2174.
9. Siew ED, Ikizler TA, Gebretsadik T, Shintani A, Wickersham N, Bossert F, Peterson
JF, Parikh CR, May AK, Ware LB. Elevated urinary IL-18 levels at the time of
ICU admission predict adverse clinical outcomes. Clinical journal of the
American Society of Nephrology : CJASN 2010; 5: 1497-1505.
10. Siew ED, Ware LB, Gebretsadik T, Shintani A, Moons KG, Wickersham N, Bossert
F, Ikizler TA. Urine neutrophil gelatinase-associated lipocalin moderately predicts
acute kidney injury in critically ill adults. Journal of the American Society of
Nephrology : JASN 2009; 20: 1823-1832.
11. Ware LB, Fessel JP, May AK, Roberts LJ, 2nd. Plasma biomarkers of oxidant stress
and development of organ failure in severe sepsis. Shock 2011; 36: 12-17.
12. O'Neal H R, Jr., Koyama T, Koehler EA, Siew E, Curtis BR, Fremont RD, May AK,
Bernard GR, Ware LB. Prehospital statin and aspirin use and the prevalence of
severe sepsis and acute lung injury/acute respiratory distress syndrome*. Crit
Care Med 2011.
13. Knaus WA, Draper EA, Wagner DP, Zimmerman JE. APACHE II: a severity of
disease classification system. Crit Care Med 1985; 13: 818-829.
14. Bone R, Balk R, Cerra F, Dellinger R, Fein A, Knaus W, Schein R, Sibbald W.
Definitions for sepsis and organ failure and guidelines for the use of innovative
therapies in sepsis. The ACCP/SCCM Consensus Conference Committee.
Page 16 of 50 AJRCCM Articles in Press. Published on 17-December-2015 as 10.1164/rccm.201507-1418OC
Copyright © 2015 by the American Thoracic Society

15
American College of Chest Physicians/Society of Critical Care Medicine. Chest
1992; 101: 1644-1655.
15. Bernard G. The Brussels Score. Sepsis 1997; 1: 43-44.
16. Bernard GR, Artigas A, Brigham KL, Carlet J, Falke K, Hudson L, Lamy M, Legall
JR, Morris A, Spragg R, the Consensus Committee. The American-European
Consensus Conference on ARDS. Definitions, mechanisms, relevant outcomes,
and clinical trial coordination. Am J Respir Crit Care Med 1994; 149: 818-824.
17. Pope CA, 3rd, Ezzati M, Dockery DW. Fine-particulate air pollution and life
expectancy in the United States. N Engl J Med 2009; 360: 376-386.
18. Little RJA, Rubin DB. Statistical analysis with missing data. . New York: Wiley;
1987.
19. Rice MB, Guidotti TL, Cromar KR, Committee ATSEHP. Scientific evidence
supports stronger limits on ozone. American journal of respiratory and critical
care medicine 2015; 191: 501-503.
20. Mustafa MG. Biochemical basis of ozone toxicity. Free Radic Biol Med 1990; 9:
245-265.
21. Chen C, Arjomandi M, Balmes J, Tager I, Holland N. Effects of chronic and acute
ozone exposure on lipid peroxidation and antioxidant capacity in healthy young
adults. Environ Health Perspect 2007; 115: 1732-1737.
22. Aris RM, Christian D, Hearne PQ, Kerr K, Finkbeiner WE, Balmes JR. Ozone-
induced airway inflammation in human subjects as determined by airway lavage
and biopsy. Am Rev Respir Dis 1993; 148: 1363-1372.
Page 17 of 50 AJRCCM Articles in Press. Published on 17-December-2015 as 10.1164/rccm.201507-1418OC
Copyright © 2015 by the American Thoracic Society
16
23. Mudway IS, Kelly FJ. An investigation of inhaled ozone dose and the magnitude of
airway inflammation in healthy adults. American journal of respiratory and
critical care medicine 2004; 169: 1089-1095.
24. Guarnieri M, Balmes JR. Outdoor air pollution and asthma. Lancet 2014; 383: 1581-
1592.
25. Johannson KA, Vittinghoff E, Lee K, Balmes JR, Ji W, Kaplan GG, Kim DS, Collard
HR. Acute exacerbation of idiopathic pulmonary fibrosis associated with air
pollution exposure. The European respiratory journal 2014; 43: 1124-1131.
26. Hwang BF, Chen YH, Lin YT, Wu XT, Leo Lee Y. Relationship between exposure to
fine particulates and ozone and reduced lung function in children. Environmental
research 2015; 137: 382-390.
27. Chen CH, Chan CC, Chen BY, Cheng TJ, Leon Guo Y. Effects of particulate air
pollution and ozone on lung function in non-asthmatic children. Environmental
research 2015; 137: 40-48.
28. Tager IB, Balmes J, Lurmann F, Ngo L, Alcorn S, Kunzli N. Chronic exposure to
ambient ozone and lung function in young adults. Epidemiology 2005; 16: 751-
759.
29. Jerrett M, Burnett RT, Pope CA, 3rd, Ito K, Thurston G, Krewski D, Shi Y, Calle E,
Thun M. Long-term ozone exposure and mortality. N Engl J Med 2009; 360:
1085-1095.
30. Calfee CS, Eisner MD, Ware LB, Thompson BT, Parsons PE, Wheeler AP, Korpak A,
Matthay MA. Trauma-associated lung injury differs clinically and biologically
Page 18 of 50 AJRCCM Articles in Press. Published on 17-December-2015 as 10.1164/rccm.201507-1418OC
Copyright © 2015 by the American Thoracic Society
17
from acute lung injury due to other clinical disorders. Crit Care Med 2007; 35:
2243-2250.
31. Diamond JM, Lee JC, Kawut SM, Shah RJ, Localio AR, Bellamy SL, Lederer DJ,
Cantu E, Kohl BA, Lama VN, Bhorade SM, Crespo M, Demissie E, Sonett J,
Wille K, Orens J, Shah AS, Weinacker A, Arcasoy S, Shah PD, Wilkes DS, Ware
LB, Palmer SM, Christie JD. Clinical risk factors for primary graft dysfunction
after lung transplantation. Am J Respir Crit Care Med 2013; 187: 527-534.
32. Moazed F, Calfee CS. Environmental risk factors for acute respiratory distress
syndrome. Clinics in chest medicine 2014; 35: 625-637.
33. Lu Q, Sakhatskyy P, Grinnell K, Newton J, Ortiz M, Wang Y, Sanchez-Esteban J,
Harrington EO, Rounds S. Cigarette smoke causes lung vascular barrier
dysfunction via oxidative stress-mediated inhibition of RhoA and focal adhesion
kinase. American journal of physiology Lung cellular and molecular physiology
2011; 301: L847-857.
34. Li XY, Rahman I, Donaldson K, MacNee W. Mechanisms of cigarette smoke induced
increased airspace permeability. Thorax 1996; 51: 465-471.
35. MacNee W, Wiggs B, Belzberg AS, Hogg JC. The effect of cigarette smoking on
neutrophil kinetics in human lungs. N Engl J Med 1989; 321: 924-928.
36. Arcavi L, Benowitz NL. Cigarette smoking and infection. Archives of internal
medicine 2004; 164: 2206-2216.
37. Turner MC, Cohen A, Jerrett M, Gapstur SM, Diver WR, Pope CA, 3rd, Krewski D,
Beckerman BS, Samet JM. Interactions between cigarette smoking and fine
Page 19 of 50 AJRCCM Articles in Press. Published on 17-December-2015 as 10.1164/rccm.201507-1418OC
Copyright © 2015 by the American Thoracic Society

18
particulate matter in the Risk of Lung Cancer Mortality in Cancer Prevention
Study II. American journal of epidemiology 2014; 180: 1145-1149.
38. McConnell R, Shen E, Gilliland FD, Jerrett M, Wolch J, Chang CC, Lurmann F,
Berhane K. A longitudinal cohort study of body mass index and childhood
exposure to secondhand tobacco smoke and air pollution: the Southern California
Children's Health Study. Environmental health perspectives 2015; 123: 360-366.
39. Nishinakagawa T, Senjyu H, Tanaka T, Asai M, Kotaki K, Yano Y, Miyamoto N,
Yanagita Y, Kozu R, Tabusadani M, Honda S. Smoking aggravates the impaired
pulmonary function of officially acknowledged female victims of air pollution of
40 years ago. The Tohoku journal of experimental medicine 2014; 234: 151-160.
Page 20 of 50 AJRCCM Articles in Press. Published on 17-December-2015 as 10.1164/rccm.201507-1418OC
Copyright © 2015 by the American Thoracic Society

19
FIGURE LEGENDS
Figure 1. Flow diagram summarizing patient selection for the ozone and NO2 analyses.
Figure 2. Geographic distribution of the 163 ozone monitors that contributed exposure
data for the ozone analysis.
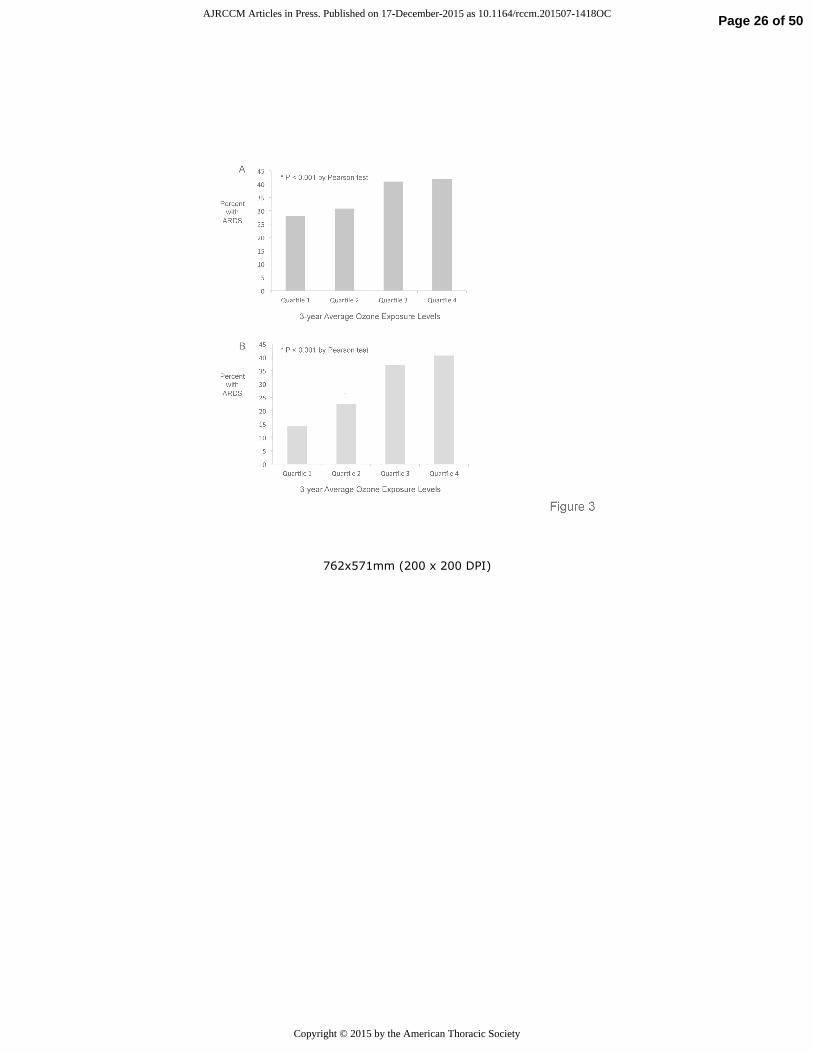
Figure 3. Relationship between quartile of ozone exposure and development of ARDS.
In an unadjusted analysis of (A) all patients and of (B) the subset with trauma as their
ARDS risk factor, patients in the 2nd, 3rd and 4th quartiles of 3-year ozone exposure
estimates were significantly more likely to develop ARDS (P < 0.001). For 3A, the
incidence of ARDS was 28.0%, (95% CI 23.4 - 32.7%) in quartile 1, 30.8% (95% CI
26.0% - 35.6%) in quartile 2, 41.0% (95% CI 36.0% - 46.1%) in quartile 3 and 41.8%
(95% CI 36.7% - 46.9%). For 3B, the incidence of ARDS was 13.8% (95% CI 7.5% -
20.1%) in quartile 1, 22.9% (95% CI 15.9% - 29.8%) in quartile 2, 38.9% (95% CI 30.9%
- 46.9%) in quartile 3 and 41.3% (95% CI 33.2% - 49.3%) in quartile 4.
Figure 4. Relationship between 3-year average ozone exposure level and predicted risk
of ARDS in a logistic regression model controlling for age, race, sex, enrollment month,
smoking, alcohol use, insurance status, zip-code based median household income, metro
vs. non-metro residence, distance to the VUMC, and APACHE-II in (A) all patients in
the ozone analysis and (B) in the same patients segregated by smoking status. The
association between 3-year average ozone exposure level and predicted risk of ARDS
differed between smokers and non-smokers and was only significant in the smokers.
Page 21 of 50 AJRCCM Articles in Press. Published on 17-December-2015 as 10.1164/rccm.201507-1418OC
Copyright © 2015 by the American Thoracic Society

20
Table 1. Comparison of patients by quartile of ozone exposure
Quartile 1 Quartile 2 Quartile 3 Quartile 4 p-value
Ozone (ppb-3 year avg) 41.5 – 49.0 49.0 – 51.5 51.5 – 53.5 53.5 – 58.2
Age (y, median, IQR) 53 (40, 64) 54 (37, 65) 52 (36, 62) 52 (40, 63) 0.64
Male (n, %) 214 (60%) 214 (61%) 202 (57%) 219 (62%) 0.56
Caucasian (n, %) 239 (67%) 289 (82%) 319 (90%) 314 (89%) < 0.001
Current smoker (n, %) 138 (42%) 119 (38%) 132 (41%) 139 (41%) 0.74
Alcohol abuse (n, %) 74 (21%) 60 (17%) 67 (19%) 64 (18%) 0.62
Insurance (Group 1*) 205 (58%) 243 (69%) 250 (71%) 231 (66%) 0.001
APACHE II (median, IQR)
25 (20, 30) 25 (20, 31) 25 (20, 31) 26 (21, 31) 0.34
Distance to VUMC (km, median, IQR)
11 (6, 51) 49 (17, 100) 70 (31, 102) 73 (52, 120) < 0.001
Metro (vs. non-metro)
residence county (n, %) 293 (82%) 249 (70%) 260 (73%) 222 (63%)
< 0.001
ARDS risk factor (n, %)
Trauma 116 (33%) 140 (40%) 144 (40%) 143 (40%) 0.19
Sepsis 194 (54%) 182 (51%) 177 (50%) 178 (50%)
Other 47 (13%) 32 (9%) 35 (10%) 33 (9%)
Zip code based median
household income
($1000)
39.2 (30.4, 47.8) 44.8 (38.2, 57.0)
45.2 (38.1, 56.0)
43.0 (36.8, 51.5) < 0.001
ARDS (n, %) 100 (28%) 109 (31%) 146 (41%) 148 (42%) < 0.001
* Group 1 = Private, Medicare, Federal
Page 22 of 50 AJRCCM Articles in Press. Published on 17-December-2015 as 10.1164/rccm.201507-1418OC
Copyright © 2015 by the American Thoracic Society

21
Table 2. Logistic regression analysis for ARDS in ozone cohort
Variable Comparator Odds Ratio 95% Confidence
Interval
Ozone 5ppb increment (49 to 54) 1.58 1.27 – 1.96
Age Q3 : Q11 0.95 0.79 – 1.14
Gender Female : Male 1.05 0.84 – 1.31
Race Non-Caucasian : Caucasian 0.70 0.50 – 0.98
Current smoker Smoker : Non-smoker 0.98 0.75 – 1.28
Alcohol abuse Yes : No 0.94 0.70 – 1.28
Insurance Status Group 2 : Group 12 0.93 0.71 – 1.22
APACHE II Q3 : Q13 1.83 1.55 – 2.16
Distance to VUMC Q3 : Q14 0.89 0.62 – 1.28
Residence County Non-Metro : Metro 0.92 0.67 – 1.26
Enrollment month September : March 0.92 0.75 – 1.12
Median household income Q3 : Q15 0.88 0.72 – 1.08 1 Lower quartile is 39, and upper quartile is 64.
2 Group 1 = Private, Medicare, Federal; Group 2 = TennCare, Medicaid, None.
3 Lower quartile is 20, and upper quartile is 31.
4 Lower quartile is 19, and upper quartile is 109.
5 Lower quartile is 35.8k, and upper quartile is 51.5k.
Page 23 of 50 AJRCCM Articles in Press. Published on 17-December-2015 as 10.1164/rccm.201507-1418OC
Copyright © 2015 by the American Thoracic Society

762x571mm (200 x 200 DPI)
Page 24 of 50 AJRCCM Articles in Press. Published on 17-December-2015 as 10.1164/rccm.201507-1418OC
Copyright © 2015 by the American Thoracic Society

762x571mm (104 x 104 DPI)
Page 25 of 50 AJRCCM Articles in Press. Published on 17-December-2015 as 10.1164/rccm.201507-1418OC
Copyright © 2015 by the American Thoracic Society
762x571mm (200 x 200 DPI)
Page 26 of 50 AJRCCM Articles in Press. Published on 17-December-2015 as 10.1164/rccm.201507-1418OC
Copyright © 2015 by the American Thoracic Society
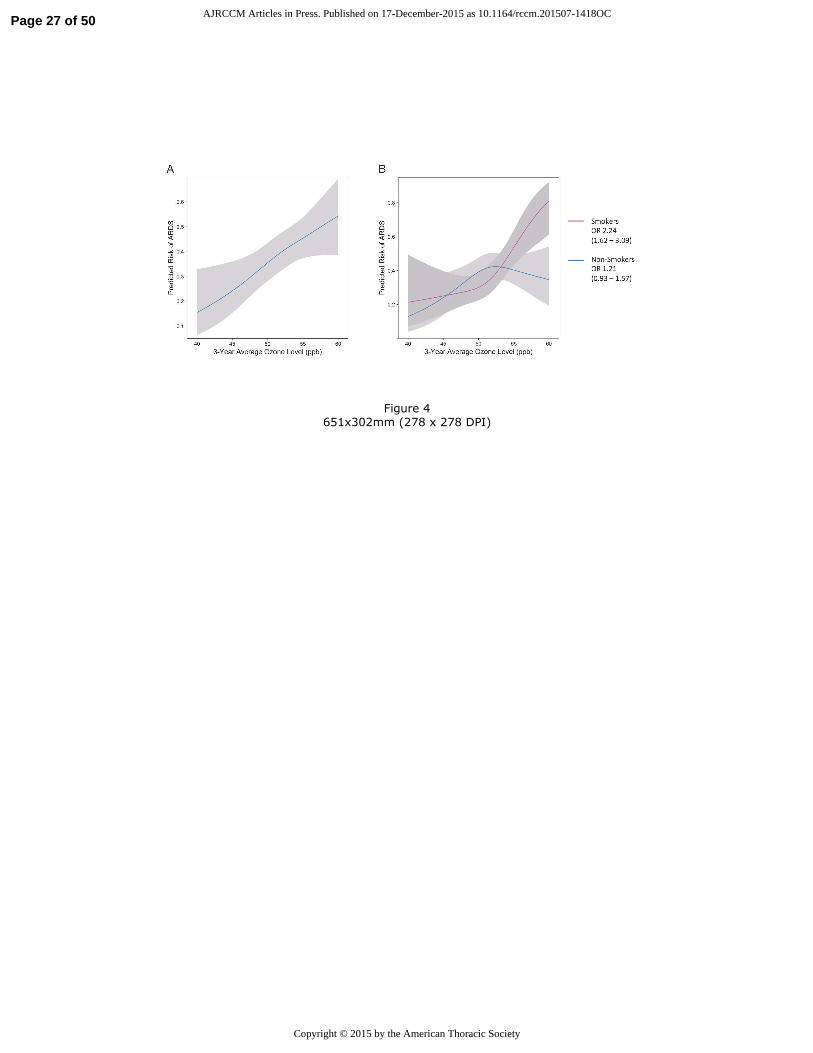
Figure 4
651x302mm (278 x 278 DPI)
Page 27 of 50 AJRCCM Articles in Press. Published on 17-December-2015 as 10.1164/rccm.201507-1418OC
Copyright © 2015 by the American Thoracic Society
1
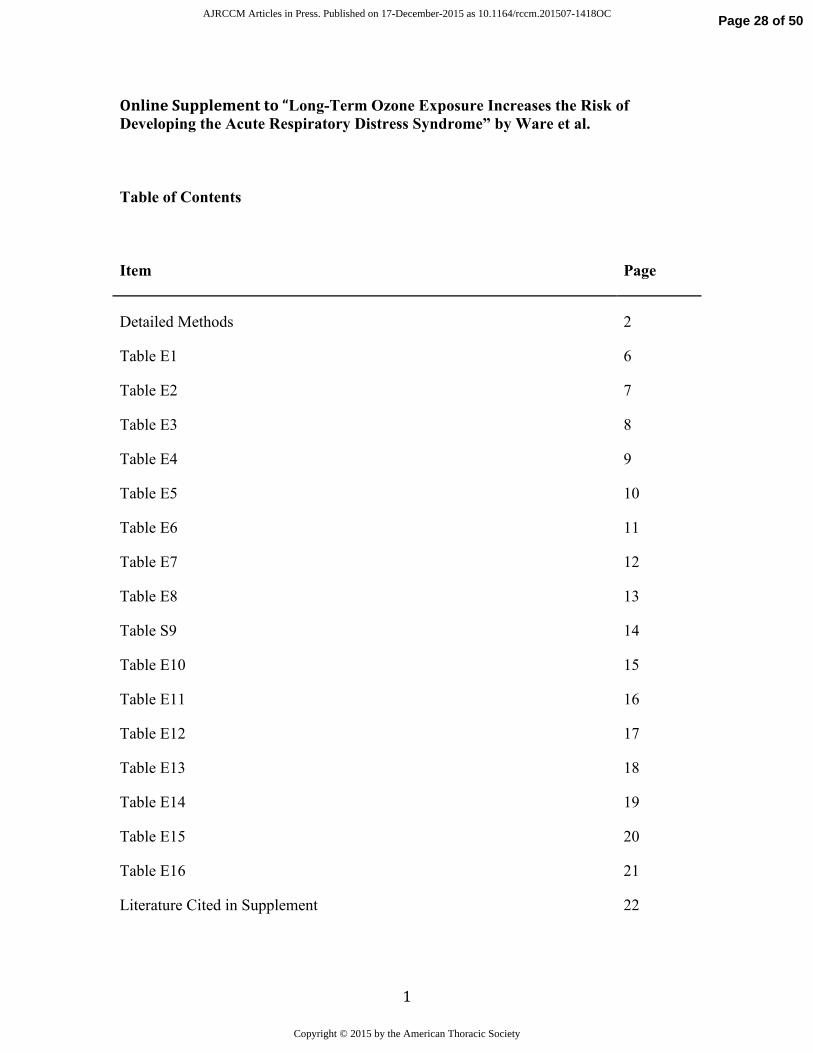
Online Supplement to “Long-Term Ozone Exposure Increases the Risk of Developing the Acute Respiratory Distress Syndrome” by Ware et al.
Table of Contents
Item Page
Detailed Methods
Table E1
2
6
Table E2 7
Table E3 8
Table E4 9
Table E5 10
Table E6 11
Table E7 12
Table E8 13
Table S9 14
Table E10 15
Table E11 16
Table E12 17
Table E13
Table E14
Table E15
Table E16
18
19
20
21
Literature Cited in Supplement 22
Page 28 of 50 AJRCCM Articles in Press. Published on 17-December-2015 as 10.1164/rccm.201507-1418OC
Copyright © 2015 by the American Thoracic Society
2
DETAILED METHODS
Patients. We studied patients from the Validating Acute Lung Injury biomarkers for
Diagnosis study (VALID, Vanderbilt IRB #051065), a prospective observational cohort
of critically ill medical, surgical and trauma patients admitted to Vanderbilt University
Medical Center (VUMC), a tertiary medical center in Nashville, TN. Detailed inclusion
and exclusion criteria and informed consent procedures have been published (E1-E4).
Briefly, patients are eligible for enrollment into VALID if they are admitted to the
Vanderbilt Medical, Surgical, Trauma or Cardiovascular ICUs at Vanderbilt and are still
in the ICU on the morning of ICU day 2 with no plans to transfer out of the ICU on that
day. Patients with uncomplicated overdose, cardiothoracic surgery or chronic lung
disease requiring supplemental oxygen are excluded. VALID subjects enrolled between
2006 and 2012 were included if a residential address was available, they lived within 50
km of at least one U.S. Environmental Protection Agency (EPA)-approved air quality
monitor and had a risk factor for ARDS such as sepsis, pneumonia, aspiration of gastric
contents or severe trauma. We excluded patients if they lived outside a pre-specified
geographic area bounded by latitude and longitude 33-40° N and 80-95° W because very
few patients lived outside this area.
Clinical Data. Clinical data included demographics, insurance status, smoking, alcohol
use, medical history, medications, APACHE II (E5), hemodynamic parameters, ventilator
settings, laboratory values and clinical outcomes. Patients were coded as metro or non-
metro dwellers using USDA 2003 Rural-Urban Continuum Codes (Codes 1-3 were
classified as metro, and codes 4-9 were classified non-metro). The distance from a
patient’s address of residence to VUMC was defined as the great-circle distance between
Page 29 of 50 AJRCCM Articles in Press. Published on 17-December-2015 as 10.1164/rccm.201507-1418OC
Copyright © 2015 by the American Thoracic Society
3
the place of residence and VUMC, calculated with the Haversine formula. Health
insurance status was collected at the time of admission as a surrogate for socioeconomic
status. Due to small numbers in some categories, private, federal and Medicare insurance
were grouped as indicative of higher socioeconomic status (Group 1), and all others (ie
Tenncare which is Tennessee Medicaid, other Medicaid and no insurance) were grouped
together as indicative of lower socioeconomic status (Group 2). Each patient in VALID
was phenotyped at enrollment and for the subsequent 3 days for sepsis, severe sepsis (E6),
organ dysfunction (E7) and ARDS. Phenotyping for ARDS was done using American
European Consensus Conference (AECC) definitions (E8) by two-physician review of
the chest radiograph, clinical history and blood gases. ARDS criteria could also be met
using the SpO2/FiO2 if PaO2/FiO2 was not available (E9). For the current study, patients
were classified as having ARDS if they met AECC criteria for acute lung injury (ALI) or
ARDS on two or more consecutive days during the four study days and as having no
ARDS if they did not meet AECC ALI or ARDS criteria on any day. Patients meting
criteria on a single or on two non-consecutive days were deemed to have indeterminate
ARDS status and were excluded from the primary analysis but included in a sensitivity
analysis.
Air pollutant exposure estimates. Daily measurements of ozone, NO2, SO2, PM2.5, and
PM10 were obtained from the EPA’s Aerometric Information Retrieval System for
monitors located within the study region for 2001-12. The 24-hour average was
computed for each pollutant except for ozone. Concentrations of ozone are generally
higher in the day than night because it is formed in sunlight. We used the 8-hour daily
maximum for ozone which is consistent with the metric used in the National Ambient Air
Page 30 of 50 AJRCCM Articles in Press. Published on 17-December-2015 as 10.1164/rccm.201507-1418OC
Copyright © 2015 by the American Thoracic Society

4
Quality Standard for ozone If a monitor used more than one instrument then the average
of the daily summaries for each was used. Since ozone levels are usually only monitored
in warmer months in the study region, data were restricted to April through September;
data from all months were used for other pollutants.
Patient addresses were geocoded (Google Maps Application Programming Interface) and
the distances to all monitors calculated using the Haversine formula. Each patient’s daily
exposure to a pollutant was estimated by the inverse-distance-squared weighted average
of daily levels from all monitors within 50km of the patient’s address, based on the
assumption that local levels of ambient pollutants reasonably estimate an individual’s
exposure (E10). We investigated both long-term exposures using the averages of 1-, 3-,
and 5-year periods prior to ICU admission and short-term exposures using the average
pollutant levels for the 3 days and 6 weeks prior to ICU admission. Findings for 1-, 3-
and 5-year ozone exposures were similar; only 3-year data are presented. Because no
significant associations between long-term exposures to SO2, PM2.5 and PM10 and risk of
ARDS were observed, these analyses are presented in the Online Supplement. As there
were no associations between any short-term air pollutant exposure and ARDS, these
data are not shown.
Statistical Analysis. Demographic and clinical data were compared between ARDS and
non-ARDS patients using Pearson’s chi-squared tests for categorical variables and
Wilcoxon rank-sum tests for continuous ones. Similar univariate analyses were
conducted for groups defined by quartiles of exposure. Missing values of regression
covariates were multiply imputed with predictive mean matching (E11) to avoid case-
wise deletion of patient records. First, missing values were initialized using a random
Page 31 of 50 AJRCCM Articles in Press. Published on 17-December-2015 as 10.1164/rccm.201507-1418OC
Copyright © 2015 by the American Thoracic Society

5
sample of observed values. A flexible additive model was then fit with each variable with
missing data as the outcome. The process was repeated 10 times, each time initialized
using the previous step’s results. The standard error estimates in the final model were
adjusted to account for variability associated with the imputation procedure. We fit
logistic regression models to examine the relationship between ARDS and pollutant
levels controlling for prespecified confounders including age, race, sex, enrollment
month (to control for season), smoking, alcohol use, insurance status (as a proxy for
socioeconomic status), zip code based median household income (from the 2006 – 2010
American Community Survey of the U.S. Census Bureau), metro vs. non-metro residence,
distance to the VUMC, APACHE-II, injury severity score (ISS, trauma subset only) and
blunt vs. penetrating trauma. A restricted cubic spline with 3 knots was used for age,
month, and APACHE-II to permit nonlinear associations. To investigate the effect of
ozone exposure in trauma patients and in smokers, prespecified subgroup analyses and
models with interactions were utilized. Data preparation and analyses were performed by
Drs. Zhao and Koyama using R Version 3 (R Core Team).
Page 32 of 50 AJRCCM Articles in Press. Published on 17-December-2015 as 10.1164/rccm.201507-1418OC
Copyright © 2015 by the American Thoracic Society
6
Table E1. Spearman’s correlation coefficients for associations between exposure estimates for the five pollutants in each
patient
NO2 PM10 PM2.5 SO2
Ozone -0.096
n = 987 p = 0.003
0.089
n = 1024 p = 0.005
0.292
n = 1294 p < 0.001
0.228
n = 1123 p < 0.001
NO2 0.639
n = 877 p < 0.001
0.191
n = 930 p < 0.001
0.172
n = 985 p < 0.001
PM10 0.559
n = 1036 p < 0.001
0.378
n = 983 p < 0.001
PM2.5 0.393
n = 1060 p < 0.001
Page 33 of 50 AJRCCM Articles in Press. Published on 17-December-2015 as 10.1164/rccm.201507-1418OC
Copyright © 2015 by the American Thoracic Society

7
Table E2. Comparison of included and excluded patients for the ozone analysis
Included in Ozone Analysis
(n = 1558)
Excluded from Ozone
Analysis
(n = 201)
P Value
Age (y, median, IQR) 53 (39, 64) 51 (33, 65) 0.287
Male (n, %) 942 (60%) 136 (68%) 0.058
Caucasian (n, %) 1294 (83%) 164 (82%) 0.675
Current smoker (n, %) 573 (40%) 79 (45%) 0.233
Alcohol abuse (n, %) 279 (18%) 32 (16%) 0.551
Insurance (Group 1*)(n %) 1029 (67%) 133 (67%) 1.000
APACHEII (median IQR) 26 (20, 31) 25 (20, 32) 0.991
Distance to VUMC (km) 65 (19, 109) 152 (78,630) <0.001
Metro (vs Non-Metro)(n %) 1041 (67%) 114 (57%) 0.006
ARDS Risk Factor (n, %)
Trauma Sepsis Other
585 (37%) 810 (52%) 163 (10%)
90 (45%) 95 (47%) 16 (8%)
0.117
Zip code-based median
household income ($1000) 41.4 (35.8, 51.5) 41.1 (34.5, 50.9) 0.204
ARDS (n, %) 564 (36%) 39 (34%) 0.705
Page 34 of 50 AJRCCM Articles in Press. Published on 17-December-2015 as 10.1164/rccm.201507-1418OC
Copyright © 2015 by the American Thoracic Society

8
N is patients with non-missing data; * comparison between ARDS and no ARDS groups,** Private, Medicare and Federal insurance
Table E3. Clinical characteristics of patients included in the ozone analysis
N Included in Ozone
Analysis (n = 1558) ARDS
(N = 563) No ARDS (N = 995)
P Value*
Age (y, median, IQR) 1558 53 (39, 64) 54 (40, 64) 52 (38, 64) 0.1
Male (n, %) 1558 942 (60%) 334 (59%) 608 (61%) 0.49
Caucasian (n, %) 1558 1294 (83%) 488 (87%) 806 (81%) 0.004
Current smoker (n, %) 1428 573 (40%) 206 (39%) 367 (41%) 0.456
Alcohol abuse (n, %) 1558 279 (18%) 95 (17%) 184 (19%) 0.423
Insurance Status (Group 1**) (n, %) 1537 1029 (67%) 387 (70%) 642 (65%) 0.081
APACHE II (median, IQR) 1558 26 (20, 31) 28 (23, 33) 24 (19, 30) < 0.001
Distance to VUMC (km, median, IQR) 1558 65 (19, 109) 70 (24,115) 63 (18,106) 0.058
Metro (vs Non-Metro) (n, %) 1558 1041 (67%) 369 (66%) 672 (68%) 0.422
ARDS Risk Factor (n, %)
Trauma Sepsis Other
1558 585 (37%) 810 (52%) 163 (10%)
178 (32%) 348 (62%) 37 (6%)
407 (41%) 462 (46%) 126 (13%)
< 0.001
Zip code-based median household
income ($1000) 1540 41.4 (35.8, 51.5) 42.3 (35.4, 53.5) 41.7 (35.9, 50.9)
0.74
Ozone (ppb, 3-year average) 1421 51.5 (49.0, 53.5) 52.1 (49.5, 54.0) 51.2 (48.5, 53.2) < 0.001
Page 35 of 50 AJRCCM Articles in Press. Published on 17-December-2015 as 10.1164/rccm.201507-1418OC
Copyright © 2015 by the American Thoracic Society

9
Table E4. Logistic regression analysis for ARDS in ozone cohort using 24-hour average ozone levels instead of highest 8-hour
daily maximum levels.
Comparator Odds Ratio 95% CI
Ozone1 5ppb increment 1.61 1.27 – 2.03
Age Q3 : Q11 0.94 0.79 – 1.13
Gender Female : Male 1.05 0.85 – 1.32
Race Non-Caucasian : Caucasian 0.70 0.50 – 0.97
Current smoker Smoker : Non-smoker 0.97 0.76 -- 1.25
Alcohol abuse Yes : No 0.95 0.70 – 1.29
Insurance Group 2 : Group 12 0.97 0.74 – 1.26
APACHE II Q3 : Q13 1.83 1.55 – 2.17
Distance to VUMC Q3 : Q14 0.72 0.47 – 1.10
Residence county Non-Metro : Metro 0.87 0.64 – 1.18
Enrollment month September : March 0.91 0.75 – 1.12
Household income Q3 : Q15 0.85 0.69 – 1.05
1 Lower quartile is 39, and upper quartile is 64.
2 Group 1 = Private, Medicare, Federal; Group 2 = TennCare, Medicaid, None.
3 Lower quartile is 20, and upper quartile is 31.
4 Lower quartile is 19, and upper quartile is 109.
5 Lower quartile is 35.8k, and upper quartile is 51.5k.
Page 36 of 50 AJRCCM Articles in Press. Published on 17-December-2015 as 10.1164/rccm.201507-1418OC
Copyright © 2015 by the American Thoracic Society

10
Table E5. Logistic regression analysis for ARDS in ozone cohort (with ozone-smoking interaction)
Comparator Odds Ratio 95% CI
Ozone1 5ppb increment (49 to 54) 2.22 (smoker) 1.59 – 3.10
1.27 (non-smoker) 0.96 – 1.69
Age Q3 : Q12 0.94 0.79 – 1.13
Gender Female : Male 1.07 0.86 – 1.34
Race Non-Caucasian : Caucasian 0.68 0.49 – 0.96
Current smoker Smoker : Non-smoker --- ---
Alcohol abuse Yes : No 0.95 0.70 – 1.30
Insurance Group 2 : Group 13 0.92 0.70 – 1.21
APACHE II Q3 : Q14 1.83 1.55 – 2.17
Distance to VUMC Q3 : Q15 0.89 0.62 – 1.28
Residence county Non-Metro : Metro 0.91 0.67 – 1.24
Enrollment month September : March 0.91 0.74 – 1.11
Household income Q3 : Q16 0.87 0.71 – 1.07
1 P-value for ozone-smoking interaction is 0.007. 2 Lower quartile is 39, and upper quartile is 64. 3 Group 1 = Private, Medicare, Federal; Group 2 = TennCare, Medicaid, None. 4 Lower quartile is 20, and upper quartile is 31. 5 Lower quartile is 19, and upper quartile is 109. 6 Lower quartile is 35.8k, and upper quartile is 51.5k.
Page 37 of 50 AJRCCM Articles in Press. Published on 17-December-2015 as 10.1164/rccm.201507-1418OC
Copyright © 2015 by the American Thoracic Society

11
Table E6. Logistic regression analysis for ARDS in the subgroup of patients at risk for ARDS due to severe trauma
1 Lower quartile is 39, and upper quartile is 64; 2 Group 1 = Private, Medicare, Federal; Group 2 = TennCare, Medicaid, None; 3 Lower quartile is 20, and upper quartile is 31; 4 Lower quartile is 19.4, and upper quartile is 109; 5 Lower quartile is 35.8k, and upper quartile is 51.5k; 6 Lower quartile is 20, and upper quartile is 36.
Variable Comparator Odds Ratio 95% Confidence Interval
Ozone 5ppb increment (49 to 54) 2.26 1.46 – 3.50
Age Q3 : Q11 1.07 0.79 – 1.46
Gender Female: Male 0.74 0.47 – 1.18
Race Non-Caucasian: Caucasian 1.57 0.84 – 2.91
Current smoker Smoker: Non-Smoker 1.18 0.74 – 1.87
Alcohol abuse Yes: No 0.64 0.38 – 1.08
Insurance Status Group 2 : Group 12 0.83 0.51 – 1.35
APACHE II Q3 : Q11 1.95 1.37 – 2.78
Distance to VUMC Q3 : Q11 1.06 0.51 – 2.19
Residence county Non-Metro: Metro 0.81 0.48 – 1.37
Enrollment month September: March 0.72 0.51 – 1.03
Zip code-based median
household income ($1000) Q3 : Q11 1.05 0.81 – 1.37
Injury severity score Q3 : Q11 1.71 1.25 – 2.35
Type of trauma Penetrating: Blunt 0.66 0.31 – 1.37
Page 38 of 50 AJRCCM Articles in Press. Published on 17-December-2015 as 10.1164/rccm.201507-1418OC
Copyright © 2015 by the American Thoracic Society
12
Table E7. Clinical characteristics of patients included in the NO2 analysis
N is patients with non-missing data; * comparison between ARDS and no ARDS groups,** Private, Medicare and Federal insurance
N Included in NO2
Analysis (n = 1257) ARDS
(N = 449) No ARDS (N = 808)
P Value*
Age (y, median, IQR) 1257 53 (38, 64) 54 (39,65) 52 (38, 64) 0.10
Male (n, %) 1257 752 (60%) 264 (59%) 488 (60%) 0.58
Caucasian (n, %) 1257 1015 (81%) 378 (84%) 637 (79%) 0.021
Current smoker (n, %) 1155 455 (39%) 156 (37%) 299 (41%) 0.18
Alcohol abuse (n, %) 1257 219 (17%) 71 (16%) 148 (18%) 0.26
Insurance Status (Group 1**) (n, %) 1240 839 (68%) 310 (70%) 529 (66%) 0.14
APACHE II (median, IQR) 1257 26 (20, 31) 28 (22, 32) 24 (19, 30) < 0.001
Distance to VUMC (km, median, IQR) 1257 49 (16, 101) 50 (18, 101) 47 (14, 100) 0.20
Metro (vs Non-Metro) (n, %) 1257 954 (76%) 336 (75%) 618 (77%) 0.51
ARDS Risk Factor (n, %)
Trauma Sepsis Other
1257 444 (35%) 687 (55%) 126 (10%)
133 (30%) 291 (65%) 25 (5%)
311 (39%) 396 (49%) 101 (13%)
< 0.001
Zip code-based median household
income ($1000) 1240 43.9 (36.6, 56.0) 44.8 (36.9, 56.9) 43.1 (36.4, 53.3)
0.11
NO2 (ppb, 3-year average) 994 15.4 (8.3, 16.8) 15.8 (8.2, 16.9) 15.3 (8.4, 16.8) 0.066
Page 39 of 50 AJRCCM Articles in Press. Published on 17-December-2015 as 10.1164/rccm.201507-1418OC
Copyright © 2015 by the American Thoracic Society

13
Table E8. Patient characteristics by quartile of estimated NO2 exposure
Quartile 1 Quartile 2 Quartile 3 Quartile 4 P Value
NO2 (ppb-3 yr avg) 1.7 - 8.4 8.4 - 15.4 15.4 - 16.8 16.8 - 17.7
Age (y, median, IQR) 52 (37 – 63) 53 (35 – 64) 52 (41 – 63) 51 (38 – 62) 0.903
Male (n, %) 147 (59%) 147 (59%) 150 (60%) 140 (56%) 0.831
Caucasian (n, %) 215 (86%) 212 (85%) 177 (71%) 168 (68%) <0.001
Current smoker (n, %) 93 (40%) 87 (39%) 81 (35%) 114 (50%) 0.013
Alcohol abuse (n, %) 40 (16%) 43 (17%) 42 (17%) 58 (23%) 0.132
Insurance (Group 1*) 184 (75%) 162 (66%) 155 (62%) 140 (58%) <0.001
APACHE II (median, IQR) 26 (20 – 32) 25 (20 – 29) 25 (20 – 30) 26 (20 – 32) 0.056
Distance to VUMC (km, median, IQR) 91 (71 – 117) 41 (16 – 174) 16 (7 – 27) 14 (6 – 26) < 0.001
Metro (vs Non-Metro) (n, %) 142 (57%) 199 (80%) 248 (100%) 248 (100%) < 0.001
ARDS Risk Factor (n, %)
Trauma
Sepsis
Other
96 (38%) 126 (50%) 28 (11%)
97 (39%) 134 (54%) 17 (7%)
78 (31%) 150 (60%) 20 (8%)
83 (33%) 133 (54%) 32 (13%)
0.08
Median Household Income 40.7 (37.1, 47.1) 45.3 (37.7, 57.3) 50.0 (39.2, 61.7) 47.9 (37.0, 57.0) < 0.001
Percent with ARDS 88 (35%) 72 (29%) 86 (35%) 96 (39%) 0.152
*Private, Medicare, and Federal insurance
Page 40 of 50 AJRCCM Articles in Press. Published on 17-December-2015 as 10.1164/rccm.201507-1418OC
Copyright © 2015 by the American Thoracic Society

14
Table E9. Logistic regression analysis for ARDS in the NO2 cohort
Variable Comparator Odds Ratio 95% Confidence Interval
NO2 5 ppb increment (8.3 to 13.3) 1.29 1.02 – 1.62
Age Q3 : Q11 0.98 0.80 – 1.20
Gender Female : Male 1.01 0.79 – 1.30
Race Non-Caucasian : Caucasian 0.75 0.52 – 1.07
Current smoker Smoker : Non-smoker 0.88 0.67 – 1.17
Alcohol abuse Yes : No 0.91 0.65 – 1.17
Insurance Status Group 2 : Group 12 1.00 0.74 – 1.35
APACHE II Q3 : Q13 1.82 1.51 – 2.19
Distance to VUMC Q3 : Q14 2.04 1.12 – 3.71
Residence County Non-Metro : Metro 0.99 0.67 – 1.45
Enrollment month September : March 0.94 0.75 – 1.18
Median Household Income Q3 : Q15 1.06 0.83 – 1.34
1 Lower quartile is 38, and upper quartile is 64. 2 Group 1 = Private, Medicare, Federal; Group 2 = TennCare, Medicaid, None. 3 Lower quartile is 20, and upper quartile is 31. 4 Lower quartile is 15.5, and upper quartile is 100.7. 5 Lower quartile is 36.5k, and upper quartile is 56.0k.
Page 41 of 50 AJRCCM Articles in Press. Published on 17-December-2015 as 10.1164/rccm.201507-1418OC
Copyright © 2015 by the American Thoracic Society
15
Table E10. Logistic regression model for ARDS including both ozone and NO2 exposure estimates
Variable Comparator Odds Ratio 95% Confidence Interval
Ozone 5 ppb increment (49 to 54) 1.48 1.10 – 1.97
NO2 5 ppb increment (8.3 to 13.3) 1.12 0.90 – 1.40
Age Q3 : Q11 0.97 0.79 – 1.19
Gender Female : Male 1.02 0.79 – 1.30
Race Non-Caucasian : Caucasian 0.76 0.53 – 1.09
Current smoker Smoker : Non-smoker 0.90 0.68 – 1.19
Alcohol abuse Yes : No 0.89 0.63 – 1.25
Insurance Group 2 : Group 12 1.00 0.74 – 1.35
APACHE II Q3 : Q13 1.83 1.52 – 2.20
Distance to VUMC Q3 : Q14 1.07 0.53 – 2.16
Residence County Non-Metro : Metro 1.10 0.74 – 1.63
Enrollment month September : March 0.93 0.74 – 1.17
Median Household Income Q3 : Q15 0.97 0.75 – 1.25 1 Lower quartile is 38, and upper quartile is 64. 2 Group 1 = Private, Medicare, Federal; Group 2 = TennCare, Medicaid, None. 3 Lower quartile is 20, and upper quartile is 31. 4 Lower quartile is 15.5, and upper quartile is 100.7. 5 Lower quartile is 36.5k, and upper quartile is 56.0k.
Page 42 of 50 AJRCCM Articles in Press. Published on 17-December-2015 as 10.1164/rccm.201507-1418OC
Copyright © 2015 by the American Thoracic Society
16
Table E11. Patient characteristics by quartile of estimated SO2 exposure
Quartile 1 Quartile 2 Quartile 3 Quartile 4 P Value
SO2 (ppb-3 yr avg) 1.12 – 2.37 2.37 – 2.77 2.77 – 3.07 3.07 – 9.48
Age (y, median, IQR) 53 (37 – 66) 52 (41 – 64) 51 (38 – 61) 53 (37 – 62) 0.737
Male (n, %) 176 (60%) 172 (58%) 178 (60%) 181 (61%) 0.879
Caucasian (n, %) 271 (92%) 226 (76%) 200 (66%) 253 (86%) <0.001
Current smoker (n, %) 107 (40%) 112 (40%) 123 (47%) 98 (36%) 0.067
Alcohol abuse (n, %) 50 (17%) 46 (16%) 62 (21%) 51 (17%) 0.353
Insurance (Group 1*, n, %) 191 (66%) 198 (68%) 167 (58%) 218 (74%) <0.001
APACHE II (median, IQR) 26 (20 – 31) 25 (20 – 30) 26 (20 – 31) 27 (19 – 34) 0.852
Distance to VUMC (km, median,
IQR)
83 (61 – 123) 23 (12 – 44) 13 (6 – 24) 82 (58 – 129) 0.296
Metro (vs Non-Metro) (n, %) 150 (51%) 270 (91%) 287 (97%) 247 (84%) < 0.001
ARDS Risk Factor (n, %)
Trauma
Sepsis
Other
123 (41%) 141 (48%) 32 (11%)
101 (34%) 172 (58%) 23 (8%)
105 (35%) 156 (53%) 35 (12%)
110 (37%) 156 (53%) 29 (10%)
0.301
Zip code-based median household
income ($1000)
40.2 (35.4, 46.4) 50.5 (39.2, 61.5) 44.8 (37.0, 58.8) 44.5 (38.1, 48.4) <0.001
Percent with ARDS 110 (37%) 113 (38%) 101 (34%) 99 (34%) 0.578
*Private, Medicare, and Federal insurance
Page 43 of 50 AJRCCM Articles in Press. Published on 17-December-2015 as 10.1164/rccm.201507-1418OC
Copyright © 2015 by the American Thoracic Society
17
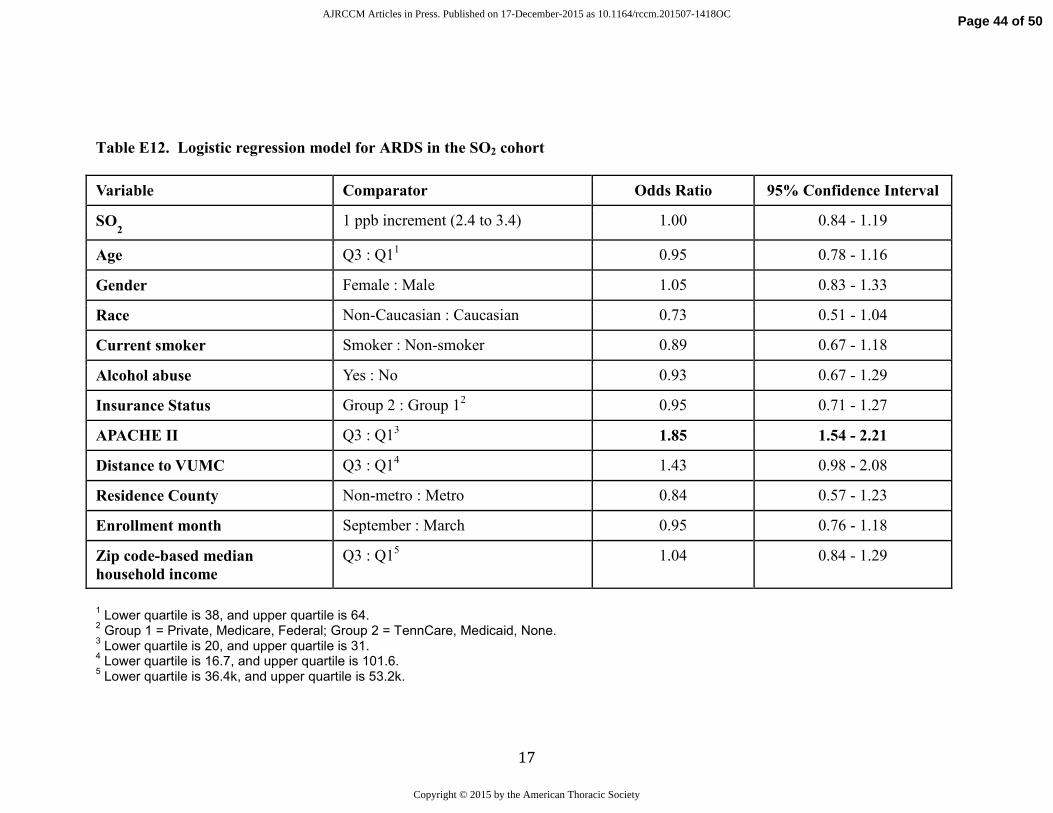
Table E12. Logistic regression model for ARDS in the SO2 cohort
Variable Comparator Odds Ratio 95% Confidence Interval
SO2 1 ppb increment (2.4 to 3.4) 1.00 0.84 - 1.19
Age Q3 : Q11 0.95 0.78 - 1.16
Gender Female : Male 1.05 0.83 - 1.33
Race Non-Caucasian : Caucasian 0.73 0.51 - 1.04
Current smoker Smoker : Non-smoker 0.89 0.67 - 1.18
Alcohol abuse Yes : No 0.93 0.67 - 1.29
Insurance Status Group 2 : Group 12 0.95 0.71 - 1.27
APACHE II Q3 : Q13 1.85 1.54 - 2.21
Distance to VUMC Q3 : Q14 1.43 0.98 - 2.08
Residence County Non-metro : Metro 0.84 0.57 - 1.23
Enrollment month September : March 0.95 0.76 - 1.18
Zip code-based median
household income
Q3 : Q15 1.04 0.84 - 1.29
1 Lower quartile is 38, and upper quartile is 64.
2 Group 1 = Private, Medicare, Federal; Group 2 = TennCare, Medicaid, None.
3 Lower quartile is 20, and upper quartile is 31.
4 Lower quartile is 16.7, and upper quartile is 101.6.
5 Lower quartile is 36.4k, and upper quartile is 53.2k.
Page 44 of 50 AJRCCM Articles in Press. Published on 17-December-2015 as 10.1164/rccm.201507-1418OC
Copyright © 2015 by the American Thoracic Society

18
Table E13. Patient characteristics by quartile of estimated PM2.5 exposure
Quartile 1 Quartile 2 Quartile 3 Quartile 4 P Value
PM2.5 (µg/m3-3 yr avg) 8.7 – 12.1 12.1 – 13.2 13.2 – 13.7 13.7 – 19.4
Age (y, median, IQR) 55 (40 – 65) 52 (39 – 64) 52 (38 – 62) 50 (34 – 62) 0.011
Male (n, %) 193 (57%) 198 (59%) 200 (59%) 207 (61%) 0.717
Caucasian (n, %) 287 (85%) 271 (80%) 279 (83%) 257 (76%) 0.03
Current smoker (n, %) 109 (35%) 114 (37%) 133 (44%) 138 (45%) 0.015
Alcohol abuse (n, %) 47 (14%) 50 (15%) 61 (18%) 78 (23%) 0.007
Insurance (Group 1*, n, %) 226 (67%) 237 (70%) 226 (68%) 194 (58%) 0.007
APACHE II (median, IQR) 26 (21 – 31) 25 (20 – 31) 26 (20 – 31) 25 (20 – 30) 0.128
Distance to VUMC (km, median, IQR)
54 (19 – 109) 62 (18 – 102) 48 (17 – 98) 47 (11 – 99) 0.073
Metro (vs Non-Metro) (n, %) 223 (66%) 230 (68%) 257 (76%) 297 (88%) < 0.001
ARDS Risk Factor (n, %)
Trauma Sepsis Other
128 (41%) 168 (50%) 32 (10%)
139 (41%) 171 (51%) 28 (8%)
124 (37%) 168 (50%) 46 (14%)
120 (36%) 184 (55%) 33 (10%)
0.094
Zip code-based Median
Household Income ($1000)
43.4 (36.0, 56.0) 44.1 (37.1, 52.2) 44.9 (37.7, 56.7) 43.3 (35.7, 52.8) 0.21
Percent with ARDS 116 (34%) 141 (42%) 102 (30%) 122 (36%) 0.017
*Private, Medicare, and Federal insurance
Page 45 of 50 AJRCCM Articles in Press. Published on 17-December-2015 as 10.1164/rccm.201507-1418OC
Copyright © 2015 by the American Thoracic Society

19
Table E14. Logistic regression model for ARDS in the PM2.5 cohort
Variable Comparator Odds Ratio 95% Confidence Interval
PM2.5 1.0 µg/m3 increment (12.1 to 13.1) 1.05 0.95 - 1.16
Age Q3 : Q11 0.93 0.77 - 1.13
Gender Female : Male 1.07 0.85 - 1.36
Race Non-Caucasian : Caucasian 0.70 0.49 - 0.98
Current smoker Smoker : Non-smoker 1.04 0.79 - 1.35
Alcohol abuse Yes : No 0.97 0.70 - 1.35
Insurance Status Group 2 : Group 12 0.91 0.69 - 1.21
APACHE II Q3 : Q13 1.93 1.61 - 2.31
Distance to VUMC Q3 : Q14 1.36 0.97 - 1.90
Residence County Non-metro: Metro 0.80 0.57 - 1.14
Enrollment month September : March 0.90 0.72 - 1.11
Median Household Income Q3 : Q15 1.03 0.84 - 1.26
1 Lower quartile is 38, and upper quartile is 63. 2 Group 1 = Private, Medicare, Federal; Group 2 = TennCare, Medicaid, None. 3 Lower quartile is 20, and upper quartile is 31. 4 Lower quartile is 16.8, and upper quartile is 101.6. 5 Lower quartile is 37.0k, and upper quartile is 54.5k.
Page 46 of 50 AJRCCM Articles in Press. Published on 17-December-2015 as 10.1164/rccm.201507-1418OC
Copyright © 2015 by the American Thoracic Society
20
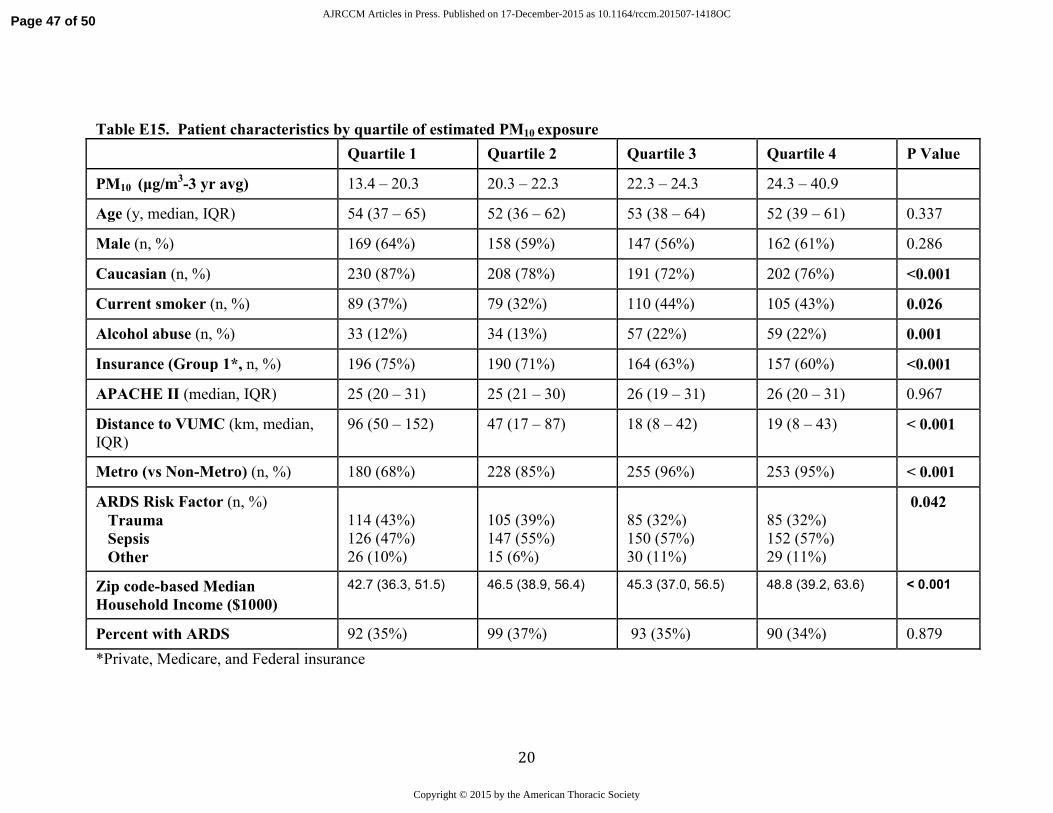
Table E15. Patient characteristics by quartile of estimated PM10 exposure
Quartile 1 Quartile 2 Quartile 3 Quartile 4 P Value
PM10 (µg/m3-3 yr avg) 13.4 – 20.3 20.3 – 22.3 22.3 – 24.3 24.3 – 40.9
Age (y, median, IQR) 54 (37 – 65) 52 (36 – 62) 53 (38 – 64) 52 (39 – 61) 0.337
Male (n, %) 169 (64%) 158 (59%) 147 (56%) 162 (61%) 0.286
Caucasian (n, %) 230 (87%) 208 (78%) 191 (72%) 202 (76%) <0.001
Current smoker (n, %) 89 (37%) 79 (32%) 110 (44%) 105 (43%) 0.026
Alcohol abuse (n, %) 33 (12%) 34 (13%) 57 (22%) 59 (22%) 0.001
Insurance (Group 1*, n, %) 196 (75%) 190 (71%) 164 (63%) 157 (60%) <0.001
APACHE II (median, IQR) 25 (20 – 31) 25 (21 – 30) 26 (19 – 31) 26 (20 – 31) 0.967
Distance to VUMC (km, median, IQR)
96 (50 – 152) 47 (17 – 87) 18 (8 – 42) 19 (8 – 43) < 0.001
Metro (vs Non-Metro) (n, %) 180 (68%) 228 (85%) 255 (96%) 253 (95%) < 0.001
ARDS Risk Factor (n, %)
Trauma Sepsis Other
114 (43%) 126 (47%) 26 (10%)
105 (39%) 147 (55%) 15 (6%)
85 (32%) 150 (57%) 30 (11%)
85 (32%) 152 (57%) 29 (11%)
0.042
Zip code-based Median
Household Income ($1000)
42.7 (36.3, 51.5) 46.5 (38.9, 56.4) 45.3 (37.0, 56.5) 48.8 (39.2, 63.6) < 0.001
Percent with ARDS 92 (35%) 99 (37%) 93 (35%) 90 (34%) 0.879
*Private, Medicare, and Federal insurance
Page 47 of 50 AJRCCM Articles in Press. Published on 17-December-2015 as 10.1164/rccm.201507-1418OC
Copyright © 2015 by the American Thoracic Society

21
Table E16. Logistic regression model for ARDS in the PM10 cohort
Variable Comparator Odds Ratio 95% Confidence Interval
PM10 4.0 µg/m3 increment (20.3 to 24.3) 0.92 0.73 - 1.15
Age Q3 : Q11 0.90 0.73 - 1.11
Gender Female : Male 1.00 0.77 - 1.30
Race Non-Caucasian : Caucasian 0.71 0.49 - 1.03
Current smoker Smoker : Non-smoker 0.91 0.67 - 1.23
Alcohol abuse Yes : No 1.03 0.72 - 1.47
Insurance Status Group 2 : Group 12 0.98 0.72 - 1.35
APACHE II Q3 : Q13 1.92 1.58 - 2.35
Distance to VUMC Q3 : Q14 1.31 0.88 - 1.96
Residence County Non-metro : Metro 0.80 0.52 - 1.24
Enrollment month September : March 0.90 0.71 - 1.14
Median Household Income Q3 : Q15 1.06 0.85 - 1.31
1 Lower quartile is 38, and upper quartile is 63. 2 Group 1 = Private, Medicare, Federal; Group 2 = TennCare, Medicaid, None. 3 Lower quartile is 20, and upper quartile is 31. 4 Lower quartile is 13.9, and upper quartile is 98.0. 5 Lower quartile is 37.9k, and upper quartile is 56.5k.
Page 48 of 50 AJRCCM Articles in Press. Published on 17-December-2015 as 10.1164/rccm.201507-1418OC
Copyright © 2015 by the American Thoracic Society
22
LITERATURE CITED IN ONLINE SUPPLEMENT
E1. Siew ED, Ikizler TA, Gebretsadik T, Shintani A, Wickersham N, Bossert F, Peterson
JF, Parikh CR, May AK, Ware LB. Elevated urinary IL-18 levels at the time of
ICU admission predict adverse clinical outcomes. Clinical journal of the
American Society of Nephrology : CJASN 2010; 5: 1497-1505.
E2. Siew ED, Ware LB, Gebretsadik T, Shintani A, Moons KG, Wickersham N, Bossert
F, Ikizler TA. Urine neutrophil gelatinase-associated lipocalin moderately predicts
acute kidney injury in critically ill adults. Journal of the American Society of
Nephrology : JASN 2009; 20: 1823-1832.
E3. Ware LB, Fessel JP, May AK, Roberts LJ, 2nd. Plasma biomarkers of oxidant stress
and development of organ failure in severe sepsis. Shock 2011; 36: 12-17.
E4. O'Neal H R, Jr., Koyama T, Koehler EA, Siew E, Curtis BR, Fremont RD, May AK,
Bernard GR, Ware LB. Prehospital statin and aspirin use and the prevalence of
severe sepsis and acute lung injury/acute respiratory distress syndrome*. Crit
Care Med 2011.
E5. Knaus WA, Draper EA, Wagner DP, Zimmerman JE. APACHE II: a severity of
disease classification system. Crit Care Med 1985; 13: 818-829.
E6. Bone R, Balk R, Cerra F, Dellinger R, Fein A, Knaus W, Schein R, Sibbald W.
Definitions for sepsis and organ failure and guidelines for the use of innovative
therapies in sepsis. The ACCP/SCCM Consensus Conference Committee.
Page 49 of 50 AJRCCM Articles in Press. Published on 17-December-2015 as 10.1164/rccm.201507-1418OC
Copyright © 2015 by the American Thoracic Society
23
American College of Chest Physicians/Society of Critical Care Medicine. Chest
1992; 101: 1644-1655.
E7. Bernard G. The Brussels Score. Sepsis 1997; 1: 43-44.
E8. Bernard GR, Artigas A, Brigham KL, Carlet J, Falke K, Hudson L, Lamy M, Legall
JR, Morris A, Spragg R, the Consensus Committee. The American-European
Consensus Conference on ARDS. Definitions, mechanisms, relevant outcomes,
and clinical trial coordination. Am J Respir Crit Care Med 1994; 149: 818-824.
E9. Rice TW, Wheeler AP, Bernard GR, Hayden DL, Schoenfeld DA, Ware LB.
Comparison of the SpO2/FiO2 Ratio and the PaO2/FiO2 Ratio in Patients with
Acute Lung Injury or Acute Respiratory Distress Syndrome. Chest 2007.
E10. Pope CA, 3rd, Ezzati M, Dockery DW. Fine-particulate air pollution and life
expectancy in the United States. N Engl J Med 2009; 360: 376-386.
E11. Little RJA, Rubin DB. Statistical analysis with missing data. . New York: Wiley;
1987.
Page 50 of 50 AJRCCM Articles in Press. Published on 17-December-2015 as 10.1164/rccm.201507-1418OC
Copyright © 2015 by the American Thoracic Society