Long Term Manipulations of Intact Microbial Mat ... · Modem microbial mats are thought to be...
30
Bebout,et al. Long Term Manipulations of Intact Microbial Mat Communities in a Greenhouse Collaboratory: Simulating Earth's Present and Past Field Environments Brad M. Bebout 1, David J. Des Marais 1, Mykell Discipulo 2, Tsegereda Embaye z' Ferran Garcia-Pichel 3, Mary Hogan 4, Linda L. Jahnke 1, Richard M. Keller 5, Scott R. Miller 6, Leslie E. Prufert-Bebout 1, Chris Raleigh 7, Michael Rothrock 3, and Kendra Turk 4 /Exobiology Branch, Ames Research Center, NASA," 2SETI lnstitute; 3Dept. of Microbiology, Arizona State University; 4Institute of Marine Sciences, University of California, Santa Cruz; 5Computational Sciences Division, Ames Research Center, NASA; 6Department of Genetics, North Carolina State University; ZMontana State University Running Title: A Microbial Mat Greenhouse Collaboratory Keywords: Microbial mat Biogeochemistry Biomarkers Corresponding Author: Brad Bebout NASA Ames Research Center Mail Stop 239-4, Building N239 Room 338 Moffett Field, CA 94035-1000 [email protected], gov (650) 604-32]27 (office) (650) 604-1088 (fax) For submission to: Astrobiology https://ntrs.nasa.gov/search.jsp?R=20020069017 2020-04-04T07:41:47+00:00Z
Transcript of Long Term Manipulations of Intact Microbial Mat ... · Modem microbial mats are thought to be...

Bebout,et al.
Long Term Manipulations of Intact Microbial Mat Communities ina Greenhouse Collaboratory: Simulating Earth's Present and Past
Field Environments
Brad M. Bebout 1, David J. Des Marais 1, Mykell Discipulo 2, Tsegereda Embaye z' Ferran
Garcia-Pichel 3, Mary Hogan 4, Linda L. Jahnke 1, Richard M. Keller 5, Scott R. Miller 6,
Leslie E. Prufert-Bebout 1, Chris Raleigh 7, Michael Rothrock 3, and Kendra Turk 4
/Exobiology Branch, Ames Research Center, NASA," 2SETI lnstitute; 3Dept. of
Microbiology, Arizona State University; 4Institute of Marine Sciences, University of
California, Santa Cruz; 5Computational Sciences Division, Ames Research Center,
NASA; 6Department of Genetics, North Carolina State University; ZMontana State
University
Running Title:
A Microbial Mat Greenhouse Collaboratory
Keywords:
Microbial mat
Biogeochemistry
Biomarkers
Corresponding Author:
Brad Bebout
NASA Ames Research Center
Mail Stop 239-4, Building N239 Room 338
Moffett Field, CA 94035-1000
[email protected], gov
(650) 604-32]27 (office)
(650) 604-1088 (fax)
For submission to: Astrobiology
https://ntrs.nasa.gov/search.jsp?R=20020069017 2020-04-04T07:41:47+00:00Z
Bebout, et al.
Abstract
Photosynthetic microbial mat communities were obtained from marine hypersaline
saltern ponds, maintained in a greenhouse facility, and examined for the effects of
salinity variations. Because these microbial mats are considered to be useful analogs of
equivalent ancient marine communities, they offer insights about evolutionary events
during the >3 billion year time interval wherein mats co-evolved with Earth's geosphere
and atmosphere. Although photosynthetic mats can be highly dynamic and exhibit
extremely high activity, the mats in the present study have been maintained for more than
one year with relatively minor changes. The major groups of microorganisms, as assayed
using microscopic, genetic, and biomarker methodologies, are essentially the same as
those in the original field samples. Field and greenhouse mats were similar with respect
to rates of exchange of oxygen and dissolved inorganic carbon across the mat-water
interface, both during the day and at night. Field and greenhouse mats exhibited similar
rates of effiux of methane and hydrogen. Manipulations of salinity in the water overlying
the mats produced changes in the community that strongly resemble those observed in the
field. A collaboratory testbed and an array of automated features are being developed to
support remote scientific experimentation with the assistance of intelligent software
agents. This facility will permit teams of investigators to explore ancient environmental
conditions that are rare or absent today but might have influenced the early evolution of
these photosynthetic ecosystems.
2

Bebout,et al.
Introduction
Modem microbial mats are thought to be extant representatives of Earth's most ancient
ecosystems (Walter, 1976). Geochemical evidence of the existence of photosynthetic
microbial mats, and their mineralized counterparts, stromatolites, has been identified in
rocks as old as 3.0 Ga (Beukes and Lowe, 1989). As a living repository of genetic,
physiological, isotopic, and biogeochemical information on the co-evolution of a planet
and the only biosphere known, modem microbial mats are invaluable objects of study.
Modem microbial mat studies have provided important insights on rates of biological
activity (Revsbech et al., 1983; Canfield and Des Marais, 1993; Des Marais, 1995),
genetic diversity (Ward et al., 1990; Garcia-Pichel et al., 1998; Ntibel et al., 2001), stable
isotopic fractionation (Schidlowski, 1988; Des Marais and Canfield, 1994), organic
(Boon, 1984; Ward et al., 1985), and atmospheric (Visscher and Van Gemerden, 1991;
Visscher and Kiene, 1994; Hoehler et al., 2001) biomarkers, as well as minerals, (Reid et
al., 2000) that have been used to interpret the fossil record of these communities over
geologic time.
Photosynthetic microbial mats are self-sustaining, complete ecosystems in which light
energy absorbed over a diel (24 hour) cycle drives the synthesis of spatially-organized,
diverse biomass. Microorganisms with tightly-coupled metabolism in the mat catalyze
transformations of carbon, nitrogen, sulfur, and metals. Radiant energy form the sun
sustains oxygenic and anoxygenic photosynthesis, which in turn provides chemical
energy, as organic photosynthates and oxygen, to the rest of the community. When
oxygenic photosynthesis ceases at night, the upper layers of the mat become highly
reduced and sulfidic (Jorgensen et al., 1979). Counteracting gradients of oxygen and
sulfide shape the chemical environment and provide daily-contrasting microenvironments
separated on a scale of a few millimeters (Revsbech et al., 1983; Revsbech and
Jorgensen, 1986). While photosynthetic bacteria dominate the biomass and productivity
of the mat, many aspects of the ecosystem's emergent behavior may ultimately depend on
the associated non-photosynthetic microbial communities, including the anaerobes.
Additionally, transformation of photosynthetic productivity by the microbial community
may contribute diagnostic "biosignature" gases that could represent search tai'gets for
remote spectroscopic life detection efforts (e.g., Terrestrial Planet Finder, (Des Marais et
al., 2001)). To understand the overall structure and function of mat communities, it is
thus critical to determine the nature and extent of the interactions between phototrophic
and nonphotosynthetic microorganisms, including anaerobic microorganisms.
Compared to their historical distribution and abundance, microbial mats are today
confined to a relatively restricted number of habitats. Well-developed modem
photosynthetic mats occur both in high salinity, and high temperature environments. This

• i
Bebout, et al.
restricted distribution is thought to be due primarily to the higher rates of grazing in more
moderate modern environments (Garret, 1970), although alternative hypotheses have
been forwarded. In any event, the limited geographical distribution of mats on the
present day Earth also serves to limit their usefulness as analogues of similar ecosystems
growing in more diverse ancient environments. Environments that are not well
represented on the modern Earth, but which have been extremely important over
evolutionary time, include marine environments having low concentrations of sulfate,
and/or free oxygen (Holland, 1984; Canfield and Teske, 1996).
The effects of various environmental parameters important in Earth's past (such as sulfate
and oxygen concentrations) on microbial processes may be studied in culture. However,
the emergent properties of complex microbial ecosystems are not necessarily predictable,
nor understandable, on the basis of these types of experiments (Wilson and Botkin,
1990). Some microbial processes either do not occur in culture (e.g., anaerobic methane
oxidation, (Reeburgh, 1980), and sulfate reduction under aerobic conditions (Canfield
and Des Marais, 1991)) or occur at rates vastly different than rates observed in nature. In
addition, relatively few (less than I%) of the total number of microbes present in nature
are available in culture (Ward et al., 1990; Amann et al., 1995). A microbial mat is a
highly complex assemblage of organisms possessing many different modes of
metabolism, all of which are interacting with each other at some level in beneficial and/or
competitive ways. The end products of the metabolism of one group of organisms
frequently constitute the substrates of another. These considerations argue for an
alternative approach in which the entire microbial ecosystem is subjected to the
experimental manipulation.
To attain several key objectives in astrobiology, we must understand better the
mechanisms and rates at which trace gases are produced and consumed by microbial
ecosystems. As dominant components of our biosphere for at least 2 billion years of its
more than 3.5 billion year history, microbial mats played a pivotal role in shaping the
composition of Earth's early atmosphere, including its eventual oxygenation. NASA's
present search strategy for the detection of life on extrasolar planets includes the
observation and interpretation of spectral features of biogenic gases in remote
atmospheres (Caroff and Des Marais, 2000; Des Marais et al., 2001). However, the
current strategy relies principally upon the detection of O2, and thus might preclude the
detection of life that might resemble our own pre-oxygenated biosphere for as much as 2
billion years of its early existence. Clearly, the rates of production and consumption of
reduced gases by microbial communities over geologic time must be better constrained in
order to enhance our search for life elsewhere. The use of simulation facilities, such as
the greenhouse described here, will augment that endeavor.
4

4
Bebout, et al.
We report here on our attempts to maintain intact modern photosynthetic microbial mats
under approximate in situ conditions, and to monitor the responses of these mats to
experimental manipulations. We have constructed a facility in which photosynthetic
microbial mats can be maintained over long periods of time, using natural illumination
and realistic water flow and other environmental conditions. We describe here the results
of our first experiment, in which we used this facility to manipulate the salinity of water
overlying the mats. As variations in salinity also occur in the natural environment where
these mats were collected, we are able to assess on the degree to which our experimental
facility can reproduce naturally occurring phenomena. Future uses of this experimental
system, in which conditions not presently found in the modern environment will be
simulated, are discussed.
Materials and Methods
Field Site
Microbial mats were collected in salterns managed by the salt producing company
Exportadora de Sal. S.A. de C.V., located on the Pacific Ocean side of the Baja
peninsula, Baja California Sur, Mexico. This field site has been previously described in
detail (Des Marais, 1995). Briefly, lagoon water, having a salinity of ca. 40 parts per
thousand (%o) is pumped through a series of concentrating ponds, or Areas, and then
crystallizing, ponds, or Vasos. The salinity of the water is gradually raised until it
becomes saturated with respect to sodium chloride, at which point the brine is pumped
out of the crystallizing pond, and the salt is harvested. Extensive and well-developed
microbial mat growth occurs in concentrating areas in which the salinity is between
approximately 65 %0 and 130 %0.
Microbial mats were collected on May 27, 2000 from two localities: Area 4, near the dike
separating Area 4 from Area 5 (27 ° 41.3450'N, 113 ° 55.0270'W) and Area 5, near the
dike separating Area 5 from Area 6 (27 ° 44.4140'N, 113 ° 54.7950'W). At the time of
the collection, the salinities of the Area 4 and Area 5 were ca. 90 %o, and ca. 120 %0
respectively. Microbial mats in both of these locations are ca. 5 cm thick and are well
laminated. The dominant cyanobacterium of the mat community is Microcoleus
chthonoplastes. Sections of mat ca. 20 cmx 25 cm were cut and removed from the
bottom of the concentrating pond by divers using metal spatulas and were immediately
placed into tight fitting black acrylic trays. In this way, exposure of the deeper anaerobic
layers of the mats to air was minimized. Mats were covered with relatively high salinity
water (180 %o) overnight in an effort to slow overall metabolic rates for transport. The
trays containing the mats were then transported by vans back to our laboratory in larger
plastic trays covered by tight fitting plastic film. In this way, the mats were kept moist
but not covered with water, and were exposed to some natural light over the ca. 48 hours

Bebout,etal.
requiredfor therelocation. Although6matsfrom Area5 and12matsfrom Area4 weremaintainedin thegreenhousethroughouttheentireexperiment,resultsfrom only theArea4 matswill bepresentedhere.
Greenhouse Facility
Upon arrival at Ames Research Center, the mats were transferred to a greenhouse
modified for these experiments by replacing the original glass with ultraviolet transparent
OP-4 acrylic (transmission in the UV-B, UV-A, and visible ca. 90% in the greenhouse).
Mats were placed onto a specially built table (Figure 1) having six clear acrylic flow
boxes, each flow box holding three trays of mat. Brine used for the experiment was
collected from one of the higher salinity concentrating areas that had retained its original
complement of seawater solutes, and diluted with deionized water to the appropriate
salinity. Mats were arbitrarily assigned to one of two salinity treatments on the table.
Three of the flow boxes recirculated brine collected from the field site, and diluted to the
in situ salinity of 90 %0 (hereafter referred to as the NORMAL salinity treatment), the
other three flow boxes recirculated brine having an elevated salinity of 120 %0 (hereafter
referred to as the HIGH salinity treatment). Water was recirculated from a single
reservoir holding 60 liters of brine through the three interconnected flow boxes which
constituted each of the two salinity treatments. The flowboxes assigned to each of the
salinity treatments were interspersed on the table, so that the treatments alternated, e.g.,
NORMAL, HIGH, NORMAL, etc. Salinity was maintained at these levels over the
course of the experiment with additions of deionized water to replace losses due to
evaporation. Temperature control of the air in the greenhouse was achieved with a
combination of an evaporative cooler and propane heater. Precise temperature control of
the water being recirculated over the mats was achieved by circulating temperature-
controlled water through titanium heat exchanging coils submerged in the reservoirs.
Normal in situ daily water column temperature variations were simulated in the
greenhouse.
Environmental Data
Water column salinity was determined using a refractometer (Delta model, Bellingham +
Stanley, Tunbridge Wells, UK), corrected for temperature effects at each reading.
Temperature was recorded at 10 minute intervals throughout the experiment using data
loggers (StowAway TidbiT, Onset Computer Corporation Bourne, Massachusetts, USA).
Light was monitored, and averaged at 10 minute intervals, using a data logger coupled to
a terrestrial quantum sensor (LI-1000 and LI-192SA, LI-COR, Inc., Lincoln, Nebraska,
USA).

Bebout,et al.
Greenhouse Oxygen Microelectrode Measurements
Oxygen concentrations within the microbial mats were monitored at various times
throughout the course of the experiment using oxygen microelectrodes. We used Clark-
type microelectrodes incorporating guard cathodes (Diamond General 737-GC, Diamond
General Development Corporation, Ann Arbor, Michigan, USA). In the initial phase of
the experiment, microelectrodes were positioned using motorized micromaniupulators
mounted to bases placed across the flow boxes. Halfway through the experiment, the
microsensors were transitioned to a positioning system using a robotic XYZ positioning
system installed over the flow boxes. In all cases, the positioning was controlled by, and
data acquired with, custom software written in the LabVIEW programming environment
(National Instruments Corporation, Austin, Texas, USA). Oxygen microelectrode signal
output was calibrated to oxygen concentrations using a two point calibration; the output
of the electrode at oxygen concentrations of zero was provided by the asymptotic
minimum of electrode current within the lower parts of the mat, the electrode current in
the overlying water was taken to represent the air-saturated oxygen concentration at that
temperature and salinity, using published values. In general, the electrodes were
advanced within the mat at 100 micrometer steps.
In situ Microelectrode Measurements
Measurements of in situ concentrations of oxygen within the microbial mat were made
using a diver operated microprofiler (Unisense, 3_rhus, Denmark) at 100 micrometer
intervals. Calibrations of the oxygen electrode were performed as described for
greenhouse microelectrodes (above).
Community Composition Analyses
Light Microscopy
Microbial community composition was followed throughout the course of the experiment
using a variety of techniques. First order observations about the community were made
using light microscopy (Nikon Microphot FX/A, Nikon USA)
Cyanobacterial 16S rRNA gene fingerprints by PCR/DGGE
Cores (10 mm in diameter) were taken from the microbial mats on 9/15/00, and the
photic zone (top 3 mm) was aseptically removed. The samples were homogenized in a
Tenbroeck tissue grinder (VWR Scientific Products, Brisbane, California, USA). Cell
lysis and DNA extraction was performed as previously described (Nfibel et al., 1997). In
short, the homogenized samples were frozen and thawed repeatedly, followed by
incubation with 1% sodium dodecyl sulfate and proteinase K. DNA extraction was
performed using hexadecylmethylammonium bromide (CTAB) in conjunction with
phenol:chloroform:isoamyl alcohol (25:24:1), followed by isopropyl alcohol
precipitation. Cyanobacterial/plastid specific PCR amplification was carried out using the

Bebout,etal.
oligonucleotideprimersCYA359F (with a40-nucleotideGC-richsequenceat the5' end)andCYA805Rwereusedfor specificamplificationof 16SrRNA genesfromcyanobacteriaandplastids(Niibel et al., 1997). Each50-laLPCRreaction(5 laLof 10XTakara Ex Taq TM PCR buffer (PanVera Corporation, Madison, Wisconsin, USA), 4 gL
of Takara dNTP mixture (2.5 mM each), 50 pmol of each primer, 200 _g of BSA, 10 ktL
of 5X Eppendorf TaqMaster TM PCR-enhancer (Brinkmann Instruments, Inc., Westbury,
New York, USA), and 15 ng of DNA extract. Thermocycling) was performed using a
Bio-Rad iCycler TM thermal cycler (Bio-Rad Laboratories, Hercules, California, USA).
After an initial denaturation at 94 °C for 5 min (hot start), 2.5 units of Takara Ex Taq TM
DNA polymerase was added to the reaction at 80 °C. 35 cycles of 1 min each at 94 °C
(denaturation), 60 °C (annealing), and 72 °C (extension) were performed and the reaction
finished with a final extension at 72 °C for 9 min. Gels were imaged using a Bio-Rad
Fluor-S TM Multilmager system. For DGGE band sequencing, each band was excised
using a sterile scalpel and DNA allowed to diffuse out for 3 d at 4 °C in 50 _L of 10
mM Tris buffer. 1 gL of the solution was PCR amplified using the same primers,
reaction mixture and thermocycling conditions. A kit was used to purify PCR product
(Qiagen, Inc., Valencia, California, USA) and 150 ng was commercially sequenced in
two separate reactions (5' to 3' and 3' to 5'). Complementary sequences were matched,
aligned, and edited using Sequence Navigator (Applied Biosystems, Foster City,
California, USA) and submitted to the BLAST search engine (National Center for
Biotechnology Information, www.ncbi.nlm.nih.gov) for phylogenetic matching.
Lipid Biomarker Analysis
Gas chromatographic profiles of fatty acids (FA) (as fatty acid methyl esters, FAME)
were used to monitor changes in group-specific biomarker compounds in the surface
layers of the mat community. Sections ca. 25cm 2 and 1 cm in depth were removed from
the greenhouse mats on 9/15/00 and immediately dissected. Samples for fatty acid
analysis were taken from freshly collected mats at the field site in November of 1998 and
June, 2001 for comparison. The flocculent orange material on the surface of the mat was
removed by scrapping the surface with a spatula. An exposed leathery layer of the mat,
containing extremely high densities of the filamentous cyanobacterium Microcoleus
chthonoplastes (hereafter called the Microcoleus layer), approximately 1-1.5mm thick,
was then separated using a razor blade from the darker colored gelatinous material that
composes the under mat. The three samples were frozen and freeze-dried. Field
collected mats were dissected shortly after collection (November, 1998 and June, 2001)
in Guerrero Negro, frozen and returned to Ames. The dried mat layers were ground
using a glass mortar and pestle. Total lipid extracts were prepared by a Bligh and Dyer
(B&D) single-phase modification (Jahnke et al., 1992). Multiple extractions of the cell
material recovered by centrifugation were done until no further pignnent coloration was
apparent (normally 4X to 5X). A polar fraction (phospholipids and some glycolipids)

Bebout,et al.
waspreparedby precipitationin cold acetone.Theremainingacetonesolublelipids wereseparatedby thin layerchromatographyusingamethylenechloridesolventsystem(Jahnkeet al., 1992). Theremainingglycolipidsin theorigin zone(0-1cm) andthesterols(ca.2.5-3.5cm)wererecoveredfrom thesilica gelby B&D extraction.Thepolarlipid fractionswerepooledandfatty acidmethyl esters(FAME) preparedby amildalkalinemethanolysisprocedure(Jahnkeet al., 2001). GC-MS analysesof FAME orsterolsasTMS (trimethylsilyl) esterswerepreformedusinganHP 5890gaschromatographequippedwith aJ&W DB-5ms(30m by 0.25mm, 0.25p.mfilm)capillarycolumnandanHP 5971mass-selectivedetector. Identificationof individualcompoundswasby acombinationof standardcompounds,publishedspectraandrelativeretentiontimes.FAME andTMS esterswerequantifiedusinganAgilent 6890gaschromatographequippedwith anFID andHP-5(30 m by 0.32mm, 0.25gmfilm)capillarycolumn. Methyltricosanoate(FAME) or tetracosanol(sterol)wereusedasinternalstandards.Chromatographswereprogrammedto operatefor FAME at 60° to120°Cat 10°C/min,thenat 2°C/minfrom 120° to 280°C,andfor sterol-TMSat 60° to200°Cat 10°C/min,thenat 4°C/minfrom 200° to 300°C,holdingfor 10min. Totalorganiccarbon(TOC) andstableisotopecomposition(813Cand815N)for biomasswasdeterminedusingaCarloErbaCHN EA1108elementalanalyzerinterfacedto a FinniganDeltaPlusXL isotoperatiomassspectrometer(Jahnkeet al., 2001).
Fluxes of Oxygen Estimated by Microsensor Measurements
Net flux across the mat surface was calculated according to Fick's first law of diffusion
(Berner, 1980) as (c3C/cqX)DP, where 0C/c3X is the slope of the change in oxygen
concentration with depth across the mat surface in gM/lam, D is the diffusion coefficient
(cm 2 s 1) and P is mat porosity. DP within the mat was estimated as follows. For each
salinity treatment, a high-resolution (50 gm step) vertical profile through both the DBL
and the mat was made. D in the DBL was determined based on salinity and temperature
of the water column at the time of the profile. Since P in water is 1 by definition, DP in
the DBL is known. DP in the mat was then estimated as (0C/0X)DP (in DBL)/(0C/0X)
(in mat). Mat DP estimated in this way was similar to published values, approximately
10 -6"
Fluxes of Oxygen, Dissolved Inorganic Carbon, Methane, and Hydrogen
Fluxes of oxygen (02) and dissolved inorganic carbon (DIC) between the mats and the
overlying water were measured using glass benthic flux chambers that allowed
unimpeded illumination of the surface, with no appreciable (<1 °C) heating of the
chamber. The chamber design and operation follows that of Canfield and Des Marais
(1993). Briefly, each glass chamber (covering an area of mat ca. 0.019 or 0.012 m 2) was
fitted with a central stirring paddle and two sampling ports with septa. The glass paddle
rotated at a constant rate of 4.5 revolutions per minute. Chamber incubations were
9

Bebout,et al.
conductedfor full 24-hourdaily cycles,taking samplesby syringeeverysix hours. Whendeployedat sunrise,eachchamberwasinjectedwith ca.100ml purenitrogen(N2)gastocreateaheadspaceto sampleat noonandbeforesunsetfor acquisitionof gassamples(02, CH4, H2, etc.). At sunset, each chamber was redeployed and injected with 70 ml N2
and 30 ml 02 to accommodate 02 demand during the night. Samples were taken at
midnight and before sunrise. Dissolved and headspace 02 were measured using a Clark
style electrode with an internal reference mounted inside a 21 gauge syringe needle
(model 768, Diamond General Development Corporation, Ann Arbor, Michigan, USA)
and a gas chromatograph, respectively. The gas chromatograph (Shimadzu GC-14A) was
fitted with a thermal conductivity detector and a CTRI column (Alltech Associates,
Deerfield, IL, USA) held at 25°C. Helium, at flow rate of 30 ml/min, was the cartier gas.
DIC samples (5 ml) were filtered and analyzed in triplicate using a "flow injection
analyzer" (Hall and Aller, 1992), where a sample was injected into an acidified aqueous
solution that subsequently flows past a gas-permeable membrane. Carbon dioxide from
the acidified DIC sample traverses this membrane and enters an alkaline solution that
subsequently flows through a conductivity detector.
Hydrogen Partial Pressures
While actively photosynthesizing, mats generate small (approx. 1pL)bubbles that are
retained at the mat surface with residence times of tens of minutes. These bubbles were
collected by means of a 3-mL plastic syringe with a plastic pipette tip lodged in the luer
fitting (flaring outward, to form a collecting funnel). When filled with water and
submerged, this apparatus allows individual bubbles to be picked from the mat surface,
without atmospheric contamination, and pooled to a volume of 10-25 pL. The pooled
bubble gas is immediately subsampled with a gas-tight volumetric syringe and quantified
by GC with HgO-reduction detection (Trace Analytical RGA-3, Sparks, MD, USA). The
time from sample collection to analysis was generally <30s. Partial pressures in bubble
samples were determined by comparison with standards prepared by serial dilution of
pure H2 into N2 (Hoehler et al., 1998). Precision and accuracy are typically about + 5%
for sample volumes in the range of 10-25 gL.
Results
The Greenhouse Facility as a Simulation of the Natural Environment
Microbial mats kept in the greenhouse facility retained an overall appearance remarkably
similar to that of freshly collected mats. In particular, no evidence of the mat "greening",
in which motile cyanobacteria migrate to the surface of the mat (Bebout and Garcia-
Pichel, 1995), was apparent. During the first few weeks of greenhouse incubation, there
was a notable increase in the abundance of loosely attached microbial "floc" at the
surface of the mats, as well as the development of small dark green spots containing large
10

Bebout,et al.
numbersof cyanobacterialfilamentsin somemats. However,afterthefirst two months,the loosefloc disappeared, and the mat surface was smooth and homogeneous in
appearance once again. Microscopic observations revealed no major changes in
community composition. More specifically, the major populations of cyanobacteria did
not seem to change, and Microcoleus chthonoplastes remained the dominant phototroph,
in terms ofbiovolume.
Molecular analyses based on 16S rRNA genes through DGGE fingerprinting were
consistent with this absence of significant shifts in the community. The banding pattern
of DNA extracted from the greenhouse mats was essentially identical to that of freshly
collected mats (Figure 2). Two major bands were present in all of the mat samples (Band
b and Band c). In the greenhouse treatments (Figure 2A), Band c represented 84% of the
observed cyanobacterial diversity, gauged as the percent o f total PCR amplificate, while
Band b represented 10%. These results are consistent with the structure of field samples
(Figure 2B) where Band c represented 79% of the observed diversity, with Band b
accounting for 18%. Two other minor bands were found, but not in all treatments. Band
a was present in three of the six greenhouse samples and in the field samples, accounting
for 3% and 2% of the observed diversity, respectively. Band d was found in all six
greenhouse samples at much lower levels (0.8%), and accounted for 1.2% of the observed
diversity in the field samples. BLAST similarity searches for the sequenced bands (c.a.
380 bp in length) were performed. Band b had no close matches to any cultured
cyanobacterium (only 89% similar to Oscillatoria amphigranulata strain 23-2, a typical
distance between bacterial genera), but did match an unidentified, uncultured
cyanobacterium from a microbial mat in Solar Lake, Sinai Peninsula, Egypt (Abed and
Garcia-Pichel, 2001) with 94% similarity. The BLAST results for the remaining two
bands both yielded very high similarity (99%) to known cultured cyanobacteria. Band c
matched the Microcoleus chthonoplastes cluster (Garcia-Pichel et al., 1996) and Band d
matched Euhalothece sp. Strain MPI 95AH13 (Garcia-Pichel et al., 1998). Even though
we were unable to sequence Band a, it most likely represents a diatom plastid (according
to previous research and band placement in the denaturant gradient).
The composition of the total esterified fatty acids (TEFA) in natural and greenhouse mats
were in most respects similar for both the surface and underlying Microcoleus layer
(Table 1). The amount of TEFA recovered for the individual mat samples were
reasonably consistent. The majority of this TEFA consisted of n-16:0, n-16:1 and n-18:1
which together accounted for 60 to 77% of all FA. Smaller amounts of other straight
chain saturated and unsaturated FA (i.e. n-14:0, n-17:0, n-18:0, n-17:1, n-20:l, n-20:2)
together with various terminally branched FA (i-14:0, i-15:0, ai-15:0, #16:0, i-17:1, i-
17:0, ai-17:0) were present in relatively uniform amounts in all samples. However,
subtle differences for TEFA compositions in the surface layer and underlying
11

Bebout,et al.
Microcoleus layer of natural mats were noted that were also apparent in the greenhouse
mats even after 4 months of experimental treatment (Figure 3). The surface layer tended
to have higher levels iso- 15:1 and iso- 16:1 than the Microcoleus layer. In natural mat,
these two iso-FA were composed primarily (90%) of 04 positional isomers, previously
identified in field collected Nostoc spp. (Potts et al., 1987). All surface layers (in both
natural and greenhouse mats) also contained small amounts ofanteiso-17:1 which was
not detected in the Microcoleus layer. The most striking difference in the surface layer,
however, was the presence of relatively large amounts of several polyunsaturated fatty
acids (PFA) (n-16:2, n-18:2, n-18:3, n-18:4,n- 20:4 and n-20:5). The more highly
unsaturated C20 FA, however, are generally considered diatom biomarkers (Cobelas and
Lechado, 1989). The lower Microcoleus layer was also considerably enriched in several
fatty acids. Most pronounced were a 10-methyl-16:0 associated with some sulfate-
reducing bacteria (Dowling et al., 1986; Kohring et al., 1994) and a cy-19:0 which has
been used as a biomarker for Thiobacillus spp. (Kerger et al., 1986). In addition,
microbial mats maintained in the greenhouse retained the carbon and nitrogen stable
isotopic composition of recently collected mats (Table 1)
Measurements of rates of biogeochemical cycling in greenhouse mats were, in general,
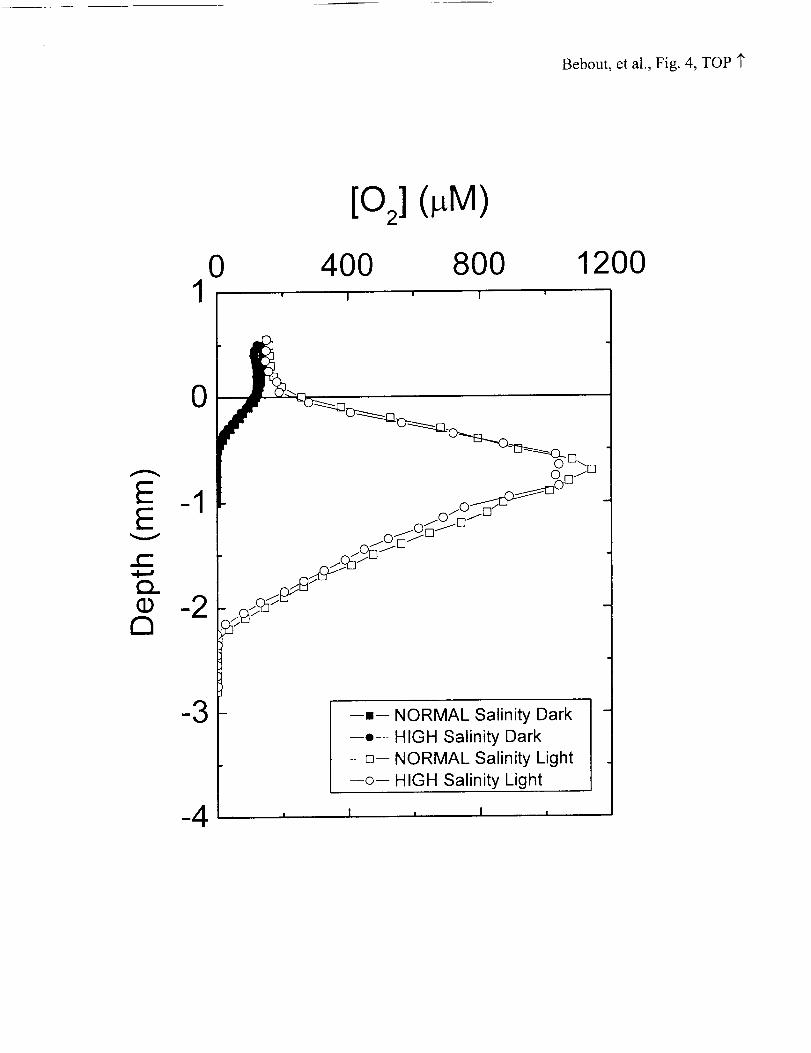
very similar to rates measured on freshly collected mats. Profiles of oxygen
concentration within the greenhouse mats resembled those obtained in situ, both in
absolute concentration and distribution with depth (Figure 4). Oxygen fluxes to the water
column, calculated from the gradients of these profiles, agreed with oxygen fluxes
calculated from in situ profiles over a wide range of light intensities (Figure 5).
Similarly, net rates of 02 and DIC production and consumption as determined using flux
measurements were similar to those measured in freshly collected mats (Table 2), after
allowances are made for the relationship between rates of photosynthesis and seasonally-
dependent levels of illumination in the greenhouse. Fluxes of methane from the
greenhouse mats were reduced slightly (60%) from those in freshly collected mats and
were essentially equal day and night (Table 2). In gas bubbles collected at the mat
surface, H2 partial pressures in the low salinity control mats are very similar to those
observed in the field (Table 2).
The Greenhouse as a Facility for Experimental Manipulations
Over the course of the experiment, dramatic differences in the appearance of mats
maintained at in situ ("NORMAL" = 90 %0) and elevated ("HIGH" = 120 %o) salinities
became apparent. Mats held at high salinities assumed a much more orange color than
those incubated at lower salinities. A change in color can be due either to physiological
(photopignnent) changes in an unchanged community or to population shifts. It is known
that increased salinity promotes increasingly oxidative conditions (Garcia-Pichel et al.,
1999) and that Microcoleus chthonoplastes can respond to increased salinity by
12

Bebout,etal.
increasingthecellularlevelsof carotenoid(Lopez-Cortes,1990). Importantly,however,in naturalfield matsyellow orangematsaretypically associatedwith dominanceofcyanobacteriafrom theHalothece cluster. Microscopic observations revealed a relative
increase in the abundance of unicellular cyanobacteria resembling the Halothece type at
the surface of the mat.
Initial DGGE analyses supported this observation, with a faint novel band attributable to
Halothece appearing in samples collected from all three HIGH salinity greenhouse mat
samples (data not shown). However, these initial DGGE samples had been compromised
by an accidental thawing. The second set of samples, taken at the same time but not
thawed before DNA extraction, did not show this band (Figure 2). Rather, this second set
of samples showed similar fingerprints for all greenhouse samples, regardless of the
treatment. Upon further investigation, we found that thawing and re-freezing of mat
samples before DNA extraction caused the preferential breakage of large-celled M.
chthonoplastes, and the subsequent degradation of its DNA. Because M. chthonop[astes
provides the majority of template for PCR amplification, DGGE analyses of samples that
had been thawed yields a high-resolution fingerprint of the community members present
at low density. It was in such analyses that we could detect community shifts in the form
of new bands appearing in all high salinity greenhouses, but in none of the other (data not
shown). Sequencing and phylogentic analyses of these novel bands revealed that the new
community members belonged to the Halothece Cluster of extremely halotolerant,
unicellular cyanobacteria. Thus we may have been witnessing an incipient community
shift, but not a full replacement of the principal cyanobacterial populations.
In contrast, lipid biomarker analyses cannot support an increase in the abundance of
Halothece spp. in greenhouse mat surface samples. Due to the development of a thicker
flocculent surface layer in the higher salinity mats, total organic carbon (TOC) in the
surface layer was greater in the HIGH salinity mats. The flocculent surface layer of the
HIGH salinity mats yielded 1.9 mg of TOC per cm 2 mat surface (vs. 1.6 mg for the
NORMAL salinity mats). We have identified two polyunsaturated FA, n-16:2 and _-
18:2, in a GN isolate, Halothece sp. MPI95P605 (unpublished result). Although diatoms
also synthesize 16:2 FA, these organisms tend to have higher amounts of 16:3 and/or
16:4 and rarely 18:2 FA (Cobelas and Lechado, 1989). The absence of more highly
unsaturated C16 PFA suggests that 16:2 and 18:2 may serve as a biomarker for the
Halothece in the surface layers. Both 16:2 and 18:2 FA were reasonably consistent in
both greenhouse treatments. Together these PFA account for 2.00 mg FA grn_TOC in
both greenhouse samples which is a value only slightly higher than either dour natural
mat samples (ca. 1.5 mg gm-l). However, it should be emphasized that not all
cyanobacteria synthesize PFA (Kenyon, 1972; Murata et al., 1992), and these analyses do
not necessarily preclude increased abundance ofHalothece spp. lacking these PFA. An
13

Bebout,et al.
increasein thediatompopulationin theHIGH salinitymatswasmorereadilydocumentedby increasedamountsof two diatombiomarkers,thepolyunsaturatedFA,20:4and20:5,andthesterolcomposition.The20:4and20:5togetheraccountedfor 4.38mg gmlTOC in theHIGH salinitymatsandonly 3.16mg grn-lTOCin theNORMALsalinitymats. Bothof thesevaluesareconsiderablyhigherthanthenaturalmatsamples(ca.0.6mg grn-l).
In generalit is thoughtthatbacteriarespondto highersalinityby synthesizingfatty acidswith lesssaturationandlessbranchingin orderto decreasemembranefluidity (Russell,1993),however,in ahalotolerantmicroalga,Dunaliella salina, growth at higher salinity
is associated with an almost 50% increase in the proportion of 18:3 (A1-Hasan et al.,
1987). The increase in this PFA is associated with the mono- and
digalactosyldiacylglycerols which predominate in photosynthetic membranes. Sterols, a
direct indication of the presence of microeukaryotes in these mat samples, were also more
abundant in the HIGH salinity treatment with 1.20 mg grn l vs. 0.74 mg gm 1 for
NORMAL. The two sterols that serve as diatom biomarkers, 24-methylcholesta-5-en-
31301 and 24-methylcholesta-5, 22-dien-313ol, (Volkman, 1986) accounted for ca. 80% of
the total in both greenhouse samples.
There were no differences observed in oxygen profiles in the NORMAL and HIGH
salinity mats (Figure 4). Fluxes of 02 were measured at the outset (June, 2000) of the
parallel treatment of the mats at two salinities, and five months later (November, 2000).
In both cases, no differences in 02 fluxes were apparent between the two salinity
treatments, either regarding the rate of export of 02 to the overlying water column during
the day, or in the uptake of O2 at night (Rates Data Table). In contrast, rates of methane
production from the NORMAL and HIGH salinity mats, which showed no difference for
the majority of time that the experiment was running, did appear to be different at the last
sampling (8-9 November, 2000) with higher rates recorded in the normal salinity
treatment. H2 partial pressure in photosynthetic surface bubbles from the HIGH salinity
mats was about half that in the NORMAL salinity mats.
Discussion
For a period of at least one year, microbial mats that were maintained in the greenhouse
facility resembled field collected microbial mats with respect to their overall appearance,
cyanobacterial community composition, and rates of biogeochemical cycling. High rates
of activity and fast doubling times of microbial populations contribute to the adaptability
of these ecosystems, however these attributes also make mat systems especially
challenging to preserve in their original, natural states. The phenomenon known as
"greening" in which motile cyanobacteria migrate to the surface of the mats, and remain
14

Bebout,et al.
therein responseto loweredirradiance,is commonin matsmaintainedunderartificialillumination(BeboutandGarcia-Pichel,1995). Microbial matsremovedfrom theirnaturalenvironment,andmaintainedin largeoutdoorpondsbecame"overgrown"withpopulationsof cyanobacteriathatarenot necessarilywell-representedin situ (Abed and
Garcia-Pichel, 2001 ).
The greenhouse mats described here appear to retain rates of biogeochemical processes
very similar to those measured in freshly collected mats. Oxygen microprofiles,
measured using microelectrodes, and oxygen and carbon fluxes, measured using flux
chambers, are very comparable in greenhouse, and freshly collected natural mats. While
it is reassuring to observe this similarity in mat net community metabolism, it is likely
that these parameters are among the least sensitive to change as measurements of net
carbon and oxygen flux integrate the rates of metabolic activity of most of the
microorganisms in the community. Increases in the activity of one group of
microorganisms may be compensated for by decreases in the activity of others. More
worthy of note, perhaps, is the close similarity between greenhouse and in situ bubble H2
partial pressures. Hz partial pressures in bubbles are extremely sensitive to changes in the
environment of photosynthesis in the uppermost mat layer. For example, mats removed
from their native pond and placed under conditions of high solar irradiance and low or no
water flow frequently exhibit an increase in bubble H2 partial pressures of up to 2 orders
of magnitude. The combination of light and flow regimes appears to exert strong and
instantaneous control on bubble H2 partial pressures by setting the balance between
diffusive DIC supply and light intensity (Lambert and Smith, 1980; Houchins, 1984).
The fact that little or no difference is apparent between greenhouse and natural mats
suggests that the basic flow and light regimes of the natural environment are recreated to
a very high degree in the greenhouse setting.
We believe that the greenhouse approach documented here is among the most successful
of the efforts to date to produce an environment appropriate for the long term study of
these important microbial communities. When compared to previous efforts to maintain
microbial mats, our results indicate that two factors are likely to be more important than
others in simulating the field environment, namely water flow and the light regime.
A very thin (ca. 0.5 ram) layer of stagnant water, the diffusive boundary layer (DBL), is
situated at the interface between any microbial mat community and the water column,
even under conditions of high water flow (Jorgensen and Des Marais, 1990). The
transport of all solutes between the water column and the mat occurs exclusively by
molecular diffusion through the DBL, and so the thickness of this layer sets the rates at
which this exchange may take place. Rates of activity, including rates of primary
production in microbial mat communities, may be controlled by the rate at which carbon
15

Bebout,et al.
dioxideandoxygendiffuseacrosstheDBL (Garcia-Pichelet al., 1999). In thegreenhousefacility, wateris constantlycirculatedoverthemats,atenvironmentallyrealistic flow velocities,usingpumpshavingceramicimpellers. Thesimilarity ofgreenhouseO2concentrationprofiles,02 fluxes,andDIC fluxes to thosemeasuredin situ
suggests that the greenhouse flume system closely reproduces the environmental flow
field and DBL control on mat-water solute exchange. Microelectrode-based
measurements of DBL thickness in situ and in greenhouse flumes confirm this finding
(Figure 4).
In photosynthetic microbial mats, all of the energy necessary for growth and maintenance
of the community is ultimately derived from the sun's radiant energy. Therefore, these
mats are highly sensitive to the intensity and spectral composition of photosynthetically
available radiation at the mat surface. Furthermore, many mat microorganisms are
motile, utilizing light and/or ultraviolet radiation as a cue to adjust their position in the
mats vertically (Castenholz, 1994; Bebout and Garcia-Pichel, 1995). Therefore, oxygen
production and consumption by these phototrophic organisms, as well as their sensitivity
to ultraviolet radiation, determine the physical structure of the entire mat community.
Mats maintained in the greenhouse facility have access to natural solar radiation. The use
of artificial illumination to drive photosynthetic activity in microbial mats over longer
periods of time is less attractive from a logistical perspective due to the large amounts of
heat that is generated. Sources of artificial light rarely reproduce the intensity at the mat
surface and even more rarely reproduce the spectral composition of natural sunlight. For
both of these reasons, the use of natural sunlight is preferred for the maintenance of these
microbial communities. Use of a greenhouse facility for microbial mat maintenance is
also the most cost effective way to deliver the required visible and ultraviolet radiation to
microbial mat communities, particularly when large areas of mat are required for
destructive sampling and/or large numbers of replicate measurements.
Future modification in greenhouse flow and light regimes may further improve our ability
to simulate the field environment. The one potentially significant difference in
community composition observed between greenhouse and natural mats, namely the
apparent increase in the abundance of diatoms in the surface layers suggested by the
FAME biomarker data, may, in fact, be explained by differences in the flow regime
experienced by mats incubated in the greenhouse relative to in situ conditions. In the
greenhouse, the flow of water over the mats, while reproducing natural flow velocities
and DBL thickness, occurs 24 hours a day. In the field environment, water flow over the
mats is primarily wind-driven and, as such, is variable over the course of the day. Strong
winds are characteristic of the afternoon; as rising warm air is replaced by strong onshore
breezes. At night, and into the morning, there is very little wind and therefore, very little
flow of water over the mats. Recently, we have documented a density stratification of the
16
Bebout,et al.
pondsat night. Thisdensitystratification,in combinationwith highratesof oxygenconsumptionby themat,resultsin a layerof anoxicbottomwaterseveralcentimetersthick thatpersistsuntil latein themorning(ScottR. Miller, unpublisheddata). Hydrogensulfide,producedin thematby sulfatereduction,reacheslevelsin excessof 185/aMinthis layer(Bo Thamdrup,unpublisheddata).Additionally, we recentlydocumentedthattemperaturesatthematsurfaceareoftenseveraldegreeshigherthanthosein themiddleof thewatercolumn,andthosewhichwehavebeensimulatingin thegreenhouse.This ispresumablydueto greaterheatretentionby thesedimentsunderlyingthemicrobialmatsin their naturalenvironment.Constantflow over thegreenhousematswould tendtodiffuseheatfrom thesurfacelayersof themat,resultingin temperatureslower thanthoserecordedin situ.
The lack of exposure to anoxic, sulfidic water at night, as well as greenhouse water
temperatures lower than those experienced by the mats in situ, would tend to increase the
abundance of diatoms relative to unicellular cyanobacteria in the surface layers of the
greenhouse mats. The photosynthetic performance of the diatoms may be inhibited in
situ as a result of the sulfide sensitivity of oxygenic photosynthesis (Oren et al., 1979).
Unicellular cyanobacteria from microbial mats are well known to grow optimally at
relatively high temperatures (Dor and Paz, 1989; Garcia-Pichel et al., 1998). Future work
in the greenhouse will investigate the extent to which periodic and/or nighttime periods
of low flow, as well as periodic higher temperature excursions, might reduce the
propensity of the diatoms to dominate the surface layers of the mat.
The microbial mats in our greenhouse simulation facility represent a resource from which
we would like to obtain diverse observations and as much data necessary to address key
questions in ecology. In order to increase the accessibility of the greenhouse to members
of the research group, the facility is being transformed into a "collaboratory". The
collaboratory will enable a geographically distributed group of scientists to plan
experiments, operate scientific equipment, take experimental measurements, share
results, and collaborate in real time with remote colleagues. Within the collaboratory,
intelligent software agents will assist in the experimentation process, controlling the
hardware, troubleshooting, recording results, and reporting back to collaborating
experimenters. The XYZ positioning table over the mats is capable of automatically
positioning sophisticated instruments at any location over and within the mats. The
instrument package currently includes microelectrodes, a light sensor, chlorophyll
fluorometer, a surface detection device, and a fiber optic spectrometer. The positioning
system, and the instrumentation package is viewable over the internet
(http://greencam.arc.nasa.gov) via a webcam connected to a computer located in the
greenhouse. The advanced automation capabilities in the greenhouse will enable longer-
term experimentation, 24 hours a day, without the costs associated with extensive human
17

Bebout,et al.
supervision.Theremotecollaborationcapabilitieswill extendthis experimentalresourceto colleaguesnotphysicallypresentin thegreenhouse.
In summary,in additionto reproducingratesof in situ biogeochemical processes rather
closely, greenhouse microbial mats were responsive to manipulations of environmental
conditions. Increasing the salinity of water in the greenhouse facility reproduced some of
the community composition changes observed in natural mats growing at higher
salinities. The differences that were observed in the salinity responses of natural and
greenhouse mats may be consistent with expected differences between field and
greenhouse environmental conditions, e.g., differences in temperature and nighttime
oxygen and hydrogen sulfide concentrations. Therefore, we are optimistic that this
facility may now be used not only to maintain mats with natural levels of activity and
species composition, but also to explore environmental conditions that are not presently
found in the natural environment, e.g., low sulfate and low oxygen environments.
References
Abed, A. M. M. and Garcia-Pichel, F. (2001) Long-term compositional changes after
transplant in a microbial mat cyanobacterial community revealed using a
polyphasic approach. Environmental Microbiology, 3: 53-62.
A1-Hasan, R. H., Ghannoum, M. A., Sallal, A.-K., Abu-Elteen, K. H. and Radwan, S. S.
(1987) Correlative changes of growth, pigmentation and lipid composition of
Dunaliella salina in response to halostress. Journal of General Microbiology,
133: 2607-2616.
Amann, R. I., Ludwig, W. and Schleifer, K. H. (1995) Phylogenetic identification and in
situ detection of individual microbial cells without cultivation. Microbiological
Reviews, 59: 143-169.
Bebout, B. M. and Garcia-Pichel, F. (1995) UVB-induced vertical migrations of
cyanobacteria in a microbial mat. Applied and Environmental Microbiology, 61 :
4215-4222.
Bemer, R. A. (1980) Early Diagenesis: A Theoretical Approach. Princeton, Princeton
University Press.
Beukes, N. J. and Lowe, D. R. (1989) Environmental control on diverse stromatolite
morphologies in the 3000 Myr Pongola Supergroup, South Africa. Sedimentology,
36: 383-397.
Boon, J. J. (1984) Tracing the origin of chemical fossils in microbial mats:
Biogeochemical investigations of solar lake cyanobacterial mats using analytical
pyrolysis methods. In: Microbial Mats: Stromatolites. Y. Cohen, R. W.
Castenholz and H. O. Halvorson, Alan R. Liss, Inc., New York: 313-342.
18

Bebout,et al.
Canfield,D. E.andDesMarais,D. J.(1991)Aerobicsulfatereductionin microbialmats.Science, 251: 1471-1473.
Canfield, D. E. and Des Marais, D. J. (1993) Biogeochemical cycles of carbon, sulfur and
free oxygen in a microbial mat. Geochimica et Comochimica Acta, 57" 3971-
3984.
Canfield, D. E. and Teske, A. (1996) Late Proterozoic rise in atmospheric oxygen from
phylogenetic and stable isotope studies. Nature, 382:127-132.
L. I. Caroff and D. J. Des Marais, eds. (2000) Pale Blue Dot 2 Workshop: Habitable and
Inhabited Worlds Beyond Our Own Solar System. NASA Conference Publication
2000-209595.
Castenholz, R. W. (1994) Microbial mat research: The recent past and new perspectives.
In: Microbial Mats: Structure, Development and Environmental Significance. L.
J. Stal and P. Caumette. Berlin, Springer-Verlag. G 35" 265-271.
Cobelas, M. A. and Lechado, J. Z. (1989) Lipids in microalgae. A review. I.
Biochemistry. Grasas y Aceites, 40:118-145.
Des Marais, D. J. (1995) The biogeochemistry ofhypersaline microbial mats. Advances
in Microbial Ecology, 14:251-274.
Des Marais, D. J. and Canfield, D. E. (1994) The carbon isotope biogeochemistry of
microbial mats. In.' Microbial Mats: Structure, Development and Environmental
Significance. L. J. Stal and P. Caumette. Berlin, Springer-Verlag. G 35: 289-298.
Des Marais, D. J., Harwqitt, M., Jucks, K., Kasting, J. J., Lunine, J. L., Lin, D., Seager,
S., Schneider, J., Traub, W. and Woolf, N. (2001) Biosignatures and Planetary
Properties to be Investigated by the TPF Mission. Pasadena, CA, Jet Propulsion
Laboratory.
Dor, I. and Paz, N. (1989) Temporal and spatial distribution of mat microalgae in the
experimental solar ponds, Dea Sea area, Israel. In: Microbial Mats: The
Physiological Ecology of Benthic Microbial Communities. Y. Cohen and E.
Rosenberg. Washington, D.C., American Society for Microbiology: 114-122.
Dowling, N. J. E., Widdel, F. and White, D. C. (1986) Phospholipid Ester-linked fatty
acid biomarkers of acetate-oxidizing sulphate-reducers and other sulphide-
forming bacteria. Journal of General Microbiology, 132:1815-1825.
Garcia-Pichel, F., Ktihl, M., Ntibel, U. and Muyzer, G. (1999) Salinity-dependent
limitation of photosynthesis and oxygen exchange in microbial mats. Journal of
Phycology, 35: 227-238.
Garcia-Pichel, F., Ntibel, U. and Muyzer, G. (1998) The phylogeny of unicellular,
extremely halotolerant cyanobacteria. Archives of Microbiology, 169: 469-482.
Garcia-Pichel, F., Prufert-Bebout, L. and Muyzer, G. (1996) Phenotypic and phylogenetic
analyses show Microcoleus chthonoplastes to be a cosmopolitan cyanobacterium.
Applied and Environmental Microbiolog-y, 62" 3284-3291.
19

Bebout,etal.
Garret,P. (1970)Phanerozoicstromatolites:noncompetitiveecologicalrestrictionbygrazingandburrowinganimals.Science, 169:171 - 173.
Hall, P. O. J. and Aller, R. C. (1992) Rapid, small-volume, flow injection analysis for
ZCO 2 and NH4 + in marine and freshwaters. Limnology and Oceanography, 37:
1113-1119.
Hoehler, T. M., Alperin, M. J., Albert, D. B. and Martens, C. S. (1998) Thermodynamic
control on H 2 concentrations in an anoxic marine sediment. Geochimica et
Cosmochimica Acta, 62:1745-1756.
Hoehler, T. M., Bebout, B. M. and Des Marais, D. J. (2001) The role of microbial mats in
the production of reduced gases on the early Earth. Nature, 412: 324-327.
Holland, H. D. (1984) The Chemical Evolution of the Atmosphere and Oceans.
Princeton, Princeton University Press.
Houchins, J. P. (1984) The physiology and biochemistry of hydrogen metabolism in
cyanobacteria. Biochimica et Biophysica Acta, 768: 227-255.
Jahnke, L. L., Eder, W., Huber, R., Hope, J. M., Hinrichs, K.-U., Hayes, J. M., Des
Marais, D. J., Cady, S. L. and Summons, R. E. (2001) Signature lipids and stable
carbon isotope analyses of Octopus Spring hyperthermophilic communities
compared with those of Aquificales representatives. Applied and Environmental
Microbiology, 67:5179-5189.
Jahnke, L. L., Stan-Lotter, H., Kato, K. and Hochstein, L. I. (1992) Presence of methyl
sterol and bacteriohopanepolyol in an outer-membrane preparation from
Methylococcus capsulatus (Bath). J Gen Microbiol., 138:1759-1766.
Jorgensen, B. B. and Des Marais, D. J. (1990) The diffusive boundary layer of sediments:
Oxygen microgradients over a microbial mat. Limnology and Oceanography, 35:
1343-1355.
Jorgensen, B. B., Revsbech, N. P., Blackburn, T. H. and Cohen, Y. (1979) Diurnal cycle
of oxygen and sulfide microgradients and microbial photosynthesis in a
cyanobacterial mat sediment. Applied and Environmental Microbiology, 38: 46-
58.
Kenyon, C. N. (1972) Fatty acid composition of unicellular strains of blue-green algae.
Journal of Bacteriology, 109: 827-834.
Kerger, B. D., Nichols, P. D., Antworth, C. P., Sand, W., Bock, E., Cox, J. C.,
Langworthy, T. A. and White, D. C. (1986) Signature fatty acids in the polar
lipids of acid-producing Thiobacillus spp.: methoxy, cyclopropyl, alpha-hydroxy-
cyclopropyl and branched and normal monoenoic fatty acids. FEMS Microbiology
Ecology, 38: 67-77.
Kohring, L. L., Ringelberg, D. B., Devereux, R., Stahl, D. A., Mittelman, M. W. and
While, D. C. (1994) Comparison of phylogenetic relationships based on
phospholipid fatty acid profiles and ribosomal RNA sequence similarities among
20

Bebout,et al.
dissimilatorysulfate-reducingbacteria.FEMS Microbiology Letters, 119: 303-
308.
Lambert, G. R. and Smith, G. D. (1980) The hydrogen metabolism of cyanobacteria
(blue-green algae). Biology Review of the Cambridge Philosophical Society, 56:
589-660.
Lopez-Cortes, A. (1990) Microbial mats in tidal channels at San Carlos, Baja California,
Sur, Mexico. Geomicrobiology Journal, 8: 69-85.
Murata, N., Wada, H. and Gombos, Z. (1992) Modes of fatty-acid desaturation in
cyanobacteria. Plant Cell Physiology, 33: 933-941.
Ntibel, U., Bateson, M. M., Madigan, M. T., Kfihl, M. and Ward, D. M. (2001) Diversity
and distribution in hypersaline mats of Bacteria related to Chloroflexus spp.
Applied and Environmental Microbiology, 67" 4365-4371.
Nfibel, U., Garcia-Pichel, F. and Muyzer, G. (1997) PCR primers to amplify 16S rRNA
genes from cyanobacteria. Applied and Environmental Microbiology, 63" 3327-
3332.
Oren, A., Padan, E. and Malkin, S. (1979) Sulfide inhibition ofphotosystem II in
cyanobacteria (blue green algae) and tobacco chloroplasts. Biochimica et
Biophysica Acta, 546: 270-279.
Potts, M., Olie, J. J., Nickels, J. S., Parsons, J. and White, D. C. (1987) Variation in
phospholipid ester-linked fatty acids and carotenoids of dessicated Nostoc
commune (Cyanobacteria) from different geographoc locations. Applied and
Environmental Microbiology, 53: 4-9.
Reeburgh, W. S. (1980) Anaerobic methane oxidation: rate depth distributions in Skan
Bay sediments. Earth Planet. Sei. Lett., 47" 345-352.
Reid, R. P., Visscher, P. T., Decho, A. W., Stolz, J. F., Bebout, B. M., Dupraz, C.,
Macintyre, I. G., Pinckney, J., Paerl, H. W., Prufert-Bebout, L., Steppe, T. F. and
DesMarais, D. J. (2000) The role of microbes in accretion, lamination and
lithification in modem marine stromatolites. Nature, 406: 989-992.
Revsbech, N. P. and Jorgensen, B. B. (1986) Microelectrodes: Their use in microbial
ecology. Advances in Microbial Ecology, 9: 293-352.
Revsbech, N. P., Jorgensen, B. B., Blackburn, T. H. and Cohen, Y. (1983)
Microelectrode studies of the photosynthesis and 02, H2S, and pH profiles of a
microbial mat. Limnology and Oceanography, 28:1062-1074.
Russell, N. J. (1993) Lipids ofhalophilic and halotolerant microorganisms. In: The
Biology of Halophilic Bacteria. R. H. Vreeland and L. I. Hochstein. Boca Raton,
CRC Press: 165-210.
Schidlowski, M. (1988) A 3,800-year-old isotopic record of life from carbon in
sedimentary rocks. Nature, 333:313-318.
Visscher, P. T. and Kiene, R. P. (1994) Production and consumption of volatile
organosulfur compounds in microbial mats. In: Microbial Mats: Structure,
21

Bebout,et al.
Development,andEnvironmentalSignificance.L. J. StalandP.Caumette.Berlin, SpringerVelag: 279-284.
Visscher,P.T. andVanGemerden,H. (1991)Productionandconsumptionofdimethylsulfonioproprionatein marinemicrobialmats.Applied and
Environmental Microbiology, 57: 3237-3242.
Volkman, J. K. (1986) A review of sterol markers for marine and terrigenous organic
matter. Organic Geochemistry, 9: 83-99.
Walter, M. R. (1976) Stromatolites. Amsterdam, Elsevier Scientific Publishing Company.
Ward, D. M., Brassell, S. C. and Eglinton, G. (1985) Archaebacterial lipids in hot-spring
microbial mats. Nature, 318: 656-659.
Ward, D. M., Weller, R. and Bateson, M. M. (1990) 16S rRNA sequences reveal
numerous uncultured microorganisms in a natural community. Nature, 345: 63-
65.
Wilson, M. V. and Botkin, D. B. (1990) Models of simple microcosms: Emergent
properties and the effect of complexity on stability. Am. Nat., 135: 414-434.
Acknowledgents
This study was supported by grants form the NASA Astrobiology Institute, the NASA
Exobiology Program and the Ames Director's Discretionary Fund. The greenhouse XYZ
table was designed and constructed by Dan Andrews and Brian Koss, Code FE, NASA
Ames Research Center, and funded by the NASA Intelligent Systems Program.
22
Bebout,et al.
Figure Captions:
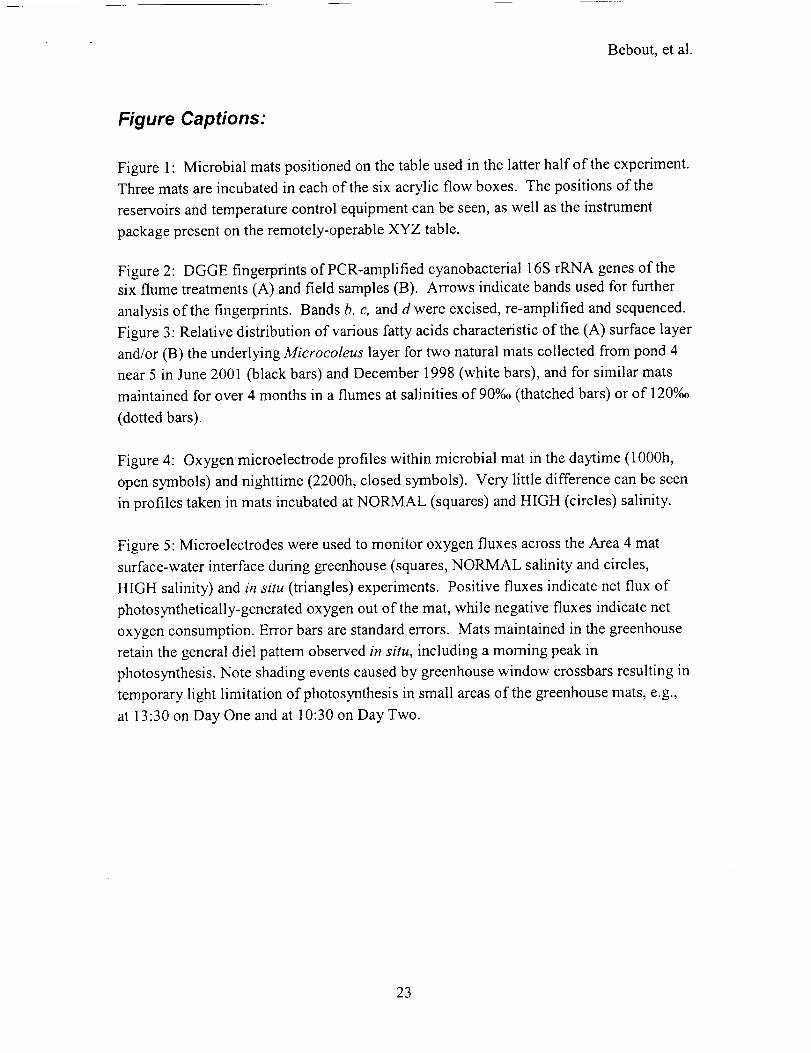
Figure 1: Microbial mats positioned on the table used in the latter half of the experiment.
Three mats are incubated in each of the six acrylic flow boxes. The positions of the
reservoirs and temperature control equipment can be seen, as well as the instrument
package present on the remotely-operable XYZ table.
Figure 2: DGGE fingerprints of PCR-amplified cyanobacterial 16S rRNA genes of the
six flume treatments (A) and field samples (B). Arrows indicate bands used for further
analysis of the fingerprints. Bands b, c, and d were excised, re-amplified and sequenced.
Figure 3: Relative distribution of various fatty acids characteristic of the (A) surface layer
and/or (B) the underlying Microcoleus layer for two natural mats collected from pond 4
near 5 in June 2001 (black bars) and December 1998 (white bars), and for similar mats
maintained for over 4 months in a flumes at salinities of 90%o (thatched bars) or of 120%o
(dotted bars).
Figure 4: Oxygen microelectrode profiles within microbial mat in the daytime (1000h,
open symbols) and nighttime (2200h, closed symbols). Very little difference can be seen
in profiles taken in mats incubated at NORMAL (squares) and HIGH (circles) salinity.
Figure 5: Microelectrodes were used to monitor oxygen fluxes across the Area 4 mat
surface-water interface during greenhouse (squares, NORMAL salinity and circles,
HIGH salinity) and in situ (triangles) experiments. Positive fluxes indicate net flux of
photosynthetically-generated oxygen out of the mat, while negative fluxes indicate net
oxygen consumption. Error bars are standard errors. Mats maintained in the greenhouse
retain the general diel pattern observed in situ, including a morning peak in
photosynthesis. Note shading events caused by greenhouse window crossbars resulting in
temporary light limitation of photosynthesis in small areas of the greenhouse mats, e.g.,
at 13:30 on Day One and at 10:30 on Day Two.
23

c_
0
c_
_1 _TL_ c_
o0
i
i
©
o_
c_
r_
_s
o.,.._
o__J
or_
o
0
t_
o
_f-
O _
•_ oo

o
r-4

©
L_
0
0
0

©
o
c_
¢¢3
¢-1
"a
0
¢xl--
¢¢3
t1"3
¢q
"a
<
0_,,I
• v,,,-I
c_
t/'3¢¢3 % denaturant

Bebout, et al., Fig. 2, TOP 1"
10
8
A) Surface Layer
6
Bebout, et al., Fig. 4, TOP 1"
[02]
0 400 800 1200' I ' I '
--m-- NORMAL Salinity Dark
--e-- HIGH Salinity Dark
--E_-- NORMAL Salinity Light
--o-- HIGH Salinity Light
I I , I '

4--
0
._
o
0
c,i
' I ' I ' I '
DO<]
, I , I , I ,
,- ,-- 6 d
÷
IL_
I
00
L_
00• °
g
g
g
00
,%.--
00
L_
00
00
0"}0
00
0
(L_sz_w IOWfl) xnl-! ue6_xo -180


![[Epicurus] Extant Writings (Bailey)](https://static.fdocuments.us/doc/165x107/577cd3a81a28ab9e789751e5/epicurus-extant-writings-bailey.jpg)