Long-Term Hydrologic Monitoring Program Evaluation · PDF fileThe initial objectives of the...
56
Gasbuggy, New Mexico Long-Term Hydrologic Monitoring Program Evaluation Report June 2009 LMS/GSB/S04019
Transcript of Long-Term Hydrologic Monitoring Program Evaluation · PDF fileThe initial objectives of the...

Gasbuggy, New Mexico Long-Term Hydrologic Monitoring Program Evaluation Report June 2009
LMS/GSB/S04019

This page intentionally left blank

LMS/GSB/S04019
Gasbuggy, New Mexico Long-Term Hydrologic Monitoring Program Evaluation Report
June 2009

This page intentionally left blank

U.S. Department of Energy Gasbuggy, New Mexico Long-Term Hydrologic Monitoring Program Evaluation Report June 2009, Rev. 3 Doc. No. S04019 Page i
Contents Abbreviations ................................................................................................................................ iii Executive Summary.........................................................................................................................v 1.0 Introduction ........................................................................................................................1–1
1.1 Data Evaluation Methodology..................................................................................1–1 2.0 Gasbuggy Site, New Mexico..............................................................................................2–1
2.1 Site Information ........................................................................................................2–1 2.2 Geology and Hydrology ...........................................................................................2–1
2.2.1 Surface Water.................................................................................................2–5 2.2.2 Groundwater ..................................................................................................2–5
2.3 LTHMP Evaluation ..................................................................................................2–6 2.3.1 Source of Radionuclide Contamination .........................................................2–6 2.3.2 Historical Monitoring.....................................................................................2–7 2.3.3 Data Evaluation..............................................................................................2–9
2.3.3.1 Surface Locations ...........................................................................2–9 2.3.3.2 Wells.............................................................................................2–10 2.3.3.3 EPNG 10-36 (Gasbuggy Test Well).............................................2–10 2.3.3.4 Sampling Results..........................................................................2–11
2.4 Monitoring Plan ......................................................................................................2–11 3.0 References ..........................................................................................................................3–1 4.0 Bibliography.......................................................................................................................4–1
Figures Figure 2–1. Location Map for the Gasbuggy Site....................................................................... 2–2 Figure 2–2. Generalized Geologic Cross Section of the San Juan Basin, New Mexico............. 2–3 Figure 2–3. Gasbuggy Site Cross Section................................................................................... 2–4 Figure 2–4. Vertical Relationship of Aquifer Sampling Locations with the Detonation Point
at the Gasbuggy Site ............................................................................................... 2–8 Figure 2–5. Gasbuggy Surface Water Tritium Concentrations and Tritium Concentrations
in Precipitation ........................................................................................................ 2–9
Plates Plate 1 Monitoring Locations, Gasbuggy, NM, Site Plate 2 Gasbuggy, NM, Region Aerial Map
Tables Table 2–1. Gasbuggy LTHMP Sampling Locations................................................................... 2–8

Gasbuggy, New Mexico Long-Term Hydrologic Monitoring Program Evaluation Report U.S. Department of Energy Doc. No. S04019 June 2009, Rev. 3 Page ii
Appendixes Appendix A General Nevada Offsites Background Appendix B SEEPro Database Information Appendix C Sampling Location Information Appendix D Sampling History Appendix E Sampling Results

U.S. Department of Energy Gasbuggy, New Mexico Long-Term Hydrologic Monitoring Program Evaluation Report June 2009, Rev. 3 Doc. No. S04019 Page iii
Abbreviations AEC U.S. Atomic Energy Commission
bgs below ground surface
CERCLA Comprehensive Environmental Response, Compensation, and Liability Act
DOE U.S. Department of Energy
DRI Desert Research Institute
EM DOE Office of Environmental Management
EPA U.S. Environmental Protection Agency
EPNG El Paso Natural Gas
ft feet (foot)
ft2 square feet
LM DOE Office of Legacy Management
LTHMP Long-Term Hydrologic Monitoring Program
pCi/L picocuries per liter
RCRA Resource Conservation and Recovery Act
SEEPro Site Environmental Evaluation for Projects
SGZ surface ground zero
USGS United States Geological Survey
WIPP Waste Isolation Pilot Plant

Gasbuggy, New Mexico Long-Term Hydrologic Monitoring Program Evaluation Report U.S. Department of Energy Doc. No. S04019 June 2009, Rev. 3 Page iv
This page intentionally left blank

U.S. Department of Energy Gasbuggy, New Mexico Long-Term Hydrologic Monitoring Program Evaluation Report June 2009, Rev. 3 Doc. No. S04019 Page v
Executive Summary This report summarizes an evaluation of the Long-Term Hydrologic Monitoring Program (LTHMP) that has been conducted since 1972 at the Gasbuggy, New Mexico underground nuclear detonation site. The nuclear testing was conducted by the U.S. Atomic Energy Commission under the Plowshare program, which is discussed in greater detail in Appendix A. The detonation at Gasbuggy took place in 1967, 4,240 feet below ground surface, and was designed to fracture the host rock of a low-permeability natural gas-bearing formation in an effort to improve gas production. The site has historically been managed under the Nevada Offsites Project. These underground nuclear detonation sites are within the United States but outside of the Nevada Test Site where most of the experimental nuclear detonations conducted by the U.S. Government took place. Gasbuggy is managed by the U.S. Department of Energy (DOE) Office of Legacy Management (LM). Most underground detonations produce a significant cavity, however in this case the cavity was less pronounced. The detonation resulted in the release of radioactive fission products to the blast cavity area. Many of the radionuclides are trapped within a solidified puddle of melted rock that forms at the bottom of the cavity. Other radionuclides that exist in the gas phase, or in water, present in the host geologic formation, may be capable of migrating away from the test location. Because current technology is not capable of remediating the detonation cavity and chimney, the recourse is to monitor for potential contaminant migration from the detonation cavity in groundwater, surface water, or produced natural gas, and implement protective measures if necessary. Since the inception of the LTHMP in 1972, monitoring at the Nevada Offsites has been conducted primarily by the U.S. Environmental Protection Agency. The types of sampling, sampling locations, and the analyte suite have evolved over the 36 years that the monitoring program has been operating. The initial objectives of the monitoring program at the Gasbuggy site were to ensure public safety, inform the public and the news media, and document compliance with state and federal regulations (Carter 1972). EPA has successfully achieved these initial objectives through implementation of the LTHMP. These objectives have guided monitoring activities in recent years as well (e.g., Chapman and Hockett 1991). Based on a review of data collected under the LTHMP, DOE is planning revisions to the program for future years. The monitoring revisions will be incorporated into the Long-Term Surveillance and Maintenance Plan that will be developed for the Gasbuggy site. The LTHMP, as it is currently defined, will be phased out.

Gasbuggy, New Mexico Long-Term Hydrologic Monitoring Program Evaluation Report U.S. Department of Energy Doc. No. S04019 June 2009, Rev. 3 Page vi
This page intentionally left blank

U.S. Department of Energy Gasbuggy, New Mexico Long-Term Hydrologic Monitoring Program Evaluation Report June 2009, Rev. 3 Doc. No. Doc. No. S04019 Page 1–1
1.0 Introduction The Nevada Offsites are sites where underground nuclear testing was conducted, and are within the United States but outside of the Nevada Test Site boundary. There are eight such locations, one of which is the Gasbuggy, New Mexico site, the subject of this report. Appendix A of this document presents background information on the Nevada Offsites in general. The U.S. Department of Energy (DOE), in conjunction with the U.S. Environmental Protection Agency (EPA), conducted hydrologic sampling and analysis at the Gasbuggy site for 36 years under a program known as the Long-Term Hydrologic Monitoring Program (LTHMP). This program was initiated to annually check radioactivity concentrations in wells, springs, and surface waters that are relatively near the detonation site. The results of this monitoring have demonstrated that groundwater and surface water sampling locations near the site have not been affected by detonation-related contaminants. Because detonation-related contaminants have not been detected near the site, DOE decided to revisit the LTHMP to assess its effectiveness regarding contaminant detection. This evaluation considered feasible pathways for contaminant migration from the detonation site to the surrounding environment. Results of this evaluation have shown that the historical sampling locations do not monitor likely contaminant migration pathways. The absence of site-derived contamination at the sampling locations results from a combination of factors that include the depth below ground surface (bgs) of the detonation point (thousands of feet), compared to the depth of the sampling points (at and within a few hundred feet of the surface), the geologic strata between the sample points and the detonation point, the lateral distance of the sample points from the detonation point, and the geologic stratum in which the detonation occurred (low-permeability gas-bearing sandstone). DOE is developing an updated monitoring program to be included in the Long-Term Surveillance and Maintenance Plan for the Gasbuggy site. DOE plans to discontinue annual monitoring at locations that do not represent feasible contaminant migration pathways. As a best management practice, DOE will continue monitoring at these locations once every five years to verify the continued absence of detonation-related contamination. Additional sampling locations may be established to improve monitoring network efficiency. 1.1 Data Evaluation Methodology Criteria for identifying data that are useful for evaluating past monitoring practices include the following:
• The data must be associated with a specific location, which is identified with explicit geographical coordinates or Global Positioning System location, to eliminate data location reporting ambiguities.
• Data validation techniques must be available for review and acceptance to ensure technically defensible data quality.
• The methods used for chemical analysis are reported to ensure regulatory and peer acceptance of analysis results.

Gasbuggy, New Mexico Long-Term Hydrologic Monitoring Program Evaluation Report U.S. Department of Energy Doc. No. S04019 June 2009, Rev. 3 Page 1–2
• A minimum detectable concentration is given for a reported concentration to facilitate assigning proper statistical status for reported concentrations.
• An analyte must be detected at a location at least five times to be included in a trending analysis to ensure that reported data are not outliers.
Appendix B provides a discussion of the SEEPro database, which contains these types of information as well as the analytical data from the long-term hydrologic monitoring. Where possible, trend analyses are used in this evaluation to identify sampling locations where measured analyte concentrations exhibit distinct increases or decreases over time. Trend analyses of field measurements such as pH, electrical conductivity, and water temperature are not included in the assessment.
U.S. Department of Energy Gasbuggy, New Mexico Long-Term Hydrologic Monitoring Program Evaluation Report June 2009, Rev. 3 Doc. No. S04019 Page 2–1
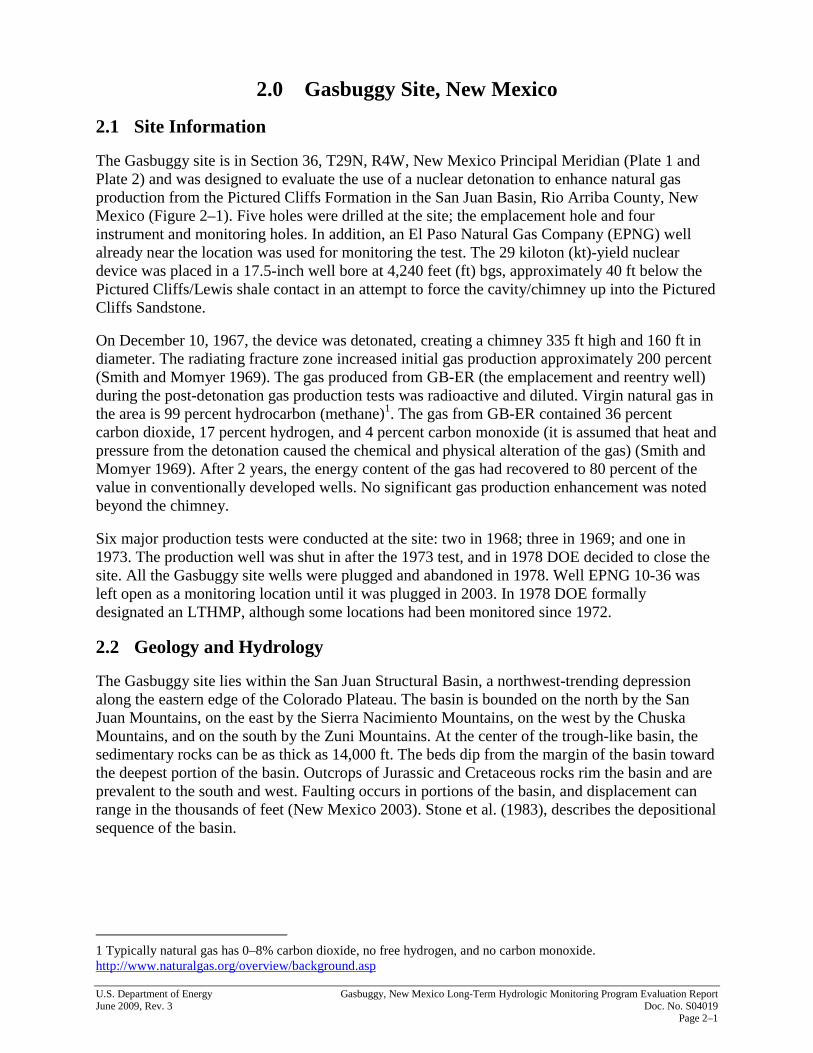
2.0 Gasbuggy Site, New Mexico 2.1 Site Information The Gasbuggy site is in Section 36, T29N, R4W, New Mexico Principal Meridian (Plate 1 and Plate 2) and was designed to evaluate the use of a nuclear detonation to enhance natural gas production from the Pictured Cliffs Formation in the San Juan Basin, Rio Arriba County, New Mexico (Figure 2–1). Five holes were drilled at the site; the emplacement hole and four instrument and monitoring holes. In addition, an El Paso Natural Gas Company (EPNG) well already near the location was used for monitoring the test. The 29 kiloton (kt)-yield nuclear device was placed in a 17.5-inch well bore at 4,240 feet (ft) bgs, approximately 40 ft below the Pictured Cliffs/Lewis shale contact in an attempt to force the cavity/chimney up into the Pictured Cliffs Sandstone. On December 10, 1967, the device was detonated, creating a chimney 335 ft high and 160 ft in diameter. The radiating fracture zone increased initial gas production approximately 200 percent (Smith and Momyer 1969). The gas produced from GB-ER (the emplacement and reentry well) during the post-detonation gas production tests was radioactive and diluted. Virgin natural gas in the area is 99 percent hydrocarbon (methane)1. The gas from GB-ER contained 36 percent carbon dioxide, 17 percent hydrogen, and 4 percent carbon monoxide (it is assumed that heat and pressure from the detonation caused the chemical and physical alteration of the gas) (Smith and Momyer 1969). After 2 years, the energy content of the gas had recovered to 80 percent of the value in conventionally developed wells. No significant gas production enhancement was noted beyond the chimney. Six major production tests were conducted at the site: two in 1968; three in 1969; and one in 1973. The production well was shut in after the 1973 test, and in 1978 DOE decided to close the site. All the Gasbuggy site wells were plugged and abandoned in 1978. Well EPNG 10-36 was left open as a monitoring location until it was plugged in 2003. In 1978 DOE formally designated an LTHMP, although some locations had been monitored since 1972. 2.2 Geology and Hydrology The Gasbuggy site lies within the San Juan Structural Basin, a northwest-trending depression along the eastern edge of the Colorado Plateau. The basin is bounded on the north by the San Juan Mountains, on the east by the Sierra Nacimiento Mountains, on the west by the Chuska Mountains, and on the south by the Zuni Mountains. At the center of the trough-like basin, the sedimentary rocks can be as thick as 14,000 ft. The beds dip from the margin of the basin toward the deepest portion of the basin. Outcrops of Jurassic and Cretaceous rocks rim the basin and are prevalent to the south and west. Faulting occurs in portions of the basin, and displacement can range in the thousands of feet (New Mexico 2003). Stone et al. (1983), describes the depositional sequence of the basin.
1 Typically natural gas has 0–8% carbon dioxide, no free hydrogen, and no carbon monoxide. http://www.naturalgas.org/overview/background.asp

Gasbuggy, New Mexico Long-Term Hydrologic Monitoring Program Evaluation Report U.S. Department of Energy Doc. No. S04019 June 2009, Rev. 3 Page 2–2
Figure 2–1. Location Map for the Gasbuggy Site

U.S. Department of Energy Gasbuggy, New Mexico Long-Term Hydrologic Monitoring Program Evaluation Report June 2009, Rev. 3 Doc. No. S04019 Page 2–3
The mineral rich environment of the San Juan Basin was the primary factor in its selection as a site for the Gasbuggy test. Oil, gas, uranium, and coal have all been extracted from the basin. In areas where the energy resources are present, groundwater is saline. Figure 2–2 is a generalized geologic cross section of the San Juan Basin. Figure 2–3 is a cross section across the Gasbuggy site.
Figure 2–2. Generalized Geologic Cross Section of the San Juan Basin, New Mexico

Gasbuggy, New Mexico Long-Term Hydrologic Monitoring Program Evaluation Report U.S. Department of Energy Doc. No. S04019 June 2009, Rev. 3 Page 2–4
Figure 2–3. Gasbuggy Site Cross Section
Recent alluvium is restricted to valleys along the major stream and tributary channels. The San Jose Formation crops out throughout much of the central basin and is present near the Gasbuggy site. The formation is a coarse, arkosic sandstone interbedded with mudstone. Its thickness ranges from 200 ft in the southwestern portion of the basin to 2,700 ft near Gobernador west of the Gasbuggy site. Underlying the San Jose is the Nacimiento (Animas equivalent) Formation, both of which are typical continental floodplain deposits. The Nacimiento is interbedded black mudstone and white, coarse sandstone at the base, and the upper portion is dominated by sandstone and mudstone beds. The sandstone units are prevalent in forming the distinct slopes of this formation. At the Gasbuggy site the formation is represented by a 3,500-ft sequence of fine- to medium-grained, locally conglomeratic sandstone interbedded with claystone and sandy shale. The Ojo Alamo Sandstone is composed of conglomeratic sandstones, sandstones, and shale common in basin sedimentary deposits. The conglomerate pebbles lie in thin, discontinuous stringers and in poorly sorted beds up to 10 ft thick in the northwestern portion of the area. At the Gasbuggy site the formation is light-gray, medium- to fine-grained sandstone with minor shale interbeds and is 180 ft thick. The Kirtland Shale overlies the Fruitland Formation and has been a significant petroleum play in the basin. Although the Kirtland Shale was originally described by Brown (1910) as part of the Ojo Alamo Sandstone, it is commonly lumped with the Fruitland Formation because of its similar hydrologic properties. The boundaries of these two formations are not clearly defined, and the descriptions are incomplete; however, investigators agree that the carbonaceous shale and the coal are within the Fruitland Formation. Both formations consist of fine-grained sands, sandy shale, shale, and clayey sandstone sequences. At the Gasbuggy site these formations

U.S. Department of Energy Gasbuggy, New Mexico Long-Term Hydrologic Monitoring Program Evaluation Report June 2009, Rev. 3 Doc. No. S04019 Page 2–5
together are 260 ft thick and consist of gray to dark-green shale and siltstone interbedded with thin, very fine grained sandstone. The Pictured Cliffs Sandstone is the latest marine sandstone represented in the basin. The unit was named for the pictographs on the cliff-forming arkosic outcrops. Thickness ranges from 25 to 290 ft across the basin. Interbedded sandstone and mudstone mark the contact between the Pictured Cliffs and the Lewis Shale. The formation at the site is a light-gray, very fine grained to fine-grained sandstone interbedded with dark sandy shale 290 ft thick. Gas production from the Pictured Cliffs is characterized by flow along natural joints, fractures, and bedding planes. Flow in the rock matrix is much slower than in the joints and fractures due to the low permeability of the rock matrix. The Pictured Cliffs intertongues with the underlying Lewis Shale. The Lewis Shale is a gray to black shale interbedded with sandy limestone, sandstone, and bentonite. It has become a major secondary production zone for gas, either by dual completion or by recompletion of gas wells completed in the deeper sands. 2.2.1 Surface Water The Continental Divide crosses the San Juan Basin and separates the Rio Grande and Colorado River drainages. The San Juan River flows into New Mexico from Colorado and exits New Mexico into Utah. Surface water near the Gasbuggy site flows toward the San Juan River. Spring water is from the San Jose Formation, which crops out across the area. 2.2.2 Groundwater The San Juan Basin structure and geology control groundwater conditions within the basin. The San Juan Hydrologic Unit Regional Water Plan prepared by the State of New Mexico has a comprehensive discussion of the area’s groundwater resources (New Mexico 2003). The New Mexico groundwater protection regulations specify that all groundwater in the state that has an existing total dissolved solids (TDS) concentration less than 10,000 mg/L must be protected for present or potential future use as domestic and agricultural water supply (Benjamin and Belluck 1994). For reference, the EPA secondary drinking water standard for TDS is 500 mg/L. The San Jose, Nacimiento, and Ojo Alamo formations (Figure 2–3) are aquifers containing groundwater that the state considers “acceptable and retrievable” (New Mexico 2003). The Fruitland and Kirtland Formations were unsaturated at Gasbuggy GB-1 when this well was drilled, and the Pictured Cliffs Formation yielded a very small amount of water. The San Juan Hydrologic Unit Regional Water Plan does not discuss the Pictured Cliffs Sandstone as an aquifer. Groundwater flow from the Gasbuggy site is believed to be to the west-northwest to discharge points along the San Juan River (Plate 2) (Mercer 1970). At the site, hydraulic head values decrease with depth, indicating a potential for downward flow (Sokol 1970). Water supply wells in the general area tap both the alluvium and the underlying tertiary sandstones at depths between 54 and 229 ft (Mercer 1968).

Gasbuggy, New Mexico Long-Term Hydrologic Monitoring Program Evaluation Report U.S. Department of Energy Doc. No. S04019 June 2009, Rev. 3 Page 2–6
2.3 LTHMP Evaluation 2.3.1 Source of Radionuclide Contamination The Gasbuggy test at 4,240 ft bgs produced a rubble-filled chimney 80 ft in radius and 335 ft high. It did not form a classic cavity, as there appears to be no void space at the top of the cavity. This is most likely because the upper portions of the chimney rock sagged and slumped rather than cracked and broke. This sagging was probably caused by horizontal bedding weakness and the bulking characteristics of the immediately overlying Fruitland Formation (Korver and Rawson 1968). Upon post-detonation reentry in GB-ER, logging indicated four casing breaks and two voids above the chimney, although the deeper void may represent the top of the chimney (Korver and Rawson 1968). These casing breaks correspond to bedding planes in the coal beds overlying the Pictured Cliffs Formation. Testing and interpretation of the results after reentry into both GB-ER and GB-2RS provided the following information:
• Rock was intensely fractured at least 375 ft from the detonation point.
• Coal of the Fruitland Formation was intensely fractured 500 ft from the detonation point.
• Most extensive fracturing occurred along bedding planes and areas of pre-existing weakness.
• Indirect evidence indicates intense fracturing of the underlying Lewis Shale, resulting in 15.6 percent of the gas production (no pre-test gas production).
• Significant increase in porosity in the lower Pictured Cliffs Formation.
• The upper portion of the chimney developed a broad transitional zone from rubble, indicating nearly infinite permeability within the native rock, but very little increase in permeability through the formation (Korver and Rawson 1968).
The Gasbuggy post-test geochemistry indicated that the formation of carbon dioxide from the detonation reaction with the native carbon retarded the flow of natural gas into the cavity. This retarded flow is suspected to have reduced the tritium chemistry from tritiated hydrogen and tritiated methane to a larger production of tritiated water vapor. The krypton-85 production in the chimney was normal, as indicated by previous nuclear tests; however, iodine-131 production was absent. Iodine-131 is produced from the decay of uranium-235, and its absence indicates a chemical or physical reaction tying it up in the formation.
U.S. Department of Energy Gasbuggy, New Mexico Long-Term Hydrologic Monitoring Program Evaluation Report June 2009, Rev. 3 Doc. No. S04019 Page 2–7
2.3.2 Historical Monitoring Upon making the decision that the Gasbuggy site would not be put into commercial production, DOE formalized the LTHMP for the site. The table in Appendix D shows the monitoring history for the site. Plate 1 shows the current and historical monitoring locations. An LTHMP is detailed in the Project Gasbuggy Well Plugging and Site Restoration Plan (DOE 1978). The 1978 program conducted by EPA consists of annual sampling and analysis for the following locations: EPNG Well 10-36 Arnold Ranch Spring Windmill # 2 La Jara Creek Lower Burro Canyon well Cave Springs Jicarilla Well N (2) Bubbling Springs Jicarilla Well S (1) Bixler Ranch well Well EPNG 10-36 was intended to sample water from the Ojo Alamo formation. All other sampling points were in the San Jose and Nacimiento formations. Additional sampling location information is included in Appendix C. The plan required field measurements of water level, temperature, pH, and specific conductivity. Samples were analyzed for gross alpha, gross beta, gross gamma, and tritium. Additionally, the original suite of analytes included radium-226 at Jicarilla Well S and strontium-89 and -90 at EPNG Well 10-36. Some of the samples where tritium was not detected by the conventional analysis method were then analyzed using the enriched tritium method. The enriched tritium method is more sensitive than the conventional method and is used to analyze samples with low (less than about 800 pCi/L) tritium concentrations. Tritium is the most mobile of the contaminants at Gasbuggy and is therefore considered to be the best indicator of potential contaminant migration. The Gasbuggy site sampling program has been fairly consistent since 1972, although the analytes have changed over time. Gross alpha, gross beta, and gross gamma analyses have been eliminated. Samples are now analyzed using high resolution gamma spectroscopy and tritium analysis continues. Figure 2–4 shows the vertical relationship of the groundwater sampling points with the point of detonation of the Gasbuggy test. The sampling has concentrated on verifying that the local sources of groundwater and surface water have not been affected by detonation-related contaminants. Table 2–1 lists the Gasbuggy LTHMP sampling locations. Cedar Springs (s28.4.9.233), sampled by EPA in the early 1970s, was dropped to conform to the 1978 LTHMP, but was then added back and has been sampled consistently since 1987. Jicarilla Well N (30.3.32.343) apparently had production problems, and during the sampling season, the windmill was not consistently operational. The surface location known as Pond N (s30.3.32.343) was added in 1988, apparently because the windmill on the well was not working. The pond has been sampled fairly consistently since. The Arnold Ranch Well (28.5.25.233) was sampled inconsistently from 1972 forward but has been sampled consistently since 1997. The Bixler Ranch Well, which was included in the 1978 program, has not been sampled since 1998. No reason was given for discontinuing sampling. EPNG 10-36 was plugged in 2003, and therefore sampling of that well has ceased.

Gasbuggy, New Mexico Long-Term Hydrologic Monitoring Program Evaluation Report U.S. Department of Energy Doc. No. S04019 June 2009, Rev. 3 Page 2–8
Figure 2–4. Vertical Relationship of Aquifer Sampling Locations with the Detonation Point at the Gasbuggy Site
Table 2–1. Gasbuggy LTHMP Sampling Locations
Location Type and Name Identifier Distance from SGZ
Well—Arnold Ranch Well 28.5.25.233 6.4 miles southwest
Surface Water—Arnold Ranch Spring s28.5.25.233 6.4 miles southwest
Well—Bixler Ranch Well 30.4.35.221 6.6 miles north
Surface Water—Bubbling Springs s29.4.19.411 5 miles west northwest
Surface Water—Cave Springs s28.4.17.000 3.9 miles west
Surface Water—Cedar Springs s28.4.9.233 2.6 miles west
Well—EPNG Well 10-36 Gasbuggy Test Well 435 feet north northwest
Well—Jicarilla Well N 30.3.32.343 6.1 miles north
Well—Jicarilla Well S 28.3.33.233 6.3 miles southeast
Well—Jicarilla Well No. 1 29.2.30.234 7.25 miles east
Surface Water—La Jara Creek s29.3.20.211 3.3 miles northeast
Surface Water—La Jara Lake — 12.5 miles east northeast
Well—Lower Burro Canyon Well 28.2.18.331 7.2 miles southeast
Surface Water—Pond N s30.3.32.343 5.7 miles north
Well—Windmill #2 29.3.29.223 2.7 miles northeast
Well—Old School House — 11 miles west
Surface Water—San Juan River, Blanco, NM — 33 miles west
Dulce, NM City Water — 21 miles northeast

U.S. Department of Energy Gasbuggy, New Mexico Long-Term Hydrologic Monitoring Program Evaluation Report June 2009, Rev. 3 Doc. No. S04019 Page 2–9
2.3.3 Data Evaluation The following section discusses the post-test geologic conditions, post-test hydrologic conditions, and the surface water and groundwater sample analysis results. Historically, the AEC and DOE have established the groundwater and surface water compliance standards for the Nevada Offsites and evaluated compliance with those standards. DOE is using the EPA standard of 20,000 pCi/L for tritium in drinking water as the compliance standard. Tritium is currently the only contaminant of concern. All other contaminants have either decayed off to negligible levels or are relatively immobile compared to tritium. 2.3.3.1 Surface Locations Five surface locations meet the trending criteria for tritium at the Gasbuggy site: Pond N (s30.3.32.343), Bubbling Springs (s29.4.19.411), Cedar Springs (s28.4.9.233), La Jara Creek (s29.3.20.211) and Cave Springs (s28.4.17.000). Time versus concentration plots of these analysis results are included in Appendix E. The highest tritium concentration measured was 583 picocuries per liter (pCi/L) in a sample from Pond N (s30.3.32.343) in 1988. The EPA drinking water standard for tritium is 20,000 pCi/L, so although tritium is present, it is well below concentrations of concern. The concentrations have declined in all five locations to less than 100 pCi/L. Most of the tritium found in surface water is known to come from precipitation. In this case the concentrations are consistent with those historically measured in precipitation (Brown 1995). The results are shown in Figure 2–5 along with recorded precipitation concentrations for comparison. The two solid straight lines in Figure 2–5 represent the normal rate of tritium radioactive decay.
Figure 2–5. Gasbuggy Surface Water Tritium Concentrations and Tritium Concentrations in Precipitation
10
100
1000
10000
100000
Jan-52 Jan-62 Jan-72 Jan-82 Jan-92 Jan-02 Jan-12
pC
i/L
Pond N
La Jara Creek
Cedar Springs
Cave Springs
Bubbling Springs
Tritium in Precipitation(1953-1995)

Gasbuggy, New Mexico Long-Term Hydrologic Monitoring Program Evaluation Report U.S. Department of Energy Doc. No. S04019 June 2009, Rev. 3 Page 2–10
2.3.3.2 Wells Three shallow wells and one deep well (the Gasbuggy Test Well) meet the trending criteria for tritium at the Gasbuggy site: Bixler Ranch Well (30.4.35.221), Jicarilla Well S (28.3.33.233), Jicarilla Well No. 1 (29.2.30.234), and EPNG 10-36 (Gasbuggy Test Well). Time versus concentration plots of these analysis results are included in Appendix E. All four wells have had detectable tritium concentrations. Since groundwater in the Gasbuggy area is believed to flow to the northwest toward the San Juan River, these wells would be hydraulically upgradient, downgradient, and crossgradient from the detonation point. Tritium concentrations in excess of background were first detected in EPNG 10-36 in the late 1980s (see discussion below). The tritium concentrations detected in the three shallow wells are extremely low and consistent with expected background tritium concentrations. No other radionuclides of concern have been detected in the wells that meet the five data-point trending criterion. 2.3.3.3 EPNG 10-36 (Gasbuggy Test Well) This well was originally an EPNG gas production well that the AEC purchased from EPNG and converted into a monitor well (see Plate 1). The original total depth of the well was 4,210 ft, just into the top of the Lewis Shale. The well had originally been perforated in the Pictured Cliffs Formation for gas production. The AEC intended to use the well to monitor gas in the Pictured Cliffs Sandstone, but casing damage precluded this use. Therefore, a bridge plug was placed at 3,881 ft, a cement plug was placed from the bridge plug up to 3,616 ft, just into the Ojo Alamo Sandstone, and the well was screened and recompleted in the Ojo Alamo Sandstone as a groundwater monitor well. The tritium data were the focus of the DRI report Tritium Migration at the Gasbuggy Site; Evaluation of Possible Hydrologic Pathways (DRI 1996b) and further evaluated in the DRI report Investigations in Well EPNG 10-36 at the Gasbuggy Nuclear Test Site, Rio Arriba County, New Mexico (DRI 2003). The fall 2002 and spring 2003 field investigations (reported in DRI 2003) determined that the tritium was entering the well bore approximately 1,860 ft bgs. Tritium analyses of samples acquired with a depth-specific sampler showed peak tritium concentrations at approximately 1,860 ft bgs with decreasing concentrations above 1,800 ft. Samples from the well at the screened depth in the Ojo Alamo did not contain detectable tritium concentrations (DRI 2003). Since the well was completed in the Ojo Alamo, with the perforated interval from 3,571 to 3,611 ft bgs, it was unlikely that the detected tritium was coming from the Ojo Alamo. Furthermore, the water chemistry of the tritium-contaminated samples was significantly different than the water chemistry of the Ojo Alamo samples acquired from the bottom of the well, indicating that the tritium was coming from water that did not originate in the Ojo Alamo (DRI 2003). Additionally both electrical conductivity and pH logs of the well showed abrupt changes at approximately 1,800 ft bgs, further indicating the influx of water not associated with the Ojo Alamo at that level. Well casing integrity logs conducted in the 1990s indicated corrosion of the casing and the likelihood of holes in the casing around the 1,860 ft bgs level (DRI 2003).
U.S. Department of Energy Gasbuggy, New Mexico Long-Term Hydrologic Monitoring Program Evaluation Report June 2009, Rev. 3 Doc. No. S04019 Page 2–11
In light of these investigation results DRI concluded that the EPNG 10-36 well casing was compromised around the 1,860 ft bgs level and that the tritium-contaminated water was entering the well at that level. The tritium in the well was not coming from water in the Ojo Alamo. These results verified the conclusions drawn in the earlier tritium migration evaluation (DRI 1996b) stating that tritium migration from the detonation cavity to the Ojo Alamo was not likely. This earlier conclusion was based on the combination of contaminant travel time estimates and the fact that the hydraulic head in the Ojo Alamo is significantly greater than the hydraulic head in the Pictured Cliffs. The travel time calculations showed that tritium could not have migrated from the detonation cavity to EPNG 10-36 in the time that had elapsed since the detonation. The hydraulic head differential between the Pictured Cliffs and the Ojo Alamo indicates that groundwater would migrate from the Ojo Alamo to the Pictured Cliffs, not vice versa (DRI 1996b). Two possibilities for the source of the tritium contamination were suggested: 1) it was introduced into the wellbore at some time in the past, perhaps inadvertently during recompletion operations, and diffused into the annular region through the casing break at 1,860 ft bgs, and after purging is now bleeding back out into the wellbore from the annular space, or 2) there is tritium in the Tertiary-age aquifer encountered at the casing break (DRI 2003). Unfortunately the source of the tritium-contaminated water in EPNG 10-36 was never definitively determined. The exploratory and device placement holes drilled at Gasbuggy did not encounter water in the Tertiary-age formations making that explanation unlikely and no record of contamination being introduced from the surface was ever discovered. However, it is clear that the tritium contamination did not come from the Ojo Alamo Formation, confirming that the Ojo Alamo was not contaminated where well EPNG 10-36 was completed. Due to the compromised casing, well EPNG 10-36 was plugged and abandoned in 2003. 2.3.3.4 Sampling Results Tritium concentrations in water sampled from wells and surface locations during the LTHMP are shown in Appendix E. These graphs are semilog plots of data collected by EPA (Las Vegas) from locations near the Gasbuggy site since 1972. In all cases the tritium concentrations have diminished. As stated earlier, the reported surface water tritium concentrations and trends to lower concentrations over time are consistent with tritium concentrations found in rainwater (Brown 1995). Groundwater tritium concentrations never exceeded typical background concentrations, with the exception of EPNG 10-36, discussed in detail above. The EPA drinking water standard for tritium is 20,000 pCi/L. Current tritium concentrations in groundwater and surface water measured near the Gasbuggy site are approximately 10 pCi/L, three orders of magnitude below the drinking water standard. 2.4 Monitoring Plan The LTHMP has been conducted for 36 years. Sampling results indicated low concentrations of tritium at some LTHMP-monitored locations. From 1968 to 1973 gas-flaring tests were conducted at the site. That activity, along with historically measured tritium concentrations in precipitation related to nuclear testing fallout, account for the presence of the measured values of tritium in surface waters sampled during the LTHMP.

Gasbuggy, New Mexico Long-Term Hydrologic Monitoring Program Evaluation Report U.S. Department of Energy Doc. No. S04019 June 2009, Rev. 3 Page 2–12
With the exception of well EPNG 10-36, tritium concentrations detected during the LTHMP groundwater sampling have been very low and on the order of expected background concentrations. The origin of the tritium reported in groundwater samples collected from EPNG 10-36 has not been definitively determined, but it did not come from the water bearing formation that the well was monitoring (the Ojo Alamo Formation). This well was abandoned in 2003 because of the compromised well casing. At that time measured tritium concentrations were two orders of magnitude lower than the EPA drinking water standard. Based on the fact that tritium detections in all other well and surface water locations have been consistent with expected background concentrations, 2009 will be the last year for tritium sampling on an annual basis of wells and surface locations previously sampled for the LTHMP. For the past 36 years, with the exception of EPNG 10-36, all LTHMP sampling locations have been either surface waters or wells that are completed in the shallow alluvium or in the Nacimiento Formation no deeper than 229 ft bgs. Additionally, and with the exception of EPNG 10-36, both surface water and groundwater sampling locations have been anywhere from 2.5 to over 20 miles away from the Gasbuggy site SGZ. Except for samples from well, EPNG 10-36, the surface water and groundwater samples collected during the LTHMP have been from sample locations more than 4,000 ft above the detonation level (4,240 ft bgs) of the Gasbuggy event. The geologic strata present beneath the Gasbuggy site consist of layers of sandstone and shale that control fluid movement, both upward and downward. In geologic settings such as that beneath the Gasbuggy site, the more permeable sandstones act as a potential aquifer and move water within the more permeable portion of the sandstone. The overlying and underlying shale layers act as an aquitards, greatly reducing the potential for flow across the thickness of the aquitard. Therefore, the possibility is very remote that test-related radionuclides would migrate upward more than 4,000 ft and contaminate regional sources of surface water and groundwater. Based upon this premise, combined with the lateral distance of the sample locations from the Gasbuggy detonation point, and the fact that excessive tritium concentrations have not been detected over the last 36 years, the LTHMP as it has existed for the past 36 years of sampling surface water and groundwater on an annual basis should be abandoned. DOE plans that calendar year 2009 be the last year of the LTHMP. In the future, sampling of the historical LTHMP locations will occur once every five years to verify that those water sources are not affected by detonation-derived contamination. Additionally, if in the future any water production wells are completed in the Ojo Alamo Formation within one mile of the Gasbuggy detonation point, DOE intends to seek permission from the well owners to obtain samples for analysis to verify that the sampled water has not been affected by detonation-derived contamination.

U.S. Department of Energy Gasbuggy, New Mexico Long-Term Hydrologic Monitoring Program Evaluation Report June 2009, Rev. 3 Doc. No. S04019 Page 3–1
3.0 References Benjamin, Sally and David Belluck, 1994. State Groundwater Regulation, Guide to Laws, Standards, and Risk Assessment, Bureau of National Affairs, Inc., Washington, DC. Brown, B. 1910. The Cretaceous Ojo Alamo Beds of New Mexico with Description of the New Dinosaur Genus Kritosaurus, Bulletin American Museum of Natural History, Vol. XXVIII, 1910. Brown, R.M., 1995. Monthly Tritium in Precipitation at Ottawa, Canada 1953–1995, Atomic Energy of Canada Limited, http://www.science.uottawa.ca/~eih/ch7/7tritium.htm, last accessed March 2009. Carter, M. W., 1972. Environmental Surveillance Draft Guide 1972- Jan. 31 Openet Document, https://www.osti.gov/opennet/detail.jsp?osti_id=16024890&query_id=4, accessed March 5, 2007. Chapman, J.B., and S.L. Hokett, 1991. Evaluation of Groundwater Monitoring at Offsite Nuclear Test Areas, Publication #45085, DOE/NV/10845−07, UC−703, March. DOE (U.S. Department of Energy), 1978. Project Gasbuggy Well Plugging and Site Restoration Plan, NVO-195. Las Vegas, Nevada. DOE/NV (U.S. Department of Energy, Nevada Operations Office), 2005. Gasbuggy Surface Closure Report for the Gasbuggy Site, New Mexico, DOE-NV-1035, September. DRI (Desert Research Institute), 1996a. Assessment of hydrologic transport of radionuclides from the Gasbuggy underground nuclear test site, New Mexico, prepared by S. Earman, J. Chapman, and R. Andricevic. Reno, Nevada: Water Resources Center, Desert Research Institute, University and Community College System of Nevada; Springfield, Virginia. 26 p. G384 N6-2. DRI (Desert Research Institute), 1996b. Tritium migration at the Gasbuggy Site: Evaluation of Possible Hydrologic Pathways, prepared by J.B. Chapman, T. Mihevc, and B. Lyles, Reno, Nevada: Water Resources Center, Desert Research Institute, University and Community College System of Nevada; Springfield; 28 p. G384 N6-1. DRI (Desert Research Institute), 2003. Investigations in Well EPNG 10-36 at the Gasbuggy Nuclear Test Site, Rio Arriba County, New Mexico, prepared by Brad Lyles, Jenny Chapman, and David Gillespie, Division of Hydrologic Sciences, Desert Research Institute, University and Community College System of Nevada; DOE/NV/13609-31, September. Korver, J.A. and D.E. Rawson, 1968. Gasbuggy Postshot Investigations in GB-ER. Lawrence Radiation Laboratory Report UCRL-50425, TID-4500, UC-35. Mercer, J.W., 1968. Inventory of Wells and Springs within a 10-mile radius of Project Gasbuggy, Rio Arriba County, New Mexico, Open-file Report, U.S. Geological Survey.

Gasbuggy, New Mexico Long-Term Hydrologic Monitoring Program Evaluation Report U.S. Department of Energy Doc. No. S04019 June 2009, Rev. 3 Page 3–2
Mercer, J.W., 1970. Hydrology of Project Gasbuggy Site, Rio Arriba County, New Mexico, U.S. Geological Survey Report Series, Nuclear Explosions - Peaceful Applications, PNE-1013, TID-4500, 45 p. New Mexico, 2003. San Juan Basin Regional Water Plan San Juan Hydrologic Unit, http://www.seo.state.nm.us/isc_regional_plans2.html, Accessed July 2008. Rawson, D.E. and J.A. Korver, 1967, Acceptability of the Gasbuggy Site. Lawrence Radiation Laboratory, Report UCD-15 132,44p. plus appendices. Smith, C. F. Momyer, F. F (1969) GASBUGGY: Gas Quality Investigation Program http://handle.dtic.mil/100.2/ADA382357 California Univ Livermore Radiation Lab Ucrl-71314-Rev-1, February Sokol, D., 1970. Ground Water Safety Evaluation - Project Gasbuggy, Prepared by Teledyne Isotopes, U.S. Atomic Energy Commission, Nevada Operations Office, PNE-1009. Stone, W.J., Lyford, F.P., Frenzel, P.F., Mizell, N.H., and Padgett, E.T., 1983. Hydrogeology and Water Resources of San Juan Basin, New Mexico: Socorro, New Mexico Bureau of Mines and Mineral Resources Hydrologic Report 6.

U.S. Department of Energy Gasbuggy, New Mexico Long-Term Hydrologic Monitoring Program Evaluation Report June 2009, Rev. 3 Doc. No. S04019 Page 4–1
4.0 Bibliography DOE/NNSA/NSO (U.S. Department of Energy National Nuclear Security Administration Nevada Site Office), 2001. Modeling Approach for Evaluating Radionuclide Transport in Nuclear-Stimulated Gas Reservoirs, DOE/NV/13609-15, Desert Research Institute Publication No. 45186, Las Vegas, Nevada, September. DOE/NV (U.S. Department of Energy, Nevada Operations Office), 1993. Floodplains and Wetlands Survey Results for the Gasbuggy and Gnome-Coach Sites, New Mexico, DOE/NV/10972-58, prepared by IT Corporation, Las Vegas, Nevada, December. DOE/NV (U.S. Department of Energy, Nevada Operations Office), 1993. Sensitive Species Survey Results for the Gasbuggy and Gnome-Coach Sites, New Mexico, DOE/NV/10972-54, prepared by IT Corporation, Las Vegas, Nevada, December. EPA (U.S. Environmental Protection Agency), 2002. Implementation Guidance for Radionuclides, EPA 816-F-00-002, accessed 12 September 2007 on the Internet at http://www.epa.gov/safewater/radionuclides/pdfs/guide_radionuclides_stateimplementation.pdf. EPA (U.S. Environmental Protection Agency), 2004. 2004 Edition of the Drinking Water Standards and Health Advisories, EPA 822-R-04-005, Winter. Leedshill-Herkenhoff, Inc., John W. Shomaker, Inc., and C.T. DuMars, 1994. 40-Year Regional Water Plan, New Mexico State, Planning and Development District 1, San Juan, McKinley, Cibola Counties, March. Lorenz, J.C., 2000. The Stimulation of Hydrocarbon Reservoirs with Subsurface Nuclear Explosions, Sandia National Laboratories, SAND2000-3052J. Smith, C.F., and F.F. Moymer, 1969. Studies of Chemical and Radiological Composition of Natural Gas from the Cavity Produced by the Project Gasbuggy Nuclear Shot, Radiological Health Data and Reports 10(7), pp. 281−288. USGS (U.S. Geological Survey), 1995. Geochemistry of Ground Water in the Gallup, Dakota, and Morrison Aquifers, San Juan Basin, New Mexico, Water-Resources Investigations Report 94-4253. USGS (U.S. Geological Survey), 1996. Hydrogeology and Steady-State Simulation of Ground-Water Flow in the San Juan Basin, New Mexico, Colorado, Arizona, and Utah, Water-Resources Investigations Report 95-4187. USGS (U.S. Geological Survey), 1996. Summary of the San Juan Structural Basin Regional Aquifer-System Analysis, New Mexico, Colorado, Arizona, and Utah, Water-Resources Investigations Report 95-4188.

Gasbuggy, New Mexico Long-Term Hydrologic Monitoring Program Evaluation Report U.S. Department of Energy Doc. No. S04019 June 2009, Rev. 3 Page 4–2
This page intentionally left blank

(7380 FT)
36
(7511 FT)
(7350 FT)
(6960 FT)
(7311 FT)
(6881 FT)
(7131 FT)
(7203 FT)
Arnold Ranch Well28.5.25.233
Well Old School House
Jicarilla Well No. 129.2.30.234
EPNG Well 10-36
Bixler Ranch Well
Lower Burro Canyon Well28.2.18.331
Jicarilla Well S28.3.33.233
Jicarilla Well N30.3.32.343
Windmill #229.3.29.223
Arnold Ranch SpringS 28.5.25.233
La Jara CreekS 29.3.20.211
La Jara Lake
Pond NS 30.3.32.343
Bubbling SpringsS 29.4.19.411
Cedar SpringsS 28.4.9.233
Cave SpringsS 28.4.17.000
Surface Ground Zero
Plate 1Monitoring LocationsGasbuggy, NM, Site
August 4, 2009 S0351400DATE PREPARED: FILENAME:
GRAND JUNCTION, COLORADO
U.S. DEPARTMENT OF ENERGY
M:\LTS\111\0079\05\000\S03514\S0351400.mxd coatesc 8/4/2009 11:33:50 AM
LEGEND
Monitoring Locations
Well
Surface
Historical Monitoring Locations
Well
Surface
Surface Ground Zero
Withdrawal Boundary
Jicarilla Reservation Boundary
MAPLOCATION
M E X I C O
40
10
25
20
27
19
17
TUCSONMIDLAND
LUBBOCKPHOENIX
AMARILLO
ALBUQUERQUE
SANTA FE
EL PASO
N E W M E X I C OA R I Z O N A
T E X A S
C O L O R A D OU T A H
O K
K S
1:48,000
STATE PLANE COORDINATE SYSTEM (FEET)NEW MEXICO CENTRAL ZONE
NORTH AMERICAN DATUM OF 1927
SCALE IN FEET4,000 0 4,0002,000
S.M. Stoller CorporationWork Performed by
Under DOE ContractNo. DE-AC01-07LM00060
Contours and elevations are in meters unless noted Contours and elevations are in meters unless noted otherwise. To convert meters to feet multiply by 3.28.otherwise. To convert meters to feet multiply by 3.28.
Range 6W Range 5W Range 4W Range 3W
T 30N
T 29N
T 28N
T 27N
Range 6W Range 5W Range 4W Range 3W Range 2W Range 1W
T 27N
T 28N
T 29N
T 30N
Range 1WRange 2W

Well Old School House
Bixler Ranch Well
EPNG Well 10-36
La Jara Lake
Surface Ground Zero
Windmill #229.3.29.223
Arnold Ranch Well28.5.25.233
Jicarilla Well No. 129.2.30.232
Lower Burro Canyon Well28.2.18.331
Jicarilla Well S28.3.33.233
Jicarilla Well N30.3.32.343
Cedar SpringsS 28.4.9.233
Cave SpringsS 28.4.17.000
La Jara CreekS 29.3.20.211
Dulce Water Supply
Pond N S 30.3.32.343
Bubbling SpringsS 29.4.19.411
Arnold Ranch SpringS 28.5.25.233
Plate 2Gasbuggy, NM, Region
Aerial Map
August 6, 2008 S0466100DATE PREPARED: FILENAME:
GRAND JUNCTION, COLORADO
U.S. DEPARTMENT OF ENERGY
M:\LTS\111\0079\05\000\S04661\S0466100.mxd coatesc 5/22/2009 9:33:50 AM
LEGEND
Monitoring Locations
Well
Surface
Historical Monitoring Locations
Well
Surface
Surface Ground Zero
Withdrawal Boundary
Jicarilla Reservation Boundary
MAPLOCATION
M E X I C O
40
10
25
20
27
19
17
TUCSONMIDLAND
LUBBOCKPHOENIX
AMARILLO
ALBUQUERQUE
SANTA FE
EL PASO
N E W M E X I C OA R I Z O N A
T E X A S
C O L O R A D OU T A H
O K
K S
S.M. Stoller CorporationWork Performed by
Under DOE ContractNo. DE-AC01-07LM00060
Range 5WRange 6W Range 4W Range 3W Range 2W Range 1WRange 7WRange 8W
T 27N
T 28N
T 29N
T 30N
T 31N
T 32N
Range 8W Range 7W Range 6W Range 5W Range 4W Range 3W Range 2W Range 1W Range 1E
T 31N
T 30N
T 29N
T 28N
T 27N
Range 1E
T 31N
(7380 FT)(7380 FT)
(7350 FT)(7350 FT)
(6960 FT)(6960 FT)
(6881 FT)(6881 FT)
(7131 FT)(7131 FT)
(7203 FT)(7203 FT)
(7511 FT)(7511 FT)
(7311 FT)(7311 FT)
Contours and elevations are in meters unless noted Contours and elevations are in meters unless noted otherwise. To convert meters to feet multiply by 3.28.otherwise. To convert meters to feet multiply by 3.28.
STATE PLANE COORDINATE SYSTEM (FEET)NEW MEXICO CENTRAL ZONE
NORTH AMERICAN DATUM OF 1927
10,000 0 10,0005,000SCALE IN FEET
1:100,000
Navajo Rese
rvoir
San Juan River

Appendix A
General Nevada Offsites Background

This page intentionally left blank

U.S. Department of Energy Gasbuggy, New Mexico Long-Term Hydrologic Monitoring Program Evaluation Report June 2009, Rev. 3 Doc. No. S04019 Page A−1
A1.0 General Nevada Offsites Background
The Nevada Offsites Project (Nevada Offsites) consists of nine sites that were selected for deep, underground nuclear testing in the 1960s and 1970s and are now managed by the U.S. Department of Energy (DOE) Office of Legacy Management (LM). A1.1 The Nevada Offsites The Nevada Offsites are underground nuclear test sites located in the United States but outside the boundaries of the Nevada Test Site (NTS). The nuclear testing was conducted by the U.S. Atomic Energy Commission (AEC) under the Plowshare and Vela Uniform programs. The nine sites originally selected for testing were Chariot and Amchitka (Alaska); Shoal and Central Nevada Test Area (CNTA) (Nevada); Rio Blanco and Rulison (Colorado); Gasbuggy and Gnome-Coach (New Mexico); and Salmon (Mississippi) (Figure A−1). The planned nuclear test at the Chariot site was never conducted. A total of 13 nuclear devices were detonated at the remaining eight Nevada Offsites where testing did occur.
Figure A–1. Nevada Offsites Locations

Gasbuggy, New Mexico Long-Term Hydrologic Monitoring Program Evaluation Report U.S. Department of Energy Doc. No. S04019 June 2009, Rev. 3 Page A−2
A1.2 Site Categorization by Test Purpose Each of the Nevada Offsites falls into one or two of three categories, or programs, based on the primary purpose of the nuclear tests that were performed at the site (DOE 2000). One of these was the Plowshare program, a research and development initiative started in 1958 aimed at determining the technical and economic feasibility of peaceful applications of nuclear energy. A second category referred to as the Vela Uniform Program, was established to improve the detection of underground nuclear explosions. The third category encompassed what were referred to as “weapons-related” tests (DOE 2000). The map presented in Figure A-1 shows the categories of each of the eight sites at which testing actually occurred. Between December 1961 and May 1973, the United States conducted 27 Plowshare nuclear tests, both within and outside the NTS, using a total of 35 individual detonations. The Nevada Offsites locations included in the Plowshare program were Gnome-Coach, Rulison, Rio Blanco, and Gasbuggy. Testing under the program was concluded in 1973 with three simultaneous detonations at Rio Blanco. Some of the Plowshare tests were intended to provide an inexpensive energy source that could be used in a number of commercial applications. The tests at Rulison, Gasbuggy, and Rio Blanco were in areas where subsurface reservoirs of natural gas have been identified as potential resources, but production was limited by the low permeability of the host formations. Nuclear detonations were used to fracture the host rock in an effort to increase the permeability and productivity of the reservoirs. An increase in fracture surface area within each reservoir that resulted from the formation of a collapse chimney, and the creation of fractures radiating away from the detonation site, had the potential to enhance gas migration toward production wells in very tight formations. Today these “gas sites” present monitoring challenges due to the potential for contaminant transport in both liquid (water) and gas phases. The Vela Uniform Program was initiated because the United States wanted the capability to ensure that, if the Nuclear Test Ban treaty were signed, treaty violations could be detected. Seismic investigations were conducted during Vela Uniform testing with the intent of reliably distinguishing seismic waves caused by underground nuclear detonations from earthquake-generated seismic waves. Work under the program also focused on the development of ground-based instruments for detecting explosions in outer space and building satellite-based instruments for the detection of explosions in outer space. The “seismic sites” were located in different geologic environments—specifically, salt formations, volcanic rock, and granite—to aid in establishing the seismic signature of a detonation in the various geologic media. The Nevada Offsites locations included in the Vela Uniform program were Shoal, Amchitka, and Salmon. Four nuclear tests under the program were conducted at these sites between October 1963 and July 1971. Although the Gnome-Coach site was administered under the Plowshare program, nuclear testing at this site was also associated with the use of seismic tools to detect underground detonations. Weapons-related tests, both on and off the NTS, were designed to determine the effects of detonation yield on underground nuclear cavity formation and resulting signature energy patterns in host rocks. Two of the Offsites—CNTA and Amchitka—had weapons-related testing. A planned weapons test at the Chariot site in Alaska and a similar test referred to as Coach at the

U.S. Department of Energy Gasbuggy, New Mexico Long-Term Hydrologic Monitoring Program Evaluation Report June 2009, Rev. 3 Doc. No. S04019 Page A−3
Gnome-Coach site in New Mexico were never conducted. The Chariot site was used to test the leaching properties of soils imported from the NTS. Because of its location (outside the boundaries of the NTS) and its status as a planned test, Chariot has historically been considered a part of the Nevada Offsites. Underground structures associated with the Coach test were in place at the Gnome-Coach site when the test was cancelled. Most of the Nevada Offsites were used for just one specific type of testing. Amchitka was the only site where nuclear tests met more than one purpose. A1.3 Effects of Subsurface Detonations The high temperatures associated with a subsurface nuclear detonation vaporize and melt the host rock. Typically, a void cavity is created around the detonation, and the molten rock settles at the bottom of the cavity where it eventually cools, forming a vitrified solid known as melt rock. The detonation releases a number of radionuclides that consist of spent nuclear fuel, fission products, activation products, and their resulting radioactive daughter products. In varying degrees, the different radionuclides released by the underground tests can be considered sources of contamination that can migrate away from the detonation point. Many of the radionuclides produced by the detonations convert from a melted phase to a solid phase during early stages of cooling and are primarily incorporated in the melt rock (refractory components). Though essentially immobile, components in the melt rock are subject to dissolution by and transport with formation liquids. The volatile radionuclides, which have the potential to occur as gases at relatively low temperatures, tend not to be incorporated in the melt rock. They are far more mobile than solid-phase components and have the ability to move in both the gas and liquid phases. An example is tritium in the form of water, which can migrate in the subsurface both as liquid water and water vapor. An underground nuclear detonation produces a pressure pulse that moves spherically outward from the detonation point, compressing and compacting the surrounding rock. The degree of compaction is much less in the overlying rock than in underlying material because the shock from the blast tends to be released to the ground surface, whereas underlying rock is forced to absorb any downward-directed energy. Typically, the overlying fractured rock will collapse into the cavity and create a “rubble”-filled chimney. The most significant contaminants of concern (COCs) at these sites are detonation-related radionuclides released thousands of feet below ground surface (bgs). At some Nevada Offsites, waste streams occurring at or near ground surface were disposed of in underground adits or the detonation chimneys and then sealed within the subsurface. The sources of these wastes varied; some result from deep fluids temporarily brought to ground surface after reentry holes were drilled into the test chimneys and others stem from aboveground activities (e.g., drilling). A1.4 Tritium as an Indicator Parameter Aqueous-phase and gas-phase tritium concentrations are used as indicators of possible radionuclide transport away from detonation points at all of the Nevada Offsites. Of all the radionuclides potentially deposited in the subsurface during and shortly after a nuclear test, tritium has the greatest capacity to be observed on the leading edge of a contaminant plume migrating away from the chimney. This is attributed to the fact that tritium occurs as tritiated

Gasbuggy, New Mexico Long-Term Hydrologic Monitoring Program Evaluation Report U.S. Department of Energy Doc. No. S04019 June 2009, Rev. 3 Page A−4
water molecules, and, as a consequence, its transport in the aqueous-phase cannot be retarded like the transport of many dissolved constituents. In addition, because tritiated water occurs in the gas phase as tritiated water vapor in unsaturated media, it has the capacity to migrate relatively quickly in gas reservoirs, both by molecular diffusion and advection (in response to pressure gradients). Tritium migrating primarily in the gas phase (as tritiated water vapor) in moisture-bearing unsaturated systems is expected to be detected in water samples because of the relatively quick portioning of tritiated water between adjacent gas and aqueous phases.
A2.0 References
DOE (U.S. Department of Energy), 2000. United States Nuclear Tests, July 1945 through September 1992, DOE/NV—209-REV 15, December.
Appendix B
SeePro Database Information

This page intentionally left blank

U.S. Department of Energy Gasbuggy, New Mexico Long-Term Hydrologic Monitoring Program Evaluation Report June 2009, Rev. 3 Doc. No. S04019 Page B−1
Nevada Offsites historical monitoring data is stored in the SEEPro (Site Environmental Evaluation for Projects) database, a custom database interface based on Microsoft Access. Validation of this data is currently being done by each site’s Subject Matter Expert working with the LM Data Management Group. Ongoing project data are generated mainly from routine sampling. Field data books are assembled for most sampling events. These books contain field log forms where data such as sample location identification (ID), date, QA sample ID, well purge method, sampling method, and field measurements are entered. These forms are completed at the time of sample collection. Subsequently, the completed field books are returned to the project Geochemist, or designee, and the relevant data (water levels, pH, conductivity, dissolved oxygen, oxidation-reduction potential, and turbidity) are loaded into the database. Data from samples submitted to an analytical laboratory are received as both hard copy and as Electronic Data Deliverable files (EDD). The electronic data are loaded into the Oracle electronic database maintained by the LM Data Management Group. The electronic data are accessible using SEEPro. Database security is maintained by keeping the majority of the records in a read-only mode and limiting the ability to change data in the database to only a few of the database managers. The backend SEEPro database is an Oracle database and is backed up on a daily basis. The hard copy analytical reports are archived in the records library in Grand Junction, along with the original field data forms and other relevant hard copy forms or documents containing project data. Well construction and lithology logs are generated for all new wells drilled and are available for some of the historical well locations. These logs are archived in the records library and are also entered into the SEEPro database in the form of gINT logs. In addition to the data collected from sampling, physical project data are also collected and maintained. Physical project data are those that describe the layout of the site, such as buildings, utilities, and roads. Any modification to these features requires documentation and base map feature updates. These updates can be documented by red-lining an existing as-built map. If a contractor is used, both hard copy and EDDs are needed. These deliverables will be archived as appropriate. Historical documents as they are located are delivered to the GIS/CAD Group working in conjunction with the Data Management Group. Some cases require the services of a licensed surveyor. In these cases, the surveyor must, at a minimum, submit both hard copy and EDD. These deliverables will then be archived and verified, and the appropriate data sources will be updated. Individual site environmental data can be accessed over the internet by clicking on the following link: http://gems.lm.doe.gov/imf/sites/gems_continental_us/jsp/launch.jsp. Note the link to a tutorial on this page that may be helpful for using this system. Next launch the map viewer, click on “load site” in the upper left toolbar, then go to the dropdown menu that appears on the right side of the page. Click on the site shown to open the dropdown menu, then select the site of interest and click the “go” button. The right hand side of the page describes the map layers. The environmental data can be found here.

Gasbuggy, New Mexico Long-Term Hydrologic Monitoring Program Evaluation Report U.S. Department of Energy Doc. No. S04019 June 2009, Rev. 3 Page B−2
This page intentionally left blank

Appendix C
Sampling Location Information

This page intentionally left blank

Table C–1. Sampling Location Information⎯Gasbuggy LTHMP Evaluation Report
Station ID Total Depth (ft bgs)
Surface Elevation
(ft)
Geologic Formation Status Drill
Date Casing Recorda
Plugging Record Coordinates Comments
Arnold Ranch Well Well 28.5.25.233 0136-039-35-015
144 NI NI LTHMP sampling location
NI NI Active Sec. 25, T28N, R5W
Arnold Ranch Spring s28.5.25.233 0136-039-35-013
Surface NI Alluvium LTHMP sampling location
NA NA NA-Surface Water
SP East 189075.21 SP North 2051688.2
Bixler Ranch Well Well 30.4.35.221 SJ 03742 POD 1
400 (175) 7,140 Alluvium LTHMP sampling location
NI NI Active SP East 217258.7 SP North 2102563.82
Reference: Mercer, J.W., 1968. Inventory of Wells and Springs within a 10-mile radius of Project Gasbuggy, Rio Arriba County, New Mexico, Open-file Report, U.S. Geological Survey.
Bubbling Springs s29.4.19.411 0136-039-35-318
Surface 6,555 Alluvium LTHMP sampling location
NA NA NA-Surface Water
SP East 194976.67 SP North 2079430.97
Cave Springs s28.4.17.000 0136-039-35-310
Surface 7,400 Alluvium LTHMP sampling location
NA NA NA-Surface Water
SP East 199490.07 SP North 2061102.72
Cedar Springs s28.4.9.233 0136-039-35-320
Surface 7,325 Alluvium LTHMP sampling location
NA NA NA-Surface Water
SP East 205267.26 SP North 2064829.68
EPNG-10-36 0136-039-35-330
4,210 (3,875) 7,184 Pictured Cliffs
Plugged from Pictured Cliffs to Ojo Alamo 1967
Spud 07/06/1957 Completed
1958
Perforations 3,901−4,012 ft; 4,046−4,166 ft; 4,210 TD 52 OD
Plugged, see below.
SP East 218878.96 SP North 2067802.82
This was an El Paso Natural Gas Company well that existed prior to the test. Because it was near the test the well was used as a monitor well. It was re-completed in 1968 just after the test. Pictured Cliffs never sampled for Gasbuggy
EPNG-10-36 API No. 30-039-07488
3,616 (Re-completion
depth) 7,184 Ojo Alamo
Plugged 09/17− 9/19/2003
Spud 07/06/1957 Completed
1956
Perforations 3,571−3,611 ft
Retainer plug 3,512 ft cemented Screen 3,410−3,611 ft. Nacimiento formation cemented with 60 sacks @ 16 lbs/gal Surface casing 174 ft bgs cement retainer 42 sacks @ 1,506 lbs/gal.
Same as above
U.S. D
epartment of E
nergy G
asbuggy, New
Mexico L
ong-Term
Hydrologic M
onitoring Program E
valuation RJune 2009, R
ev. 3
Doc. N
o. S04019
Page C
−1

Table C–1 (continued). Sampling Location Information⎯Gasbuggy LTHMP Evaluation Report
Station ID Total Depth (ft bgs)
Surface Elevation
(ft)
Geologic Formation Status Drill
Date Casing Recorda
Plugging Record Coordinates Comments
Jicarilla Well N Well 30.3.32.343 0136-039-35-045
200 7,038 Alluvium LTHMP sampling location
NI NI Active SP East 229106.69 SP North 2098014.98
Jicarilla Well N Jicarilla Well 2 Ref: Mercer, 1968.
Jicarilla Well S Well 28.3.33.233 0136-039-35-045
81 6,920 Alluvium LTHMP sampling location
NI NI Active SP East 235005.05 SP North 2037980.9
Jicarilla Well S Jicarilla Well 1 Ref: Mercer, 1968.
Jicarilla Well No. 1 Well 29.2.30.234 0136-039-35-336
NI 7,085 NI LTHMP sampling location
NI NI Active SP East 256738.65 SP North 2074140.92
La Jara Creek s29.3.20.211 0136-039-35-335
Surface NI Alluvium LTHMP sampling location
NA NA NA-Surface Water
SP East 229686.14 SP North 2081103.63
Lower Burro Canyon Well Well 28.2.18.331 0136-039-35-117
229 7,089 Alluvium LTHMP sampling location
NI NI Active SP East 253267.72 SP North 2051600.58 Ref: Mercer, 1968.
Pond N s30.3.332.343 0136-039-35-337
Surface 7,038 Alluvium LTHMP sampling location
NA NA NA-Surface Water
SP East 223882.55 SP North 2096969.73
Windmill #2 Well 29.3.29.223 0136-039-35-312
75 6,950 NI LTHMP sampling location
NI NI Active SP East 231119.78 SP North 2075354.15
aUnless otherwise noted the designation of cemented means cemented to the surface. Note: Numbers in ( ) are reported numbers which cannot be resolved with the most likely number. NA = Not Applicable; NI = No Information.
Gasbuggy, N
ew M
exico Long-T
erm H
ydrologic Monitoring Program
Evaluation R
eport U
.S. Departm
ent of Energy
Doc. N
o. S04019
June 2009, Rev. 3
Page C−
2
Appendix D
Sampling History

This page intentionally left blank

Table D−1. Gasbuggy Sampling History
U.S. Department of Energy Gasbuggy, New Mexico Long-Term Hydrologic Monitoring Program Evaluation Report June 2009, Rev. 3 Doc. No. S04019 Page D−1
Site Name Sample ID Physical Sample
Description
Depth (feet bgs)
Sampling Entity 1972 1973 1974 1975 1976 1977 1978 1979 1980 1981 1982 1983 1984 1985 1986 1987 1988 1989 1990 1991 1992 1993 1994 1995
Gasbuggy
Arnold Ranch Well 28.5.25.233 Well 144 EPA NS NS x NS NS x NS NS NS NS x NS NS NS NS NS NS NS x NS NS NS x x
Arnold Ranch Spring 28.5.25.233
Surface Water NA EPA x x NS x x NS x x x x NS x x x x x x x x x NS x NS NS
Bixler Ranch Well 30.4.26.344 Well 175 EPA x x x x x x x x x x x x x x x x x x x x x x x NS
Blanco NM San Juan River
Surface Water NA EPA x x x x x x NS NS NS NS NS NS NS NS NS NS NS NS NS NS NS NS NS NS
Bubbling Springs 29.4.19.411
Surface Water NA EPA x x x x x x x x x x x x x x x x x x x x x x x x
Cave Springs 28.4.17.000
Surface Water NA EPA x x x x x x x x x x x x x x x x x x x x x x x x
Cedar Springs 28.4.9.233
Surface Water NA EPA x NS NS NS NS NS x NS NS NS NS NS NS NS NS x x x x x x x x x
Dulce NM City Water Tap (?) NI EPA x x x x x x NS NS NS NS NS NS NS NS NS NS NS NS NS NS NS x NS NS
Dulce NM La Jara Lake
Surface Water NA EPA x x x x x NS NS NS NS NS NS NS NS NS NS NS NS NS NS NS NS NS NS NS
EPNG-10 -36 Well 3,875 EPA x x x x x x x x x x x x x x x x x x x x x x x x
Jicarilla Well N 30.3.32.343 1984 30.3.32 1987
Well 200 EPA x x NS NS NS NS x NS NS NS NS NS x NS x x x NS NS NS NS NS NS NS
Jicarilla Well S 28.3.33.233 1984 Well 81 EPA x NS NS NS NS x x NS NS NS NS NS x NS NS x x NS x x x NS NS NS
Jicarilla Well No.1 29.2.30.234 Well NI EPA NS NS NS NS NS NS NS NS NS NS NS NS x x x x x NS x x x x x x
La Jara Creek 29.3.20.211
Surface Water NA EPA NS NS NS NS NS x x x x x x x x x x x x x x x x x x x
Lower Burro Canyon Well 28.2.18.331
Well 229 EPA x x x x x x x x x x x x x x x NS x x x x x x x x
Old School House Well Well? NI EPA NS NS NS NS NS NS NS NS NS NS NS NS NS NS NS NS NS NS NS x NS NS NS NS
Pond N s30.3.32.343
Surface Water NA EPA NS NS NS NS NS NS NS NS NS NS NS NS NS NS NS NS x x x x x x x x
Windmill No. 2 29.3.29.233 Well 75 EPA NS NS x x x x x x x x x NS NS x NS x x x NS x x x x NS
NI = no information NS = not sampled NA = not applicable X = location sampled
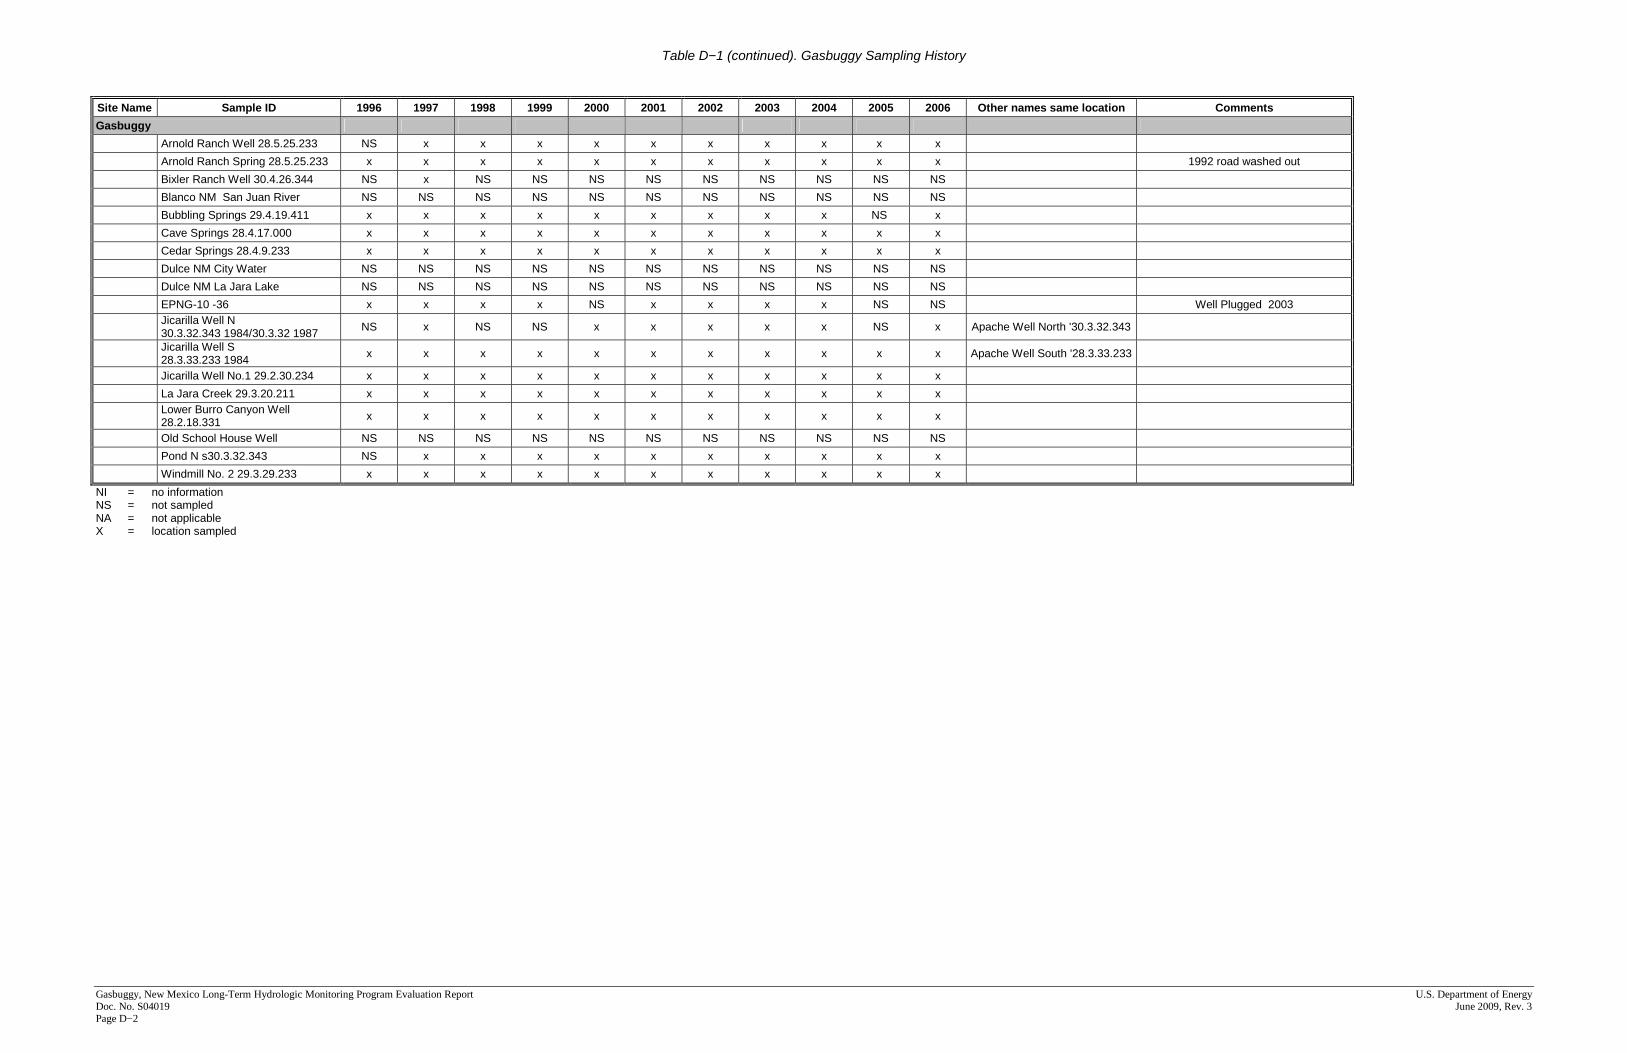
Table D−1 (continued). Gasbuggy Sampling History
Gasbuggy, New Mexico Long-Term Hydrologic Monitoring Program Evaluation Report U.S. Department of Energy Doc. No. S04019 June 2009, Rev. 3 Page D−2
Site Name Sample ID 1996 1997 1998 1999 2000 2001 2002 2003 2004 2005 2006 Other names same location Comments
Gasbuggy
Arnold Ranch Well 28.5.25.233 NS x x x x x x x x x x
Arnold Ranch Spring 28.5.25.233 x x x x x x x x x x x 1992 road washed out
Bixler Ranch Well 30.4.26.344 NS x NS NS NS NS NS NS NS NS NS
Blanco NM San Juan River NS NS NS NS NS NS NS NS NS NS NS
Bubbling Springs 29.4.19.411 x x x x x x x x x NS x
Cave Springs 28.4.17.000 x x x x x x x x x x x
Cedar Springs 28.4.9.233 x x x x x x x x x x x
Dulce NM City Water NS NS NS NS NS NS NS NS NS NS NS
Dulce NM La Jara Lake NS NS NS NS NS NS NS NS NS NS NS
EPNG-10 -36 x x x x NS x x x x NS NS Well Plugged 2003
Jicarilla Well N 30.3.32.343 1984/30.3.32 1987 NS x NS NS x x x x x NS x Apache Well North '30.3.32.343
Jicarilla Well S 28.3.33.233 1984 x x x x x x x x x x x Apache Well South '28.3.33.233
Jicarilla Well No.1 29.2.30.234 x x x x x x x x x x x
La Jara Creek 29.3.20.211 x x x x x x x x x x x
Lower Burro Canyon Well 28.2.18.331 x x x x x x x x x x x
Old School House Well NS NS NS NS NS NS NS NS NS NS NS
Pond N s30.3.32.343 NS x x x x x x x x x x
Windmill No. 2 29.3.29.233 x x x x x x x x x x x
NI = no information NS = not sampled NA = not applicable X = location sampled

Appendix E
Sampling Results

This page intentionally left blank

U.S. Department of Energy Gasbuggy, New Mexico Long-Term Hydrologic Monitoring Program Evaluation Report June 2009, Rev. 3 Doc. No. S04019 Page E−1
E1.0 Sample Result Concentration Plots for the Gasbuggy Site
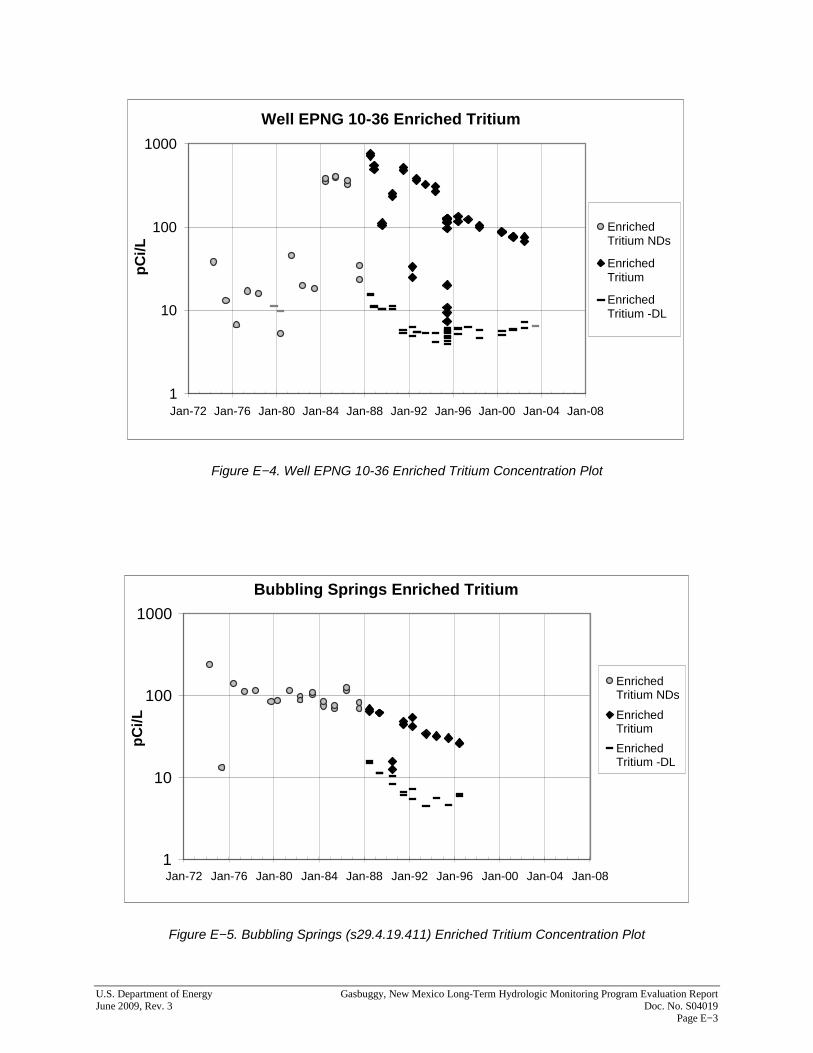
Concentration results are plotted (log scale) at the sampling time for each location with five or more detect results. All sampling results are plotted, both detects and non-detects (NDs). The detection limits (DLs) are plotted along with the sample results. Results that are less than or equal to the detection limits or were qualified as U (below reporting limit), J (estimated), or R (reject) samples by the lab were classified as non-detects. Results with no reported detection limit were also plotted as non-detects for consistency. Many sample results from sampling events prior to the late-1980’s have no reported detection limit. Relatively high values, significantly higher than detection limits of subsequent sampling, should be considered detects for interpretation purposes. The Gasbuggy sample network includes both wells and surface locations.
Figure E−1. Bixler Ranch Well (30.4.35.221) Enriched Tritium Concentration Plot
1
10
100
Jan-72 Jan-76 Jan-80 Jan-84 Jan-88 Jan-92 Jan-96 Jan-00 Jan-04 Jan-08
pC
i/L
EnrichedTritium NDs
EnrichedTritium
EnrichedTritium -DL
Bixler Ranch Enriched Tritium

Gasbuggy, New Mexico Long-Term Hydrologic Monitoring Program Evaluation Report U.S. Department of Energy Doc. No. S04019 June 2009, Rev. 3 Page E−2
Figure E−2. Jicarilla Well No. 1 (29.2.30.232) Enriched Tritium Concentration Plot
1
10
100
Jan-72 Jan-76 Jan-80 Jan-84 Jan-88 Jan-92 Jan-96 Jan-00 Jan-04 Jan-08
pC
i/L
EnrichedTritium NDs
EnrichedTritium
EnrichedTritium -DL
Jicarilla Well S Enriched Tritium
Figure E−3. Jicarilla Well S (28.3.33.233) Enriched Tritium Concentration Plot
1
10
100
Jan-72 Jan-76 Jan-80 Jan-84 Jan-88 Jan-92 Jan-96 Jan-00 Jan-04 Jan-08
pC
i/L
EnrichedTritium NDs
EnrichedTritium
EnrichedTritium -DL
Jicarilla Well 1 Enriched Tritium
U.S. Department of Energy Gasbuggy, New Mexico Long-Term Hydrologic Monitoring Program Evaluation Report June 2009, Rev. 3 Doc. No. S04019 Page E−3
Figure E−4. Well EPNG 10-36 Enriched Tritium Concentration Plot
Figure E−5. Bubbling Springs (s29.4.19.411) Enriched Tritium Concentration Plot
1
10
100
1000
Jan-72 Jan-76 Jan-80 Jan-84 Jan-88 Jan-92 Jan-96 Jan-00 Jan-04 Jan-08
pC
i/L
EnrichedTritium NDs
EnrichedTritium
EnrichedTritium -DL
Well EPNG 10-36 Enriched Tritium
1
10
100
1000
Jan-72 Jan-76 Jan-80 Jan-84 Jan-88 Jan-92 Jan-96 Jan-00 Jan-04 Jan-08
pC
i/L
EnrichedTritium NDs
EnrichedTritium
EnrichedTritium -DL
Bubbling Springs Enriched Tritium

Gasbuggy, New Mexico Long-Term Hydrologic Monitoring Program Evaluation Report U.S. Department of Energy Doc. No. S04019 June 2009, Rev. 3 Page E−4
1
10
100
1000
Jan-72
Jan-76
Jan-80
Jan-84
Jan-88
Jan-92
Jan-96
Jan-00
Jan-04
Jan-08
pC
i/LEnrichedTritium NDs
EnrichedTritium
EnrichedTritium -DL
Cave Springs Enriched Tritium
Figure E−6. Cave Springs (s28.4.17.000) Enriched Tritium Concentration Plot
Figure E−7. Cedar Springs (s28.4.9.233) Enriched Tritium Concentration Plot
1
10
100
Jan-76 Jan-80 Jan-84 Jan-88 Jan-92 Jan-96 Jan-00 Jan-04 Jan-08
pC
i/L
EnrichedTritium NDs
EnrichedTritium
EnrichedTritium -DL
Cedar Springs Enriched Tritium

U.S. Department of Energy Gasbuggy, New Mexico Long-Term Hydrologic Monitoring Program Evaluation Report June 2009, Rev. 3 Doc. No. S04019 Page E−5
Figure E−8. La Jara Creek (s29.3.20.211) Enriched Tritium Concentration Plot
Figure E−9. Pond N (s30.3.32.343) Enriched Tritium Concentration Plot
1
10
100
1000
Jan-86 Jan-90 Jan-94 Jan-98 Jan-02 Jan-06
pC
i/L
EnrichedTritium NDs
EnrichedTritium
EnrichedTritium -DL
Pond N Enriched Tritium
1
10
100
1000
Jan-72 Jan-76 Jan-80 Jan-84 Jan-88 Jan-92 Jan-96 Jan-00 Jan-04 Jan-08
pC
i/L
EnrichedTritium NDs
EnrichedTritium
EnrichedTritium -DL
La Jara Creek Enriched Tritium

Gasbuggy, New Mexico Long-Term Hydrologic Monitoring Program Evaluation Report U.S. Department of Energy Doc. No. S04019 June 2009, Rev. 3 Page E−6
This page intentionally left blank