Long-Term Financial Planning and Corporate Growth Adapted from Fundamentals of Corporate Finance...
20
Long-Term Financial Planning and Corporate Growth Adapted from Fundamentals of Corporate Finance RWJR, Fourth Canadian Edition (Chapter 4)
-
Upload
melissa-simmons -
Category
Documents
-
view
213 -
download
0
Transcript of Long-Term Financial Planning and Corporate Growth Adapted from Fundamentals of Corporate Finance...

Long-Term Financial Planning and Corporate Growth
Adapted from Fundamentals of Corporate Finance RWJR, Fourth Canadian Edition (Chapter 4)

Definition
Financial planning establishes guidelines for change and growth in a firm.
It focuses on the major elements of a firm's financial and investment policies without examining the individual components of those policies in detail.

How it works
Forecasted growth in assets has to be matched with a corresponding growth in financing:
Start with forecasting the growth in assets Determine how much additional financing is needed Determine whether internal funds are sufficient If necessary, plan for external financing

Exemplification: Rosengarten Corp. Balance sheet ($) & Income Statement
Cash 160
Accounts receivable 440
Inventory 600
Current assets 1200
Fixed assets 1,800
Total assets 3,000
Accounts payable 300
Notes payable 100
Current liabilities 400
Long-term debt 800
Common stock 800
Retained earnings 1,000
Equity 1,800
Total liabilities 3,000
Sales 1,000
Costs (800)
Taxable income 200
Tax (68)
Net income 132
Addition to RE 88
Dividends 44

Assumption
Sales are forecasted to increase by 25%

Pro-forma income statement ($)
This year Forecasted
Sales 1,000 1,250
Costs (800) (1,000)
Taxable income 200 250
Tax (68) 85
Net income 132 165
Addition to RE 88 110
Dividends 44 55

Pro-forma balance sheet ($)
This year Forecasted
Cash 160 200
Accounts receivable 440 550
Inventory 600 750
Current assets 1,200 1,500
Fixed assets 1,800 2,250
Total assets 3,000 3,750
Accounts payable
Notes payable
Current liabilities
Long-term debt
Common stock
Retained earnings
Equity
Total liabilities

Pro-forma balance sheet ($)
This year Forecasted
Cash 160 200
Accounts receivable 440 550
Inventory 600 750
Current assets 1,200 1,500
Fixed assets 1,800 2,250
Total assets 3,000 3,750
Accounts payable 300 375
Notes payable 100 100
Current liabilities 400 475
Long-term debt 800 800
Common stock 800 800
Retained earnings 1,000 1,110
Equity 1,800 1,910
Total liabilities 3,000

Pro-forma balance sheet ($)
This year Forecasted
Cash 160 200
Accounts receivable 440 550
Inventory 600 750
Current assets 1,200 1,500
Fixed assets 1,800 2,250
Total assets 3,000 3,750
Accounts payable 300 375
Notes payable 100 100
Current liabilities 400 475
Long-term debt 800 800
Common stock 800 800
Retained earnings 1,000 1,110
Equity 1,800 1,910
Total liabilities 3,000 3,185 (?!)

Implication:
We need $565 in external financing!
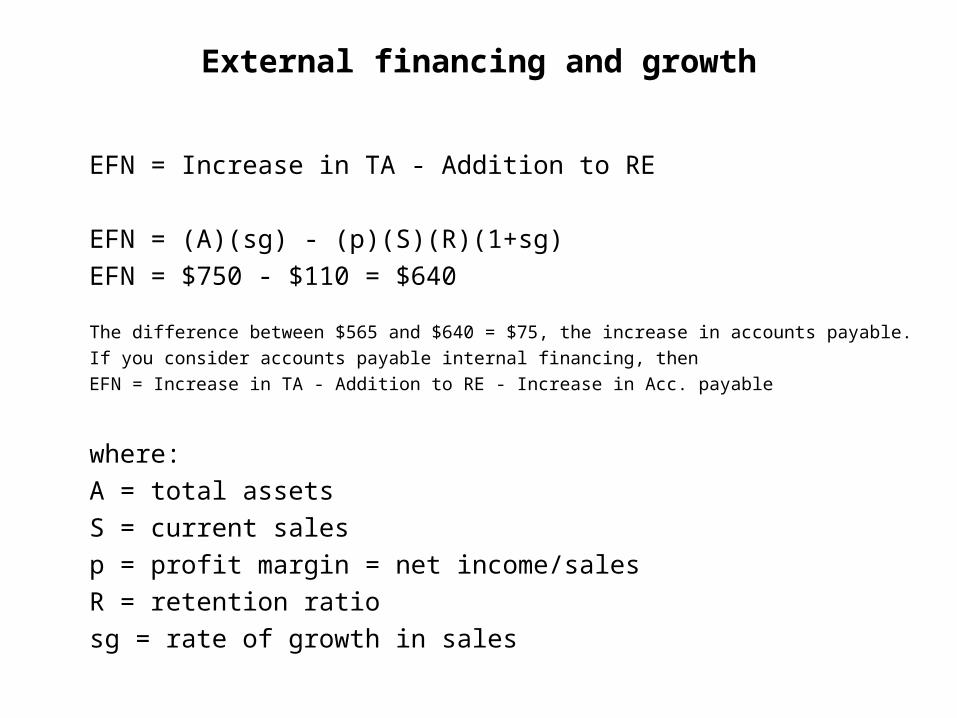
External financing and growth
EFN = Increase in TA - Addition to RE
EFN = (A)(sg) - (p)(S)(R)(1+sg)
EFN = $750 - $110 = $640
The difference between $565 and $640 = $75, the increase in accounts payable.
If you consider accounts payable internal financing, then
EFN = Increase in TA - Addition to RE - Increase in Acc. payable
where:
A = total assets
S = current sales
p = profit margin = net income/sales
R = retention ratio
sg = rate of growth in sales
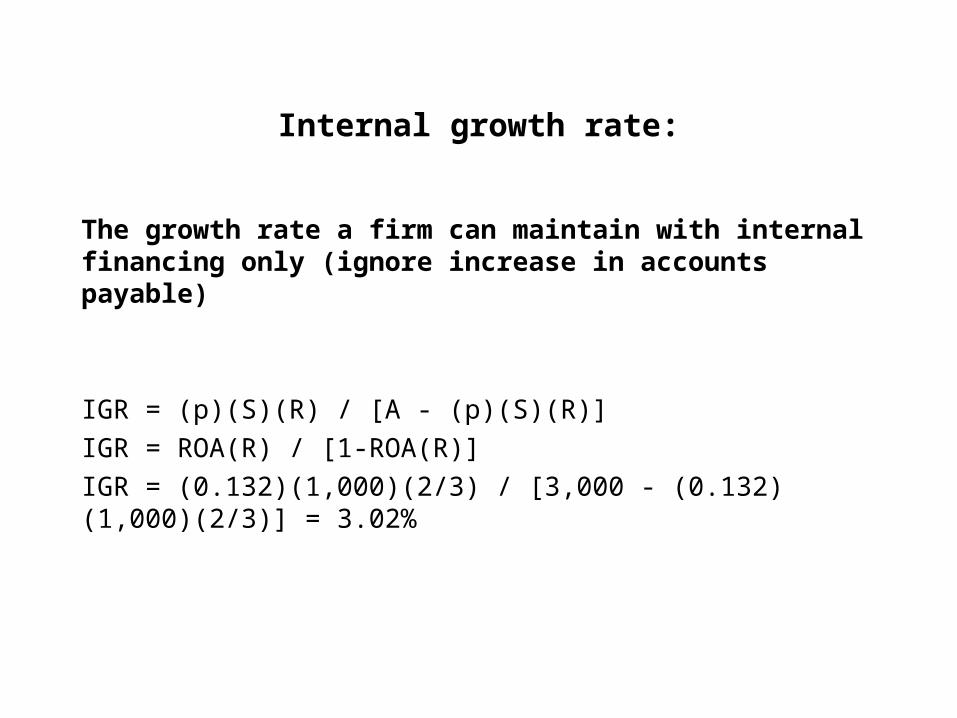
Internal growth rate:
The growth rate a firm can maintain with internal financing only (ignore increase in accounts payable)
IGR = (p)(S)(R) / [A - (p)(S)(R)]
IGR = ROA(R) / [1-ROA(R)]
IGR = (0.132)(1,000)(2/3) / [3,000 - (0.132)(1,000)(2/3)] = 3.02%

Sustainable growth rate:
The growth rate a firm can maintain given its capital structure, ROE, and retention ratio.
EFN = Increase in TA - Addition to RE - New borrowing
SGR = (ROE)(R) / [1 - (ROE)(R)] = (0.0734)(2/3) / [1 - (0.073)(2/3)]
SGR = 5.14%
SGR = (p)(S/A)(1+D/E)(R)/[1- (p)(S/A)(1+D/E)(R)]

Growth and capacity usage
What happens if the firm is not operating at full capacity?
Case (i): Firm operates at 70% capacity
Case (ii): Firm operates at 90% capacity
Additional information: when reaching full capacity the firm will have to expand production by building additional operating plants. Each plant has the potential to increase output/sales by 30 percentage points.
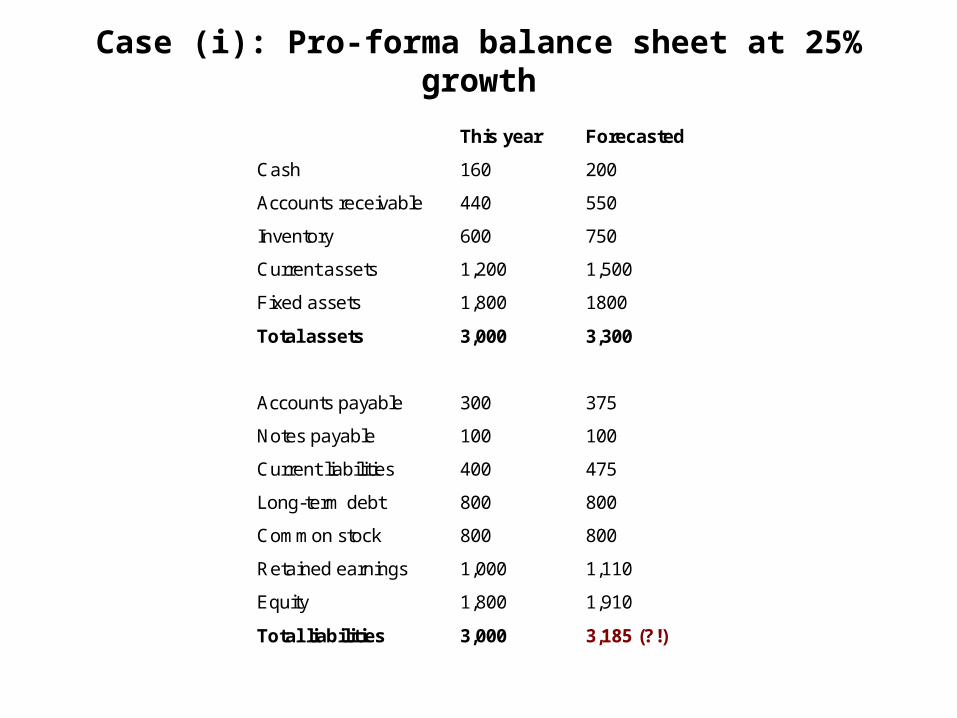
Case (i): Pro-forma balance sheet at 25% growth
This year
Forecasted
Cash
160
200
Accounts receivable
440
550
Inventory
600
750
Current assets
1,200
1,500
Fixed assets
1,800
1800
Total assets
3,000
3,300
Accounts payable
300
375
Notes payable
100
100
Current liabilities
400
475
Long-term debt
800
800
Common stock
800
800
Retained earnings
1,000
1,110
Equity
1,800
1,910
Total liabilities
3,000
3,185 (?!)

Case (i): EFN
We need $3,300 - $3,185 = $115 in external financing.
We could borrow $115 in the short term by issuing commercial paper or short-term notes.

Case (ii): Pro-forma balance sheet at 25% growth
This year
Forecasted
Cash
160
200
Accounts receivable
440
550
Inventory
600
750
Current assets
1,200
1,500
Fixed assets
1,800
2340
Total assets
3,000
3,840
Accounts payable
300
375
Notes payable
100
100
Current liabilities
400
475
Long-term debt
800
800
Common stock
800
800
Retained earnings
1,000
1,110
Equity
1,800
1,910
Total liabilities
3,000
3,185 (?!)
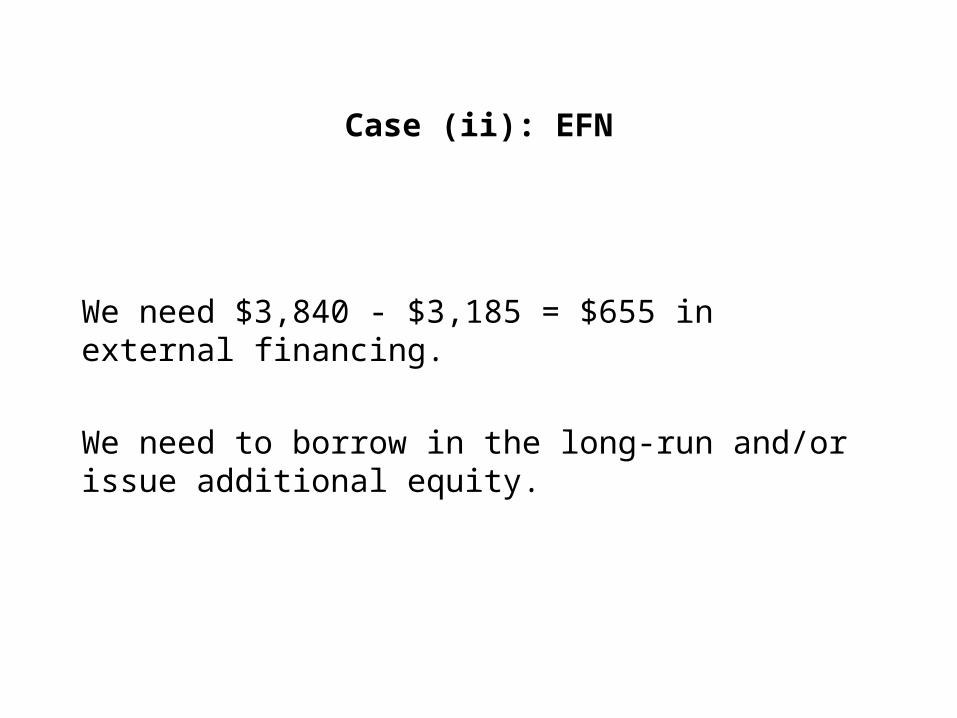
Case (ii): EFN
We need $3,840 - $3,185 = $655 in external financing.
We need to borrow in the long-run and/or issue additional equity.

Comment
Calculating EFN, IGR, SGR with the help of formulas makes the implicit assumption that the firm is operating at full capacity. In reality this is seldom the case.
Forecasting financial growth with the help of pro-forma financial statements is always preferable.

Determinants of growth:
• Profit margin: An increase in the profit margin, increases the firm's ability to generate funds internally and thereby increases its sustainable growth.
• Dividend policy: A decrease in the payout ratio increases internally generated equity, and thus increases sustainable growth.
• Capital structure: An increase in the firm's leverage makes additional debt financing available, and hence increases the sustainable growth rate.
• Total asset turnover: An increase in S/A decreases the firm's need for new assets as sales grow. Hence it increases the sustainable growth rate.


![Corporate Citizenship and Sustainability Report2].pdf · Juniper Networks Corporate Citizenship and Sustainability eport About this Report This document, Juniper Networks’ fourth](https://static.fdocuments.us/doc/165x107/5ec8e60f88523051097b7066/corporate-citizenship-and-sustainability-report-2pdf-juniper-networks-corporate.jpg)


![1 Parallelism, Multicores, Multiprocessors, and Clusters [Adapted from Computer Organization and Design, Fourth Edition, Patterson & Hennessy, © 2009]](https://static.fdocuments.us/doc/165x107/56649e8e5503460f94b91c9c/1-parallelism-multicores-multiprocessors-and-clusters-adapted-from-computer.jpg)