LONG-TERM DECARBONISATION ENERGY PATHWAYS FOR MALAYSIA ... · Peninsular Malaysia Electricity...
23
LONG-TERM DECARBONISATION ENERGY PATHWAYS FOR MALAYSIA USING A HYBRID DEMAND-SUPPLY MODEL By Maragatham Kumar [email protected] The 40 th Annual IAEE International Conference, 2017
Transcript of LONG-TERM DECARBONISATION ENERGY PATHWAYS FOR MALAYSIA ... · Peninsular Malaysia Electricity...

LONG-TERM DECARBONISATION ENERGY PATHWAYS FOR MALAYSIA USING A HYBRID
DEMAND-SUPPLY MODEL
By
Maragatham Kumar
The 40th Annual IAEE International Conference, 2017
• Background• Modelling Challenges• Objective• Methodology• Results & Discussion• Conclusion
OUTLINE
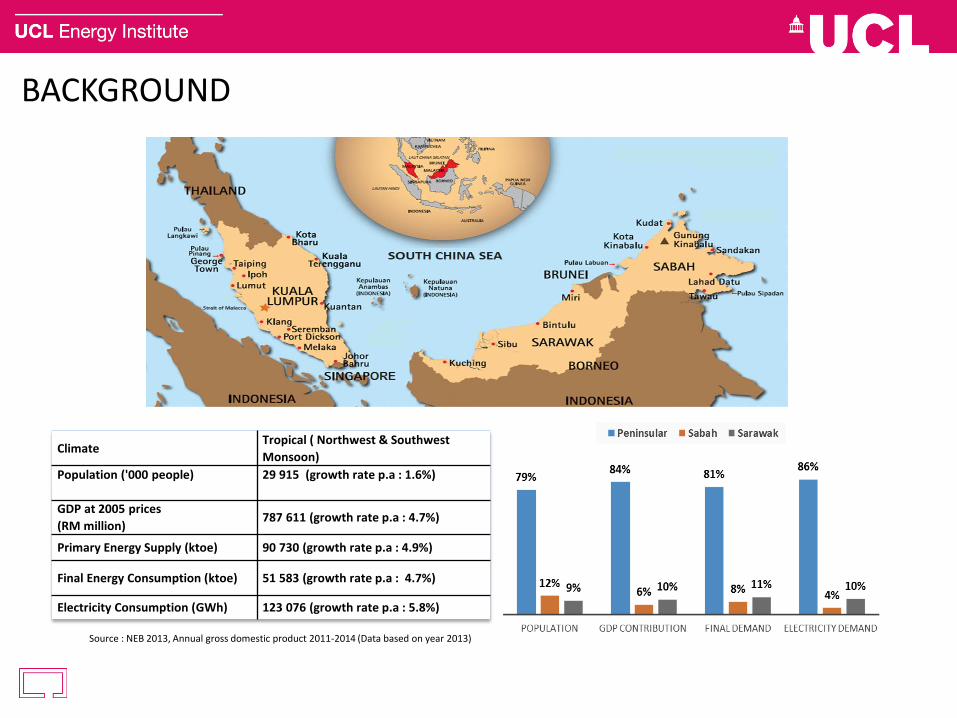
BACKGROUND
ClimateTropical ( Northwest & Southwest
Monsoon)
Population ('000 people) 29 915 (growth rate p.a : 1.6%)
GDP at 2005 prices
(RM million)787 611 (growth rate p.a : 4.7%)
Primary Energy Supply (ktoe) 90 730 (growth rate p.a : 4.9%)
Final Energy Consumption (ktoe) 51 583 (growth rate p.a : 4.7%)
Electricity Consumption (GWh) 123 076 (growth rate p.a : 5.8%)
Source : NEB 2013, Annual gross domestic product 2011-2014 (Data based on year 2013)

MODELLING CHALLENGES
• scenario making of future energy and environmental problems a challenging task - lack of energy systems modelling research compared to the industrialised countries.
• lack of national studies using optimisation model in Malaysia capturing fuel-switching of end-use technologies and multiregional electricity trade.
• important to conduct research looking at the modelling perspective of the demand-supply energy uncertainties
• research is crucial in representing an adequate energy system of developing countries like Malaysia by capturing the characteristic of future energy and economic system
• gap in energy systems modelling research between the industrialised and developing countries
Source: Zamzam Jaafar, Shekarchian, Moghavvemi et al. 2011, Ali, Daut et al. 2012, Khor and Lalchand 2014 , Hosseini, Wahid et al. 2013, Safaai, N. S. M., et al. 2011, NRE 2011 , Fairuz, S. M. C., et al 2013, Koh, S. L., et al. 2011 , Urban, F., et al. (2007)

OBJECTIVE
• to explore and analyse decarbonisation pathways up to 2050 and how the country’s low carbon electricity transitions are evolving to meet the imposed emission constraints
• hybrid model (MAED-OSEMOSYS) to examine the demand-supply energy system and analyse the fuel combustion emissions in the energy sector.
• to analyse fuel-switching of end-use technologies in major sectors when gradual carbon emission constraints imposed until 2050.
• focuses on the alternative technologies needed in the power sector to meet the country’s increasing electricity demand as well as satisfying the carbon emission constraints
METHODOLOGY
• The two models (MAED and OSEMOSYS) are soft-linked to generate projections for year 2015-2050 with year 2013 as the base year.
• The detailed demand model, The Model for Analysis of Energy Demand (MAED) captures the range of possible future energy demands in a fast developing country like Malaysia.
• The energy systems supply model, Open Source Energy Modelling Systems (OSEMOSYS) captures technological and resources characteristic of Malaysia as well as its geographical aspects via a multi-regional approach.
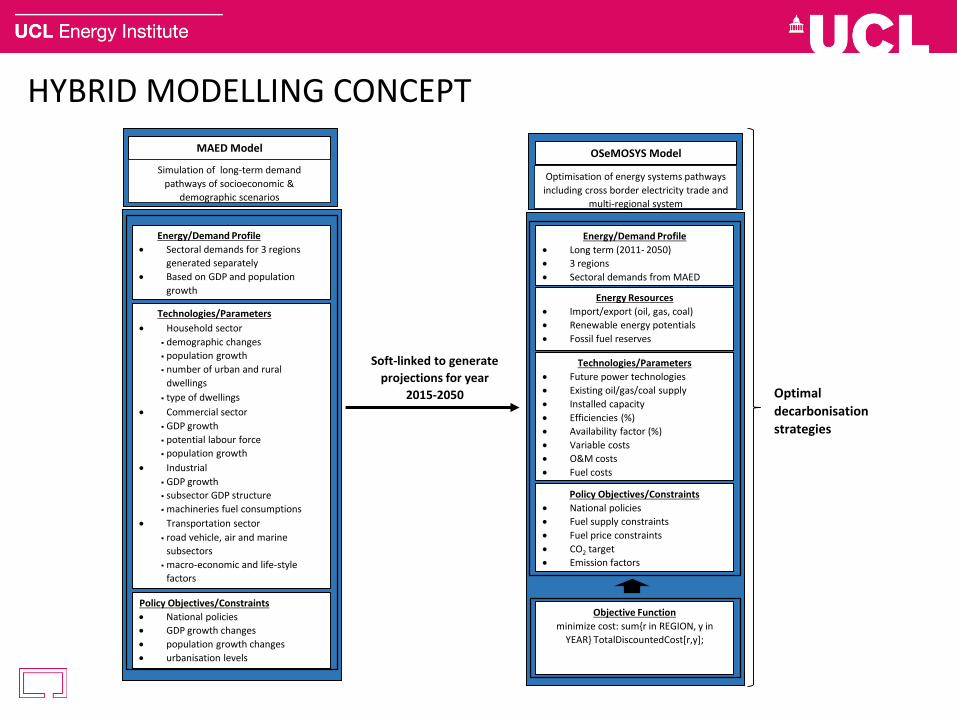
HYBRID MODELLING CONCEPT
Energy/Demand Profile
Long term (2011- 2050)
3 regions
Sectoral demands from MAED
Energy Resources
Import/export (oil, gas, coal)
Renewable energy potentials
Fossil fuel reserves
Technologies/Parameters
Future power technologies
Existing oil/gas/coal supply
Installed capacity
Efficiencies (%)
Availability factor (%)
Variable costs
O&M costs
Fuel costs
Policy Objectives/Constraints
National policies
Fuel supply constraints
Fuel price constraints
CO2 target
Emission factors
Objective Function
minimize cost: sum{r in REGION, y in
YEAR} TotalDiscountedCost[r,y];
Energy/Demand Profile
Sectoral demands for 3 regions
generated separately
Based on GDP and population
growth
Technologies/Parameters
Household sector
demographic changes
population growth
number of urban and rural
dwellings
type of dwellings
Commercial sector
GDP growth
potential labour force
population growth
Industrial
GDP growth
subsector GDP structure
machineries fuel consumptions
Transportation sector
road vehicle, air and marine
subsectors
macro-economic and life-style
factors
Policy Objectives/Constraints
National policies
GDP growth changes
population growth changes
urbanisation levels
MAED Model
Simulation of long-term demand
pathways of socioeconomic &
demographic scenarios
Soft-linked to generate
projections for year
2015-2050
OSeMOSYS Model
Optimisation of energy systems pathways
including cross border electricity trade and
multi-regional system
Optimal
decarbonisation
strategies

METHODOLOGY
The structure of the all sectors (Household, Commercial, Industry, Transport and Power) in OSeMOSYS model are closely linked and able to provide an outlook on fuel transition patterns emerging across end-use and power sectors in order to meet the demand

MODEL SETS & ASSUMPTIONS
Renewable potentials
• Renewable energy strategies (2011-2050)
• Biomass and biogas potential
• Potential solar installation based on availability factor, type of dwellings, roof top areas and household income.
• Hydro potential in Peninsular Malaysia and Borneo Islands
Source: ETP 2010; National Renewable and Action Plan 2009, Eleventh Malaysia Plan 2016-2020, Small Renewable Energy Power Programme (SREP), National Renewable Policy and Action Plan 2009, Chapter 9: Deepening Malaysia’s Palm Oil Advantage, Report: Oil Palm Planted Area by State as at December 2015 (Hectares), Report: Overview of the Malaysian Oil Palm Industry 2015, RECODA Annual Sarawak Report 2014, TNB presentation 2014

MODEL SETS & ASSUMPTIONS
Future infrastructures and fuel prices
• Domestic natural oil consumption in power sector gradually reduced
• Gas supply limited
• Near term planning of new power plants which are under construction and planned to construct
• Technology learning curve and introduction of new technologies (energy demand and supply technologies) adopted from Energy Technology Data Source (ETSAP)
• Smooth technology building rates introduced to avoid extreme switching of end-use technologies
Source: Peninsular Malaysia Electricity Supply Industry Outlook 2014, Sabah Electricity Supply Industry Outlook 2014 and RECODA Annual Sarawak Report 2014, ETSAP

ENERGY SYSTEM CONFIGURATION INPUT
• five energy system configurations developed to evaluate decarbonisation strategies
0.0
100.0
200.0
300.0
400.0
500.0
600.0
700.0
800.0
900.0
2013 2015 2017 2019 2021 2023 2025 2027 2029 2031 2033 2035 2037 2039 2041 2043 2045 2047 2049
MtC
O2
Year
Emission Reduction Scenarios
BAU 20% reduction 40% reduction 60% reduction 80% reduction

RESULTS & DISCUSSION
• demand for electricity by 2050 increases from 12% (20% emission scenario) to 68% (80% emission scenario)
• end-use sectoralelectricity share: most of the electricity by 2050 (20% carbon reduction scenario) used in industrial sector (56%), commercial (28%), household (8%) & transportation (7%).
• The surplus electrification in 80% emission scenario by 2050 is dominated still by industry sector & transport
• The end-use electrification in the 80% emission scenario started post-2035, which initiated large installation of power plants
Others – Renewables mainly solar, followed by biomass and solid waste
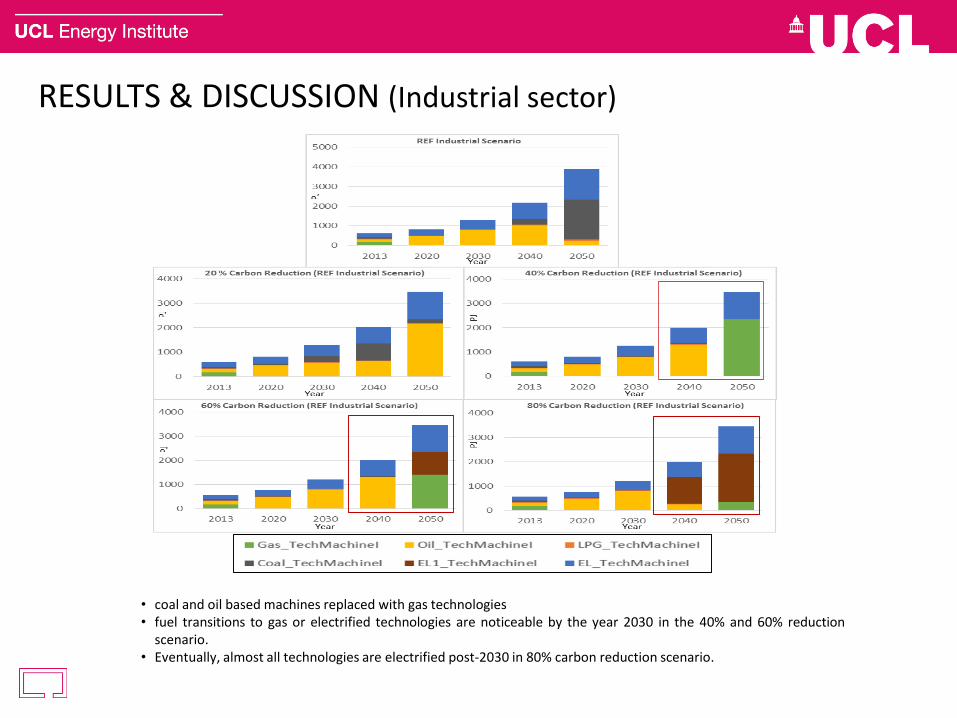
RESULTS & DISCUSSION (Industrial sector)
• coal and oil based machines replaced with gas technologies• fuel transitions to gas or electrified technologies are noticeable by the year 2030 in the 40% and 60% reduction
scenario.• Eventually, almost all technologies are electrified post-2030 in 80% carbon reduction scenario.
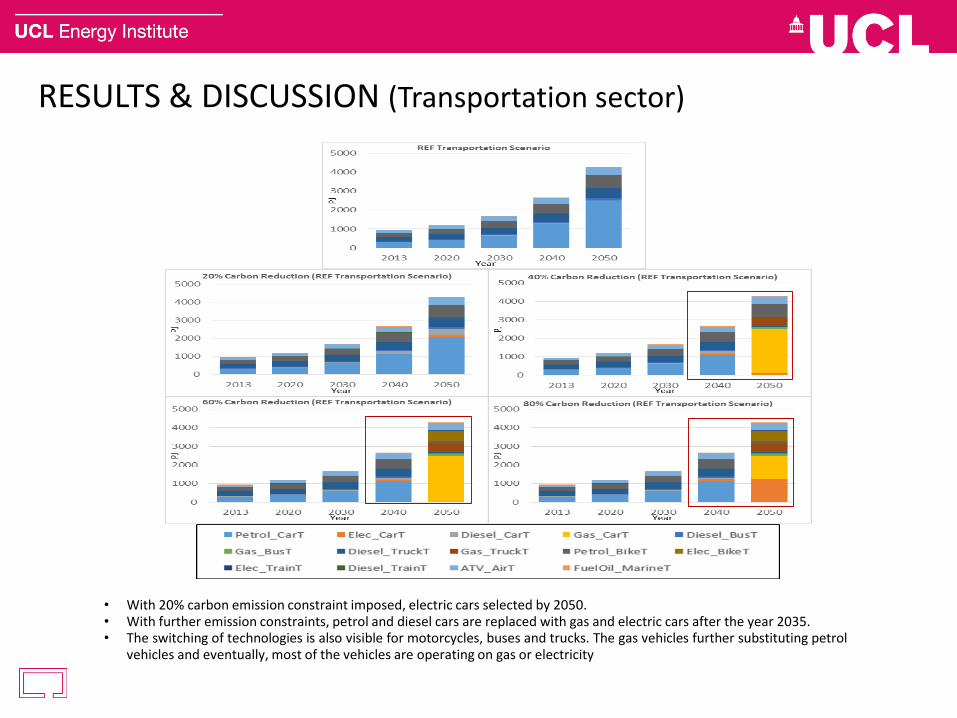
RESULTS & DISCUSSION (Transportation sector)
• With 20% carbon emission constraint imposed, electric cars selected by 2050.• With further emission constraints, petrol and diesel cars are replaced with gas and electric cars after the year 2035.• The switching of technologies is also visible for motorcycles, buses and trucks. The gas vehicles further substituting petrol
vehicles and eventually, most of the vehicles are operating on gas or electricity

RESULTS & DISCUSSION
• calculating the impact of different mitigation strategies on marginal CO2 abatement cost is one of the insights obtained from anoptimisation systems model such as OSeMOSYS.
• marginal CO2 abatement cost measures the cost of reducing the last tonne of CO2
• for 60% and 80% emission reduction scenarios, the abatement costs much higher compared to previous mitigation scenarios, confirming that to reach a high level of emission reduction is generally more costly and a challenging target
• abatement cost is very high as the system struggles to meet the abatement target, mainly due to limited alternatives, constrained potential installed power capacity, electrification of end-use technologies and high investment of electricity trade infrastructure
0
1000
2000
3000
4000
5000
6000
0% 20% 40% 60% 80%
Ave
rage
Sh
ado
w P
rice
of
Car
bo
n
20
13
-20
50
($
/to
nC
O2
)
Percentage of Carbon Emission Reduction
OSeMOSYS-Generated Marginal Abatement Curve
CONCLUSION
• The results illustrate that the more stringent the emission constraint imposed, the cost structure of future technologies becomes more expensive.
• Initially, the oil and coal based technologies are replaced with gas technologies. Eventually, most of these technologies are electrified, which instigate the building of more power plants to fulfil this increased electricity demand.
• In the power sector, Sarawak hydro imports to Peninsular Malaysia, renewables and nuclear energy selected. Although the carbon constraints implemented in the model are very ambitious, yet it provides an insight for a developing country like Malaysia on possible decarbonisation strategies that could be implemented in future not only focusing on power sector, but also emphasising on the end-use technologies in various sector
• Hence, this research contributes towards the modelling of end-use technologies as well as exploring the country’s commitment towards emission reductions.

NEXT STEP
Structural uncertainty scenarios:
• To amend the objective function in the OSeMOSYS model to include the Modelling-to-generate alternatives (MGA) technique
• MGA systematically explores the feasible, near-optimal solution space in order to develop alternatives that are maximally different

THANK YOU

INTRODUCTION
The country is undergoing some major changes in relation to energy use in the country:• GDP to grow by 5%-6% p.a. manufacturing and services sectors to
contribute ~75% of GDP• Increasing population, urbanisation and electrification rate• net oil importer in near future, yet fossil fuels widely consume • Energy policies to diversify and seek new alternatives • Significant current generation capacity scheduled for retirement - next ten
years. • investment of new power plants needs to consider the resources
potentials, security of fuel supply and potential fuel prices fluctuation • Commitment to reduce its greenhouse gas (GHG) emissions intensity of
GDP by 45% by 2030 relative to the emissions intensity of GDP in 2005 (INDC)
Source: ETP 2010; 11th MP, Rahim and Liwan 2012, Rahman Mohamed and Lee 2006; Oh, Pang et al. 2010, Peninsular Malaysia Electricity Supply Industry Outlook 2014; Peninsular Malaysia Electricity Supply Industry Outlook 2016 , UNFCCC 2015 , NRE 2011

RESULTS & DISCUSSION
• tightening emission constraints leads to radical changes in the technology mix with profound implications for overall electricity production and trade across the three regions
• end-use technologies in sectors switches from fossil fuels to electrified technologies as the percentage of the emission constraints increased
0%
10%
20%
30%
40%
50%
60%
70%
80%
90%
100%
2013 2020 2030 2040 2050 2020 2030 2040 2050 2020 2030 2040 2050 2020 2030 2040 2050 2020 2030 2040 2050
REF 20% 40% 60% 80%
Per
cen
tage
Carbon Reduction Scenarios
Total Installed Capacity
Gas Coal Hydro Others Nuclear Diesel ELecImport

METHODOLOGY
Framework of Open Source Energy Modelling Systems (OSEMOSYS).
LPG from
storage
tanks/cylinder
Electricity from
Grid
Cooking
Appliances
Gas Oven/Hob
Electrical
Oven/Hob
Electrical
Appliances
Other Electrical
App.
Air Conditioners
Lighting
Cooking
Appliances
Gas Oven/Hob
Electrical
Oven/Hob
General
Equipment
Motor Power
Electrical
Appliances
Air Conditioner
Gas Air Cond
Electric Air Cond
LPG from
storage
tanks/cylinder
Electricity from
Grid
Gas Fuel
Oil Products
• divided to cooking appliances and electrical appliances
• divided to cooking appliances, General Equipments and Air conditioner

METHODOLOGY
Diesel from
Refinery
NGV from Refinery
Biodiesel
Jet Fuel
Fuel Oil
Petrol from
Refinery
Electricity from
Grid Diesel Trucks
Diesel Rail
Two-wheelers
(Gasoline & Electric)
Electric Rail
Gasoline car
Electric Hybrid car
sAppliances
Diesel/Bio-diesel car
NGV hybrid car
Air Transport
Sea Transport
Road Transport
(Car Travel)
Rail Transport
Road Transport
(Light/Heavy)
Air Crafts
Marine
Diesel Bus
NGV hybrid Bus
NGV hybrid Trucks
Other fuels (e.g.
coal, oil, gas)
Electricity from
Grid Electrical
Equipment
Electric Motors
Other Equipment
Appliances
Pumps
Air-compressors
Machinery &
Equipment
Oil Mach. & Equip.
LPG Mach. & Equip.
Appliances
Gas Mach. & Equip.
Coal Mach. & Equip.
Elec. Mach. & Equip.
Appliances
• divided to fossil fuel Machinery and equipment technologies and Electrical Technologies.
• divided to Road transportation technologies, Rail technologies, Air technology and Sea Technology.
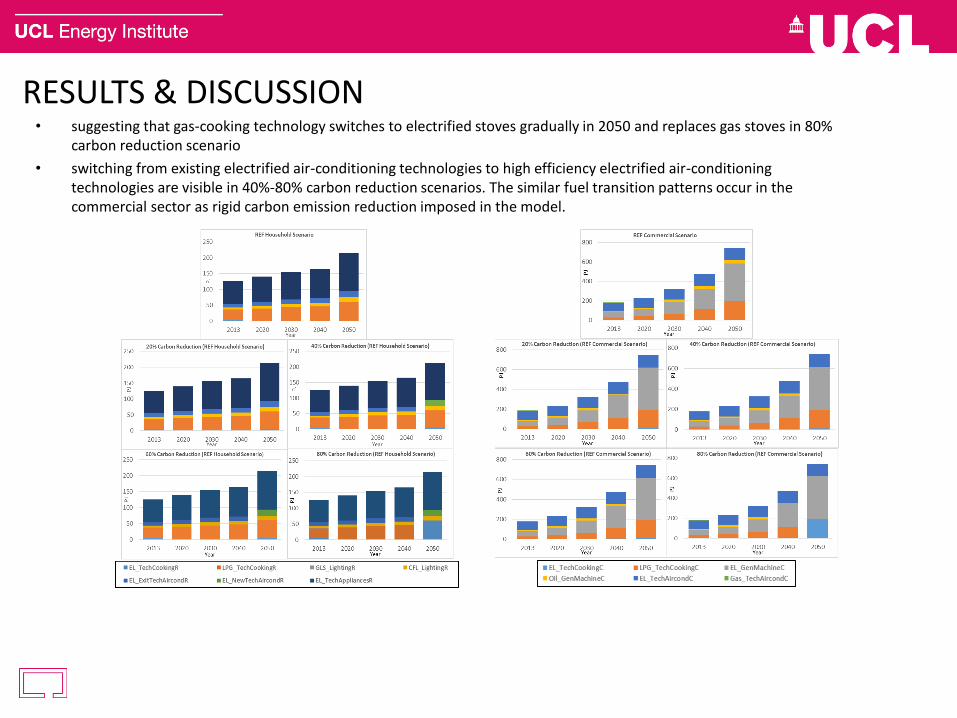
RESULTS & DISCUSSION• suggesting that gas-cooking technology switches to electrified stoves gradually in 2050 and replaces gas stoves in 80%
carbon reduction scenario
• switching from existing electrified air-conditioning technologies to high efficiency electrified air-conditioning technologies are visible in 40%-80% carbon reduction scenarios. The similar fuel transition patterns occur in the commercial sector as rigid carbon emission reduction imposed in the model.