Long-term changes to water levels in Thirlmere Lakes ... Lakes.pdf · upsidence at the surface...
53
Samira Schädler and Richard T. Kingsford Centre for Ecosystem Science, School of Biological, Earth & Environmental Science, University of NSW, NSW 2052, Australia May 2016 Long-term changes to water levels in Thirlmere Lakes – drivers and consequences
Transcript of Long-term changes to water levels in Thirlmere Lakes ... Lakes.pdf · upsidence at the surface...

Samira Schädler and Richard T. KingsfordCentre for Ecosystem Science, School of Biological, Earth & Environmental Science, University of NSW, NSW 2052, Australia
May 2016
Long-term changes to water levels in Thirlmere Lakes – drivers and consequences

2
This publication should be cited as:
Schädler, S. and Kingsford, R.T. (2016). Long-term changes to water levels in Thirlmere Lakes – drivers and consequences. Centre for Ecosystem Science, UNSW, Australia.
Cover designed by: Marc Wenzel
Juxtaposition of a historical photograph of Lake Nerrigorang, taken in 1954 by Annette Bray with a recent photograph taken in 2012.
3
Executive Summary 4
Introduction 6
Methods 9
Study Site 9
Rainfall and evaporation 13
Water levels - Thirlmere Lakes 15
Water extraction 21
Groundwater 21
Other sites 22
Results 23
Bathymetry 23
Abiotic drivers - rainfall patterns, 1900-2014 26
Abiotic drivers – inflows 28
Abiotic drivers – evaporation patterns, 1900-2013 30
Water extraction from Thirlmere Lakes 32
Groundwater 33
Water levels at Thirlmere Lakes 35
Discussion 39
Conclusion 44
Acknowledgements 44
References 45
Appendix 51

4
Executive Summary
Many of the world’s rivers and wetlands have degraded with alteration of flow regimes,
when their water supply is modified. Mostly this is due to impacts of structures (i.e.
dams and weirs), but increasingly mining and access to groundwater have affected
flooding regimes of wetlands. We investigated water levels within Thirlmere Lakes,
which are primarily filled by rainfall but interact with shallow groundwater.
We focused on the three of the five lakes with the most historical data, and compared
inputs from rainfall and water levels over 115 years (1900–2015). This first step
required development of three-dimensional models of the lakes, using topographic
surveys. We then superimposed historical aerial photographs and ground photographs
(1884–2012, n= 49 photographs/maps), allowing determination of water levels. We
also investigated trends in groundwater levels (1999-2011), creating groundwater
contour maps for two periods, before and after 1982, when longwall coal mining began.
Rainfall and catchment inflow patterns were also examined at three nearby water
bodies (Avon, Warragamba and Nepean Dams), acting as ‘control sites’.
There were no significant long-term trends in rainfall at the three ‘control sites’,
although rainfall increased significantly at Thirlmere Lakes (1900 – 2015). There were
similar evaporation patterns at all sites and inflows at the three dams had not
decreased. Contrastingly, there was a severe decline in water levels at Thirlmere
Lakes. The disassociation of inflows and water levels (1930 -2015) had steadily
increased, especially since the 1980’s. In particular, we detected sudden drops in
water levels in 1984, 1997 and 1998 in the three lakes. This did not coincide with the
main period of water extraction for steam engines and Picton Tuberculosis Village at
Thirlmere Lakes (1884-1910).
Groundwater levels in the shallow aquifer declined by up to 40m after mining
commenced in 1982, also coinciding with an exponential increase in the number of
groundwater bores (1940-2011). Although there were no publicly available data on how
much groundwater was extracted each year, the serious decline in water levels
coincided with increased groundwater development and longwall mining (29 longwall
panels (2010)).
These serious declines in water levels in the three Thirlmere Lakes were not climate
related and are best explained by anthropogenic impacts. There are two potential
explanations for the draining of Thirlmere Lakes, which may have acted synergistically:

5
either there was considerable pumping of groundwater or longwall coal mining
disrupted the groundwater aquifers, causing diversion of groundwater resources.
The implications are significant for the ecological character of the Thirlmere Lakes.
There are many affected obligate aquatic species or species reliant on wet habitats,
including five species of waterbirds (Australasian bittern Botaurus poiciloptilus,
Australian painted snipe Rostratula australis, great egret Ardea alba, cattle egret Ardea
ibis, and Latham’s or Japanese Snipe Gallinago hardwickii) one fish species
(Macquarie perch Macquaria australasica), two frog species (giant burrowing frog
Heleioporus australiacus, Littlejohn’s tree frog Litoria littlejohni) and two plant species
(smooth bush pea Pultenaea glabra, Kangaloon sun orchid Thelymitra Kangaloon) that
are listed as threatened. There are serious implications for governments and their
responsibilities for managing the values of Thirlmere Lakes National Park along with
the Blue Mountains World Heritage Area of which it is a part. These major changes in
flooding regimes to Thirlmere Lakes will continue to degrade the Thirlmere Lakes
National Park and its ecological, cultural and recreational values. Most importantly,
identifying the relative importance longwall mining and groundwater pumping on this
deterioration should be a priority, requiring detailed analyses of changes to
groundwater pumping volumes and identifying flow paths for water supplies to
Thirlmere Lakes.

6
Introduction
Wetlands continue to be lost, degraded and altered globally, more than other
ecosystems (Millennium Ecosystem Report 2005). This reflects increasing human
populations and economic development, associated with growing demand for food
production, energy and water, mediated by climate change (Millennium Ecosystem
Report 2005; Vörösmarty et al. 2010; Palaniappan & Gleick 2011; Bogardi et al. 2012;
Junk 2012). The critical factor for all wetlands is the maintenance of a natural flow
regime, including quantity, variability and quality (Mitsch & Gosselink 2000).
Natural flooding regimes are altered by flow interception, degrading wetlands and
affecting dependent biodiversity (Bunn & Arthington 2002; Arthington & Pusey 2003;
Nilsson et al. 2005a; Kingsford 2011; Watts 2011). Dams, weirs and direct pumping of
water from rivers, wetlands and groundwater aquifers ubiquitously impact (Bernadez et
al. 1993; Elmore et al. 2006) on freshwater ecosystems (Kingsford & Thomas 2004;
Nilsson et al. 2005; Kingsford et al. 2006; Vörösmarty et al. 2010). Increasingly, there
is also recognition of the impacts of mining on freshwater ecosystems, either through
direct or indirect pollution, or alteration of surface and groundwater flow regimes
supplying wetland systems (Whitfield 1988; Dawkins 1999; Itasca 2002; Booth 2006;
Booth 2007; McNally & Evans 2007; Jankowski et al. 2008; Marandi et al. 2013).
Concerns about the adverse effects of coal mining on the environment, especially
rivers and wetlands continue to increase with the expansion of mining (Kay et al. 2006;
Krogh 2007).
Thirlmere Lakes are in the Hawkesbury-Nepean Catchment (Fig. 1), affected by
mining, agriculture, river regulation and urbanisation. Tahmoor Colliery, adjacent to
Thirlmere Lakes National Park completed mining of 29 longwall panels by 2010, the
closest only 600m from the lakes (Russell et al. 2010; Pells 2011; Riley et al. 2012;
Gilbert & Associates 2012). Thirlmere Lakes were gazetted as Thirlmere Lakes
National Park (630 ha), one of eight conservation areas within the Greater Blue
Mountains World Heritage Area (National Parks and Wildlife Service NSW 1997). The
lakes are within a buffer zone (Schedule 2 Special Area; Sydney Catchment
Management Act 1998), protecting them from peripheral development and recognizing
that if they are filled, water could overflow into Sydney’s main water supply (National
Parks and Wildlife Service NSW 1997).
Geological stability has produced a diverse freshwater ecosystem at Thirlmere Lakes,
supporting organisms restricted to the catchment and dependent on water, including

7
the freshwater sponge Radiospongilla sceptroides (National Parks and Wildlife Service
NSW 1997). The lakes also provide habitat for two waterbird species protected by
migratory bird agreements: the Australasian Bittern Botaurus poiciloptilus, also listed
as an Endangered species under the Environmental Protection and Biodiversity Act
1999 (EPBC Act, 1999) and the Latham’s or Japanese snipe Gallinago hardwickii.
Thirlmere Lakes were listed as a Wetland of National Importance in 2001 (Environment
Australia 2001) and as a high priority critical habitat for the Australasian bittern and the
Bush-stone curlew Burhinus grallarius in 2007 (DECC 2007).
Sedimentary analyses suggest that water levels at the Thirlmere Lakes have fluctuated
over time, occasionally drying completely (Atkinson 2000). Alternating bands of
black/grey and yellow/red/orange clay indicate alternating wet and dry conditions in
one of the lakes, Lake Baraba (Fig. 1), from over 43,000 years ago until the early
Holocene (~8,500 years ago) (Black et al. 2006). After ~8,500 years ago peat started
to form indicating wetland vegetation and humid environmental conditions. The nearby
Dry Lake (Fig. 1) similarly had fluctuating water levels from the beginning of the
Holocene (~ 10’000 years ago), until 6000-5000 years ago, followed by swamp
vegetation in the last 2000–1000 years, indicative of predominantly wet conditions
(Rose & Martin 2007). Rapid recovery of water levels during predominantly wet
conditions also produced the ‘floating islands’ in Thirlmere Lakes, first described in
1974 (Vorst 1974; Timms 1992). These are thought to be formed by large amounts of
aquatic vegetation, mainly Lepironia articulata und Eleocharis sphacelata, dying back
during dry periods, but becoming buoyant from the gases produced during the
decomposition of the organic matter and forming small floating islands, when water
levels recover (Vorst 1974; Timms 1992).
Anthropogenic impacts have affected water levels in the Thirlmere Lakes over time.
Water was extracted for the steam trains and for the Picton Lakes Tuberculosis Village
water supply in the late 19th and early 20th Century (Riley et al. 2012; Pells 2011; Picton
Lakes Village 1952). Most recently, concern has increased about the potential impacts
of longwall coal mining on groundwater and surface water, resulting in a Commission
of Inquiry by the NSW Government (Riley et al. 2012). Longwall mining inevitably
interferes with groundwater aquifer systems when removing blocks of coal (=longwall
panels) of 250-400m width and 3-4km length from the strata (Altun et al. 2010).
During extraction, the roofs of longwall panels are supported by pillars, which are
removed after mining of each section so that the overlying stratum collapses into the
created void (McNally & Evans 2007). This extends through the different rock layers

8
and, depending on the depth of mining, possibly to the land surface. This horizontal
and vertical movement of different strata layers above and sometimes adjacent to the
area mined possibly results in cracking and fracturing, as well as subsidence or
upsidence at the surface (Booth 2007: Holla & Buizen 2001, Jankowski et al. 2008).
This alters hydrological pressure gradients and permeability of the different rock layers,
affecting groundwater movements and connectivity. Groundwater regimes may be
affected by longwall mining, changing vertically and horizontally over large areas,
sometimes beyond the area mined (Booth 1986; Holla 1997; Dawkins 1999; Holla &
Buizen 2001; Booth 2006; Booth 2007). Further, alterations to these groundwater flow
paths can affect connectivity of surface water and groundwater (Whitfield 1988;
McNally & Evans 2007; Jankowski et al. 2008; Pells 2011). Increased volumes of
surface and groundwater can be drawn down deep into recharge areas (Lahm & Bair
2000), reducing pressures by this water loss. These processes and the effects of
mining are complex and depend on the extent of the impact and geology.
The water in Thirlmere Lakes is predominantly derived from rainfall but the lakes are
also connected to the groundwater system, naturally losing surface water to the
groundwater aquifers (Pells 2011; Riley et al. 2012). There are two main groundwater
systems (shallow and deep) underlying Thirlmere Lakes, separated by a low
permeability layer (Bald Hill Claystone layer, Fig. 2). Usually, if groundwater is
extracted, aquifers are replenished from water from adjacent strata including surface
water. Speculation has increased that recent water levels in the Thirlmere lakes have
remained low or receded more quickly than in the past, coinciding with the start of
longwall coal mining. There are two contrasting assessments of the interaction
between coal mining and water levels at Thirlmere Lakes.
The first maintains that the low permeability Bald Hill Claystone prevents replenishment
of the deep aquifer from the shallow aquifer at Thirlmere Lakes, and so surface water
levels should not be affected by coal mining (Russell et al. 2010; Riley et al. 2012). The
second contends the Bald Hill Claystones’ hydraulic conductivity is similar to the
hydraulic conductivity of the Hawkesbury Sandstone, allowing the shallow groundwater
aquifer to interact with the deeper aquifers and draining water from Thirlmere Lakes
(Pell 2011). A NSW Office of Water investigation concluded that declining water levels
were primarily due to climatic variability, with insufficient subsequent rainfall to fill the
lakes (Russell et al. 2010). However, water levels were estimated to be 1.5m–2.5m
lower than what would be expected if only natural climate drivers were responsible
(Pells 2011). The NSW Government Commission of Inquiry concluded that there was

9
no strong evidence that mining activities by longwall coal mining directly affected
Thirlmere Lakes (Riley et al. 2012).
We aimed to further investigate any association between water level and climatic
conditions, by obtaining historical photographs of water levels and climate data. We
hypothesized that if there were no anthropogenic impacts, water levels should vary
naturally over time, reflecting long-term rainfall patterns. To adequately do this, we had
three specific objectives: 1) to develop an elevation model for three of the lakes to
determine water levels; 2) to examine water level changes in relation to long term
rainfall patterns at Thirlmere Lakes and 3) to compare these results with three other
nearby ‘control’ sites for which similar changes to flow and rainfall patterns might be
expected if changes have occurred for Thirlmere Lakes.
Methods
Study Site We investigated long-term changes to water levels at Thirlmere Lakes and inflows at
three other ‘control’ sites: Avon, Warragamba and Nepean Dams in the Hawkesbury-
Nepean Catchment (21,710 km2, Fig. 1a,b). These latter sites are large dams receiving
water respectively from the Avon, Cordeaux and Nepean Rivers (Markich & Brown
1998; Pinto et al. 2012), and are part of the Upper Nepean Scheme and Sydney’s main
water supply (1888-1907) (Oberatu 2011). We chose these sites because there were
no similar sized natural wetlands near Thirlmere Lakes with similar rainfall and
evaporation. Flow data were also available to track potential run-off and likely filling
patterns for these dams.

10
Most of the catchment area, for the four sites, is (max. elevation 1,290m) (Markich &
Brown 1998; Hector 2011; Pinto et al. 2012), experiencing warm/hot summers and
mild/cold winters with respective mean temperatures of 28.81 ± 1.99 °C (SD)
(December-February, 1907-1975) and 17.43 ± 1.17 °C (SD) (June-August, 1907-1975)
(Australian Government Bureau of Meteorolgy 2013). Mean annual rainfall for Picton
(Fig. 1b) was 803.41 ± 254.97mm (SD) (1880 - 2011), mostly over the summer and
early autumn (Australian Government Bureau of Meteorolgy 2013).
The underlying geology shaped the surface and groundwater systems supplying
Thirlmere Lakes. Thirlmere Lakes consists of five lakes (Fig. 1c), overlaying the
Sydney-Gunnedah basin, accumulated between the Permian and Triassic (Herbert &
Helby 1980). The lakes were probably formed with the Lapstone Monocline, about 15
million years ago, when a meandering stream was isolated from its channel by an uplift
event (Bishop et al. 1982). Originally, a stream drained from Dry Lake into the
Thirlmere Lakes and then west into Blue Gum Creek (Fig. 1c)(Rose & Martin 2007),
which then flowed into Little River and then Warragamba Dam (Vorst 1974; National
Parks and Wildlife Service NSW 1997; Pells 2011; Riley et al. 2012). Since the
Figure 1: Location of Thirlmere Lakes in a) the Hawkesbury Nepean Catchment in NSW, b) and other sites (T-Thirlmere Lakes, A-Avon Dam, N-Nepean Dam, W-Warragamba Dam, P-Picton) with the Greater Blue Mountains World Heritage Area (green outline) and c) where Blue Gum Creek (BG) takes water from the five Thirlmere Lakes (LN-Lake Nerrigorang, LB-Lake Baraba, LC-Lake Couridjah, LW-Lake Werri Berri, LG-Lake Gandangarra), within the boundary of Thirlmere Lakes National Park (filled green), in relation to Tahmoor Coal Colliery Lease (grey area) and 20 nearby longwall mines (dark grey), identified by the date that they were established. The earliest longwall panel (1982) was ~4.5km east from the Thirlmere Lakes. Dry Lake (DL) lay ~1.5 km to the north and was also once connected to the system. There were 5 reference points used (filled circles, 1-5) to identify levels for determining water levels on ground photographs (see Appendix).
a)
c)
b)

11
formation of the Lapstone Monocline, water from Dry Lake no longer reaches Thirlmere
Lakes. Thirlmere Lakes still overflows to the west into Blue Gum Creek and into Little
River to reach Warragamba Dam, but they have not done so since 1974 (Vorst 1974).
It is thought that the water in Thirlmere Lakes is predominantly derived from rainfall but
that the lakes are also connected to the groundwater system (Russell et al. 2010; Riley
et al. 2012). A shallow and deep aquifer system occur at the Thirlmere Lakes,
separated by a layer of low permeability, the Bald Hill Claystone (Fig. 2), which is a
deposit of thick claystone/siltstone beds originating from exposed and weathered
Permian volcanic rock (Branagan et al. 1979; Herbert & Helby 1980, Pells & Pells
2012). Groundwater in the shallow and deep aquifer generally flows to the east,
opposite to surface water flow, along a hydraulic gradient caused by the eastward dip
of the underlying bedrock (Russell et al. 2010; Riley et al. 2012)(Fig. 2).
Figure 2: Conceptual diagram (not to scale) of interactions near Thirlmere Lakes (TL). The water table (blue) and interactions between surface flow and groundwater flow in the shallow and deep aquifers, separated by the Bald Hill Claystone layer (red), under which the coal seam lies (dark grey) where longwall (grey) mining occurs. The strata above the longwall (black dotted) will collapse into the newly created space (goaf) after the resources are removed (after Russell et al. 2010)

12
Thirlmere Lakes are of high conservation importance, gazetted as a National Park in
1972, and providing habitat for dependent aquatic species. These include the
freshwater sponge Radiospongilla sceptroides, endemic to the Warragamba
Catchment Area. Thirlmere Lakes is the only location in Australia where the species
does not produce gemmules, needed for sexual reproduction (NSW National Park and
Wildlife Service, 1997). The threatened water lily species Brasenia schreberi, grey
rushes Lepironia articulata and Eleocharis sphacelata grow in the deep water, possibly
emerging on floating islands after water level fluctuations. Ivy duckweed Lemna trisulca
floats on the water. Pithy sword-sedge Lepidosperma longitudinale and Baumea
teretifolia grow on the water’s edge or partially submerged, making up the Lepironia
Freshwater Wetland Community (Fig. 3), providing habitat for the Australasian bittern
Botaurus poiciloptilus (National Parks and Wildlife Service NSW 2003).
Figure 3: Thirlmere National Park with its lakes and six different vegetation communities and cleared land (NSW Department of Environment and Heritage 2003).

13
In the sandy drainage flats on the eastern lake boundaries, there is the unique
Thirlmere sand swamp woodland (Fig. 3), characterised by the Parramatta red gum
Eucalyptus parramattensis subsp. parramattensis and the flax-leaved paperbark
Melaleuca linariifolia with an understorey of Lepyrodia muelleri. Further, the Oakdale
alluvial rough-barked apple forest with the vulnerable mountain blue gum Eucalyptus
deanei growing in drainage depressions may be dependant on the Thirlmere Lakes
wetland (National Parks and Wildlife Service NSW 2003).
Other wetland dependent fauna include the common eastern froglet Crinia signifera
and the brown-striped frog Limnodynastes peronii (NPWS 1997). There are several
species listed as Vulnerable or Endangered possibly reliant on the Thirlmere Lakes
including: the Australasian bittern Botaurus poiciloptilus, the Australian painted snipe
Rostratula australis and migratory species like the great egret Ardea alba, cattle egret
Ardea ibis, and the Latham’s or Japanese Snipe Gallinago hardwickii, the Macquarie
perch Macquaria australasica, the giant burrowing frog Heleioporus australiacus and
Littlejohn’s tree frog Litoria littlejohni and plant species also depending on swampy
habitats like the smooth bush pea Plutenaea glabra and Kangaloon sun orchid
Thelymitra kangaloon) (Department of Sustainability Environment Water Population
and Communities 2012).
Rainfall and evaporation We collected annual rainfall for the four sites (Thirlmere Lakes, Avon, Warragamba and
Nepean Dams, Fig. 1b), as an index of inflows to each water body. Long-term actual
annual rainfall data were available for different periods for each of the sites: Thirlmere
Lakes (Buxton, 1967 – 2015); Avon Dam (Dapto, 1908 – 2014); Warragamba Dam
(Wallacia, 1944 – 2014) and Nepean Dam (Buxton, 1967 – 2015) (Australian Bureau of
Meteorology, 2011). We used annual rainfall data from the Australian Water Availability
Project (AWAP, www.eoc.csiro.au) for any location in Australia (5 km resolution), 1900
- 2011 (Raupach et al. 2008), to fill the gaps. We tested correlations (Pearson’s)
between annual actual (BOM) and AWAP data for all four sites (Thirlmere Lakes, r =
0.97; Avon Dam r = 0.94, Nepean Dam r= 0.95, Warragamba Dam r = 0.97). After
filling data gaps with AWAP data, we had annual rainfall data sets for 1900-2014. We
also used modelled pan evaporation data from AWAP for the same period (Raupach et
al. 2008), estimating evaporation from the water bodies (Lowe et al 2009).
Annual rainfall was used to calculate cumulative rainfall residuals, the differences
between annual and mean rainfall, to produce cumulative rainfall departure curves. We
also ranked annual rainfall to identify quartiles of rainfall. We used the Mann Kendall
14
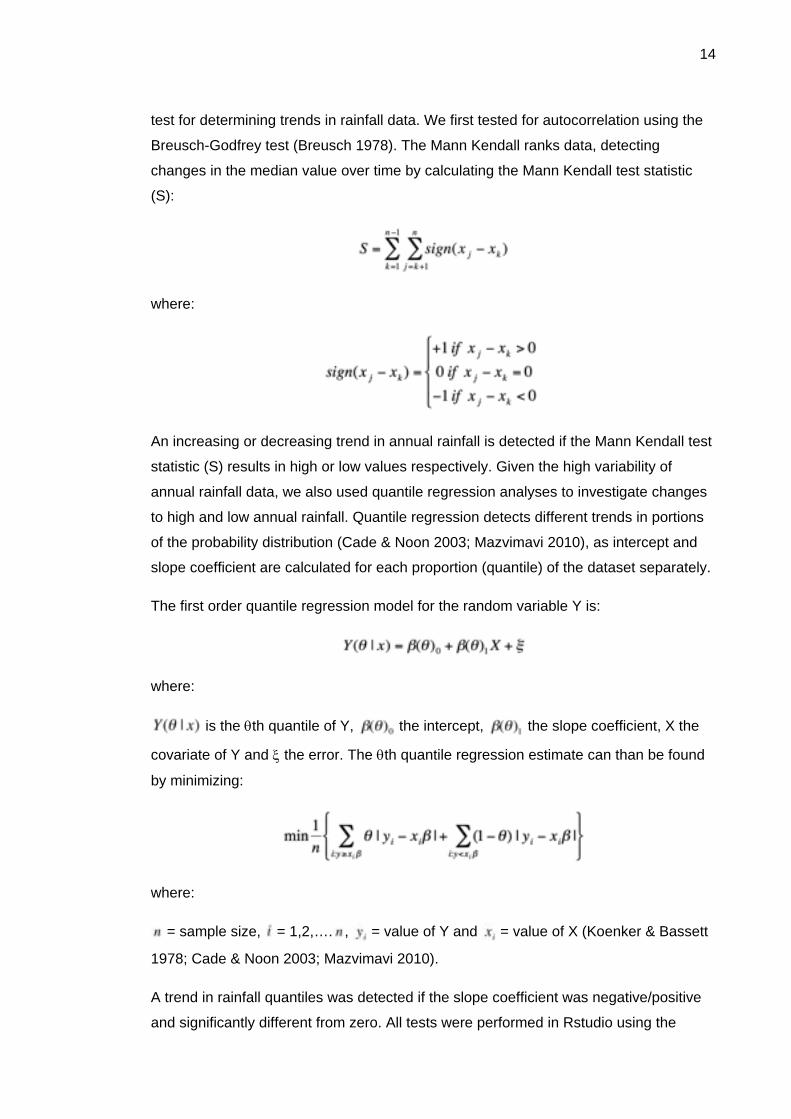
test for determining trends in rainfall data. We first tested for autocorrelation using the
Breusch-Godfrey test (Breusch 1978). The Mann Kendall ranks data, detecting
changes in the median value over time by calculating the Mann Kendall test statistic
(S):
where:
An increasing or decreasing trend in annual rainfall is detected if the Mann Kendall test
statistic (S) results in high or low values respectively. Given the high variability of
annual rainfall data, we also used quantile regression analyses to investigate changes
to high and low annual rainfall. Quantile regression detects different trends in portions
of the probability distribution (Cade & Noon 2003; Mazvimavi 2010), as intercept and
slope coefficient are calculated for each proportion (quantile) of the dataset separately.
The first order quantile regression model for the random variable Y is:
where:
is the θth quantile of Y, the intercept, the slope coefficient, X the
covariate of Y and ξ the error. The θth quantile regression estimate can than be found
by minimizing:
where:
= sample size, = 1,2,…. , = value of Y and = value of X (Koenker & Bassett
1978; Cade & Noon 2003; Mazvimavi 2010).
A trend in rainfall quantiles was detected if the slope coefficient was negative/positive
and significantly different from zero. All tests were performed in Rstudio using the

15
packages “Kendall”, “lmtest” and “quantreg” (McLeod 2011; Koenker et al. 2013;
Hothorn et al. 2014) .
Water levels - Thirlmere Lakes Water levels at Thirlmere Lakes were not routinely collected, until recently (NSW
Department of Environment and Heritage 2013). We therefore used indirect methods to
estimate historical water levels in the lakes (1884-2012) using available imagery
(historical aerial and ground photographs), maps (n = 49 photographs and maps,
Appendix) and oral history records. We focused on three lakes, Lake Couridjah, Lake
Werri Berri and Lake Nerrigorang (Fig. 1c), as data were primarily available for these
more frequented lakes.
To systematically access all available historical imagery, we searched for photographs
in relevant libraries including the National and State Library, State Records and the
Historical Society in Picton. We also interviewed researchers and asked holidaymakers
for material on Thirlmere Lakes. Photographs from flickr.com and taken by the
community (with permission) were used. The key criterion for use was unequivocal
specification of dates and inclusion of reference points (Fig. 1c). We identified 30
ground photographs, with reference points and dates, from different origins (1884–
2012, Appendix).
We also identified 15 aerial photographs (1937-2010) from the NSW Government Land
and Property Information, the National Library and the NSW State Records (Appendix
1). In addition, we used Parish Maps from Land and Property Information, 1897-1953
(NSW Government Land & Property Information 2012) and other maps from libraries,
including the National Library in Canberra and the NSW State Library (Appendix).
Where we used oral history records stating water levels were low, we used the levels
when the lakes were filled to one quarter to ensure we did not underestimate the
levels.
We also developed a digital three-dimensional elevation model from topographic
survey data of the three lakes (Fig. 4), by surveying 612 points over six months: Lake
Werri Berri (249), Lake Couridjah (138) and Lake Nerrigorang (225). We focused on
the natural break points in the environment (lake bed, slope, high point), ensuring
capture of the bathymetry of the lakes. This involved measuring elevation at 3-4 points
along a line of sight of the surveyor, repeated about every 25m, using a digital
elevation surveyor (Sokkia Total Station, Set 5 50rx, Fig. 4). The Total Station used
laser beams to measure horizontal and vertical angles and slope distances to a prism

16
(Advanced Prism AP Series), mounted on an adjustable pole held upright at the natural
break points (Fig. 4). Prisms provided high accuracy (±2mm km-1, (Sokkia Topcon Co.
Ltd. 2009), even over the greatest distance recorded (685.297m). Zenith angle,
collimation error, Earth curvature and refraction were automatically adjusted for each
calculation of elevation (Sokkia Topcon Co. Ltd. 2009).
We also tested for potential bias to elevation estimates, caused by swelling and
expanding peat, with different moisture content by repeating six measurements at each
lake over the six-month period; all points were within 0.28% of each other.
We also established survey benchmarks at the three lakes (Lake Couridjah (2), Lake
Nerrigorang (9), Lake Werri Berri (7)), allowing us to combine data and produce a
digital elevation model across all three lakes. These were pegs in the ground, left at the
site during the whole period of the survey, and were remeasured over time. The
number of benchmarks for each lake was based on the size of the lake and visibility.
We also surveyed three survey points established by the NSW Office of Water in May-
June 2011 for the three lakes (Russell 2012), and included these in the digital elevation
model (DEM). Each survey point was converted from a relative measurement
(distances and bearings) into real coordinates. The measured changes in northing,
Figure 4: Measurement of bathymetry of three lakes, Lake Couridjah, Lake Werri Berri and Lake Nerrigorang, surveyed to develop a three dimensional model of lake levels, using a digital elevation surveyor (Sokkia Total Station, Set 5 50rx), focused on an AP Prism (photo S.Schadler).
17
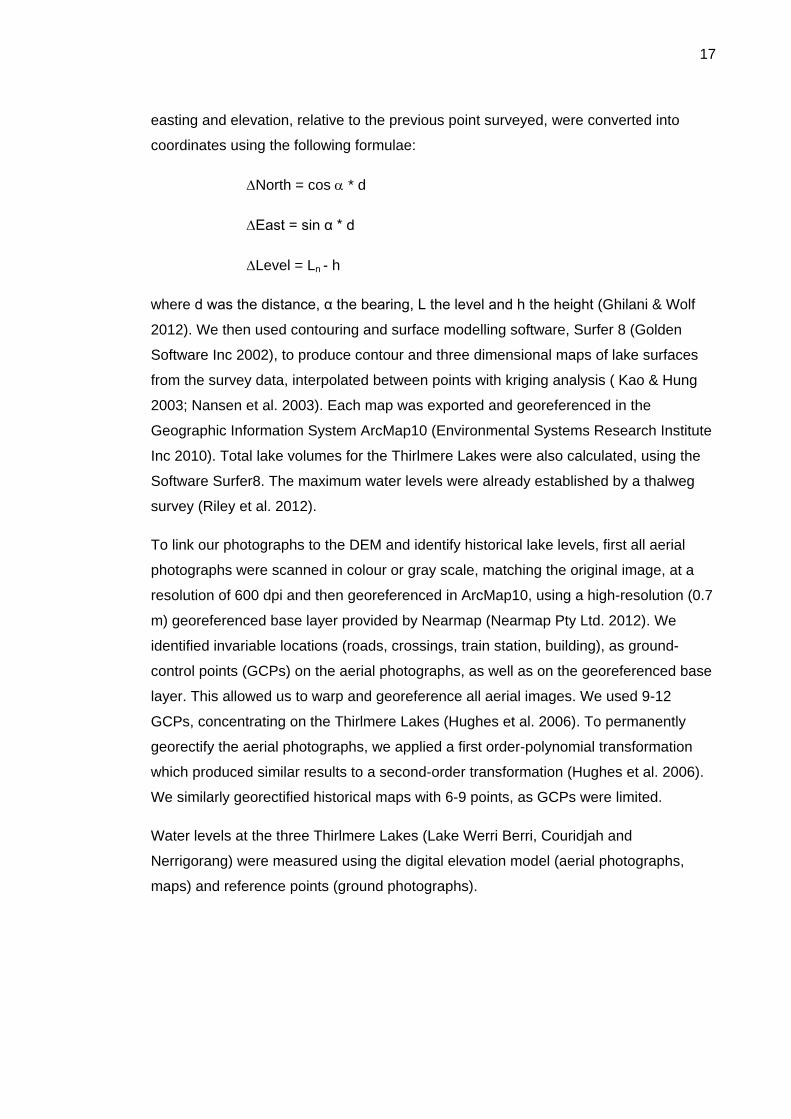
easting and elevation, relative to the previous point surveyed, were converted into
coordinates using the following formulae:
∆North = cos α * d
∆East = sin α * d
∆Level = Ln - h
where d was the distance, α the bearing, L the level and h the height (Ghilani & Wolf
2012). We then used contouring and surface modelling software, Surfer 8 (Golden
Software Inc 2002), to produce contour and three dimensional maps of lake surfaces
from the survey data, interpolated between points with kriging analysis ( Kao & Hung
2003; Nansen et al. 2003). Each map was exported and georeferenced in the
Geographic Information System ArcMap10 (Environmental Systems Research Institute
Inc 2010). Total lake volumes for the Thirlmere Lakes were also calculated, using the
Software Surfer8. The maximum water levels were already established by a thalweg
survey (Riley et al. 2012).
To link our photographs to the DEM and identify historical lake levels, first all aerial
photographs were scanned in colour or gray scale, matching the original image, at a
resolution of 600 dpi and then georeferenced in ArcMap10, using a high-resolution (0.7
m) georeferenced base layer provided by Nearmap (Nearmap Pty Ltd. 2012). We
identified invariable locations (roads, crossings, train station, building), as ground-
control points (GCPs) on the aerial photographs, as well as on the georeferenced base
layer. This allowed us to warp and georeference all aerial images. We used 9-12
GCPs, concentrating on the Thirlmere Lakes (Hughes et al. 2006). To permanently
georectify the aerial photographs, we applied a first order-polynomial transformation
which produced similar results to a second-order transformation (Hughes et al. 2006).
We similarly georectified historical maps with 6-9 points, as GCPs were limited.
Water levels at the three Thirlmere Lakes (Lake Werri Berri, Couridjah and
Nerrigorang) were measured using the digital elevation model (aerial photographs,
maps) and reference points (ground photographs).

18
The georectified aerial photographs and maps were integrated with the digital elevation
model (DEM) in ArcMap, to estimate water levels. We digitised the area covered by
water on each photograph or map and lake, producing separate shapefiles in
ArcMap10. We then draped the shapefile of water coverage over the DEM (Fig. 5).
Each cell of the DEM was associated with an elevation value that could be retrieved.
We identified elevation on the DEM of the water edge (=water level) at four random
points along the outline of the water coverage polygon (Fig. 5). Georeferencing errors
caused by elevation, angle distortion and obstructed views of the lake edge meant that
sometimes these four estimates did not coincide and so we adjusted the water
Figure 5. An example of how water levels were calculated for Lake Couridjah in February 2002. The digitised water coverage (red line) was overlayed on our DEM and then four random points used (white circles) to estimate water levels of lakes. Grey shading shows different water levels (mAHD).

19
coverage layer in relation to the DEM, until the four random points were within ± 0.1m
(Fig. 5).
We estimated water levels for two maps of the Parish of Couridjah (1894-1951) and
three historical maps (Appendix), by comparing them to a similar aerial photograph.
For these historical maps, the lakes were shown as full and all connected, indicating
that water level was the same or higher than the water level of the aerial photograph
from 1955, when the lakes were similarly connected. All water levels on historical maps
had the water levels for the three lakes from the 1955 aerial photograph: Lake
Couridjah (302.85 mAHD), Lake Werri Berri (304.45 mAHD) and Lake Nerrigorang
(302.4 mAHD).
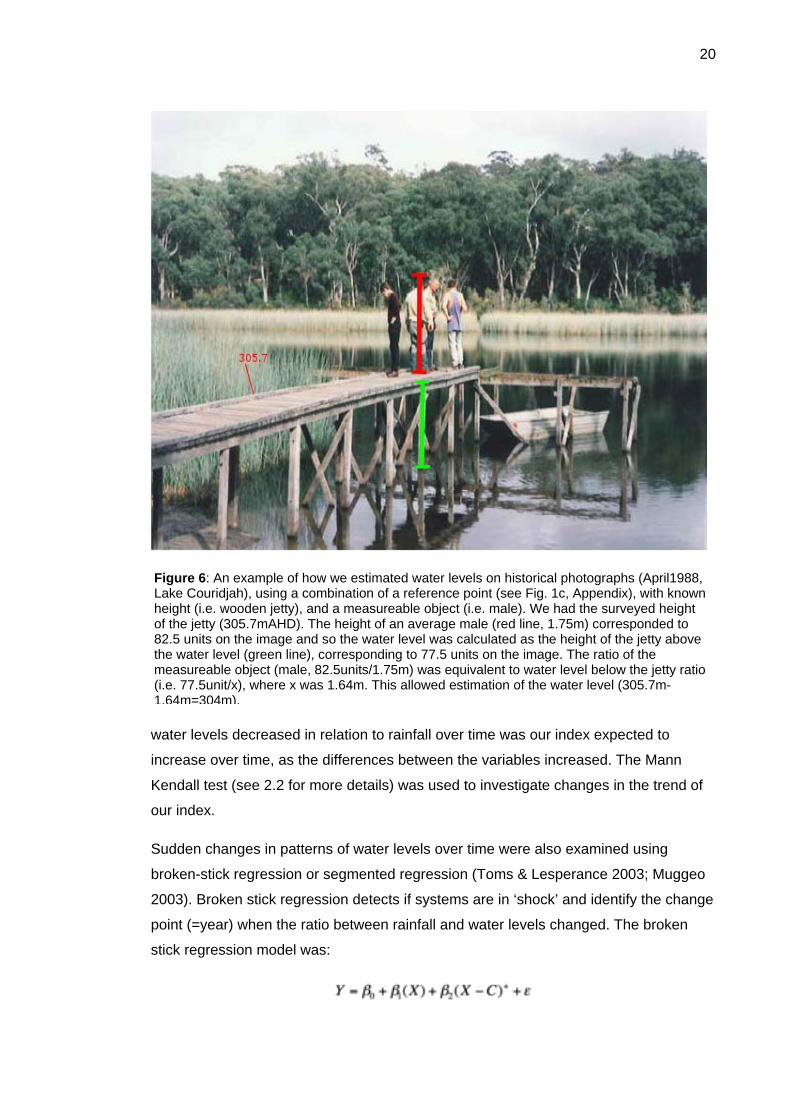
To determine water levels from the 30 ground photographs (Appendix), we used a
reference point (Fig. 1c) with another measureable object to scale each photograph
(Fig. 6). Reference points were points with a fixed location where elevation was
measured during our survey (Fig. 1). These were visible on the photographs with the
lake level and included two stonewalls, the jetty, the base of a bench and the base of a
tree; all their heights were surveyed during bathymetric surveys. In most photos, water
levels did not reach reference points, requiring identification of another measureable
object to scale the photograph and measure the distance between reference points
and water levels (Fig. 6).
Each photograph was imported to Photoshop (Adobe Systems Inc), where a vertical or
horizontal line could be measured in units. The person standing on the jetty was
estimated to be of average height (Australian Bureau of Statistics 2012), providing a
measure in Adobe Photoshop. The ratio of units to average height was then used to
calculate the distance between the jetty and the top of the water (Fig. 6). We also
compared four ground and aerial photographs taken at the same time. Where we used
estimates (e.g. height of person), we tested the sensitivity of the analysis by re-
evaluating the water levels but varying measures by 10% and calculating the
difference.
We derived an index for relative change between rainfall and water levels, using the
differences between standardized annual rainfall departure from the mean and water
levels (Larsen & Marx 2011). Three options were possible over time with this index: no
change, decrease and increase. If neither variable changed its relationship over time,
nor their relationship increased or decreased over time but this was synchronous
between the variables, then no trend would have been detectable in our index. Only if
20
Figure 6: An example of how we estimated water levels on historical photographs (April1988, Lake Couridjah), using a combination of a reference point (see Fig. 1c, Appendix), with known height (i.e. wooden jetty), and a measureable object (i.e. male). We had the surveyed height of the jetty (305.7mAHD). The height of an average male (red line, 1.75m) corresponded to 82.5 units on the image and so the water level was calculated as the height of the jetty above the water level (green line), corresponding to 77.5 units on the image. The ratio of the measureable object (male, 82.5units/1.75m) was equivalent to water level below the jetty ratio (i.e. 77.5unit/x), where x was 1.64m. This allowed estimation of the water level (305.7m-1.64m=304m).
water levels decreased in relation to rainfall over time was our index expected to
increase over time, as the differences between the variables increased. The Mann
Kendall test (see 2.2 for more details) was used to investigate changes in the trend of
our index.
Sudden changes in patterns of water levels over time were also examined using
broken-stick regression or segmented regression (Toms & Lesperance 2003; Muggeo
2003). Broken stick regression detects if systems are in ‘shock’ and identify the change
point (=year) when the ratio between rainfall and water levels changed. The broken
stick regression model was:

21
where Y was the response variable (difference), X the covariate (year), the
intercept, 1 the slope before the Change point C and the difference in slope after
C. We tested the null hypothesis H0: = 0: that the slopes of the two proportions
(before and after the change point) had not changed. R packages “Sizer” and
“segmented” were used (Muggeo 2010; Sonderegger 2011). Prior to all regression
analyses, normality was investigated using probability plots for all rainfall, evaporation
and inflow data (and data transformed where necessary) and tested for
heteroscedasticity using the Breusch-Pagan test (Breusch & Pagan 1979). Given the
potential errors in oral water level estimates, only water level estimates from
photographs or maps were used.
Water extraction Water was extracted from the Thirlmere Lakes during the late 18th and early 19th
century to supply steam trains passing Thirlmere (1885–1964) and for irrigation and
domestic use by the Picton Village Tuberculosis Settlement (1927–1952) (Riley et al.
2012; Pells 2011; Picton Lakes Village 1952). The steam engines filled their tanks at
Thirlmere Station, using water pumped from Lake Couridjah. To estimate water use,
we obtained historical data on locomotives, their tank size and timetables listing
frequency of public and goods trains (1891 and 1916) from the Australian Railway
Historical Society New South Wales Division (ARHSNSW), providing an estimate of the
number of locomotives per week. Between 1890s-1915, the J(483) and the B(55)
steam trains were used, subsequently changing to the D(50), with respective tank size
capacities of 13865l, 11250l and 16590l (W. Phippen, ARHSNSW member, pers.
comm.). We estimated annual (Jan-Dec) water use, based on number of goods
locomotives per week and their respective tank capacities.
Picton Village Tuberculosis Settlement also extracted water from Lake Couridjah
(1927-1952), detailed in annual reports (1934, 1936, 1938-1940, 1942-1944, 1953-
1954) (Picton Lakes Village 1952). It subsequently obtained water from elsewhere
(Picton Lakes Village 1952). We estimated the total volume of water used each year,
using annual expenditure on water, linked to volume.
Groundwater Given probable connections between groundwater and surface water at Thirlmere
Lakes, we also examined changes to groundwater extraction, linked to the number of
bores installed and changes to groundwater contour levels that may have been
affected by underground coal mining. We obtained data on the number of groundwater
bores sunk each decade, using their installation date, which provided the number of

22
bores within radii of 5km, 10km and 20km of Thirlmere Lakes (NSW Office of Water
2010). Data on water allocations or volumes extracted were not publicly available.
We evaluated groundwater levels in the shallow groundwater system near Thirlmere
Lakes and Tahmoor Colliery (Fig. 1c), by comparing contour maps of groundwater
levels before and after longwall mining began in 1982 (Fig. 1c).
To create the groundwater maps, we used groundwater levels from borehole data from
the NSW Office of Water (PINNEENA), within 30km of Thirlmere Lakes. These water
levels accessed either the deep or the shallow groundwater system (Fig. 2) and so we
compared bore depth with surface elevation and the height of the Bald Hill Claystone.
The height of the Bald Hill Claystone was previously modelled and we accessed the
data using Digital Imaging Geological Systems (DIGS) Report Viewer (NSW
Department of Trade & Investment 2014). We divided bores into two groups for the
shallow aquifer, those sunk before 1983 and afterwards, and imported coordinates and
water levels of each bore into Surfer 8 (Golden Software Inc 2002). We then created
two contour maps for the shallow aquifer in Surfer8, using kriging interpolation between
data points (Kao & Hung 2003; Nansen et al. 2003). Contour maps of the deep
groundwater system could not be created and compared due to the lack of data.
We also used the same data set to investigate groundwater changes by calculating
trends in average groundwater levels (5 year periods). To examine the spread of
sample points, the physical locations of the bores sunk within the 5-year segments
were plotted. We only used years with >10 sample points, to maximise accuracy of the
estimates with limited spatial bias, restricting analyses to the period, 1999 – 2011.
Other sites We used catchment runoff as a surrogate for water levels at the other three ‘control’
sites (Avon, Warragamba and Nepean Dams). We used modelled annual catchment
runoff which included inflow, storage diversions, rainfall, evaporation and data of other
known losses to each water body system, available from 1909 -2011 (SCA unpubl.
data; BOM National Water Account, 2011). Annual runoff was also compared to annual
precipitation at each site. Besides investigating if there were trends in rainfall, we also
analysed for trends in catchment runoff at Avon, Warragamba and Nepean Dams.

23
Results
Bathymetry We created contour and 3D surfaces from the topographic survey data for the three
lakes: Lake Couridjah, Lake Werri Berri and Lake Nerrigorang (Figs 7 & 8). The
bathymetry of all three lakes was confined by the surrounding sandstone ridge,
resulting in elongated lakes with steep edges following a horseshoe shaped bend
along the ridge. Lake Werri Berri, the longest of the three surveyed lakes, and Lake
Couridjah, the smallest of the three lakes occupied similar elevations, while Lake
Nerrigorang was slightly lower. Lake Nerrigorang had its three lowest points at 298.6m
when it was dry, compared to Lake Werri Berri and Lake Couridjah where the lowest
points, when they were dry, were at 299.5m and 299.4 (Table 1). All the lakes had
reasonably similar bathymetry otherwise (Fig. 7).
Table 1: Water levels when lakes were empty/full (from Riley et al 2012). Lake Werri Berri and Lake Couridjah first form a lagoon, then overflow into Lake Baraba (Full level).
Lake Full level Dry
AHD Depth (m) AHD
Lake Werri Berri 305.5 6 299.5
Lake Couridjah 305.5 6.1 299.4
Lake Nerrigorang 304.2 5.6 298.6
We then compared the lowest point of each lake with overflow points surveyed by Riley
et al (2012), resulting in the maximal depth. This meant Lake Nerrigorang was almost
six metres deep at its deepest point, compared to the other two lakes, which were
slightly over 6m deep (Table 1), and already connected to a lagoon. Lake Werri Berri
had the steepest bank of the three lakes and was also the longest of the lakes. These
patterns were also clear in the three dimensional surfaces (Fig. 8). Lake Werri Berri
and Couridjah form first a lagoon, and then overflow into Lake Baraba (Fig 1c). Lake
Nerrigorang overflows into Blue Gum Creek at about 304.2 AHD (Riley et al. 2012). To
fully understand flow directions at different water levels heights, also the remaining
lakes would have to be surveyed.

24
Figure 7: Contour maps, created from topographic surveys and labeled with 300m, 305 and 310mAHD contours (1m separation) for three Thirlmere Lakes (Lake Couridjah, Lake Werri Berri and Lake Nerrigorang), with their location (Easting and Northing) and bathymetry. Overflow of the lakes occurs above the red contour lines, when the lakes are at their maximum depth (Table 1).

25
Figure 8: Three dimensional surfaces of three Thirlmere Lakes (Lake Couridjah, Lake Werri Berri and Lake Nerrigorang), created from topographic surveys and labeled with elevations 297-311 mAHD, with their location (Easting and Northing) and bathymetry. The lakes overflow at their maximum depth, above the red contour lines.
26
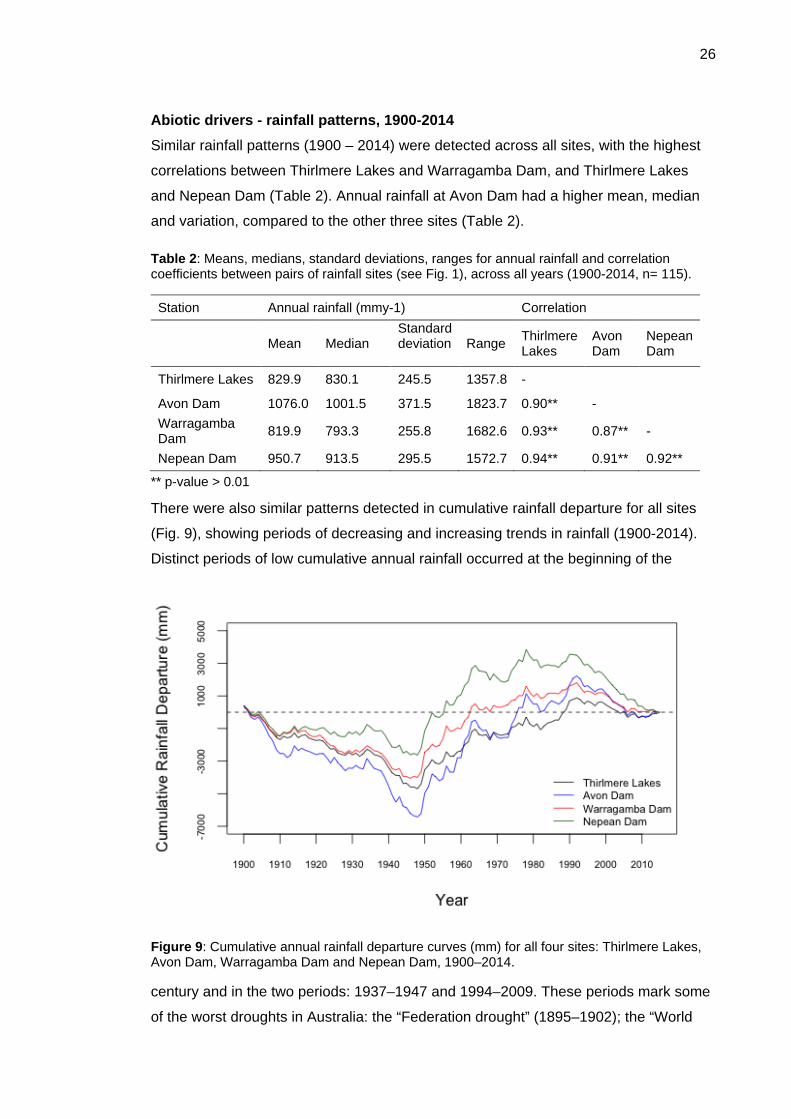
Abiotic drivers - rainfall patterns, 1900-2014 Similar rainfall patterns (1900 – 2014) were detected across all sites, with the highest
correlations between Thirlmere Lakes and Warragamba Dam, and Thirlmere Lakes
and Nepean Dam (Table 2). Annual rainfall at Avon Dam had a higher mean, median
and variation, compared to the other three sites (Table 2).
Table 2: Means, medians, standard deviations, ranges for annual rainfall and correlation coefficients between pairs of rainfall sites (see Fig. 1), across all years (1900-2014, n= 115).
** p-value > 0.01
There were also similar patterns detected in cumulative rainfall departure for all sites
(Fig. 9), showing periods of decreasing and increasing trends in rainfall (1900-2014).
Distinct periods of low cumulative annual rainfall occurred at the beginning of the
Figure 9: Cumulative annual rainfall departure curves (mm) for all four sites: Thirlmere Lakes, Avon Dam, Warragamba Dam and Nepean Dam, 1900–2014.
century and in the two periods: 1937–1947 and 1994–2009. These periods mark some
of the worst droughts in Australia: the “Federation drought” (1895–1902); the “World
Station Annual rainfall (mmy-1) Correlation
Mean Median Standard deviation
Range Thirlmere Lakes
Avon Dam
Nepean Dam
Thirlmere Lakes 829.9 830.1 245.5 1357.8 -
Avon Dam 1076.0 1001.5 371.5 1823.7 0.90** - Warragamba Dam 819.9 793.3 255.8 1682.6 0.93** 0.87** -
Nepean Dam 950.7 913.5 295.5 1572.7 0.94** 0.91** 0.92**

27
War II drought” (1937–1945) over eastern Australia and; the “Millennium drought”
(2001–2009) over south-eastern Australia. The period 1937-1947 had lower cumulative
annual rainfall than the other two periods identified (Fig. 9). The lowest years of rainfall
(lowest quartile) for Thirlmere Lakes included the following 28 years: 1902, 1905-1909,
1915, 1918, 1923, 1924, 1926, 1932, 1936, 1939 – 1941, 1944, 1946, 1953, 1957,
1965, 1968, 1979, 1982, 1994, 1997, 2006 and 2009 (Fig. 18d). The six lowest years
(and percentage of the mean) in increasing amount were 1944 (40.9%), 1979 (48.8%),
1940 (54.0%), 1982 (55.7%), 2006 (56.1%) and 1907 (56.2%). These coincide with
strong signals in cumulative departure for rainfall (Fig. 9). Contrastingly, there were 28
years in the upper quartile, when rainfall was high: 1900, 1911, 1914, 1929, 1933 and
1934, 1949 – 1952, 1955, 1959, 1961 – 1963, 1969, 1974, 1976, 1978, 1983, 1984,
1988 – 1990, 1995, 1998 and 2007 (Fig. 18). These periods corresponded to
increasing positive rainfall trends in cumulative departure from the mean (Fig. 9). No
significant trends in annual rainfall were detected at the three control sites but rainfall
increased at Thirlmere Lakes (Table 3).
Table 3: Mann Kendall’s tau statistic and two-sided p-values for testing long-term trends in annual rainfall at the four sites, 1900-2014.
aPositive value indicated an increase
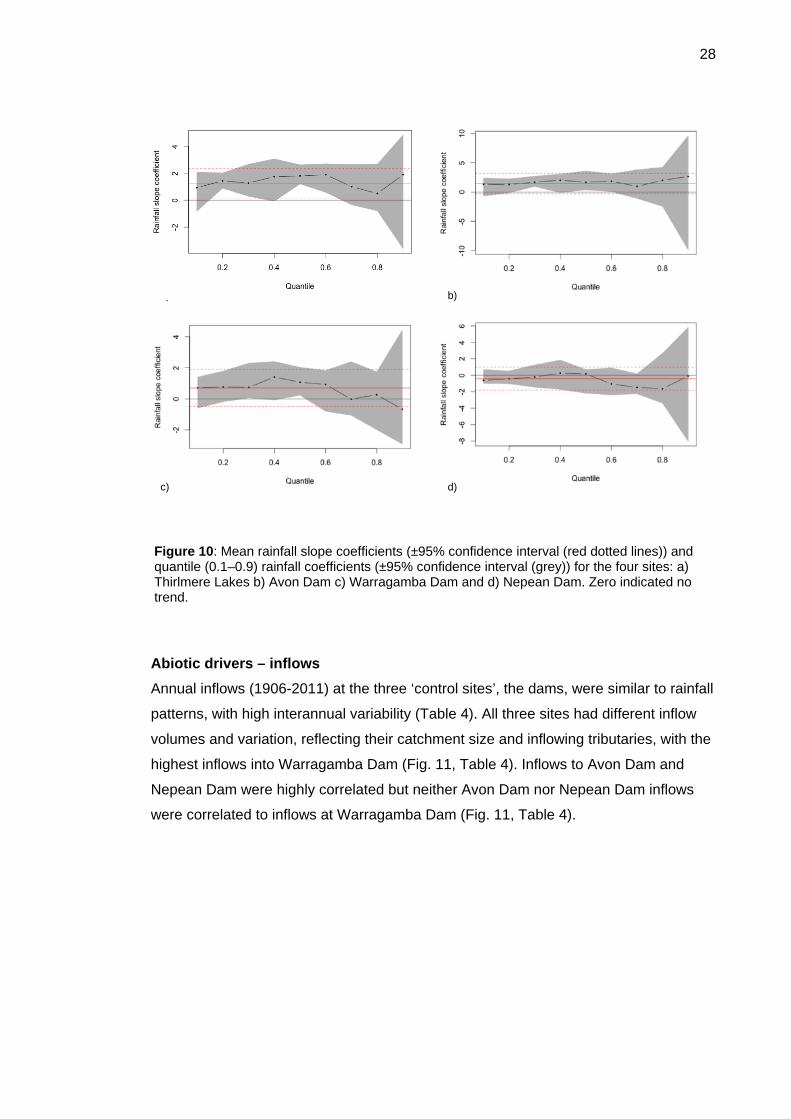
Further, there was no significant trend in any quantile of annual rainfall for any of the
four sites, with slope coefficients for each quantile within the confidence interval of the
least square regression model (red dotted lines) (Fig. 10).
Site Kendall’s tau statistica Two-sided p-value
Thirlmere Lakes 0.128 0.04
Avon Dam 0.106 0.09
Warragamba Dam 0.064 0.32
Nepean Dam -0.036 0.56
28
Abiotic drivers – inflows Annual inflows (1906-2011) at the three ‘control sites’, the dams, were similar to rainfall
patterns, with high interannual variability (Table 4). All three sites had different inflow
volumes and variation, reflecting their catchment size and inflowing tributaries, with the
highest inflows into Warragamba Dam (Fig. 11, Table 4). Inflows to Avon Dam and
Nepean Dam were highly correlated but neither Avon Dam nor Nepean Dam inflows
were correlated to inflows at Warragamba Dam (Fig. 11, Table 4).
Figure 10: Mean rainfall slope coefficients (±95% confidence interval (red dotted lines)) and quantile (0.1–0.9) rainfall coefficients (±95% confidence interval (grey)) for the four sites: a) Thirlmere Lakes b) Avon Dam c) Warragamba Dam and d) Nepean Dam. Zero indicated no trend.
a) b)
c) d)

29
Table 4: Means, medians, standard deviations, ranges for annual inflow and correlation coefficients between pairs of inflow sites (see Fig. 1), across all years (1906 – 2011, n=105).
There were no significant trends in annual inflows over time (Table 5). There were also
no detectable trends in inflows for different quantiles at Avon Dam, but inflows
increased significantly at Warragamba Dam and Nepean Dam in the 80th and 90th
quantiles (Fig. 12). Quantile regression lines, except the two highest ones at these two
dams were similar to the least square model (Fig. 12a,c): they were not significantly
different. This was also reflected in the slope coefficients (Fig. 12b,d).
a) b)
c)
Figure 11: Annual inflows to a) Avon Dam, b) Warragamba Dam and c) Nepean Dam, (1906–2011). Data were based on inflow models for each of the reservoirs (Sydney Catchment Authority, unpubl. Data).

30
Table 5: Mann Kendall’s tau statistic and two-sided p-values for testing long-term trends in annual inflow at three sites, 1906-2011.
Site Kendall’s tau statistica Two-sided p-value
Avon Dam -0.06 0.36
Warragamba Dam -0.07 0.32
Nepean Dam -0.12 0.06 aPositive value indicates an increase
Abiotic drivers – evaporation patterns, 1900-2013 Like rainfall patterns, the increasing and decreasing trends in cumulative annual
evaporation were similar among the four sites (Fig. 13), producing high correlations
between sites (Table 6). Mean and median lake evaporation were highest at
Warragamba Dam and lowest at Nepean Dam, which was also reflected in patterns of
variation (Table 6). There were no overall trends in annual evaporation, detected at any
of the sites (Table 7).
Figure 12: Inflows (log-transformed) over time (1906-2011), showing quantile regression lines (grey lines) and simple linear regression (red dashed line, least square estimate) for a) Warragamba Dam and b) Nepean Dam. Changes in coefficients of slope (±95% confidence limits) for inflows to c) Warragamba Dam and d) Nepean Dam for each quantile.
a) b)
c) d)

31
Table 6: Means, medians, standard deviations, ranges for annual lake evaporation and correlation coefficients between pairs of sites (Fig. 1), across all years (1900-2013, n= 114).
Table 7: Mann Kendall’s tau statistic and two-sided p-values for annual evaporation at all four sites
Site Kendall’s tau statistica Two-sided p-value
Thirlmere Lakes -0.08 0.23
Avon Dam -0.05 0.41
Warragamba Dam -0.12 0.06
Nepean Dam -0.06 0.32 aPositive value indicated an increase
Station Lake Evaporation (mm y-1) Correlation
Mean Median Standard
deviation Range
Thirlmere
Lakes
Avon
Dam
Nepean
Dam
Thirlmere
Lakes 1259.0 1253.0 37.0 207.0 -
Avon Dam 1227.5 1221.6 35.9 218.4 0.99** -
Warragamba
Dam 1323.0 1317.0 38.5 191.9 0.99** 0.97**
Nepean Dam 1227.3 1221.6 36.4 227.8 0.99** 0.99** 0.98**
Figure 13: Cumulative annual evaporation departure curves (1900–2013) for all four sites: Thirlmere Lakes, Avon Dam, Warragamba Dam and Nepean Dam.

32
Despite this, there were clear trends in the low and high quantiles for evaporation, at all
sites (Fig. 14). The upper quantiles (80th and 90th) showed an increasing trend while
the lower quantiles (10th, 20th, 30th and 40th) showed a decreasing trend (Fig.14).
Water extraction from Thirlmere Lakes Most of the water extraction from Lake Couridjah (Fig. 1c), primarily to refill steam
engines, occurred between 1884 and 1910, averaging 85.2±35.9 (SD) MLy-1, about
22.4% of the total lake volume (Fig. 15). Peak water extraction was approximately in
1884, when 124 MLy-1 or 35% of the total lake volume was estimated to be extracted
but this volume declined with improved networks and engines until no water was
extracted when steam trains were no longer in use in 1964 (Fig. 15). Small amounts of
water (mean 3.4±1.4 SD MLy-1) were also extracted for the Picton Village Tuberculosis
Village (1934-1948). In 1934, 1.7 MLy-1 was extracted for the village, reaching 4.95
MLy-1 in 1943. In the following 5 years, the water demand decreased again until water
from Thirlmere Lakes was no longer used in 1964 (Fig. 15).
Figure 14: Mean evaporation slope coefficient (±95% confidence interval (red dotted lines)) and 0.1 – 0.9 quantile evaporation coefficients (±95% confidence interval (grey)) for the four sites: a) Thirlmere Lakes b) Avon Dam c) Warragamba Dam and d) Nepean Dam.
a) b)
c) d)

33
Groundwater The number of bores sunk within 20km of Thirlmere Lakes has increased
exponentially, since the 1930s (Fig. 16). Only two bores existed in the decade 1930–
1940, within 20km and none within a 10 km or less of Thirlmere Lakes. By 1970–1980,
there were 40 bores within 20km. After the 1980’s the number of bores grew with 20,
96 and 235 bores respectively within 5, 10 and 20km by 2011. (Fig.16).
Figure 15: Annual volume (ML) and percentage of lake volume extracted from Lake Couridjah for steam trains (black) and the Picton Village Tuberculosis Village (red).
Figure 16: Number of groundwater bores (circles) sunk within 5km (green), 10km (red) and 20km (blue) of compared to exponential models (lines) at Thirlmere Lakes (data 1930–2011).
34
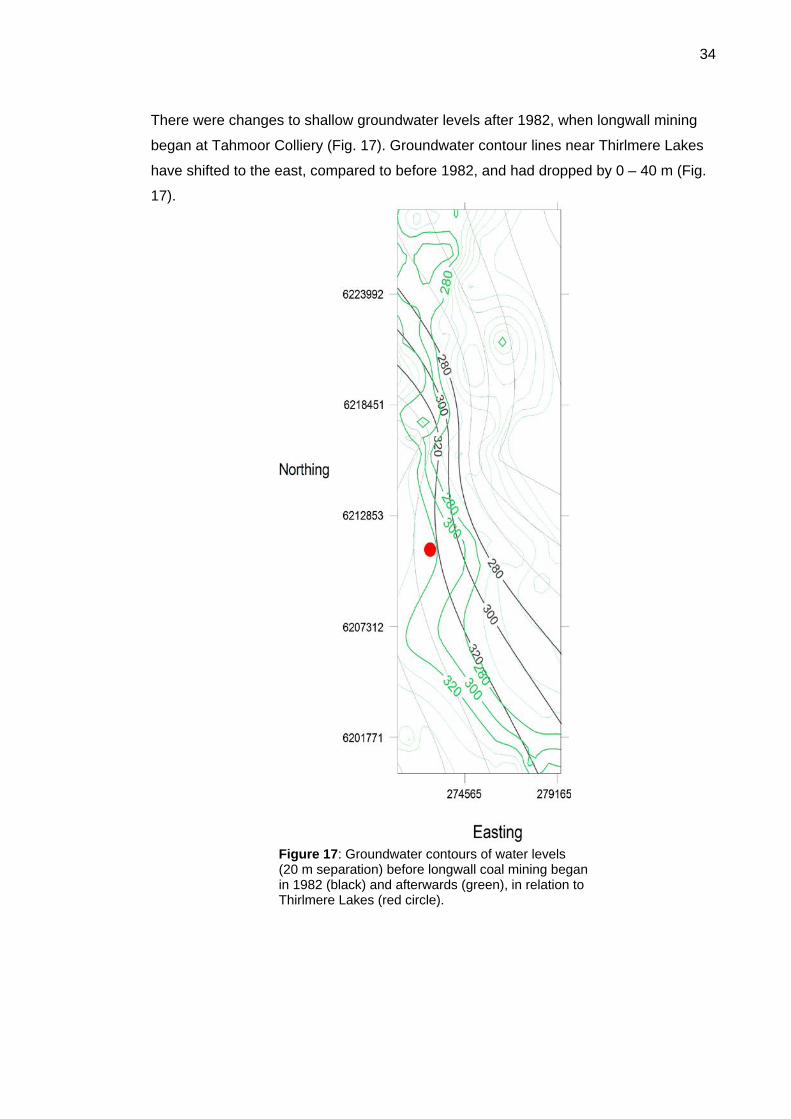
There were changes to shallow groundwater levels after 1982, when longwall mining
began at Tahmoor Colliery (Fig. 17). Groundwater contour lines near Thirlmere Lakes
have shifted to the east, compared to before 1982, and had dropped by 0 – 40 m (Fig.
17).
Figure 17: Groundwater contours of water levels (20 m separation) before longwall coal mining began in 1982 (black) and afterwards (green), in relation to Thirlmere Lakes (red circle).

35
Groundwater contour levels (1999 – 2013) averaged in five-year blocks within a 20km
Radius of Thirlmere Lakes, also showed about a 40m reduction in water levels (Fig
18).
Water levels at Thirlmere Lakes
Water levels at all Thirlmere Lakes: Lake Werri Berri, Lake Couridjah and Lake
Nerrigorang were highly variable over time (Fig. 19a,b,c), but showed similar patterns.
Until the late 1980s to the early 1990s, water levels at all lakes primarily reflected
rainfall patterns with peak water levels occurring in years of above average rainfall (Fig.
19). Previous periods of low rainfall, such as 1937–1947 (Fig. 9), resulted in low water
levels at the three Thirlmere Lakes. Since 1994, water levels have consistently fallen.
The reasonably close relationship between rainfall and water levels separated after
1990, with average or even above average rainfall not reflected in rising water levels
(Fig. 19). This decoupling of rainfall and water levels at Lake Nerrigorang may have
occurred even earlier, possibly early 1980s, compared with water levels at Lake Werri
Berri and Lake Couridjah (Fig. 19).
This was reflected in the increasing disassociation between rainfall and water levels (ie
index of change) over time, for all three lakes, particularly recently (1985–2015, Fig.
20). Given that the index was the difference between rainfall departure from the mean
and water level, a trend in the index reflected an altered relationship between the two
Figure 18: Mean (±SE) groundwater levels (averaged over 5 year periods 1999 – 2013) within 20km of the Thirlmere Lakes. Data were from levels encountered when bore holes were first established (NSW Office of Water data).

36
Figure 19: Water levels at a) Lake Werri Berri, b) Lake Couridjah and c) Lake Nerrigorang in relation to annual rainfall (dashed line).
a)
b)
c)

37
variables. If water levels and rainfall had tracked similarly over time, there would be no
trend in the index.
The increasing trend (Fig. 20) suggested that differences between rainfall and water
level z-scores constantly increased. The significant trend became increasingly positive
since the mid 1980’s. Either rainfall increased and water levels were stable; rainfall was
static and water levels decreased or rainfall increased and water levels decreased.
Because there were no long-term changes in rainfall (Table 3, Fig 10), this increasing
trend in the index was probably attributable to reductions in water levels (Table 8, Fig.
20).
Fig 20: Increasing index of change, being positive for all Lakes since approximately 1980.
Sensitivity analyses of the potential error on water level estimates from ground
photographs indicated a maximum of 0.06% change in estimates.

38
Table 8: Mann Kendall’s tau statistic and two-sided p-values for differences in z-scores at the Thirlmere Lakes
Site Kendall’s tau statistica Two-sided p-value
Lake Werri Berri 0.49 < 0.01
Lake Couridjah 0.41 < 0.01
Lake Nerrigorang 0.40 < 0.01 aPositive value indicates an increase
We identified clear change points in water levels at the three lakes: Lake Werri Berri in
2004 (Fig. 21a), Lake Couridjah in 2000 (Fig. 21b) and Lake Nerrigorang in 1998 (Fig.
21c, Table 9). Broken stick regression showed clear change points at the three lakes,
after which there were rapidly falling water levels (Fig. 21).
Figure 21: Broken stick regression lines (red) for water levels, showing change points when relationships between water levels change at a) Lake Werri Berri (1997), b) Lake Couridjah (1998) and c) Lake Nerrigorang (1984).
c)
a) b)

39
Table 9: Broken stick regression estimates for the three Thirlmere Lakes showing variance explained (R2), estimated year of breakpoint and associated Standard Error.
Site R2 Breakpoint estimate Standard Error
Lake Werri Berri 0.27 1997 6.37
Lake Couridjah 0.55 1998 3.19
Lake Nerrigorang 0.14 1984 22.4
Discussion There was good evidence for significant changes to long-term natural water level
patterns at Thirlmere Lakes (1880–2015), reflecting alteration of filling and drying
recently (Fig. 19). Water levels in Thirlmere Lakes have considerably declined recently,
probably since the 1980s, a trend not explained by natural variation in climate. We
reconstructed historical water levels in three of the lakes (Fig. 19), not previously
available, using constructed digital elevation models of the lakes. Our results suggest
an increasing trend of disassociation between rainfall and water levels since 1980,
when rainfall no longer seemed to affect water levels in the lakes (1980-2015, Figs 19
& 20). The magnitude of this change was unlikely to be explained by increasing
temperatures or increasing evaporation. Such altered filling patterns were probably due
to changed surface and groundwater flows, caused by anthropogenic impacts (longwall
coal mining and/or increased groundwater pumping), as we found no such breaks in
climate or inflow patterns at our three ‘control’ sites (Fig. 11).
Rainfall patterns (1900–2014) were strongly correlated at all four sites (Table 2), with
no significant trends at the three ‘control’ sites (Fig. 9 & 10), and an even some
indication of increasing rainfall at Thirlmere Lakes (Table 3), which would be expected
to increase the volume of water in the lake. Evaporation patterns (1900–2011) at all
four sites were also strongly correlated (Fig. 13, Table 6) with no trends in overall mean
(Table 7) but increasing trends in the high evaporation quantiles (Fig. 14), indicating
increased variability. Contrastingly, there was evidence that evaporation decreased in
the low quantiles (Fig. 14). Reflecting rainfall patterns, inflows (1906–2011) to the three
large dams (Avon, Warragamba and Nepean Dams) were strongly correlated with few
detectable trends (Table 5), except for increased high volume inflows (Fig. 12), similar
to the increased high rainfall at Thirlmere Lakes (Table 3). Absences of any strong
trends in rainfall, evaporation or inflows at any of the three ‘control’ sites and rainfall
and evaporation at Thirlmere Lakes indicated little evidence for a decline in
hydrological inputs (i.e. rainfall) were the cause of the drying out of Thirlmere Lakes
(Fig. 19).

40
There was an increasing disassociation between rainfall and water levels since 1980,
coinciding with reductions in water levels in the lakes (Table 8, Fig. 20). There were
also obvious change points, indicative of sudden drops in water levels, varying for each
lake: Lake Werri Berri in 1997, Lake Couridjah in 1998 and Lake Nerrigorang in 1984
(Table 9, Fig. 21). This suddenness implicates a pulse disturbance, rather than a press
disturbance (Lake 2000), indicative of a sudden decrease in water supply potentially
caused by increasing groundwater extraction or alteration of inflows from changes to
the aquifer caused by mining disruption. In the early part of the 20th Century, there was
no evidence for any decline in long-term water levels when significant amounts of
water (15–35% of total lake volume) were extracted from Lake Couridjah for steam
trains (until 1920, Fig. 9), during a period of low rainfall, despite relatively few data
points in this period (Fig. 19).
Thirlmere Lakes clearly dry naturally, with records of extremely low water levels and
drying at the beginning of the 20th century and in the early 1920s (Rose & Martin 2007;
Pells 2011; Riley et al. 2012). Such drying events coincided with severe dry periods,
with low rainfall (Fig. 19). Separating natural drying periods from increased drying from
anthropogenic impacts is critical. Given the relative simplicity of the hydrological
system (i.e. no large catchment), the relationship between rainfall and water levels was
expected to be close, reflected in the differences between standardised water levels
and rainfall before 1980 (Fig. 20). The most recent drying period reflected a separation
of this relationship. Despite the paucity of data, water levels were reasonably stable
during the period 1910–1930 (Fig. 19), a sequence similar in rainfall to the last 20 to 30
years. The dramatic recent decline in water levels clearly did not occur in the previous
period with similar rainfall. Water levels previously recovered quickly after dry spells.
After the World War II drought, with rainfall among the lowest six years on our record
(1940,1944), water levels in the lakes had recovered by 1949, at the beginning of a
period of high rainfall. This did not happen after the Millennium drought, despite the
ranking of 2007 among the years of rainfall within the highest quantiles.
Another study reached a similar conclusion, estimating that water levels were 1.5–2.5m
lower than expected from natural climate drivers (Pells 2011). Contrastingly, New
South Wales Government and Gilbert & Associates (2012) analyses concluded that
water levels at Thirlmere Lakes were low due to below average rainfall (Russell et al.
2010; Riley et al. 2012). None of these studies statistically analysed long-term rainfall
patterns. Two examined long-term changes (Russell et al. 2010; Gilbert & Associates
2012), while Riley et al (2012) only examined the last 23 years, and did a detailed

41
drought analysis. Only Pells (2011) and Gilbert & Associates (2012) reconstructed
water levels, but had a limited number of data points, compared to our study. Modelling
by Gilbert and Associates (2012) replicated current levels based on climate alone but
this did not adequately predict past droughts. The historical levels used did not
examine the effects of Federation and World War II droughts but are critical to predict
current levels. There were other inaccuracies regarding water levels at the three lakes;
Lake Nerrigorang was predicted from their modelling to dry in 1960, 1972, 1980-1988
and 1996-2007. Further, Lake Werri Berri was predicted to be dry in 1982, mostly dry
in 1984-1986, 1997-1999 and 2003-2007. These predictions were false, given
available photographic data and reliable anecdotal evidence, some of which was used
by Gilbert and Associates (2012).
Clearly, our detailed analyses of rainfall data for the site suggests that a conclusion
that lower water levels were due to low rainfall was unfounded. The Millennium
Drought (2002-2009), with low rainfall throughout eastern Australia, may have
contributed to this interpretation but it was not drier than the Federation Drought (1895
- 1902) or World War II Drought (1937 - 1945) at Thirlmere Lakes (Pells 2011; Riley et
al. 2012), illustrated by rainfall patterns (Fig. 9). Therefore, these drier periods should
have produced similarly low water levels at the Thirlmere Lakes than the Millennium
Drought. This occurred but water levels usually recovered rapidly, following significant
rainfall, unlike the most recent period (Fig. 19). Our long-term analyses of rainfall
clearly showed that, during similar significant dry periods, lake levels dropped but then
recovered. Recent high rainfall events filled Thirlmere Lakes in 2012, but water levels
then declined, a process with no historical precedent. Hydrological models were used
by others to simulate water level response to rainfall, but relied primarily on
assumptions and estimates from other areas, given the lack of available hydrological
data (Pells 2011), with contrasting conclusions (Pells 2011; Riley et al. 2012; Gilbert &
Associates 2012). We considerably extended and filled existing gaps in the water level
record and updated and analysed rainfall data until 2013, when the Millennium drought
had clearly broken, and yet drying of the lakes continued.
Given little evidence that drying of Thirlmere Lakes was related to the key natural
drivers, identification of the cause remains critical, given the conservation importance
of the system and its wetland values. Thirlmere Lakes fill from local rainfall and surface
flow but they also rely on groundwater processes (Riley et al. 2012). The declining
groundwater levels coincided with establishment of longwall mining and groundwater
extraction. These two anthropogenic drivers have probably changed groundwater flow

42
patterns; both highly complex and their effects difficult to distinguish without good
understanding of connectivity processes in the groundwater systems which currently
do not exist. The effects of groundwater extraction and mining on surface water can
both occur suddenly or with a significant time lapse, depending on several factors.
However, the effects from groundwater extraction are more likely to be characterised
by a press disturbance. It would be predicted that such an effect would be gradual over
time and would still follow rainfall patterns (Barlow & Leake 2012). Contrastingly,
mining impacts on groundwater may be more of a pulse disturbance, with a sudden
onset and intense change (Bender 1983). In natural systems, such pulses can be
recoverable. Water levels at the Thirlmere Lakes have likely been slowly declining
since the 1980’s from groundwater extraction, followed by the sudden break indicative
of a pulse impact, as opposed to a press disturbance. It is likely that longwall mining
development, rather than increasing groundwater access was also a significant factor
in the relatively sudden decline in water levels.
Mining of coal resources disrupts groundwater flow paths, moving water to lower
pressure areas, including extraction locations (Eade & Wood 2001; Booth 2006; DECC
2007). This problem is partly reflected in the need for coal mines to pump out
groundwater, seeping into mine workings (Tahmoor Underground - Glencore 2013). In
the Tahmoor Colliery, adjacent to Thirlmere Lakes (Fig. 1c), mine water discharge was
1200 -1600 MLy-1, 1995-2011 (Pells 2011). At Thirlmere Lakes, the Bald Hill Claystone
layer lies between the shallow and the deep aquifer, where mining occurs (Fig. 2),
probably preventing downward vertical movement of water into the deep aquifer
(Russell et al. 2010; Jankowski & Knights 2010), although this is contentious. However,
coal mining has probably increased the permeability of the Bald Hill Claystone (Holla &
Buizen 2001; Jankowski et al. 2008; Pells & Pells 2012), potentially increasing the
connectivity of the aquifers (Fig. 2) and increasing groundwater loss from Thirlmere
Lakes. The block of longwall panels closest to the lakes were established recently
(1997 – 2004), coinciding with the significant drop in water levels of the lakes (Figs 19
& 20). There is clearly a need to apply the Precautionary Principle before the nature of
this mechanism is further investigated.
Numbers of groundwater bores, mostly extracting water from the shallow groundwater
aquifer, have also increased, contributing to declines in groundwater levels by 40m in
the same period after longwall mining (Figs 17 & 18). These may have increased
drying of the lakes, although unlikely to be the major cause as their increase does not
43
explain sudden change points (Fig. 14). Further, groundwater impacts are generally
slow to materialise, with substantial time lags (Kelly et al. 2013).
Our estimates of historical water levels were critical to our conclusions. There were
minor inaccuracies (<0.28%) produced by the swelling peat surface, from heavy rainfall
during our surveys. Although greatest at Lake Couridjah, they minimally affected our
estimates of lake levels, given the large lake volume. Our estimates of water levels,
using historical ground photographs, were probably less accurate than estimates from
aerial photographs, given effects of different angles and distances. Despite this, the
discrepancies were low, given we found minimal differences between aerial and
ground photographs for three dates and showed that there was less than one percent
uncertainty in estimating the length of an object on the photographs (e.g. height of a
male adult) introduced a maximum error of 0.06%.
There are clearly significant environmental impacts caused by this drying. Thirlmere
Lakes is undoubtedly of high conservation value due to its old age and ecological
importance (NSW National Park and Wildlife Service 1997; Environment Australia
2001). The area is listed in the Directory of Important Wetlands in Australia
(Environment Australia 2001) for 5 out of 6 criteria, including playing an important
ecological and hydrological role in the natural functioning of the wetland complex and
providing important habitat for animal taxa at a vulnerable stage in their life cycle.
However, the predominantly perennial wetland ecosystem is moving towards a
temporary wetland or terrestrial ecosystem state. This will reduce resilience of key
obligate aquatic species and communities highly dependent on past flow regimes and
open water area (DECC 2007). The rare sponge Radiospongilla sceptroides may have
already disappeared from the Thirlmere Lakes National Park (B.Owers, pers. comm.).
Similarly, the floating islands, an unusual feature of Thirlmere Lakes connected to
fluctuating water levels, relies on quickly recovering water levels (Vorst 1974; Riley et
al. 2012). Also, Thirlmere Lakes provides habitat to many listed threatened wetland
species: five species of waterbirds, a fish, two frog species and two plant species.
The New South Wales Government has pledged to protect the values of Thirlmere
Lakes by gazetting the area as a National Park and committing in the Plan of
Management to protect “the lakes in a stable and unpolluted condition” given the
“important physical and ecological features of the ancient […] system” and preserve
the park because water flows into Sydney’s water supply (National Parks and Wildlife
Service NSW 1997). The ecological character of Thirlmere Lakes is changing, affecting
this commitment to the values in the Plan of Management. Furthermore, Thirlmere

44
Lakes National Park is part of the Greater Blue Mountains World Heritage Area (World
Heritage Committee 2000), adding another commitment to protect, manage and
monitor the Thirlmere Lakes National Park which is a site of special natural
significance. Finally, the values of the lakes as a recreational and tourist destination
are also affected by declining water levels.
Conclusion Water levels at the Thirlmere Lakes have receded since the 1980s, despite few strong
trends in climatic drivers or filling patterns at the lakes or three ‘control’ sites. These
changes were reasonably sudden. The system is highly dependent on surface flow,
which then flows into the groundwater system, lowering lake levels, which are
replenished by high rainfall. We identified two potential anthropogenic causes:
increased groundwater extraction and impacts of longwall mining leading to greater
losses of groundwater and surface water from the lakes. There are significant
implications for the long-term management and obligations of governments to an area
that is gazetted as a National Park and part of the Blue Mountains World Heritage
Area. It is also an important recreational area. The damage to the ecosystem are not
easily reversed but will be exacerbated by increasing deleterious developments.
Acknowledgements We would like to thank Associate Professor David Edwards for his help with the survey
and converting the data into topographic maps. Peter Briggs from the Australian Water
Availability Project and the Sydney Catchment Authority for access to crucial data on
rainfall, evaporation and inflows and the National Library of Australia, the State Library
of New South Wales and the State Records Authority of New South Wales for the
support when locating historical documents on Thirlmere Lakes. A special thanks to all
the volunteers who helped with the survey of the Thirlmere Lakes and have spent
many hours in the rain, mud and thick undergrowth.

45
References Altun, A.O., Yilmaz, I. & Yildirim, M., 2010. A short review on the surficial impacts of
underground mining. Scientific Research and Essays, 5(21), pp.3206–3212.
Arthington, A.H. & Pusey, B.J., 2003. Flow restoration and protection in Australian rivers. River
Research and Applications, 19(5-6), pp.377–395. Available at:
http://doi.wiley.com/10.1002/rra.745 [Accessed July 17, 2011].
Atkinson, A., 2000. Recreation and Conservation - can the two coexist in Thirlmere Lakes
National Park. National Parks Journal, 44(1).
Australian Bureau of Statistics, 2012. No 4364.0.55.001 - Australian Health Survey: First
Results, 2011-12, Canberra.
Australian Government Bureau of Meteorolgy, 2013. Climate Data Online.
Bernadez, F.G., Rey Benayas, J.M. & Martinez, A., 1993. Ecological impact of groundwater
extraction on wetlands ( Douro Basin , Spain ). Journal of Hydrology, 141, pp.219–238.
Bishop, P., Hunt, P. & Schmidt, P.W., 1982. Limits to the age of the Lapstone monocline , N . S
. W .— a palaeomagnetic study. Journal of the Geological Society of Australia, 29,
pp.319–326.
Black, M.P., Mooney, S.D. & Martin, H.A., 2006. A >43,000-year vegetation and fire history from
Lake Baraba, New South Wales, Australia. Quaternary Science Reviews, (25), pp.3003–
3016.
Bogardi, J.J. et al., 2012. Water security for a planet under pressure: interconnected challenges
of a changing world call for sustainable solutions. Current Opinion in Environmental
Sustainability, 4(1), pp.35–43. Available at:
http://linkinghub.elsevier.com/retrieve/pii/S1877343511001369 [Accessed October 31,
2012].
Booth, C.J., 2007. Confined-Unconfined Changes above Longwall Coal Mining Due to
Increases in Fracture Porosity. Environmental and Engineering Geoscience, 13(4),
pp.355–367. Available at:
http://eeg.geoscienceworld.org/cgi/doi/10.2113/gseegeosci.13.4.355.
Booth, C.J., 2006. Groundwater as an environmental constraint of longwall coal mining.
Environmental Geology, 49(6), pp.796–803. Available at:
http://www.springerlink.com/index/10.1007/s00254-006-0173-9 [Accessed September 27,
2011].
Booth, C.J., 1986. Strata-Movement Concepts and the Hydrogeological Impact of Underground
Coal Mining. Ground Water, 24(4), pp.507–515.
Branagan, D., Herbert, C. & Langford-Smith, T., 1979. An Outline of the Geology and
Geomorphology of the Sydney Basin D. Branagan, ed., Sydney: Science Press.
Breusch, T.S., 1978. Testing for Autocorrelationa in Dynamic Linear Models. Australian
Economic Papers, 17(31), pp.334 – 355.

46
Breusch, T.S. & Pagan, A.R., 1979. A simple test for heteroscedasticity and ramdom coefficient
variation. Econometrica, 47(5), pp.1287 – 1294.
Bunn, S.E. & Arthington, A.H., 2002. Basic Principles and Ecological Consequences of Altered
Flow Regimes for Aquatic Biodiversity. Environmental Management, 30(4), pp.492–507.
Available at:
http://www.springerlink.com/openurl.asp?genre=article&id=doi:10.1007/s00267-002-2737-
0 [Accessed June 10, 2011].
Cade, B.S. & Noon, B.R., 2003. A gentle introduction to quantile regression for ecologists.
Frontiers in Ecology and the Environment, 1(8), pp.412–420.
Davidson, S. & de Silva, A., 2013. The Australian Coal Industry - Adding value to the Australian
Economy,
Dawkins, A.P., 1999. Assessment, managment and rehabilitation of surface water losses due to
longwall coal mining subsidence. In Proceedings of the Mineral Council of Australia.
Townsville, Queensland: Mineral Council of Australia.
DECC, 2007. Ecological Impacts of Longwall Mining in the Southern Coalfields of NSW – A
Review ., Sydney.
Department of Sustainability Environment Water Population and Communities, 2012. EPBC Act
Protected Matters Report.
Eade, P. & Wood, J., 2001. Longwalling and Its Impact in the Southern Coalfield - Recent BHP
Experiences. In N. Aziz, ed. Coal Operators’ Geotechnology Colloquim. Wollongong:
University of Wollongong & the Australasian Institute of Mining and Metallurgy, pp. 85–92.
Elmore, A.J. et al., 2006. Decline in alkali meadow vegetation cover in California: the effects of
groundwater extraction and drought. Journal of Applied Ecology, 43(4), pp.770–779.
Available at: http://doi.wiley.com/10.1111/j.1365-2664.2006.01197.x [Accessed August 26,
2014].
Environment Australia, 2001. A Directory of Important Wetlands in Australia, Canberra.
Environmental Systems Research Institute Inc, 2010. ArcMap 10.
Ghilani, C.D. & Wolf, P.R., 2012. Elementary Surveying: An Introduction to Geomatics 13th ed.,
New Jersey: Pearson Education Inc.
Gilbert & Associates, 2012. Thirlmere Lakes Surface Water Balance Assessment. , (07).
Golden Software Inc, 2002. Surfer 8.
Hector, D., 2011. Sydney’s Water Sewerage and Drainage System. Journal & Proceedngs of
the Royal Society of New South Wales, 144, pp.3–25.
Herbert, C. & Helby, R., 1980. A Guide to the Sydney Basin D.West, ed., Sydney: Government
Printer.
Holla, L., 1997. Ground Movement Due to Longwall Mining in High Relief Areas in New South
Wales , Australia. International Journal of Rock Mechanics and Mining Science, 34(5),
pp.775–787.

47
Holla, L. & Buizen, M., 2001. The Ground Movement , Strata Fracturing and Changes in
Permeability Due to Deep Longwall Mining. International Journal of Rock Mechanics and
Mining Science & Geomechanics Abstracts, 28(2/3), pp.207–217.
Hothorn, T. et al., 2014. Testing Linear Regression Models.
Hughes, M., Mcdowell, P. & Marcus, W., 2006. Accuracy assessment of georectified aerial
photographs: Implications for measuring lateral channel movement in a GIS.
Geomorphology, 74(1-4), pp.1–16. Available at:
http://linkinghub.elsevier.com/retrieve/pii/S0169555X05001972 [Accessed July 21, 2011].
Itasca, D.P.S., 2002. Analysis of River Bed Cracking Above Longwall Extraction Panels in the
Southern Coalfield of NSW , Australia. , (2000).
Jankowski, J. & Knights, P., 2010. Surface Water – Groundwater Interaction in the Fractured
Sandstone Aquifer Impacted by Mining-Induced Subsidence : 1 . Hydrology and
Hydrogeology. In IAH 2010 Krakow. pp. 33–42.
Jankowski, J., Madden, A. & Mclean, W., 2008. Surface Water-Groundwater Connectivity in a
Longwall Mining Impacted Catchment in the Southern Coalfield , NSW , Australia. ,
pp.2128–2139.
Junk, W.J., 2012. Current state of knowledge regarding South America wetlands and their
future under global climate change. Aquatic Sciences, 75(1), pp.113–131. Available at:
http://link.springer.com/10.1007/s00027-012-0253-8 [Accessed November 14, 2013].
Kao, C.Y.S. & Hung, F.L.P., 2003. Twelve different Interpolations Methods: a case study of
Surfer 8.0. Journal of Economic Entomology, 96(6), pp.1617–1625.
Kay, D. et al., 2006. Impacts of Longwall Mining to Rivers and Cliffs in the Southern Coalfield. In
N. Aziz, ed. Coal 2006: Coal Operator’s Converence. Wollongong: University of
Wollongong & the Australasian Institute of Mining and Metallurgy, pp. 327–336.
Kelly, B.F.J. et al., 2013. Aquifer heterogeneity and response time: the challenge for
groundwater management. Crop and Pasture Science, 64, pp.1141–1154. Available at:
http://www.publish.csiro.au/?paper=CP13084.
Kingsford, R., 2011. Conservation management of rivers and wetlands under climate change ] a
synthesis. Marine And Freshwater Research, pp.217–222.
Kingsford, R., 2000. Ecological impacts of dams, water diversions and river management on
floodplain wetlands in Australia. Austral Ecology, 25(2), pp.109–127. Available at:
http://doi.wiley.com/10.1046/j.1442-9993.2000.01036.x.
Kingsford, R.T., Lemly, A.D. & Thompson, J.R., 2006. Impacts of dams, river management and
diversions on desert rivers. In R. T. Kingsford, ed. Ecology of desert rivers. Cambridge:
Cambriged University Press, pp. 203–247.
Kingsford, R.T. & Thomas, R.F., 2004. Destruction of wetlands and waterbird populations by
dams and irrigation on the Murrumbidgee River in arid Australia . Environmental
Management, 34(3), pp.383–396 . Available at:
http://apps.webofknowledge.com/full_record.do?product=WOS&search_mode=GeneralSe
arch&qid=26&SID=T2j4@p2GfO8HeA55i3a&page=1&doc=1.

48
Koenker, R. et al., 2013. Quantile Regression.
Koenker, R. & Bassett, G., 1978. Regression Quantiles. Econometrica, 46(1), pp.33–50.
Krogh, M., 2007. Management of longwall coal mining impacts in Sydney’s southern drinking
water catchements.pdf. Australasian Journal of Environmental Management, 14.
Lahm, T.D. & Bair, E.S., 2000. Regional depressurization and its impact on the sustainability of
freshwater resources in an extensive midcontinent variable-density aquifer. Water
Resources Research, 36(11), pp.3167–3177.
Larsen, R.J. & Marx, M.L., 2011. Introduction to Mathematical Statistics and Its Applications 5th
ed., Pearson Education Inc.
Marandi, A. et al., 2013. Simulation of the hydrogeologic effects of oil-shale mining on the
neighbouring wetland water balance: case study in north-eastern Estonia. Hydrogeology
Journal, 21(7), pp.1581–1591. Available at: http://link.springer.com/10.1007/s10040-013-
1032-x [Accessed December 5, 2013].
Markich, S.J. & Brown, P.L., 1998. Relative importance of natural and anthropogenic influences
on the fresh surface water chemistry of the Hawkesbury-Nepean River, south-eastern
Australia. , 217, pp.201–230.
Mazvimavi, D., 2010. Investigating changes over time of annual rainfall in Zimbabwe. Hydrology
and Earth System Sciences, 14(12), pp.2671–2679. Available at: http://www.hydrol-earth-
syst-sci.net/14/2671/2010/ [Accessed June 6, 2014].
McLeod, A.I., 2011. Kendall rank correlation and Mann-Kendall trend test.
McNally, G. & Evans, R., 2007. Impacts of longwall mining on surface water and groundwater ,
Southern Coalfield NSW.
Millennium Ecosystem Report, 2005. Ecosystems and Human Well-being: Current State and
Trends.
Mitsch, W.J. & Gosselink, J.G., 2000. Wetland Hydrology. In Wetlands. New York: John Wiley &
Sons, Inc., pp. 107–153.
Muggeo, V.M.R., 2003. Estimating regression models with unknown break-points. Statistics in
Medicine, 22(19), pp.3055–3071.
Muggeo, V.M.R., 2010. Segmented relationships in regression models with
breakpoints/changepoints estimation.
Nansen, C. et al., 2003. The impact of spatial structure on the accuracy of contour maps of
small data sets. Journal of economic entomology, 96(6), pp.1617–25. Available at:
http://www.ncbi.nlm.nih.gov/pubmed/14977096.
National Parks and Wildlife Service NSW, 2003. The native vegetation of the Warragamba
Special Area, Sydney.
National Parks and Wildlife Service NSW, 1997. Thirlmere Lakes National Park New Plan of
Management, Sydney.
Nearmap Pty Ltd., 2012. Photo Map.

49
Nilsson, C. et al., 2005. Fragmentation and flow regulation of the world’s large river systems.
Science (New York, N.Y.), 308(5720), pp.405–8. Available at:
http://www.ncbi.nlm.nih.gov/pubmed/15831757 [Accessed June 10, 2011].
NSW Department of Environment and Heritage, 2013. Thirlmere Lakes Inquiry.
NSW Department of Trade & Investment, 2014. DIGS Geological Survey of NSW. DIGS
Database.
NSW Government Land & Property Information, 2012. Mapping and Imagery.
NSW National Park and Wildlife Service, 1997. Thirlmere Lakes National Park New Plan of
Management, Sydney.
NSW Office of Water, 2010. Pinneena 3.2 Groundwater works.
Oberatu, R., 2011. Water Supply and land use in Sydney. Royal Australian Planning Institute
Journal, 9(4), pp.137–141.
Palaniappan, M. & Gleick, P.H., 2011. Peak Water. In The World’s Water Volume 7. pp. 1–16.
Pells, P., 2011. Report on the Water Levels of Thirlmere Lakes,
Pells, S. & Pells, P., 2012. Impacts of Longwall Mining and Coal Seam Gas Extraction on
Groundwater Regimes in the Sydney Basin Part 2 - Practical Applications. Australian
Geomechanics Journal, 47(3), p.51.
Picton Lakes Village, 1952. Annual report and balance sheet / Picton Lakes Village, TB
settlement, Couridjah, NSW, Couridjah, NSW.
Pinto, U. et al., 2012. Understanding the meaning of river health for a community: perspectives
from the peri-urban region of the Hawkesbury–Nepean catchment, Australia. Water Policy,
14(5), p.766. Available at: http://www.iwaponline.com/wp/01405/wp014050766.htm
[Accessed August 24, 2012].
Raupach, M.R. et al., 2008. Australian Water Availability Project ( AWAP ): CSIRO Marine and
Atmospheric Research Component : Final Report for Phase 3, Canberra.
Riley, S. et al., 2012. Thirlmere Lakes Inquiry Final Report of the Independent Committee,
Rose, S. & Martin, H.A., 2007. The Vegetation History of the Holocene at Dry Lake , Thirlmere ,
New South Wales. Proceedings of the Linnean Society of New South Wales, (128), pp.15–
55.
Russell, G. et al., 2010. Thirlmere Lakes groundwater assessment, Sydney.
Russell, G.N., 2012. Thirlmere Lakes drilling report, Sydney.
Sokkia Topcon Co. Ltd., 2009. SOKKIA Series50RX Operator’s Manual.
Sonderegger, D., 2011. SiZer: Significant Zero Crossings.
Tahmoor Underground - Glencore, 2013. Annual Environmental Management Report,
Timms, V., 1992. Fluvial Lakes. In Lake Geomorphology. Adelaide: Gleneagles Publishing.
Toms, J.D. & Lesperance, M.L., 2003. Piecewise regression: a tool for identifying ecological
thresholds. Ecology, 84(8), pp.2034–2041.
Total Environment Centre, 2007. Impacts of Longwall Coal Mining on the Environment in New
South Wales, Sydney.

50
Vörösmarty, C.J. et al., 2010. Global threats to human water security and river biodiversity.
Nature, 467(7315), pp.555–61. Available at:
http://www.ncbi.nlm.nih.gov/pubmed/20882010 [Accessed July 15, 2011].
Vorst, P., 1974. Thirlmere Lakes, N.S.W. : Geomorphic environment and evolution. Macquarie
University.
Watts, R.J., 2011. Dam reoperation in an era of climate change. Control, pp.321–327.
Whitfield, L., 1988. The Effect of Coal Mining o m the Hydrogeological Regime of the Southern
Coalfield, New South Wales. In Fifth Australia-New Zealand Conference on
Geomechanics. Sydney.
World Heritage Committee, 2000. Natural Heritage - Properties inscribed on the World Heritage
List. In Convention Concerning the Protection of the World Cultural and Natural Heritage.
Cairns, Australia.

51
Appendix Ground and aerial imagery used to determine water levels at different Thirlmere Lakes, giving the type of imagery, its date of acquisition, source, relevant lake
and reference point (see Fig. 1c) used to determine water levels.
Imagery type Date Source Thirlmere Lake Reference point Water level (mAHD) Accuracy Ground photography 1974 Patricia Fanning Lake Couridjah Jetty 301.74 ± 0.06% 1984 David Hunt Lake Couridjah Stone Wall 301.1 ± 0.06% 1989 David Hunt Lake Couridjah Jetty 301.6 ± 0.06% 1989 David Hunt Lake Couridjah Jetty 301.7 ± 0.06% 1989 David Hunt Lake Couridjah Jetty 301.3 ± 0.06% 1990 Mall Juske Lake Couridjah Jetty 301.5 ± 0.06% 1997 NPWS Lake Couridjah Jetty 301.0 ± 0.06% 1998 NPWS Lake Couridjah Jetty 300.5 ± 0.06% 1996 Dr Scott Mooney Lake Couridjah Stone Wall 300.95 ± 0.06% 2012 Philip Pells Lake Couridjah Survey 296.47 ± 0.06% 2012 Philip Pells Lake Couridjah Survey 296.3 ± 0.06% 1991 Anon./Thirlmere Lakes Inquiry Lake Couridjah Stone Wall 301.5 ± 0.06% 2002 Jeff Patchett Lake Couridjah Stone Wall 301.7 ± 0.06% 1998 Jeff Patchett Lake Couridjah Jetty 301.86 ± 0.06% 1965 State Library Lake Couridjah Jetty 300.2 ± 0.06% 1986 Anon./Thirlmere Lakes Inquiry Lake Couridjah Jetty 301.6 ± 0.06% 1989 Anon./Thirlmere Lakes Inquiry Lake Couridjah Jetty 301.6 ± 0.06% 1884 Anon./Picton &District Historical Society Lake Couridjah Survey 298.5 ± 0.06% 1953 Oakes Historical Society Lake Nerrigorang Jetty 299.62 ± 0.06% 1954 Annette Bray Lake Nerrigorang Bench 302.42 ± 0.06%

52
Imagery type Date Source Thirlmere Lake Reference point Water level (mAHD) Accuracy 1955 P. Rackleyft Lake Nerrigorang Bench 302.32 ± 0.06% 1984 Anon./State Library Lake Nerrigorang Bench 302.32 ± 0.06% 1993 Angela Jansz Lake Werri Berri Stone Wall 304.6 ± 0.06% 1998 NPWS Lake Werri Berri Stone Wall 304.1 ± 0.06% 2011 Philip Pells Report Lake Werri Berri Survey 298.94 ± 0.06% 2010 Julie Shepard Lake Werri Berri Survey 300.1 ± 0.06% 1965 Anon./State Library Lake Werri Berri Tree 305.6 ± 0.06% 2011 Rosie Nicolai Lake Werri Berri Survey 298.94 ± 0.06% 2011 Tess Carrad Lake Werri Berri Survey 298.9 ± 0.06% 2011 Max Phillips Lake Werri Berri Survey 298.94 ± 0.06%
WB, C, N
Aerial photography 1937 State Records NSW All 300.75,301.45,299.51 ±0.1m 1949 National Library of Australia All 300.65,300.95,298.46 ±0.1m 1955 NSW Land & Property Information All 304.45,302.85,301.61 ±0.1m 1966 Pells Progress Report 2 All 303.35,302.15,300.91 ±0.1m 1969 NSW Land & Property Information All 302.55,302.45,299.71 ±0.1m 1975 Pells Progress Report 2 All 302.8,301.95,299.61 ±0.1m 1976 State Records NSW All 302.55,302.05,299.61 ±0.1m 1983 NSW Land & Property Information All 302.4,301.15,299.61 ±0.1m 1983 Pells Progress Report 2 All 302.34,302.25,299.71 ±0.1m 1988 NSW Land & Property Information All 302.6,301.65,299.61 ±0.1m 1994 Pells Progress Report 2 All 302.5,302.15,299.66 ±0.1m 1998 NSW Land & Property Information All 303.4,302.05,300.26 ±0.1m 2002 NSW Land & Property Information All 302.55,301.55,298.92 ±0.1m

53
Imagery type Date Source Thirlmere Lake Reference point Water level (mAHD) Accuracy 2005 Pells Progress Report 2 All 302.35,301.85,298.96 ±0.1m 2010 Pells Progress Report 2 All 300.15,300.85,298.11 ±0.1m Maps 1894 NSW Land & Property Information All 304.45,302.85,302.41 1898 NSW Land & Property Information All 304.45, 302.85,302.41 1931 State Library of NSW All 304.45, 302.85,302.41