Long-Term Changes in the Occupational Structure · Long-Term Changes in the Occupational Structure...
29
Long-Term Changes in the Occupational Structure Author(s): Giorgio Gagliani Source: European Sociological Review, Vol. 1, No. 3 (Dec., 1985), pp. 183-210 Published by: Oxford University Press Stable URL: http://www.jstor.org/stable/522783 Accessed: 07/10/2010 06:33 Your use of the JSTOR archive indicates your acceptance of JSTOR's Terms and Conditions of Use, available at http://www.jstor.org/page/info/about/policies/terms.jsp. JSTOR's Terms and Conditions of Use provides, in part, that unless you have obtained prior permission, you may not download an entire issue of a journal or multiple copies of articles, and you may use content in the JSTOR archive only for your personal, non-commercial use. Please contact the publisher regarding any further use of this work. Publisher contact information may be obtained at http://www.jstor.org/action/showPublisher?publisherCode=oup. Each copy of any part of a JSTOR transmission must contain the same copyright notice that appears on the screen or printed page of such transmission. JSTOR is a not-for-profit service that helps scholars, researchers, and students discover, use, and build upon a wide range of content in a trusted digital archive. We use information technology and tools to increase productivity and facilitate new forms of scholarship. For more information about JSTOR, please contact [email protected]. Oxford University Press is collaborating with JSTOR to digitize, preserve and extend access to European Sociological Review. http://www.jstor.org
Transcript of Long-Term Changes in the Occupational Structure · Long-Term Changes in the Occupational Structure...

Long-Term Changes in the Occupational StructureAuthor(s): Giorgio GaglianiSource: European Sociological Review, Vol. 1, No. 3 (Dec., 1985), pp. 183-210Published by: Oxford University PressStable URL: http://www.jstor.org/stable/522783Accessed: 07/10/2010 06:33
Your use of the JSTOR archive indicates your acceptance of JSTOR's Terms and Conditions of Use, available athttp://www.jstor.org/page/info/about/policies/terms.jsp. JSTOR's Terms and Conditions of Use provides, in part, that unlessyou have obtained prior permission, you may not download an entire issue of a journal or multiple copies of articles, and youmay use content in the JSTOR archive only for your personal, non-commercial use.
Please contact the publisher regarding any further use of this work. Publisher contact information may be obtained athttp://www.jstor.org/action/showPublisher?publisherCode=oup.
Each copy of any part of a JSTOR transmission must contain the same copyright notice that appears on the screen or printedpage of such transmission.
JSTOR is a not-for-profit service that helps scholars, researchers, and students discover, use, and build upon a wide range ofcontent in a trusted digital archive. We use information technology and tools to increase productivity and facilitate new formsof scholarship. For more information about JSTOR, please contact [email protected].
Oxford University Press is collaborating with JSTOR to digitize, preserve and extend access to EuropeanSociological Review.
http://www.jstor.org

European Sociological Review, Vol. 1 No. 3, December 1985 ? Oxford University Press 1985
Long-term changes in the occupational structure
GIORGIO GAGLIANI
INTRODUCTION: METHODS AND DEFINITIONS
This article is devoted to an empirical analysis of long-term changes in the distribution of the labour force (or employment) by occupation. The literature on the subject is not very extensive. A careful collection of long-term data on the employment structure of several countries, some of which concern occupations, is contained in Bairoch (1968). A statistical study based on cross-sectional and time-series data for 51 countries, containing a patterns-of-growth analysis of the occupational structure, appeared in Oberai (1981). Useful country studies are those by Thevenot (1977) on France, Routh (1980) on Britain and Singelmann and Browning (1980) on the United States. Other recent studies such as Singelmann (1978) and Gemmel (1982) belong to the much more extensive literature inaugurated by Fisher (1935), Clark (1940) and Fourastie (1949), concerning structural changes in employment by industry, rather than occupation.
The lack of long-term data for all but a handful of developed countries made it necessary to work from both cross-sectional and time-series evidence. The cross-sectional study is based on International Labour Office data taken from censuses and surveys carried out in 58 countries between 1950 and 1980. Only for Great Britain, the United States and Switzerland do we, to my knowledge, have decennial time-series figures dating from around the beginning of the century. Some information is also available for France and Japan, but differences in classifications make it hard to use, at least for my purposes here.
In making the cross-sectional study I have used the techniques normally employed in analysing patterns of growth (Kuznets, 1971; Chenery, 1960), except that I have not taken per capita gross
national product as the 'explanatory variable' among indicators of development. The word 'explanatory' needs to be used with care in analyses of this kind, since we only suggest associational-not causal-relationships between variables. Patterns-of-growth analyses set out to discover whether or not there exist regularities in the development process. 'Dependent' variables will probably exert an influence on 'independent' ones. One example of this is the statistical association between per capita income and the share of manufacturing in employment. Although there are reasons to believe that greater proportions of higher as opposed to lower incomes are spent on manufactured than on agricultural goods, yet it is clear that an increase in the manufacturing share in employment raises overall productivity and thus is itself a source of higher incomes. The variable chosen here to represent the level of development is the proportion of the labour force engaged outside agriculture (nf). The dependent variables are those which describe the occupational structure of the labour force, such as the proportion of the labour force engaged in nonmanual occupations (nmt). Here, too, one can envisage causal influences running in either direction, but as this is a well-known problem, I will not go into it further.
Three considerations justify the choice of nf as the independent variable. Firstly, being a labour market variable, it is more homogeneous with dependent variables of the same nature. Secondly, nf is highly correlated with other indicators of development. The ILO (1977) has shown that the proportion of the male labour force in agriculture to total labour force (MLFA) 'correlates very highly . . . with commonly accepted indicators of the level of development' (p. 54). A ranking of 24 world regions according to MLFA has a higher
183

LONG-TERM CHANGES IN THE OCCUPATIONAL STRUCTURE
correlation with a composite 12-indicator rank of development than all other indicators except life expectation at time of birth (see also Horvat, 1974: 392-93). Since I am concerned with both male and female patterns of occupational growth, I have, when necessary, split nmt and other dependent variables according to sex, but left nf undivided as an overall indicator. Thirdly, being a share, nf is a pure number, and so permits more reliable international comparisons than, for instance, per capita gross national product (GNP), which requires translation into a common monetary unit of incomes earned in countries where relative prices and the structure of consumption differ. The choice of the shape of the function representing the association between growth-related variables is a difficult one. The orthodox approach consists, of course, in elaborating a theory before looking too closely at the data, to then utter forth in glorious voice when discovering that 'the empirical analysis confirms the theoretical expectations'. Thus the journals are filled with nicely fitting curves supported by sound theoretical arguments-curves which, however, have the unfortunate habit of starting to change shape and direction soon after publication. To go back to an already familiar example, until some years ago it was customary to fit asymptotically increasing curves to the share of employment in industry as a function of per capita income, but the recent unexpected shift toward de-industrialization has called for cubic-fitting practices. Both were justified by 'preliminary' analyses of a-naturally-purely theoretical kind.
All this may sound much like a preliminary disclaimer for a sizeable amount of ad hoccery to follow. The point, however, is that in this field there are good explanations for why things went the way they did, yet no one could possibly have predicted in advance that other factors, which in reality failed to materialize, would not intervene and radically alter the overall picture, let alone the precise shape of the historically-revealed relationship. It seems perfectly logical to state that a satisfactory explanatory account must constitute a potential prediction, 'in the sense that it could have served to predict the occurrence [of the explanandum] if the information contained in the explanans had been available at a suitable earlier time' (Hempel 1965: 368). But in the social sciences more than
elsewhere, and in patterns-of-growth analysis more than in other fields of economics, the effect of exogenous variables is potentially devastating. The world periodically takes cover as one of its several man-made satellites runs out of power and falls. The scientists who were smart enough to send it up cannot say where it will strike, as this depends on the (exogenous) effect of solar activity on the atmosphere during the fall. Robinson Crusoe's insular economy would have been different had his companion been a McAllister. And the rise of union strength was not an historical necessity or, at least, its timing was not, as can easily be shown by recent attempts to hold it in check-attempts on whose chances of succeeding no one can reasonably advance a prediction.
A level of aggregation for the dependent variable must be chosen. In the first part, we shall look at just three large groups: nonagricultural manual, nonmanual and agricultural workers, both as aggregates and according to sex. Subsequently, nonmanual occupations will be divided into two groups according to level of skill.
To trace a clearly defined and permanent dividing line between manual and nonmanual work is, simply, not possible. As with attempts to define the tertiary sector, to commit oneself to a definition is to sit down and wait to be crucified. As it is a distinction that plays an important role in this analysis, however, some discussion of taxonomy is unavoidable. From some points of view, one definition of manual work that I would be inclined to support is that based on the degree of substitutability of human action by machines. If an activity is so 'physical' and repetitive that an object can perform it without prejudicing quantity and quality of output, then it is manual. Neat as this may sound, it raises more problems than it solves. First, one may ask whether that object must already exist, or whether it must at least be constructable-even if not economically-given the existing state of technical knowledge; or, finally, whether its being conceivable, Jules Verne fashion, is all that is needed. Secondly, whatever the answer to the first question, what is defined as nonmanual today may not be so in the innovative tomorrow. And, thirdly, one would still need a dividing line since it may be possible to mechanize only some tasks within a given occupation: university teachers, for instance, may be replaced
184

EUROPEAN SOCIOLOGICAL REVIEW
by TV sets in some of their activities but not, we hope, in all. And the ceteris paribus clause would be muddled up by quality-and even quantity-of output not lending themselves to objective measurement in some occupations.
We are then left with more standard definitions. Manual activities may be said to be those in which the main task is to handle tools or machines in order to extract from nature, erect, transform, repair, service, clean or pack some kind of physical object or food, or transfer it from one place to another. I am not ashamed to admit that some verbs may be missing here. In order, however, to see where we stand, let us compare this definition with the 1970 British census classification, which lists 220 civil occupations according to various parameters, including ours. The first 114 of these are all classified as manual, and comply with the above definition. The last 47 are all 'nonmanual' and constitute the 'administrators and managers' and 'professional, technical workers and artists' occupational orders XXIV and XXV. Only a handful of these may give rise to minor inconsistencies. One might argue, for instance, that the main activity of sculptors (occupation code 208) and draughtsmen (218) is that of handling tools to transform physical objects. But, then, the same can be said of two much more significant groups, namely typists (141), who use a machine to transform plain paper into typescripts, and office machine operators (140), both belonging to occupational order XXI (clerical workers). Yet I would agree with the census, which classifies them as nonmanual. We are then forced to add another allocative criterion.
There is a difference between performing an activity in an office and doing so 'in the works'. This difference has two basic dimensions. First, the degree of closeness to management. Second, the physical characteristics of the environment, in terms of heavy or dangerous equipment, toxic materials, excessive temperature, dirt. This extra criterion helps us to allocate the remaining 53 occupations, all included in occupational orders XIX (Transport and Communications Workers: 15 codes defined as manual out of 21); XX (Warehousemen etc.: 2 codes, both manual); XXI (Sales Workers: 1 manual out of 8) and XXIII (Service, Sport and Recreation Workers: 14 nonmanual out of 22). Serious uneasiness only
arises when we find 'street vendors and hawkers' (146), 'waiters and waitresses' (160) and 'maids and valets' (164) classified as nonmanual, and 'athletes and sportsmen' (169) and 'hairdressers, manicurists and beauticians' (167) as manual. Borderline occupations, however, will always exist. Unless they are highly significant we may keep in mind Kuhn's warning on the importance of 'peripheral' concepts, but for the moment at least rest content with a statement made by Fisher (1952: 824) in answer to Bauer and Yamey (1951):
if a concept has an identifiable hard core of meaning, we need not be unduly troubled by a certain vagueness and uncertainty about the periphery.
But what precisely is the purpose of searching for this 'core'? Elsewhere (1981) I have argued that the nonmanual/manual divide is relevant to the concept of noncompeting groups. The existence of barriers to entry into most nonmanual jobs, represented mainly by socially, not just technically determined educational requirements, provides for the existence of noncompensating pay differentials between the two groups of occupations. This tends to cumulate into differences in social status and, ultimately, political behaviour.
An analysis of long-term changes in the occupational distribution-to remain accessible to a one-man team-cannot hope to be based on individual countries' original census data. Fortu- nately, the ILO collects these data into manageable tables. These are, necessarily, aggregate. Only in those cases where individual countries seemed to perform quite differently from the computed cross-sectional regularities were national statistical sources explored, in order to account for such differences.
The ILO classification, revised in 1966, has seven major occupational categories. The non- manual group has been taken here as consisting of groups 0/1 to 4. The remaining groups are farm workers, including hunters and fishermen, on one side (group 6), and service (5), transport equipment operators and production workers and labourers (7/8/9) on the other. One or two sales occupations (group 4) it would probably be better to consider manual, while quite a few more service ones are nonmanual. The 1966 revision has taken care of many of the latter, by transferring them to one of the first four groups. However, nonmanuals are
185

LONG-TERM CHANGES IN THE OCCUPATIONAL STRUCTURE
probably still underestimated by the criterion adopted.
A few more words of introduction are needed, on the choice of variables and on data comparability. The variable which is to form tie basis of the first part of the analysis is nmt, the proportion of nonmanuals in the total labour force, excluding armed forces and unreported occupa- tions. The proportion of nonmanuals in the nonfarm labour force will derive from the former as a useful, but secondary, variable. The reason for this choice is as follows.
If the agricultural sector were assumed to be separate from the nonfarm sector, from both the economic and social viewpoints, the agricultural being a mere releaser of commodities and resources for the consumption and development needs of the nonagricultural, and the latter entertaining few or no relationships with the former, then changes in the proportions of the nonfarm labour force working in certain occupa- tions or industries would deserve first-order treatment in the study of structural change. Development would, in this case, depend on the rate at which the transfer can be effected, but the actual forms development takes would be revealed by events within the modern, nonfarm sector.
For many reasons this is obviously not the case. For our purposes, two of these reasons stand out. First, in the early stages of the development of today's advanced countries, notably England, agriculture and industry entertained a symbiotic- osmotic relationship for a considerable length of time. This meant that in most areas of the country the tertiary sector 'served' both industry and agriculture, that is artisans, farmers and agricul- tural labourers alike; the implication is that the secondary and tertiary complex could not be considered in isolation.
In today's less developed countries (LDCs) the development process is of a different nature. As industrialization now tends to coincide with factory-creation and imports of technology from abroad, there may be a case, in particular when comparing countries at different levels of develop- ment, for analysing their industrial and occupa- tional labour force structure within their growing modern sectors, on the assumption that it is from those sectors that development springs, and that it is on events in those sectors that the nature of the
development process depends. In particular, nonmanual work in agriculture being negligible, the study of changes in such work would seem to concern mainly the nonfarm sector.
In some cases this might represent a legitimate procedure. There is, however, a second reason why, even in such cases, it would not be suited to our kind of analysis. LDCs not only import modern industrial technology from abroad. They also tend to imitate service patterns typical of the more advanced economies, sometimes for reasons which are less economic than political. Singel- mann's (1978) distinction between distributive, producer, social and personal services may be of use here. While producer services tend to specialize in catering for the advanced capitalist sector, the other three service the whole economy and have always done so. The often imitative extension of health and educational facilities to rural areas of LDCs has meant that a much larger proportion of the nonmanual labour force than in the past is now employed in social services for the rural population. Nonmanuals may not work in agriculture, but many of them may work for farmers. To attempt to evaluate changes in this kind of employment without taking the farm sector into account is to distort actual develop- ments and their causes, for the resulting picture of 'premature bureaucratization' or 'tertiarization' would be quite inexplicable.
Comparability of census classifications across countries and over time is, of course, a problem, and one whose seriousness increases with the level of disaggregation. While it may be clear to all, for instance, that a certain worker's activity is nonmanual, that activity may include tasks typical, say, of both administrative and professional functions, and different censuses may, by applying different weighting criteria, classify that worker in different groups. According to a United Nations study (UN, 1968: 69):
Comparative international studies in this field are severely handicapped by differences in the forms of occupational classifications used in national censuses and in the kind of jobs subsumed under the major group headings.
Comparability over time in the same country is clearly not to be taken for granted. Most statistical offices alter their classificatory systems frequently.
186

EUROPEAN SOCIOLOGICAL REVIEW
This is often justified as statisticians achieve greater refinement, or alter their perception of society in response to structural changes. In other cases changes are the unfortunate result of a juxtaposition of objectives: a case in point is offered by Thorner's (1956) article on 'India's Agrarian Revolution By Census Redefinition'.
One other major issue is the traditional undercounting of women in several countries (Beneria, 1981). To give just one example, Iran has a much higher nonfarm percentage than Turkey, simply because very few of the unpaid female family helpers have recorded themselves as such in Iran's agricultural sector (UN 1968: 76). In various countries large numbers of women appear and disappear from one census to the next. The degree of underestimation is not consistent across countries or even within countries over time (Dixon, 1982: 540). And the problem is by no means confined to LDCs (see, for France, Przeworski, Rubin and Underhill, 1980: 730; and, for Switzerland, the introductory notes to the 1920 Census, volume 7: 99).
These difficulties should be kept in mind when it comes to interpreting the results, but should not discourage us altogether. As we shall see, the regularities found are impressive as long as sufficiently aggregate categories are used. By a sort of inverse reasoning we shall argue that if countries at such different levels of development and using the most variegated classificatory systems exhibit such close conformity to a general 'rule', differences in classifications, however large, are not sufficient to obscure the aggregate pattern. The wider scatters resulting from the use of more refined occupational categories would, on the other hand, require more detailed analysis of the rationale behind definitions and classifications.
THE NONMANUAL SHARE IN ECONOMIC DEVELOPMENT
The variables taken account of in the analysis are the following: LF: labour force. NFA: absolute number of nonagricultural
members of LF. NMTA: absolute number of nonmanual members
of LF, i.e. professional and technical, adminis- trative and managerial, clerical and sales workers.
NMDA: as NMTA, excluding sales workers. MA: manual members of NFA, i.e. production,
including craft workers, transport equipment operators and service workers.
nf: NFA/LF = nonfarm proportion of the labour force.
nmt: NMTA/LF = nonmanual proportion of the labour force.
nm: NMTA/NFA = nonmanual proportion of the nonfarm labour force.
mnf: MA/LF = manual, nonfarm proportion of the labour force.
nmd: NMDA/LF = nonmanual, excluding sales, proportion of LF.
The following relationships hold:
nmt = (nf)(nm) (1) which is obvious, and:
mnf = nf-nmt (2)
as it is assumed that no nonmanuals work in agriculture.
The first task is to fit a cross-section curve through points representing pairs of nmt and nf values, one (or sometimes more, as we shall see) for each country in the sample.
Given the data, the chosen shape is that of a cubic equation:
nmt = a + bnf + cnf2 + dnP (3) ac0 b,d>0 c<0
which implies, because of (2) above: mnf = - a + (1-b)nf- cnf2-dnf3
and, because of (1): nm= b + cnf + dnf2 + a/nf
(4)
(5) Let us analyse the implications of a cubic-
shaped relationship such as (3) between nmt and nf. Nonmanual workers, expressed as a fraction of the total labour force, are assumed to increase continuously, first at a decreasing and later at an increasing rate relative to the nonfarm fraction of the labour force. The curve is, in other words, assumed to exhibit a flex-point within the relevant range. As shown by (4), from this assumption it follows that nonfarm manual workers, also expressed as a fraction of the total labour force, increase first at an increasing, then at a decreasing rate. An additional assumption concerning this variable is that it reaches a maximum within the
187

LONG-TERM CHANGES IN THE OCCUPATIONAL STRUCTURE
relevant range. It also follows from (5) that nonmanual workers, this time expressed as a fraction of the nonfarm labour force, are assumed to drop to a minimum, and then start increasing. All these assumptions derive from a close look at the data but, all the same, require a thorough explanation.
Underdeveloped countries, by definition, have large agricultural sectors. If and when a development process gets under way, this normally entails (a) a movement of workers away from agriculture and (b) an increase in the proportion of new labour force entrants flowing directly into the nonfarm sector, instead of passing through agriculture. Both (a) and (b) increase nf.
In countries at very low levels of development (let us say, for nf between 0.05 and 0.35) the rate of population increase is rather high and often responds positively and quickly to the first symptoms of growth. The expanding demand for nonfarm workers is largely met by the new entrants, migration from rural areas being offset by demographic changes. Hence the typical pattern of an increasing absolute but decreasing relative number of agricultural workers in the first stages of development. We know from Kuznets (1982, Tables 4.1 and 4.2), but also from ILO (1977: 63), that the LDCs with very low nf experienced lower declines in the agricultural labour share (1-nf) over the period 1950-70, as compared to those whose nf was larger (around 50 to 60 per cent) (see also Horvat 1974 and, for a critique, Wright 1979). At still higher nf ratios this kind of structural change slows down again. Of the two slower declines in 1-nf registered, respectively, at very high and very low nf ratios, it is the latter which really calls for explanation, the former being an obvious reflection of the increasing difficulties encountered in subtracting yet more manpower from an already depleted sector.
Kuznets (1982: 49-50) argues that: the economic and social characteristics of less developed market economies at high levels [of 1-nf] were such as to make it difficult to attain a high growth rate in per capita or per worker product, and the latter being the consequence, it also impeded a substantial decline in the share of labour in agriculture. As an explanation this is somewhat tautological:
it is difficult, for those countries, to attain high
growth rates-i.e. to develop rapidly hence they do not register a sizeable reduction in the agricultural labour share-i.e. rapid development. (Inci- dentally, a better treatment of this point may be found in Kuznets 1959: 59-60). We may try to enrich its flavour with arguments bearing a close relevance to the present discussion.
Proto-industrialization, namely the permeation of a traditionally organized society by industry (Mendels, 1972: 241) manned first by part-time farmers and, subsequently, by full-time artisans, represented a feasible path to pervasive structural change as long as no large-scale industry existed elsewhere. Throughout the eighteenth century and for a large part of the nineteenth, England was, as it were, competing only or mostly with herself. This accounted for the fact that a very large proportion of her labour force was channelled into the nonfarm sector over a relatively long time span and that manufacturing units were comparatively large in number and small in size. This produced very high nf values but within a continuous trend, with no notably sudden spurts. Such a slow change to fully fledged de-agriculturalization of the labour force became hard to imitate-even given impenetrable trade barriers-once part of the world had developed. Once a critical level of nf had been reached, the only alternatives open to late-comers were to reduce that ratio even further and faster, or not to develop at all: for now large manufacturing units were needed in order to promote exports to, and/or substitute imports from, industrially developed countries. As a step on the road to development, extensive proto-industria- lization became less and less necessary and sometimes even harmful. All successful twentieth century experiences have thus registered at least one relatively concentrated episode of very rapid decrease 1-nf, as ex-farmers and new entrants flocked to the assembly lines. In other words, the typical pattern became one of initially slow transformation, followed by rapid structural change if and as soon as self-reinforcing, factory-based industrialization got under way.
It is crucial to note that except in the case of proto-industrialization the absorption of consider- able numbers of agricultural workers and/or labour force entrants into the nonfarm sector was historically possible only when and where an industrial sector based on the factory system had
188

EUROPEAN SOCIOLOGICAL REVIEW
come to the fore. This is because only such a system could provide enough jobs which: (i) produced commodities whose share in total consumption was on the rise; (ii) entailed an increase in average product per worker; and (iii) matched the available labour supply. The last of these requirements is of special interest in this context. The vast majority of new labour force entrants, not to speak of rural migrant workers, are typically uneducated in situations of underdevelop- ment (see Schultz, 1963: 67). The key to develop- ment consisted precisely in finding productive tasks for what labour supply was available: the existing mass of unskilled and uneducated workers had to be found prevailingly manual, unskilled jobs carrying enough productivity to foster accumulation.
Of the workers leaving jobs to enter the industrial sector not all are migrant farmers or agricultural labourers. A number of them come from marginal areas of the nonfarm sector, mainly self-employed and unpaid family workers turned wage-earners. These marginal self-employed workers belong to two groups. One is made up of traditional service labour, mainly manual, such as cart-pushers, shoe-shiners, porters and so on. The other, classified by censuses under sales workers, consists of petty traders, hawkers, lunch-counter operators and the like.
For their part, the new industries do not create manual jobs only, but also a number of nonmanual ones; this both directly and indirectly via the expansion of'producer services' (Greenfield, 1976). And the increase in per capita incomes is also reflected in a growing, less traditional, service sector, and in slowly expanding central and local bureaucracies.
The net effect of these changes in the first stages of industrial development is, however, dominated by the increase in nonfarm manual workers. It is on their shoulders that this stage of development process rests, and only thanks to the surplus created by manual workers in manufacturing is future growth possible. This phase, in which workers are pushed and/or pulled into the factories, is so crucial that none of today's advanced countries have avoided it, except only where (as in Australia and New Zealand) abundant fertile land, and the exclusion of poor migrant labour, made possible productivity increases in
agriculture comparable to those normally attain- able only in the secondary sector (for early data, see Kuznets, 1959: 55).
Thus the previously small nonfarm sector, where the number of nonmanual workers of all kinds was, relatively speaking, large, is transformed utterly by the incoming waves of the manual working class. Nonmanuals as a fraction of nonfarm workers decrease, not because of a fall in their absolute numbers-in relation to the total labour force they actually increase-but because the rising industrial economy is mainly a manual affair. Some nonfarm workers previously classified as nonmanual, especially in trading occupations, are absorbed into manual jobs. But the effect of this on absolute figures is more than compensated for by the number of nonmanual opportunities being created in the secondary and tertiary sectors.
The first phase of economic development, in terms of occupational distribution, is thus that in which both nmt and mnf increase, the former at a decreasing, the latter at an increasing rate relative to nf. If, as has often been said, 'stages of growth' must have clearly defined beginnings and ends, one could take the initial spur in nf as the beginning, and the flex-point in nmt as the end of the first stage. Figure 1 illustrates this.
0 A nf
FIGURE 1 Patterns-of-growth Analysis of the Occupational Structure
Key: nf = nonfarm workers; nmt = nonmanual workers; mnf = nonfarm manual workers; all expressed as a fraction of all workers. nm = nonmanual workers as a fraction of nonfarm workers.
189
LONG-TERM CHANGES IN THE OCCUPATIONAL STRUCTURE
In the square of side equal to unity the horizontal side measures nf, and the vertical one nmt, mnf or nm, starting from 0. The two curves nmt and mnf represent relationships (3) and (4). Let us take any value of nf, such as OA (in this example, its value at the nmt and mnf flex-points). Drawing a vertical line from A to meet the diagonal at D, AB represents the proportion of nonmanuals in the labour force, BD=AC is the proportion of nonfarm manuals in the labour force, and DE is the proportion of workers in agriculture. BA/OA, on the other hand, represents nm, or the proportion of nonmanuals in the nonfarm population, whose value decreases until the first derivative of curve nmt coincides with the tangent of the line drawn from it to the origin.
Should we wish to define a second phase, starting from the flex-point, then we could conveniently make it end where mnf reaches its maximum. In the second phase the nonfarm sector continues to expand. Both nonmanuals and nonfarm manuals increase their share of total employment, but the former are now more dynamic than the latter. Demand factors con- nected with the rise in personal incomes and increasingly sophisticated technology are likely to play a prominent role in this phase. By the end of it one of the main functions of industrialization will have been performed. The agricultural labour pool will have been largely depleted as the natural increase in population will sooner or later have proved inadequate to meet manpower requirements in the secondary and tertiary sectors. A manual, agricultural society will have been transformed into a prevailingly manual world based on industry and services. The peak in mnf marks the passage to a third phase, where supply and demand factors interact to produce, for the first time in history, a fall in the share of manual nonagricultural labour in total employment.
A comprehensive analysis of factors operating in the third phase cannot be attempted here. A brief and sketchy account has demand factors in this phase associated with: (a) the ever-increasing complexity of production techniques; (b) organi- zational changes within and between firms; (c) autonomous changes in tastes and Engel's law-type mechanisms; (d) increases in public expenditure in such fields as health and education. Supply factors, on the other hand, operate via changes in pay
differentials brought about by educational expan- sion and increases in manual trade unions' strength, and lead to technical progress induced by manual labour saving; or they may act via pressures aimed at public provision of certain types of jobs, operating through different channels but carrying no less strength than those aimed at public provision of certain types of goods and, especially, services. But let us now go back to actual developments.
Table I summarizes the results of our analysis, in which three techniques have been used. Although, for reasons to be dealt with shortly, time-series analysis is the only reliable test for theories related to development, the dearth of long-run data makes recourse to cross-sections unavoidable. Thus the first technique (equation 1) combines 154 cross-sectional and time-series data relative to four censuses (1950 to 1980, or neighbouring years) and a maximum of 63 countries for which ILO data were available. Only 58 countries are considered as regards occupa- tional distribution by sex (equations 2-4), so the total number of observations was 135 (a list of these is presented in Appendix Table Al). Equations 1 to 4 exhibit a very high degree of association between nmt and nf, with all coefficients highly significant (except for the constant, which was to be expected). This indicates that the functional specification is correct. When the figures are broken down according to sex the coefficient of determination loses only about 10 points in both cases (we shall come back to this later).
As indicated by equation 2, the combined cross-sectional plus time-series observations curve exhibits a flex-point for nf=41 per cent, while the derived mnf curve has a maximum for nf=88.5 per cent. This indicates that when farm workers are reduced to 59 per cent of the labour force, the fraction of nonmanuals starts increasing at an accelerating rate, and that the proportion of nonfarm manuals in the labour force starts decreasing when the farm population is down to 12 per cent of the total. As development pushes nf up from, say, 15 to 95 per cent, nonmanual workers increase from around 6 to around 45 per cent of the total labour force, while as a percentage of the nonfarm LF they first decrease from 43 to 34 per cent, then rise to reach 48 per cent. The important
190

EUROPEAN SOCIOLOGICAL REVIEW
TABLE 1 Coefficients of Equation a + bnf + cnf2 + dnf3 = nmt
Cross-sect. No. of Eq. or time s. obs. Years a b c d flex(a) max(b) R2
1 cs + ts (both sexes]
2 cs + ts lboth sexes]
3 cs + ts [males]
4 cs + ts [females]
5 cs + ts (both sexes]
6 cs + ts [males]
7 cs + ts (females]
8 cs + ts (both sexes]
9 cs + ts [males]
10 cs + ts [females]
11 cs + ts (both sexes]
12 cs + ts Imales]
13 cs + ts [females]
14 ts Italyl
15 ts [South Koreal
16 ts [Taiwanl
17 ts [Japan]
154 1950s- -0-0262 0.693 -1-037 0.873 1980s (-0.94) (3-73) (-2-76) (3-82)
135 1950s- -0-036 0.821 -1-402 1-132 1980s (-1.1) (4.4) (-3.7) (4.9)
135 1950s- -0.0176 0.485 -0.646 0.446 1980s (-0.81) (3-3) (-2-1) (2-4)
135 1950s- -0.0131 0.336 -0-756 0-686 1980s (-0.5) (2.0) (-2.2) (3.3)
43 1960s -0-014 0.678 -1-035 0.840 (-0.4) (2.6) (-1.8) (2.3)
43 1960s -0.016 0.507 -0-737 0.509 (-0.5) (2.2) (-1.5) (1.6)
43 1960s 0-002 0.171 -0-298 0.331 (0.59) (0.68) (-0.55) (0.94)
47 1970s -0.013 0.730 -1.202 0.993 (-0.4) (2.96) (-2.4) (3.2)
47 1970s -0.010 0-486 -0-702 0.502 (-0-3) (2.01) (-1.42) (1.7)
47 1970s 0.003 0.244 -0.500 0.491 (-0.1) (0.86) (-0.86) (1.38)
30 1980s -0.046 0.872 -1-40 1.126 (-0.58) (1.57) (-1.26) (1-72)
30 1980s 0-005 0-219 -0.004 0.041 (0.09) (0.51) (-0.01) (0.08)
30 1980s -0-051 0.653 -1.395 1-085 (-0.72) (1.3) (-1.4) (1.83)
18 1959-76 -4.397 18-823 -26.163 12.395 (-1.62) (1.73) (-1.8) (1.9)
18 1964-81 -1.876 11-864 -22.614 14.558 (-3.25) (3.48) (-3.4) (3.5)
18 1963-80 -3.314 16-174 -24-344 12-241 (-4.8) (5.0) (-4.8) (4.7)
29 1952-80 -1.393 6.917 -9.854 4.915 (-40) (4.67) (-4.76) (5.17)
0.396 0.919 0.91
0-413 0.885 0.92
0.483 (**) 081
0.367 (**) 078
0.411 0-955 0.92
0-483 (**) 0.80
0.300 (**) 0-73
0.403 0-907 0.94
0.466 (**) 0-82
0.339 (**) 0.76
0.414 0.872 0.93
0.033 (**) 083
0.429 (**) 0.84
0.704 0.829 0-99
0.518 0.657 0.95
0.663 0.825 0-91
0.668 0.881 0-99
Notes: (a) Flex is the value of nf at flex-point of curve. (b) Max is the value of nf at the maximum level of mnf = nf-nmt (=manual nonfarm workers as a fraction of the total working population). (**) means that Max cannot be computed from these parameters as the independent variable is split by sex, but the dependent one is not. In the case of equations 3 and 4 Max equals 0-99 for males and 0-66 for females.
Sources and definitions: Equations 1-13: ILO Yearbook of Labour Statistics, various issues. Nonfarm workers are all workers except those employed in agricultural, hunting, fishing and forestry occupations. Nonmanual workers are those in professional and technical, clerical and sales occupations, plus administrators and managers. Unemployed workers, when available, have been excluded. Equation 14: A nnuario Statistico Italiano and A nnuario di Statistiche del Lavoro, various issues. Nonmanuals are dirigenti and impiegati, together with self-employed workers in the tertiary sector.
Equations 15 to 17: National Bureau of Statistics, Korea Statistical Yearbook; Statistical Yearbook of the Republic of China; Japan Statistical Yearbook; various issues. Nonmanuals are professional and technical, clerical and sales workers, and administrators and managers.
191
LONG-TERM CHANGES IN THE OCCUPATIONAL STRUCTURE
point here is the much smaller range of variation in nm (9 points, and only 5 between the two extreme values of nf), relative to nmt (39 points). The occupational distribution of the nonagricultural sector is remarkably stable in cross-sectional views of development. As once observed by Kuznets with reference to tertiary sector employment (1959: 59), countries cannot 'dispense with a sizeable minimum of service sector goods that must be produced at home'. While food and manufactures can be imported, the services of civil servants and professionals, as well as of teachers, technical workers and traders, cannot move across frontiers. Thus, even if that 'sizeable minimum' means only 5 workers out of 100, the former would represent 50 per cent of a nonagricultural labour force of 10. I will return to this point later.
Kuznets' observation pertains to the demand side. However, the presence of a fairly stable fraction of nonmanuals in the nonfarm labour force may be due in part to factors on the supply side. In the same passage Kuznets raises two further points. First,
some of the service sector's miscellaneous activities may be in larger supply in low income countries than in high, e.g. domestic and personal, religious services; and others may be in large supply in high income countries (professional, educational, business services);
and, second:
the pressure of population on land and the surplus labour force in the less developed countries may mean a movement into service activities since some of them demand little capital and yet provide some
modicum of living (peddling, cart transport, personal services of various descriptions) and since the employment of this surplus in the manufacturing sector is inhibited partly by capital scarcity and partly by competition of the manufacturing sector in the more developed countries.
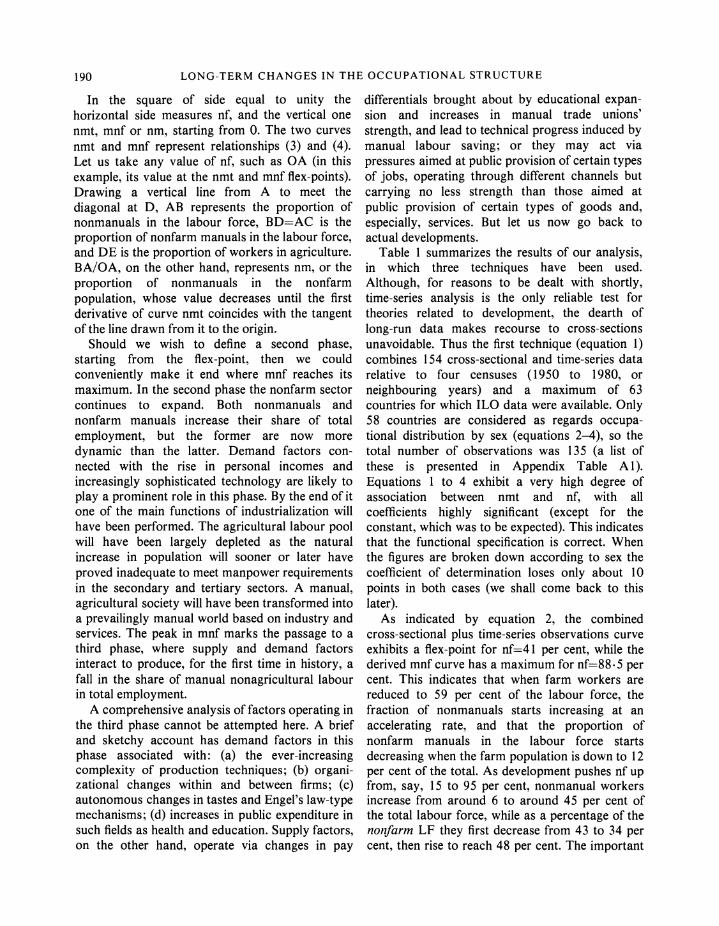
This 'vent for surplus-labour' effect does certainly apply to a number of barely nonmanual sales occupations, all of which are included in the nonmanual total in the data used for Table 1. For this reason Table 2 shows the coefficients of equations 2-4 of Table 1, once all sales workers are excluded from nonmanuals. The results do change considerably. The computed values of nm thus corrected (equal to nmd/nf in equation 18) now increase almost continuously from 18 (for nf = 15 per cent) to 37 per cent (for nf= 95 per cent). This shows that the relative stability we observed in uncorrected nm depended partly on the fact that it included the nonmanual subgroups undergoing the most pervasive changes in the development process.
It may be useful to point out that although the 'immaterial' commodities provided by most nonmanual workers cannot be imported, the workers themselves can. This offers us some useful hints on the ambiguities of sales occupations. Sovereign countries tend to fill most manual jobs, including sales, with nationals, developing the required skills locally. This is not the case with colonies, where professional, technical and clerical jobs have been monopolized by Europeans, and sales jobs by foreign-born 'coloureds', with locals being overwhelmingly and unequivocally manual. In 1946 in what was Southern Rhodesia, for
TABLE 2 Coefficients of the Cross-section Equation nmd = a + b(nf) + c(nfp) + d(n.).(a)
Eq. No. of observations Years a b c d flex(b) R2
18 135 (both sexes) 1960s-1980s -0-0224 0-423 -0-746 0-752 0-331 0.90 (-0.87) (2-42) (-2-08) (3-42)
19 135 (males) 1960s-1980s -00086 0.250 -0.347 0-312 0-371 0.87 (-0.58) (2-49) (-1.69) (2-48)
20 135 (females) 1960s-1980s -0-0138 0.173 -0.399 0.440 0.302 0.83 (-0.725) (1-34) (-1.51) (2.72)
Notes: (a) nmd is nmt excluding sales workers from the numerator. (b) flex is same as in Table 1.
Sources: As in Table 1, equations 2-13.
192

EUROPEAN SOCIOLOGICAL REVIEW
instance, the gainfully occupied European popu- lation was at least 43 per cent nonmanual, and 11 per cent of it held sales jobs, while the Asiatic population was 54 per cent nonmanual, almost 100 per cent of which was in sales occupations. The local black labour force, counted only if working for pay, was at least 92 per cent manual. (All data from the 1946 Census, Tables XVI and ff.). In 1960 in South Africa, which is not a colony but behaves like one, the index of unequal represen- tation of whites i.e. the ratio between their shares in the occupational group and in the employed population-was 2.4 for professional and techni- cal jobs and 2.2 for sales occupations (data from the Statistical Yearbook, 1964). Figures such as these one finds over and over again in African censuses, and they serve to illustrate the role played by the flourishing sales occupations in LDCs. Some surely represent a last resort for redundant workers. The woman selling three beer bottles or a dozen mangoes on a street corner is a notorious, if extreme, example (Rottenberg, 1953: 169). Or they may offer (d la Todaro) an opportunity to linger close to the modern labour market. Others provide a way of making a living where the relatively low income is compensated for by some degree of autonomy, the opportunity to use unpaid family helpers, and easier working conditions than those typical of most farm and factory jobs. Thus, even some of the traditional sales occupations belong to the (lower) middle class, and are rightly included in the nonmanual group. Hence one can quite properly speak of remarkable stability in the occupational compo- sition of the nonagricultural labour force across countries.
The second technique used is standard cross-sectional analysis of censuses taken in the 1960s (eqs. 5-7), 1970s (eqs. 8-10) and 1980s (eqs. 11-13). Some of the coefficients are less significant, but otherwise all that needs to be added to the conclusions presented above is that, as time passes, the cross-section curve tends to shift upwards. This undoubtedly reflects the influence of economic development in some countries on those that come after, a point I shall argue in detail below.
Thirdly we analyse time-series data for four countries which underwent rapid industrialization in the postwar years: Italy (eq. 14), Japan (eq. 15),
Korea (eq. 16) and Taiwan (eq. 17). The hypothesis to be tested here was that, despite initial social and economic differences between these countries, the shape of the basic relationship between structural labour force variables in the course of rapid economic development would be the same in each country. This hypothesis needs some explanation.
If patterns-of-growth analysis is undertaken as a convergence seeking exercise-an attempt to make a rigid scheme fit widely differing historical sequences-it is bound to fail. As Solow once put it, development is not pre-programmed like the life-cycle of the salmon (on this point see also a forefather of patterns-of-growth: Hoffman, 1958: 145). To start with, socio-economic structures do differ across countries for a variety of reasons, so starting points are different. In our terms, countries exhibiting the same nf ratios do present a degree of variation in socioeconomic structure, variation due not only to differences in statistical classifications and social value judgements, but also to the more concrete effects of social preference and policy. It is well known, for instance, that some East Asian countries started developing their education systems rather early-earlier than did today's developed countries at a comparable stage in their development careers. These initial differences do not necessarily have the same, and therefore predictable effects in each case. In some countries they may be compounded by subsequent events, in others they may be minimized; it all depends on a long list of internal socio-political factors and external constraints.
Even more significantly, cross-sectional analysis shows a peculiar, even if sometimes predictable, relationship to time. Structural differences between countries, as analysed in a cross-sectional scatter, are a function of variables which are, in turn, a function of time. But the parameters of the interpolated cross-sectional functions exist in a time-less void and are calculated on the assumption that everything else stays the same, which is, of course, unrealistic. We can specify the present functional relationship between life-expectancy at 50 and the level of development. But for each of today's LDCs the passage of time may be expected to bring about not only the gap-reducing advances already predictable on the basis of medical knowledge and nutritional patterns in the
193
LONG-TERM CHANGES IN THE OCCUPATIONAL STRUCTURE
developed countries, but also at least some of the advances yet to be introduced both in the developed nations and the LDCs themselves. Thus such analysis needs handling with care. If the theoretical arguments for our choice of shape are sound, one would expect the nature of the forces determining the relationships between variables today to remain substantially the same tomorrow, though they may vary in strength, thus accelerating or retarding future developments as compared to past experience. To stick to our example, there are grounds for predicting that life expectancy in the LDCs will be higher than that of today's developed nations, if and when the former reach the latter's level of development. By exploring these reasons we may enrich our analysis, though even without further investigation we have already achieved one useful result: namely, that life expectancy increases predictably in relation to some measure of development. If the theory behind this is correct, the basic relationship will stay the same, though the parameters may vary.
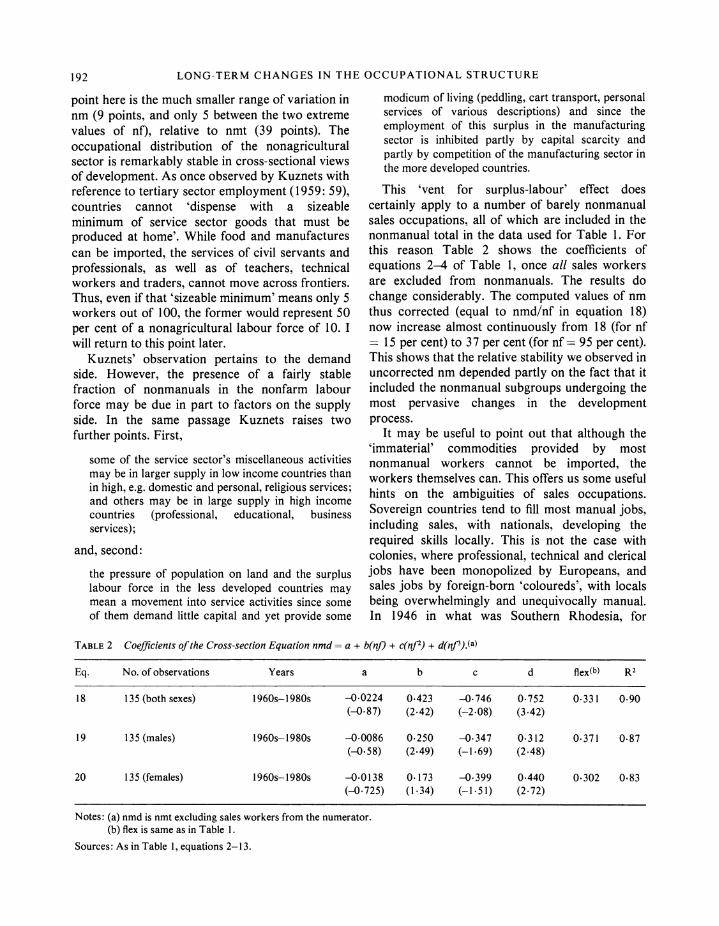
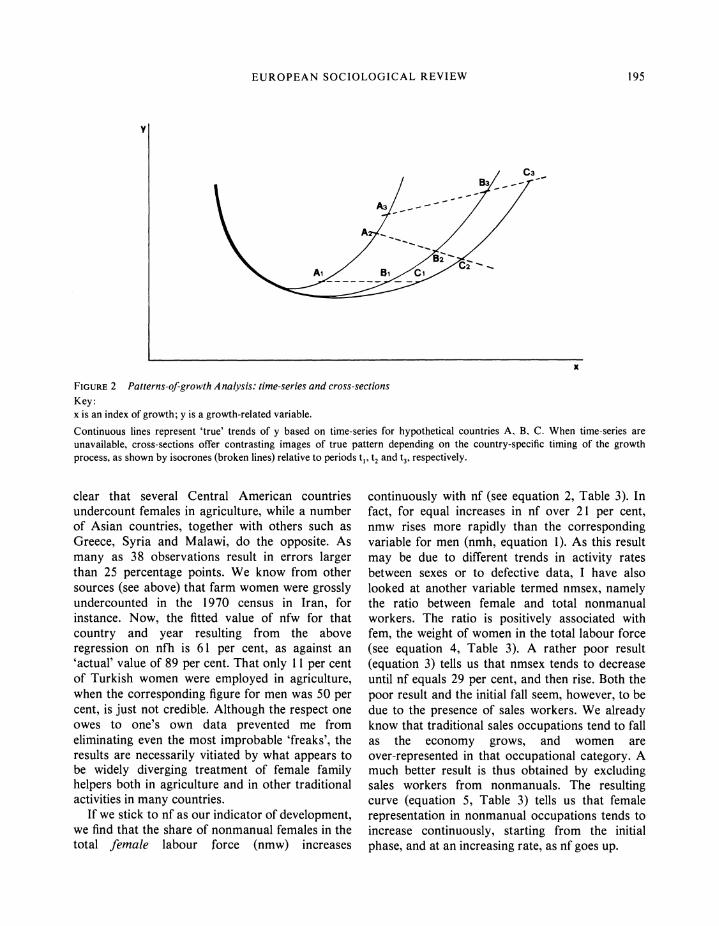
One must keep in mind, however, that it is the shape of the time-series relationship which should be expected to stay the same. Nothing can be said a priori about the shape of the cross-sectional curve. Suppose the expected time-series relation- ship to be parabolic in shape. We then apply least squares to each of the n sets of data (one set for each country) and end up with n parabolas, each exhibiting different parameters. If we then take n observations, one for each country in a specific year, the resulting cross-section relationship may well not be a similar parabola, as Figure 2 clearly shows. (In Figure 2, which relates variable y to an index of development x, letters refer to countries and subscripts to years, while continuous and broken lines represent time-series and cross-section paths respectively; in year 1 the cross-sectional relationship appears as horizontal; what future cross-sections will look like depends on relative growth rates, on the effect that differring rates may have on the coefficients of the parabolas, and so on). Thus similarities in shapes derived from cross-sections and time-series should not be taken for granted: they depend on the particular relationship under examination and on the period chosen. Let us now go back to equations 14-17 in Table 1.
The time periods covered by the equations are relatively short, ranging from 28 years for Japan, to 18 years for the other two Asian countries and Italy. This, coupled with the fact that during the years covered all four countries registered exceptional growth in nf ratios (the lowest compounded rate being 1.4 per cent in Italy in 1959-76, the highest 3.1 per cent in Korea in 1964-81), makes them interesting test cases for the general relationship. The shorter the time a country takes to go from low to high proportions of nf, the more likely it is that the structural pattern of growth will follow the general rule, as the impact of 'disturbing' factors will be lower. Countries such as India, where the demise of agriculture is painfully slow, or some South American countries, where an industrial take-off proper has yet failed to materialize, will probably experience a quite different pattern if and when a modern growth process starts, as the global context within which it will take place is bound to have altered greatly.
Equations 14-17 show that the pattern of change in occupational distribution across time in countries experiencing rapid development is, as expected, similar to that registered over a broad international cross-section. All countries experi- ence a period of less than proportionate increase in nmt relative to nf, and all countries go through clearly defined phases, as above.
Let us now consider the distribution of occupations by sex more closely. Eqs. 3 and 4 in Table 1 refer respectively to a 135-data pooled cross-sectional and time-series regression for males and females. The dependent variables are nonmanual workers of each sex as a fraction of the total labour force, the coefficients of equation 2 being the sum of those of 3 and 4. The vertical difference between the two curves first increases in favour of males, to reach 7.3 points for nf equal to 65 per cent, then falls to about 3 points when the farm labour force is down to 5 per cent. Women seem to enter nonmanual work in increasingly large numbers in the later phases of development.
In interpreting these and other results we must keep in mind that with female work the problems of classification are much more serious. A linear regression between nonfarm females expressed as a fraction of the female labour force (nfw) and the corresponding variable for males (nfh) gives characteristic, though not surprising, results. It is
194
EUROPEAN SOCIOLOGICAL REVIEW
Y
x
FIGURE 2 Patterns-of-growth Analysis: time-series and cross-sections
Key: x is an index of growth; y is a growth-related variable.
Continuous lines represent 'true' trends of y based on time-series for hypothetical countries A, B, C. unavailable, cross-sections offer contrasting images of true pattern depending on the country-specific process, as shown by isocrones (broken lines) relative to periods t1, t2 and t3, respectively.
clear that several Central American countries undercount females in agriculture, while a number of Asian countries, together with others such as Greece, Syria and Malawi, do the opposite. As many as 38 observations result in errors larger than 25 percentage points. We know from other sources (see above) that farm women were grossly undercounted in the 1970 census in Iran, for instance. Now, the fitted value of nfw for that country and year resulting from the above regression on nfh is 61 per cent, as against an 'actual' value of 89 per cent. That only 11 per cent of Turkish women were employed in agriculture, when the corresponding figure for men was 50 per cent, is just not credible. Although the respect one owes to one's own data prevented me from eliminating even the most improbable 'freaks', the results are necessarily vitiated by what appears to be widely diverging treatment of female family helpers both in agriculture and in other traditional activities in many countries.
If we stick to nf as our indicator of development, we find that the share of nonmanual females in the total female labour force (nmw) increases
When time-series are timing of the growth
continuously with nf (see equation 2, Table 3). In fact, for equal increases in nf over 21 per cent, nmw rises more rapidly than the corresponding variable for men (nmh, equation 1). As this result may be due to different trends in activity rates between sexes or to defective data, I have also looked at another variable termed nmsex, namely the ratio between female and total nonmanual workers. The ratio is positively associated with fem, the weight of women in the total labour force (see equation 4, Table 3). A rather poor result (equation 3) tells us that nmsex tends to decrease until nf equals 29 per cent, and then rise. Both the poor result and the initial fall seem, however, to be due to the presence of sales workers. We already know that traditional sales occupations tend to fall as the economy grows, and women are over-represented in that occupational category. A much better result is thus obtained by excluding sales workers from nonmanuals. The resulting curve (equation 5, Table 3) tells us that female representation in nonmanual occupations tends to increase continuously, starting from the initial phase, and at an increasing rate, as nf goes up.
195

LONG-TERM CHANGES IN THE OCCUPATIONAL STRUCTURE
TABLE 3 Equations Relating to Patterns by Sex and to Professional and Technical Males.(a)
R2
I nmh = - 0.098 + 1-208nf - 2.103nf2 + 1.43nf3 (-1.8) (3-7) (-3.5) (4.2)
0.86
2 nmw
3 nmsex
4 nmsex
5 nmsex*
6 profm(nf)
- 0.036 (-0.28)
0-321 (4.8)
0.08 (2.7)
0.193 (12.9)
0.153 (6.18)
+ 1-Ollnf (1-3)
- 1.607nf2 + 1.325nf3 (-1-1) (1-6)
- 0.246nf + 0-422nf2 (-1.0) (2.0)
+ 0.984fem (10.1)
+ 0-33lnf2 (11.9)
- 0.327nf + 0.316nf2 (-3.85) (4.71)
7 profm(lf)
8 profm(lf)
0.005 (1.4)
= - 0.0045 (-2.0)
+ 0.0763nf2 (13.6)
+ 0.180nmt (22.0)
0.66
0.78
nonmanual males over total male labour force; = nonmanual females over total female labour force; = nonmanual females over total nonmanuals;
nmsex* = nonmanual females excluding sales occupations over total nonmanuals excluding sales occupations; fem = females in labour force over total labour force; profm(nf) = male professional and technical workers over male nonfarm workers; profm(lf) = male professional and technical workers over total labour force; nmt and nf as in Table 1.
Note: (a) 135 observations.
Sources: As for Table 1.
But what kind of nonmanual jobs do women fill? And do nonmanual occupations progressively lose ground in terms of job content and skill as women enter in large numbers? Forced by differences in classifications between one country and another to adopt a highly aggregate level of analysis, we are not able to offer a proper answer to this question at this stage. Something, however, can be said.
The increase in nonmanual, clerical and sales jobs held by women which takes place in economic development is certainly impressive. If, however, professional and technical occupations are taken to be the top jobs in the nonmanual group as to skill, working conditions and pay, it can be proved that
top nonmanual jobs held by males tend to expand more than nonmanual occupations as a whole.
Equation 6 shows that professional and technical males as a fraction of all nonfarm males increase more than nf once this passes the 45 per cent level. Both equations 7 and 8 consider professional and technical males as a fraction of the total labour force. Equation 7 shows this fraction to increase continuously, and more than nf, as the latter grows. Equation 8 implies, in turn, that as the nonmanual share of the labour force rises, the ratio of professional and technical males to total nonmanuals also goes up. As women inflate the lower layers, males appear to ascend the
196
Eq.
0-75
0.18
0.44
0.51
0.32
nmh nmw nmsex

EUROPEAN SOCIOLOGICAL REVIEW
ladder. A conclusion which-it must be stressed- can only be tentative at this stage.
THE EXPERIENCE OF INDIVIDUAL COUNTRIES
Early and late-comers We may now look at occupational changes in
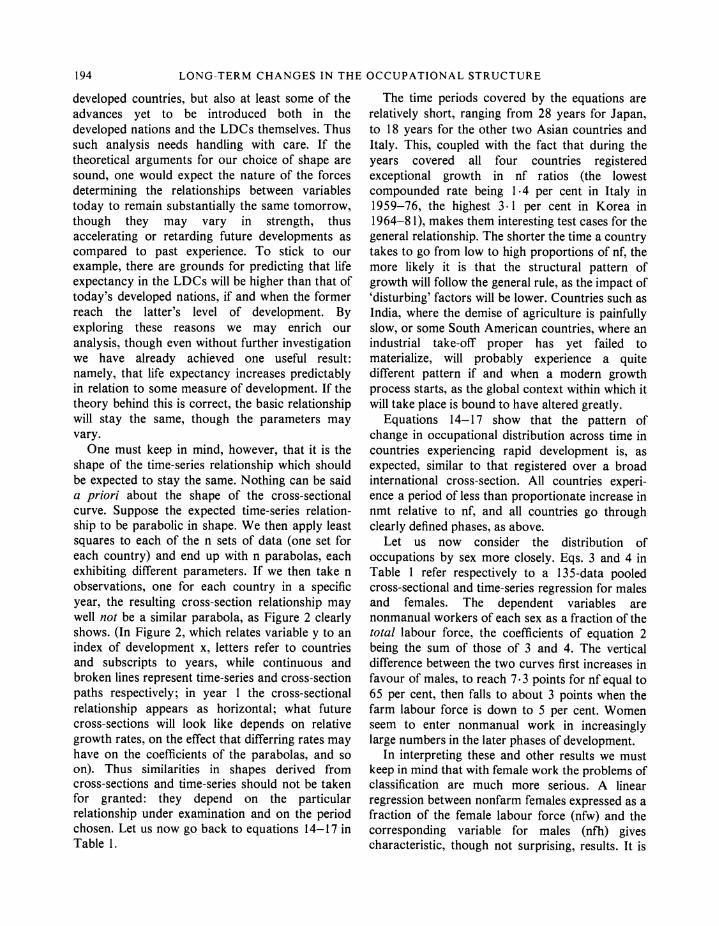
the handful of countries for which long-term data are available. The data are yearly or decennial and cover time-spans ranging from 26 to 120 years. Table 4 and Figure 3, relative to the variables analysed in the previous Section, summarize the results. The data are taken from national censuses or studies deriving from them, such as the well-known work on Britain by Booth (1886). An effort has been made here to translate the categories employed in such material into the categories used in this study.
In some cases this has involved quite arbitrary decisions. For instance, while the categories employed in US censuses lend themselves quite readily to adaptation to a manual/nonmanual distinction, the same does not hold for most other countries. The hardest classificatory problems derive from the mixture of industrial and occupational criteria used in early censuses, and from their tendency to assemble manual and nonmanual workers into a large, catch-all group of self-employed. Early French censuses, for instance, have a category named patrons, which includes manual and nonmanual workers of all sorts together with their unpaid relatives. To give an idea of its size, in 1851 this group accounted for 45.4 per cent of the active population (Cahen, 1953: 281). Only after more detailed data on the industrial distribution of chefs became available, could meaningful disaggregation be attempted. Another French headache comes from the isoles, who may be anything from doctors to maids, although some attempts were made to distribute them between patrons (again) and ouvriers. German data present similar problems, the figures for Beamte and Angestellte being available since 1882, but the self-employed being lumped together regardless of occupation. In such cases I have resorted to counting the self-employed as nonmanual when engaged in commerce and (if figures are available) the liberal professions, and manual in all other cases. In some instances we are
left in doubt as to where self-employed profes- sionals are counted. A cross-check with German data on socio-economic groups in 1961 (Wirt- schaft und Statistik 12/1966: 768-69) tells us that the difference between nonmanuals defined as above and the top four nonfarm socio-economic groups, a difference of 344,000 workers, is 90 per cent accounted for by the liberal and related professions; but these, however, represented only 1 3 per cent of the employed population that year. English data, the earliest available, are vitiated by the industrial-occupational nexus, and by the lack of a clear distinction between manufacturers of and dealers in industrial products, and between management and workers in manufacturing. At any rate, classifications and sources appearing at the end of Table 4 offer the reader an idea of the criteria adopted, together with a better evaluation of the results.
It is worth noting that the Table confirms the long-term development pattern outlined in Section 1. The continuous increase in nmt, together with an initial increase in mnf and subsequent fall after the 1950s (we must make exception for such latecomers to development as Japan, where it kept increasing until the 1970s, and Korea, where it was still increasing in 1981) correspond to our earlier findings. Table 4 and especially Figure 3 show, however, remarkable differences in the routes taken by the various countries to a common 'final' situation where about 90 per cent of the labour force is nonfarm and about 50 per cent of it is nonmanual. We notice that, broadly speaking, the later a country develops, the further to the left we find its curve. An analysis of residuals from equation 2 (Table l)-the cubic relationship between nmt and nf-shows this 'rule' to hold true in many, though not all instances. Appendix Table A2 presents all observations generating positive or negative residuals larger than 2 percentage points. Before leaving the reader to his own interpretation of the Table, a few comments may be in order.
The high negative residual for the United Kingdom will be commented upon below. That for Singapore reflects its nature as an urban enclave. Data for some LDCs such as Iran, but also for a developed country such as Switzerland, suffer from the undercounting of women in agriculture. In countries such as Australia, New Zealand, Canada and Sweden low wage-salary differentials may
197

LONG-TERM CHANGES IN THE OCCUPATIONAL STRUCTURE
TABLE 4 Values of the Nonfarm Share (nf), the Nonmanual Share (nmt), the Nonfarm Manual Share (mnf) and the Nonmanual Share in the Nonfarm Labour Force (nm). Selected Countries, 1851-1981.
nf nmt mnf nm nf nmt mnf nm
0.714 0.126 0-762 0.139 0.802 0.155 0.829 0.167 0.919 0.259 0.940 0.287 0.947 0.319 0-979 0-467 0.986 0.512
0-470 0.130 0.625 0.176 0-691 0.214 0.730 0-249 0-788 0.294 0-826 0-311 0.881 0.367 0-936 0.419 0.969 0.475 0.972 0.509
0.613 0.194 0.644 0.209 0-790 0.305 0.843 0-347 0-897 0-427
0.588 0-623 0.647 0.662 0.660 0-653 0.628 0-512 0.474
0-340 0.449 0-477 0.481 0.494 0.515 0.514 0-517 0.494 0-463
0-419 0-435 0-485 0-496 0.470
0-176 0.182 0-193 0*201 0-281 0.305 0-336 0-477 0.519
0.276 0-282 0.310 0.341 0.373 0.377 0.417 0.447 0-490 0-524
0.316 0.324 0-386 0.411 0.476
Switzerland
1900 0.677 1930 0-783 1950 0.835 1960 0-888 1970 0.923
Germany, FR
1925+ 1939++ 1950 1965 1981
Canada
1941 1951 1971
Japan 1920 1930 1950 1960 1970 1980
Korea
1955 1960 1970 1981
0.695 0-758 0-779 0.891 0.946
0.713 0.807 0.925
0-460 0.510 0-520 0.674 0.808 0.892
0.203 0.333 0.488 0-659
0-123 0.554 0-217 0.566 0-264 0.571 0-292 0.596 0.381 0.542
0.208 0.487 0.249 0.509 0.240 0.539 0.354 0.537 0.486 0.460
0.252 0.461 0.256 0.551 0.443 0.482
0.199 0.261 0-239 0.271 0.236 0.284 0.282 0.392 0.365 0.443 0.459 0.433
0.096 0.107 0-147 0.186 0.202 0.286 0.292 0.367
Sources: Britain. 1851-81: Booth (1886); 1911-71: Bain, Bacon and Pimlott (1972), Table 4.1 and Routh (1980). USA. 1870: Kahl (1959: 67); 1910-70: US Dept. of Commerce (1975), Series 182-232; 1979: StatisticalAbstract 1981.
France. 1926 and 1931: Census 1931; 1954 and 1975: Thevenot (1977), Table 1.
Japan. 1920 and 1930: Cole and Tominaga (1976), Table 6; 1950-80: ILO Yearbooks.
Korea. 1955-70: Korea Statistical Yearbook, various issues; 1981; ILO Yearbook.
Switzerland. Eidgenossische Volkszahlung, various years. Canada. Census of Canada, various years.
Germany. 1925-1965: Statistisches Bundesamt: Bevolkerung und Wirtschaft 1872-1972, Stuttgart: Kohlhammer, 1972; 1981: ILO Yearbook.
Definitions Britain. Booth's classifications (Appendix A) is industrial rather than occupational, in accordance with census practice at the time. The nonmanual group here consists of the following categories: 'management in the building industry', 'industrial service, commercial', 'dealing' and 'public service and professional'. This probably leads us to underestimate nonmanuals in industry and overestimate those in trade. Data for Great Britain are presented to allow comparison with later periods although, ideally, figures
Great Britain 1851 1861 1871 1881 1911 1931 1951 1971 1981
United States
1870 1900 1910 1920 1930 1940 1950 1960 1970 1979
France
1926 1931 1954 1968 1975
0.181 0.277 0.316 0.328 0.412
0.299 0.328 0.308 0.397 0.513
0.353 0.317 0.478
0.432 0.468 0.453 0-418 0-451 0-514
0-472 0.441 0.413 0.443
198

EUROPEAN SOCIOLOGICAL REVIEW
for Ireland should not be considered separately until 1921, until which date the Irish economy was closely integrated with the British. From 1911 onwards data include proprietors (except farm), managers, administrators, professional, technical, clerical and sales occupations. USA. Nonmanuals are professional and technical, clerical and sales occupations. France. Nonmanuals are: (i) Personnel des etablissements (excluding farm) who are chefs or employes (chefs included only if in liberal professions, banks, agences, spectacles and trade); (ii) Isoles in liberal professions, banks and insurance, commerce and amusements.
Japan and Korea. Nonmanuals are professionals, managers, clerical and sales workers. Switzerland. Included in nonmanuals are own-account workers in commerce, general public administration, law, science and art, together with all managers, directors, technical, clerical and sales employees. This leaves out own-account workers in manufacturing while the unknown fraction of them employing other workers should preferably be included. Canada. Nonmanuals are all owners, professionals, managers and sales and clerks occupations. Nonmanual Government employees have been (under-)estimated as representing 46 per cent of Government employment. Germany. The datum (+) for 1925 refers to the Reich, while that (++) for 1939 pertains to Federal Republic borders. Nonmanuals are the self-employed in Handel and Verkehr, plus all Beamte and A ngestellte.
E c
0.05 0.10 0.15 0.20 0.25 0.30 0.35 0.40 0.45 nf
FIGURE 3 The Nonmanual Ratio in Economic Development Key: nf = nonfarm workers as a fraction of all workers; nmt = nonmanual workers as a fraction of all workers; tot = cross-section plus time-series curve for 135 observations relative to 58 countries (equation 2, Table 1).
explain the high positive residuals. Other high residuals, such as those for Egypt and Yugoslavia, are much harder to find reasons for, leaving one to question the reliability of the underlying data.
I will now proceed to offer an explanation for the relative position of different countries in the nmt-nf
space. Let us, first, consider Figure 4, where the two points H and K in the nmt-nf space represent respectively a condition of underdevelopment and one of maturity. Two lines, a and b, represent the paths countries A and B take to go from H to K. These two paths may be thought of as being
199

LONG-TERM CHANGES IN THE OCCUPATIONAL STRUCTURE
intersected by a map of isocrones connecting the points reached by A and B in given years. Let us now take two extreme cases. Vertical isocrones would mean that the two countries are developing simultaneously; i.e. nf is the same in each at any point in time, but country B manages to develop to this extent on a higher proportion of nonmanuals in the labour force than does A. Contrarily, horizontal isocrones would indicate the presence of an earlycomer to development A, and a latecomer B, the former starting off from H earlier (say, at to), and the latter lingering on at H until its own retarded take-off at t1. At t2 both countries will meet at K, indicating that once B starts developing, it will proceed faster than A. Of course, in the horizontal case B also manages to keep the same fraction of nonmanuals as A, out of a lower fraction of secondary and tertiary jobs.
In real life isocrones are never vertical. They are sometimes decreasing but more often increasing rightward, their slope being gentle when countries such as Britain and the United States are compared, steeper when either of these countries is confronted with, say, Japan. This accords with the presence of early and late-comers, and needs explaining. If we take the year 1910, for instance, (19 11 for Britain), we observe that although Britain shows a striking 23 percentage points lead in nf, she is only 4.5 points ahead of the US in the nonmanual ratio. This implies that in that year
nmt
K
H
nf FIGURE 4 Patterns-of-growth Analysis: Early and Late- comers Compared
Key: nf = nonfarm workers over all workers; nmt = nonmanual workers over all workers.
occupational distribution in the nonfarm sector was broadly similar in the two countries, in spite of such marked differences in their nonfarm ratios. How could the much smaller US nonfarm sector employ as many as 31 per cent nonmanuals in 1910, more than Britain's 28 per cent in 1911? Alternatively, how could jobs in the British nonfarm sector in 1911 be only 28 per cent nonmanual, while fifty years later the US would 'need' as many as 45 per cent in the presence of a similar nonfarm ratio? Or, choosing to compare Switzerland with Japan, we observe for 1960 a 21-point lead in nf in favour of Switzerland, whose nonfarm labour force was only 33 per cent nonmanual, as against 42 per cent in Japan. By the time (1980) Japan reaches the nf-value Switzerland had in 1960, the nonmanual ratio will be more than 7 points higher in the former than in the latter country. What the evidence points to is, thus, a 'world' cross-section nmt-nf path being enveloped by individual paths of early-comers to the right and late-comers to its left, all successfully developed countries passing, eventually, through a position such as K.
There are several reasons why the late-comers' curves should be placed above and to the left of those of early-comers. We may explore these reasons in detail by looking first at manufacturing, then at other sectors.
Once late-comers attain a certain level of de-agriculturalization-say nf0-a point reached by early-comers some years earlier, the manufac- turing sectors of early-comers, now at nfl>nf0, are transformed. New technologies have been developed, new industries have emerged. If successful late-comers are to compete in their own, in foreign and perhaps even in early-comers' own markets with early-comers' firms, they will have to borrow early-comers' technology or develop advanced technology and new industries of their own design. As the late-comers' manufacturing sector will normally be smaller in relation to both total product and total employment at nfo than it is in the early-comers at nf1, the adoption of the early-comers' most advanced technology by late-comers' firms could, in theory, set off a trend by which the late-comers would eventually overtake the early-comers in average manufactur- ing efficiency. In practice this is unlikely to happen, as early-comers will not usually transfer their most
200

EUROPEAN SOCIOLOGICAL REVIEW
advanced technology, and will keep the lead in a number of manufacturing industries. But late- comers' industry will normally be, on average, more efficient at nfo than it was in early-comers at the same level of de-agriculturalization. Higher efficiency here means a higher product per worker (Y/L). This may just be due to a better organization of labour. Normally, however, it will also be associated with a higher capital/labour (K/L) ratio, or a lower capital/output (K/Y) ratio, or a combination of both. If K/L is larger in late-comers than in early-comers (at nf0) and K/Y is lower, then Y/L is obviously higher. If both K/L and K/Y are larger in late-comers, as long as the first effect prevails, the effect of the more recent technology is so relatively labour-saving that labour productivity is higher even though capital is, on the whole, less productive. If K/L and K/Y are lower, the influence of the higher labour intensity, as long as the second effect prevails, is offset by capital being more productive, so that product per worker is higher. All this is highly aggregate, and does not readily lend itself to empirical testing to find out which effect is dominant. This is one of the fields where national specificities may prevail, some countries pursuing a less capital intensive path to development, increasing productivity via better organization of labour and more efficient capital, others following alternative routes. At any rate, information regarding the K/Y ratio is unreliable according to Gould, for instance, (1972: 127-8) largely because of the difficulties encountered in trying to measure capital. The available data suggest that the ratio exhibits no marked trend in either direction. If this is true, labour productivity appears to increase thanks to the combined effect of better organization and the adoption of labour-saving technology. Both effects are export- able and exported, via the transfer of embodied technical progress or, more simply, of information. One can expect this transfer to occur from countries at nf1 to countries at nfo, so as to make average manufacturing efficiency of the latter higher than it was in the former at nfo. Now, as there is much evidence to suggest that in manufacturing industries the nonmanual/manual ratio bears a positive association to both productivity (Antonello and Gagliani, 1977: 218-9, on the UK) and the capital/labour ratio (Delehanty, 1968: 156 for the US), the nonmanual
ratio at nfo will also tend to be higher in late-comers than it was in early-comers.
Differences in industrial classifications across countries and a general dearth of reliable long-run data make it hard to offer conclusive evidence on the points just made. We would need data cross-tabulated by industry and occupation at a refined level of disaggregation and relating to different moments in the development of both early-comers and late-comers. Such data are not available to me at this stage. However, Table 5, read in conjunction with Table 4, offers some first clues. Both the United Kingdom and Switzerland were early-comers relative to France (for Switzer- land see Milward and Saul, 1973: 455 and 464). In fact, in the early 1930s the nonmanual ratio is higher in the Swiss than in the British manufacturing sector. I will deal with the British case later. What matters here is that by the time (1968) France has depleted her agricultural sector to a level comparable to that of Switzerland in 1930, all but one of her manufacturing industries are more 'intensive' in nonmanual labour than they were in Switzerland in 1930.
Figure 5 offers further hints. It refers to four countries, ranked from 1 to 4 according to their relative level of retardation, 'caught' in years when their nf ratios were roughly the same: France (1) in 1901, Italy (2) in 1951, Japan (3) in 1950 and Mexico (4) in 1969. Parts (a) and (b) of the Figure show, respectively, their nonfarm and nonmanual ratios in manufacturing at the dates indicated. Although the Figure speaks for itself, more evidence of this kind would be needed to consider the evidence as conclusive.
So far we have been concerned with manufac- turing. But in other industries too the passage of time contributes to a higher nmt in late-comers at nfo, as a result of their importing and imitating needs from early-comers now at nfl. Education is a typical example of this. In early-comers the expansion of education is very slow compared to what happens later in late-comers, which attempt to catch up in a few decades on the growth of centuries. And the unprecedented provision of educational and health facilities for the farm population of developing countries is one of the main causes of the nonmanual fraction of their nonfarm populations being so high in relation to that of comparable periods in early-comers.
201

LONG-TERM CHANGES IN THE OCCUPATIONAL STRUCTURE
TABLE 5 Nonmanual Ratios in Manufacturing(a): France, Switzerland and UK, 1926/30 and 1968/70.
nonmanual ratio per cent employed in industry France Switzerland UK France Switzerland UK
1926 1968 1930 1970 1930 1970 1926 1968 1930 1970 1930 1970 Industry
I Food, drinks, tobacco 2 Textiles 3 Clothing, footwear 4 Leather 5 Wood 6 Paper, rubber(b) 7 Metals and machinery 8 Chemicals 9 Printing
Total
Classification codes:
Industry
1 2 3 4 5 6 7 8 9
17-6 20.0 19.9 7.9 15-9 19.9
10-2 11.5 7.8 8-3 10.3 9-2 5-2 9.8 6.3
11.4 18.6 11.1 10.7 24.6 14.2 18.7 32-1 32-1 14.6 35-6 20.5 10.5 22.1 13.9
France 1926
4B 4F, 4H
4G 41 4J 4D
4K to 4N 4C 4E
1968
49,51 52 53 54 55
56(b) 41 to 45
48 57
28-4 11.2 10.6 8.5 11.8 25.2 6.5 17-0 20.3 9.0 15-3 9.7 13-4 11.3 7.0 14.9 12.6 16-1 4.6 3.5 16.1 11.2 20-4 11.2 4.8 26-6 11.3 234 3.7 2.6 29.2 12.3 28.5 32.6 48-8 44.4 23.2 39.6 5.3 7.9 29.9 18.4 35.3 3-0 4.9 28.2 12.0 26-2 100 100
1930
Ba Bd Bb
144, 1 Bc3
Be-(144+ Bg, B
Bf Bk
Switzerland 1970
20, 21, 22 23 24
45 28 25
-145) 26, 29 h 34 to 36, 381
30,31 27
12.1 10-5 11.2 10-6 17.1 5.9 208 8.7 13-8 6.9 10.8 6.0 0.9 0.6 1.3 0.6 8-4 5.8 4.7 3.5 2.5 2.3 2.8 5.0
38.5 54.9 40-2 55.1 3-1 7.2 32 57 4.1 5.9 5.4 4.8 100 100 100 100
United Kingdom
III XIII XV XIV XVII
481 to 484, 491 VI to XII
V 485,486,489
Notes: (a) Excluding construction materials, petroleum and coal and unspecified. (b) In France (1968): paper only.
Source: France and Switzerland: Census of Population. UK: Historical Record of the Census of Production.
40
32 80.0
0. 1 2 3 4
.0--
rA
(a)
24
16
8
.u
.0
1 2 3 4 0 --
.LO --
0., ,
(b)
FIGURE 5 The Timing of Growth and Nonmanual Ratios in Manufacturing
Key: 1: France 1901; 2: Italy 1951; 3: Japan 1950; 4: Mexico 1969.
(a): nonfarm workers as a fraction of all workers; (b): nonmanual workers as a fraction of all workers (manufacturing sector only).
60.
40
20
202
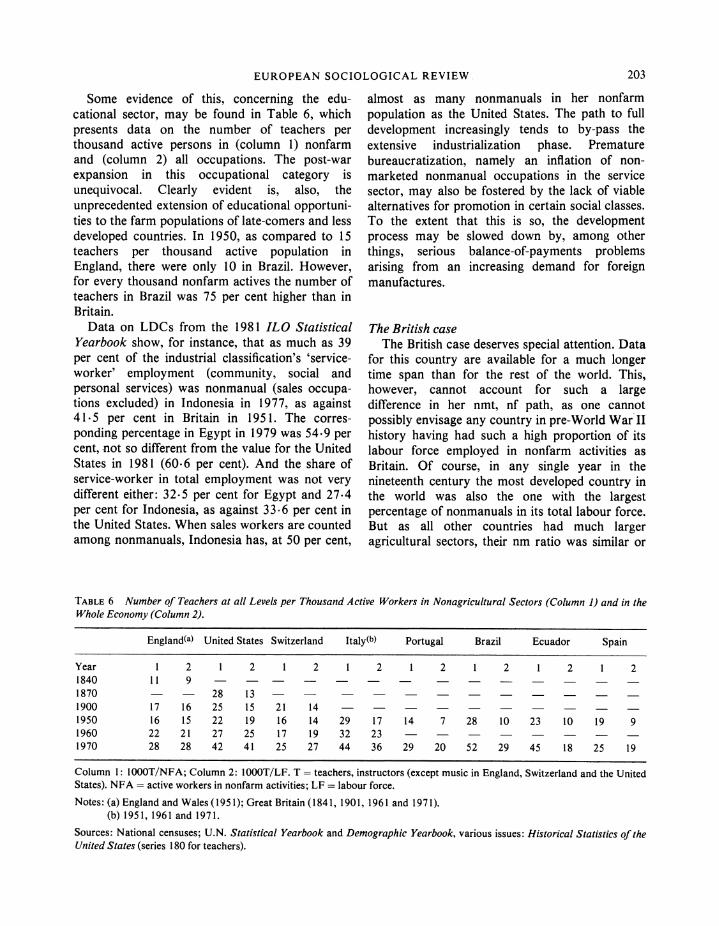
EUROPEAN SOCIOLOGICAL REVIEW
Some evidence of this, concerning the edu- cational sector, may be found in Table 6, which presents data on the number of teachers per thousand active persons in (column 1) nonfarm and (column 2) all occupations. The post-war expansion in this occupational category is unequivocal. Clearly evident is, also, the unprecedented extension of educational opportuni- ties to the farm populations of late-comers and less developed countries. In 1950, as compared to 15 teachers per thousand active population in England, there were only 10 in Brazil. However, for every thousand nonfarm actives the number of teachers in Brazil was 75 per cent higher than in Britain.
Data on LDCs from the 1981 ILO Statistical Yearbook show, for instance, that as much as 39 per cent of the industrial classification's 'service- worker' employment (community, social and personal services) was nonmanual (sales occupa- tions excluded) in Indonesia in 1977, as against 41.5 per cent in Britain in 1951. The corres- ponding percentage in Egypt in 1979 was 54.9 per cent, not so different from the value for the United States in 1981 (60.6 per cent). And the share of service-worker in total employment was not very different either: 32.5 per cent for Egypt and 27-4 per cent for Indonesia, as against 33.6 per cent in the United States. When sales workers are counted among nonmanuals, Indonesia has, at 50 per cent,
almost as many nonmanuals in her nonfarm population as the United States. The path to full development increasingly tends to by-pass the extensive industrialization phase. Premature bureaucratization, namely an inflation of non- marketed nonmanual occupations in the service sector, may also be fostered by the lack of viable alternatives for promotion in certain social classes. To the extent that this is so, the development process may be slowed down by, among other things, serious balance-of-payments problems arising from an increasing demand for foreign manufactures.
The British case The British case deserves special attention. Data
for this country are available for a much longer time span than for the rest of the world. This, however, cannot account for such a large difference in her nmt, nf path, as one cannot possibly envisage any country in pre-World War II history having had such a high proportion of its labour force employed in nonfarm activities as Britain. Of course, in any single year in the nineteenth century the most developed country in the world was also the one with the largest percentage of nonmanuals in its total labour force. But as all other countries had much larger agricultural sectors, their nm ratio was similar or
TABLE 6 Number of Teachers at all Levels per Thousand Active Workers in Nonagricultural Sectors (Column 1) and in the Whole Economy (Column 2).
England(a) United States Switzerland Italy(b) Portugal Brazil Ecuador Spain
Year 1 2 1 2 1 2 1 2 1 2 1 2 1 2 1 2 1840 11 9- 1870 -- 28 13 -- ---- 1900 17 16 25 15 21 14 - -- 1950 16 15 22 19 16 14 29 17 14 7 28 10 23 10 19 9 1960 22 21 27 25 17 19 32 23 - 1970 28 28 42 41 25 27 44 36 29 20 52 29 45 18 25 19
Column 1: IOOOT/NFA; Column 2: 1000T/LF. T = teachers, instructors (except music in England, Switzerland and the United States). NFA = active workers in nonfarm activities; LF = labour force.
Notes: (a) England and Wales (1951); Great Britain (1841, 1901, 1961 and 1971). (b) 1951, 1961 and 1971.
Sources: National censuses; U.N. Statistical Yearbook and Demographic Yearbook, various issues: Historical Statistics of the United States (series 180 for teachers).
203

LONG-TERM CHANGES IN THE OCCUPATIONAL STRUCTURE
even higher than in Britain. The British secondary and tertiary sectors combined, in other words, employed a lower proportion of nonmanuals than the same, considerably smaller sectors in the United States and, in the twentieth century, Japan. What I said earlier explains why, by the time other countries attained the same level of nf, their nmt ratio was higher. But it does not explain why, in the same years, British industry and services had more manual workers than elsewhere. Did it depend on British industry being laggard? The literature on the so-called British climacteric would seem to suggest so. Let us look more closely.
The leading industry of the industrial revolution was textiles. English predominance in that sector was unchallenged. Demand for the new products was high and rising, both at home and abroad, and the comparative advantage enjoyed by England was such that the government soon decided to accelerate the demise of agriculture, and concen- trate on the export of manufactures. The ease with which the first industries attracted unskilled manual labour was so pronounced and both domestic and foreign markets so ready to absorb their products that for the most part production was increased by duplicating existing factories without changing technology. As Cobden remarked in 1851, 'England was unrivalled in those manufacturers which owed their merit to great facilities of production' (quoted in Cameron, 1963: 339). 'The flourishing export industries of the mid-eighteenth century . . . absorbed growing amounts of labour, because the rate of growth of their total production outpaced improvement in their efficiency' (Davis, 1979: 64). In 1844-46, 84 per cent of British exports to North Western Europe, her largest market, consisted of textiles and textile products (Davis, 1979: Appendix Tables). Once a technology capable of mass- producing articles using cheap labour had been successfully developed in just one country, the temptation for that country's producers to keep making profits by using that technology without deepening capital or trying to diversify was too strong. According to many, it was this that kept the structure of British manufacturing unchanged at a time when it would have been wiser to pursue other and newer lines of production. By the end of the century, as Veblen put it, Britain was 'paying the penalty of having been thrown into the lead and
so having shown the way' (quoted in Saville, 1961: 51). 'Her failure was . . . a failure to achieve technological leadership in the new trades, especially in steel, in machinery and, less important, in chemicals' (Lewis, 1957: 582). 'The industries that had been in the van of progress in the 1770s making buttons, locks, nails, firearms, cutlery, tools and the like changed little over the following 80 years... In the European market they had no advantages over similar industries in Saxony, Northern and Eastern France, and the Ruhr, and in America local products were squeezing them out' (Davis, 1979: 64). Growth in the new industries of the second industrial revolution 'took the form of a few companies expanding in size rather than a rapid multiplication of the number of firms' (Aldcroft and Richardson, 1969: 203-4). British producers failed to adjust quickly to this new pattern of production. 'New investment was concentrated too heavily in the basic or old sectors or, alternatively, replaced investment was either inefficient or of a traditional type'. Steel and engineering, the more recent growth industries, were 'already facing strong competitors overseas. And the character of the industrialization process in these (overseas) areas was such that their leading sectors were not textiles but the very industries on which the UK relied at that time, and the new economies were, as a result of more favourable resource endowment and the timing of innovations in steel, better placed than Britain to exploit them' (Aldcroft and Richardson, 1969: 136-7, 116-7; for a different view on Britain's 'failures' see, however, McCloskey, 1970).
The available evidence is, again, inadequate to prove the point, however persuasive it may sound. The view of Britain concentrating on old industries and newcomers like, for instance, France, the United States and, later, Japan, managing to do otherwise cannot be confirmed by data on such aggregate industrial orders as 'chemicals' or 'textiles'. Data like those presented in Table 5 are, first, too recent and, second, too unrefined. Should one rely on them, the conclusion could only be that the stress being put on the British climacteric is excessive. The question whether British manufac- turing industries were less modern than their foreign competitors or not cannot be answered by pointing at the available evidence on their nonmanual ratios or sectoral distribution.
204

EUROPEAN SOCIOLOGICAL REVIEW
At least one of the reasons for the British nonmanual ratio in nonfarm activities being comparatively low can be found elsewhere. Relative to countries like the United States and Japan, Britain's nonfarm workers were more heavily employed in highly manual industries such as mining, manufacturing and personal (especially domestic) services. On the one hand, latecomers tended to transfer employment directly into services, 'jumping' the pervasive industrialization phase (Singelmann, 1978: 109-123). Table 7 shows that both in the 1920s and in the 1950s, mining, manufacturing and construction employed considerably higher fractions of the nonfarm labour force in England and Wales than in the United States and Japan.
On the other hand, never in modern history were conditions for employment of a vast army of domestic workers as favourable as in nineteenth century Britain. The combination of unprecedented wealth enjoyed by landowners and by the growing strata of industrialists, merchants and profes- sionals, and the low incomes of a characteristically large number of female workers eradicated from the countryside provided for domestic employment to represent 21.4 per cent of the nonfarm labour force in 1841, and never less than 10 per cent throughout the whole century. (The figures in Table 7, for the sake of comparison, include all personal service employment and are too recent to render full justice to the magnitude of the phenomenon).
Although the line of causation from industrial to occupational employment is not always to be taken for granted, the large fraction of manual jobs present in nineteenth- and twentieth-century Britain
seems, therefore, to depend on some specific industrial characteristics of her early development.
Changes within the nonmanual group Table 8 shows long-term changes in the internal
composition of the nonmanual group in some developed countries. The question to be answered is whether, as is sometimes stated in the literature, the expansion of clerical and sales jobs has 'diluted' the nonmanual group to the point that 'top' jobs in that group, those clearly superior to manual occupations in terms of working conditions and pay, have turned into a (shrinking) minority.
Although the evidence in this field is never fully satisfactory, due mainly to the limited number of countries where data such as those appearing in the Table were collected for a considerable length of time, what we have tends to suggest that the opposite is true. If professional and technical workers (and, in some cases, managers) are assumed to constitute the highest layer of nonmanuals, this top group is on the increase, both in absolute and in relative terms, everywhere. In one instance (Great Britain) this increase is modest when men and women are taken together. The long- term rule seems to be that the significant rise in the nonmanual ratio derives from (a) the absorption of vast numbers of women into lower nonmanual jobs and (b) the promotion of men from lower to higher nonmanual ranks. This rule does not hold in the post-war experience of France and Sweden, where the proportion of top nonmanual jobs for females has increased faster than for males. But we should note that, first, the value of ratios for males remains considerably higher and, second, differences in classificatory practices between
TABLE 7 Employment in Mining, Manufacturing, Construction and Personal Services as per cent of Nonfarm Employment: England and Wales, United States and Japan (1921 and 1951).
(1) (2) (3) Mining, Manufacturing,
Construction Personal Services Total (1)+(2) 1920 1951 1920 1951 1920 1951
United States 48.2 40.8 8.2 13.9 56.4 54.7 Japan 47.2 44.2 12.6 10.3 59.8 54.5 England and Wales 53.1 51.9 13.9 11.9 67.0 63-8
Source: Singelmann (1978; Appendix Tables).
205

LONG-TERM CHANGES IN THE OCCUPATIONAL STRUCTURE
TABLE 8 Changes in Nonmanual Employment. Indices (Initial Year = 100) of Ratios. (Absolute value of ratio in final year reported in brackets below each index).
Higher nonmanuals All nonmanuals Country and period Other nonmanuals All manuals
M+F M F M+F M F
France, 1954-75 158 158 238 146 135 159 (0-189) (0.320) (0.081) (1.007) (0.735) (1.617)
Great Britain, 1911-66 106 168 53 262 196 429 (0.329) (0-660) (0.081) (0.657) (0.495) (1.05)
Sweden, 1950-75 277 284 306 177 156 188 (0.972) (1.24) (0.779) (0.921) (0.608) (1.71)
USA, 1910-70 155 265 56 219 160 361 (0.439) (0.548) (0.337) (0-978) (0.715) (1.62)
Sources and definitions: France. Higher nonmanuals: professions liberales et cadres superieurs. Excluding farm employment. Thevenot (1977: Table 1). Great Britain. Higher nonmanuals: higher professionals, managers and administrators. Other nonmanuals exclude employers and proprietors, most of which are farmers. Otherwise farm employment is included. Bain, Bacon and Pimlott (1972: Tables 4.1 and 4.3). Sweden. Higher nonmanuals: professional, technical and related. Excluding farm employment. Statistisk Arsbok, various issues.
USA. Higher nonmanuals: professional, technical and kindred. Excluding farm employment. US Dept. of Commerce (1975).
countries, made evident by the high degree of dispersion in the ratios across countries, make aggregate data unsatisfactory and generate the need for further refinement, which cannot be attempted at this stage. We should, at any rate, recollect that results such as these are consistent with those obtained earlier (see Table 3, especially equation 8) using a much larger sample on a cross-section cum time-series basis.
SUMMARY AND CONCLUSION
This article has analysed the way in which the nonmanual share of the labour force changes in the course of economic development. Three 'phases' of development were singled out. In a first phase nonmanuals increase less rapidly than nonagricul- tural workers, both expressed as a fraction of the total labour force. In a second phase the trend is reversed, the latter (the 'nonfarm ratio'), chosen here as an index of development) increasing less rapidly than the former. Finally, the third phase is characterised by a reduction in the share of manual
nonagricultural workers in the total labour force as development proceeds. These findings, obtained in the first instance by pooling cross-sectional and time-series data on 58 countries together, were verified in the development experience of that handful of nations for which satisfactory long run data were available.
The identification of a pattern implies the choice of a functional shape, which must then fit the experience of most, if not all countries. However, the shape of the function is one thing, and its parameters are another. Part of the article was devoted to an explanation of inter-country differences in parameters; the origin of these differences was attributed to the timing of development, with late-comers tending to exhibit both a similar or even higher proportion of nonmanuals in their nonagricultural labour force at most points in time and a higher proportion of nonmanuals in their total labour force at all nonfarm ratios relative to early-comers.
As to the internal structure of nonmanual occupations, the general conclusion that top jobs tend to increase more than middle and low-level
206

EUROPEAN SOCIOLOGICAL REVIEW
ones needs two qualifications. First, it is certainly true for males, less so for females. Second, differences in classification cast several doubts on international comparability.
The approach followed here took nation states as its units of analysis. A wider 'world' approach, if feasible, would add useful information. Some countries seem to 'export' their manual jobs by locating subsidiaries abroad and concentrating managerial and research activities in mother companies at home. It might then be argued that the 'true' nonmanual ratio is, in these countries, lower than the one resulting from the strictly domestic data presented in this study. This argument raises a whole set of questions which, for our purpose, may be reduced to one. What would the long-run 'true' nonmanual ratio be in the sending and in the receiving countries if capital exports were prohibited?
Wage differentials among producers of goods are reflected into price differentials among goods produced. The fact that country A 'chooses' to manufacture product x abroad and subsequently import it and/or sell it to a third country does not necessarily imply that consumers worldwide would have kept demanding x at the price which would have prevailed for it had production remained in A. In other words, x may be 'cheap' and in demand-only because a source of cheap labour was found abroad. The alternatives to this might have been to shift consumption to other, cheaper, goods (or services: cf. Gershuny and Miles, 1983), satisfying the same needs but requiring different techniques; or to alter production technology to keep x cheap by, for instance, substituting expensive domestic manual labour with machines. The probabilities that either of these moves would raise the nonmanual ratio anyway are rather high.
As to the receiving country, foreign direct investment may, or may not, create industrial jobs which would not have been available in its absence. If it does, we cannot exclude a priori that domestic nonmanual ratios will eventually be higher, relative to those which would be associated with self-generated growth. If a global approach is what is needed, it must be truly global, both from a geographical and an analytical viewpoint.
In economic history we find a myriad of cases in which tariffs, capital exports or migrant labour restrictions affected domestic occupational struc-
tures. But, first, the presence of foreign countries and people intensifying or mitigating domestic problems does not make the study of national realities less useful. After all, those problems (say, changing pay differentials) are likely to exist anyway, and autarchic results might turn out to be similar, the foreign influence merely adding to or subtracting from costs. And, second, the absence of unequivocal theoretical analyses of the ultimate, long-run effect of such policies on the international division of labour would make the global approach, at best, premature and, at worst, of questionable value.
ACKNOWLEDGEMENTS The author thanks Wlodimierz Brus, Christopher Lloyd, John Goldthorpe and Wlodimierz Wesolowski for their encourage- ment before and during the writing of this article. He also thanks all those who offered helpful comments and, in particular, Rudolf Braun, Peter Mathias, Ulrich Pfister and Erik Olin Wright.
REFERENCES Aldcroft D H, Richardson H W. (1969): The British Economy
1870-1939, London: Macmillan. Antonello P, Gagliani G. (1977): 'Wages, Salaries and Female
Employment in U.K. Manufacturing', European Economic Review, 9: 209-20.
Bain G S, Bacon R, Pimlott J. (1972): 'The Labour Force', in Halsey A H (ed.): Trends in British Society since 1900, London: Macmillan.
Bairoch P et al. (eds.) (1968): The Working Population and its Structure, Brussels, Universite Libre de Bruxelles.
Bauer P T, Yamey B S. (1951): 'Economic Progress and Occupational Distribution', Economic Journal, 61: 741-55.
Beneria L. (1981): 'Conceptualizing the Labour Force: the Underestimation of Women's Economic Activities', Journal of Development Studies, 17, 3: 10-28.
Booth C. (1886): 'Occupations of the People of the United Kingdom, 1801-81', Journal of the Royal Statistical Society, 49: 314-435.
Cahen L. (1953): 'Evolution de la Population Active en France depuis cent ans d'apres les d6nombrements quinquennaux', Etudes et Conjoncture, 8: 230-88.
Cameron R E. (1963): 'Economic Growth and Stagnation in France, 1815-1914' in Supple B. (ed.): The Experience of Economic Growth, New York: Random House.
Chenery H B. (1960): 'Patterns of Industrial Growth', American Economic Review, 50: 624-54.
Clark C A. (1940): The Conditions of Economic Progress, London: Macmillan.
Cole R E, Tominaga K. (1976): 'Japan's Occupational Structure and its Significance', in Patrick H, Meissner L (eds.): Japanese Industrialization and its Social Conse- quences, University of California Press.
207

LONG-TERM CHANGES IN THE OCCUPATIONAL STRUCTURE
Davis R. (1979): The Industrial Revolution and British Overseas Trade, Leicester: Leicester University Press.
Delehanty G E. (1968): Nonproduction Workers in U.S. Manufacturing, Amsterdam: North Holland.
Dixon R. (1982): 'Women in Agriculture: Counting the Labour Force in Developing Countries', Population and Development Review, 8: 539-66.
Fisher G B. (1935): The Clash of Progress and Security, London: Macmillan.
(1952): 'A Note on Tertiary Production', Economic Journal, 42: 820-34.
Fourastie J. (1949): Le Grand Espoir du XXeme Siecle, Paris: Presses Universitaires de France.
Gagliani G. (1981): 'How Many Working Classes?', American Journal of Sociology, 2: 259-85.
Gemmel N. (1982): 'Economic Development and Structural Change: The Role of the Service Sector', The Journal of Development Studies, 19: 3 7-66.
Gershuny J, Miles I. (1983): The New Service Economy, London: Frances Pinter.
Gould J D. (1972): Economic Growth in History, London: Methuen.
Greenfield H I. (1976): Manpower and the Growth of Producer Services, New York: University of Columbia Press.
Hempel C G. (1965): Aspects of Scientific Explanations, Glencoe: The Free Press.
Hoffman W G. (1958): The Growth of Industrial Economies, Manchester: Manchester University Press.
Horvat B. (1974): 'The Relation between Rate of Growth and Level of Development', Journal of Development Studies, 10: 382-94.
Kahl J A. (1953): 'Educational and Occupational Aspirations of "Common Man" Boys', Harvard Occupational Review, Summer: 186-203.
Kuznets S. (1959): Six Lectures on Economic Growth, Glencoe: The Free Press.
(1971): Economic Growth of Nations; Total Output and Production Structure, Cambridge: Harvard University Press. - (1982): 'The Pattern of Shift of Labour Force from Agriculture, 1950-70', in Gersovitz M, Diaz-Alejandro C F, Ranis G, Rosenzweig M R (eds.): The Theory and Experience of Economic Development, London: Allen and Unwin.
International Labour Office. (1977): Labour Force Estimates and Projections, 1950-20 2nd ed. vol. VI, Methodological Supplement, Geneva: ILO.
Lewis W A. (1957): 'International Competition in Manu- factures', American Economic Review Papers and Proceedings, 47: 578-87.
McCloskey D N. (1970): 'Did Victorian Britain Fail?', Economic History Review, 2nd series, December: 446-59.
Mendels F F. (1972): 'Proto-industrialization: the First Phase of the Industrialization Process', Journal of Economic History, 32: 241-61.
Milward A, Saul S B. (1973): The Economic Development of Continental Europe, 1780-1870, London: Allen & Unwin.
Oberai A S. (1981): Changes in the Structure of Employment with Economic Development, Geneva: ILO.
Przeworski A, Rubin B R, Underhill E. (1980): 'The Evolution of the Class Structure of France 1901-1968', Economic Development and Cultural Change, 28, 4: 725-52.
Rottenberg S. (1953): 'Note on Economic Progress and Occupational Distribution', Review of Economics and Statistics, 35: 168-7.
Routh G. (1980): Occupation and Pay in Great Britain, 1906-1979, London: Macmillan.
Saville J. (1961): 'Some Retarding Factors in the British Economy Before 1914', Yorkshire Bulletin of Economic and Social Research, 13: 51-60.
Schultz T W. ( 1963): The Economic Value of Education, New York: Columbia University Press.
Singelmann J. (1978): From Agriculture to Services; The Transformation of Industrial Employment, Beverly Hills: Sage.
Singelmann J, Browning H L. (1980): 'Industrial Trans- formation and Occupational Change in the U.S., 1960-70', Social Forces, 59: 246-64.
Thevenot L. (1977): Les Categories Sociales en 1975: l'Extension du Salariat', Economie et Statistique, 91: 3-31.
Thorner D. (1956): 'India's Agrarian Revolution by Census Redefinition', The Indian Economic Review, 3, 1: 1-21.
United Nations. (1968): Methods of Analysing Census Data on Economic Activities of the Population, New York: Department of Economic and Social Affairs, Population Studies no. 43.
U.S. Department of Commerce, Bureau of the Census. (1975): Historical Statistics of the United States, Colonial Times to 1970, Washington DC: G.P.O.
Wright E 0. (1979): Class Structure and Income Determination, New York: Academic Press.
208
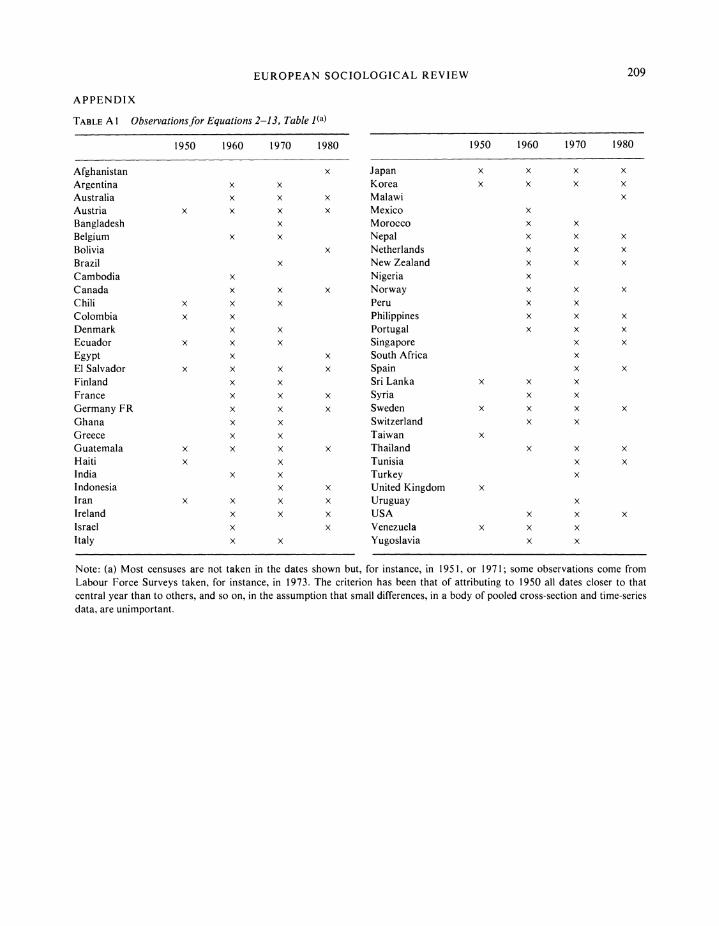
EUROPEAN SOCIOLOGICAL REVIEW
APPENDIX
TABLE AI Observationsfor Equations 2-13, Table 1(a)
1950 1960 1970 1980
Afghanistan x
Argentina x x Australia x x x Austria x x x x
Bangladesh x
Belgium x x Bolivia x Brazil x Cambodia x Canada x x x Chili x x x Colombia x x Denmark x x Ecuador x x x Egypt x x El Salvador x x x x Finland x x France x x x
Germany FR x x x Ghana x x Greece x x Guatemala x x x x Haiti x x India x x Indonesia x x Iran x x x x Ireland x x x Israel x x Italy x x
1950 1960 1970 1980
Japan x x x x Korea x x x x Malawi x Mexico x Morocco x x
Nepal x x x Netherlands x x x New Zealand x x x
Nigeria x
Norway x x x Peru x x
Philippines x x x
Portugal x x x Singapore x x South Africa x
Spain x x Sri Lanka x x x
Syria x x Sweden x x x x Switzerland x x Taiwan x Thailand x x x Tunisia x x Turkey x United Kingdom x Uruguay x USA x x x Venezuela x x x Yugoslavia x x
Note: (a) Most censuses are not taken in the dates shown but, for instance, in 1951, or 1971; some observations come from Labour Force Surveys taken, for instance, in 1973. The criterion has been that of attributing to 1950 all dates closer to that central year than to others, and so on, in the assumption that small differences, in a body of pooled cross-section and time-series data, are unimportant.
209

LONG-TERM CHANGES IN THE OCCUPATIONAL STRUCTURE
TABLE A2 Results of Equation 2, Table 1(a) (percentage points)
negative residuals positive residuals >10 10 to 5 4.99 to 2 2 to 4.99 5 to 10
Singapore 1960+ Austria 1980* Afghanistan 1980* Australia 1970, 1980* Canada 1970 UK 1950 Belgium 1960*, 1970 Argentina 1970+ Canada 1960, 1970 Egypt 1970*
Denmark 1960* Chili 1960 Chili 1950 Israel 1980* Singapore 1980+ Germany FR 1960+ Colombia 1950 Netherlands 1980* Switzerland 1960+ Ghana 1960+ France 1970, 1980 Sweden 1980*
Haiti 1970 Germany FR 1980* U.S.A 1980 Iran 1950, 1960, 1970* Ireland 1970, 1980 Yugoslavia 1970+ Italy 1970* Israel 1960* Netherlands 1960+ Japan 1950, 1960*, 1980* Norway 1960*, 1970* Norway 1980 Portugal 1960, 1970 Peru 1970* Spain 1970, 1980* Philippines 1960, 1980* Sweden 1960* Taiwan 1950
U.S.A. 1970 Venezuela 1950 Yugoslavia 1960+
Note: (a) In order to check whether errors were due to the effect of the chosen index of development, another index was used as the independent variable, namely per capita consumption of commercial energy (E) expressed in tons of coal equivalent (data from UN Handbook of International Trade and Development Statistics, New York 1983, Table 6.9). The following equation I* was thus obtained for 120 observations relative to the 1960s, 1970s and 1980s, as 1950s data were not available. The group of countries was the same as for equation 2, Table 1.
I* nmt= 0.118 + 0125E -0-0174E2+ 0.00085E3 R2=0.83 (0-13) (9.9) (4.8) (3.5)
Consequently, an asterisk (*) denotes residuals whose sign and approximate magnitude are confirmed by equation 1*, and a cross (+) indicates the opposite. For instance, the large negative residual for Austria 1980 is confirmed by 1*, while corresponding to the large negative residual for Singapore 1960 in the present Table a large positive residual derives from I*. Where neither an asterisk nor a cross appear, either absolute residuals from 1* are smaller than 3 percentage points, or the information was not available for that year. Thus the two indicators offer contrasting results for only 7 countries, namely Singapore, Switzerland, Argentina, Ghana, Yugoslavia, West Germany and the Netherlands and, for the last two countries, only for 1960. For Switzerland and Singapore, see text.
AUTHOR'S ADDRESS Giorgio Gagliani, Dipartimento di Economia Politica,
Universita' della Calabria, Rende (CS), Italy. Manuscript received: 20 November, 1984.
210