
Long Term Analysis of Line Arr Field Study -...
20
1 LONG TERM ANALYSIS OF LINE ARRESTER APPLICATION FIELD STUDY Wayne N. Zessin Senior Engineer Reliability Programs John McDaniel Senior Engineer Dist. Reliability ComEd Service Territory – More than 3.7 million customers – 11,400 square miles – 1.4 million distribution poles – Distribution Circuits • 44,000 miles of overhead circuits • 46,000 miles of underground circuits – 5,182 circuits • 4,912 4/12kV Circuits • 270 34kV Circuits – 1,042 substations
Transcript of Long Term Analysis of Line Arr Field Study -...

1
LONG TERM ANALYSISOF LINE ARRESTER
APPLICATION FIELD STUDY
Wayne N. ZessinSenior Engineer
Reliability Programs
John McDanielSenior EngineerDist. Reliability
ComEd Service Territory
– More than 3.7 million customers – 11,400 square miles– 1.4 million distribution poles– Distribution Circuits
• 44,000 miles of overhead circuits
• 46,000 miles of underground circuits
– 5,182 circuits• 4,912 4/12kV Circuits• 270 34kV Circuits
– 1,042 substations

2
Lightning Caused Interruptions
• 10% of system SAIFI in 2007 (IEEE Def)
• 480,000 Customer Interruptions• Historically a significant contributor to
sustained outages

3
IOWA
NW
NE
CENT
WISCONSIN
SW
SE
CN
CS
IND
IAN
A
LAKEMICHIGAN
IOWA
NW
WISCONSIN
CENT
SW
CN
SE
CS
NELAKEMICHIGAN
IND
IAN
A
2006 2005 2004
2003 2002
ComEd Summer Lightning ActivityLAKE
MICHIGAN
WISCONSIN
IND
IAN
A
IOWA CN
SE
SW
CS
CENT
NENW
LakeMichigan
Indiana
Wisconsin
Iowa
SW
NW
NE
CENT
SE
CS
CN
NW
IOWA
NE
CENT
WISCONSIN
SW
IND
IAN
A
SE
LAKEMICHIGAN
CN
CS
Key Points
•Intensity varies by year and by region•Over time, greater in Southern regions
1992 Study
• Software could model various parameters

4
1992 Study
• Software could model various parameters
• Output was predicted flashover rate
1992 Study
• Software could model various parameters
• Output was predicted flashover rate• Assess current standard for lightning
arrester application

5
1992 Study
• Software could model various parameters
• Output was predicted flashover rate• Assess current standard for lightning
arrester application• Recommend changes for improved
performance
1992 Study• Results
– Predicted 70% reduction in flashover rate by reducing arrester spacing to 180 m (600 ft)

6
1992 Study• Results
– Predicted 70% reduction in flashover rate by reducing arrester spacing to 180 m (600 ft)
• Recommendations (New Standard)– New construction
• Arresters every 180 m (600ft)– Existing circuits
• Follow new standard as needed• Bring grounds up to spec
1995 Field Trial
• Objective– Verify predicted performance improvement

7
1995 Field Trial
• Objective– Verify predicted performance improvement
• Methodology– Select 2 groups of circuits– Upgrade 1 group to new standard– 1 group left as a control– Compare performance after some time
period
1995 Field Trial
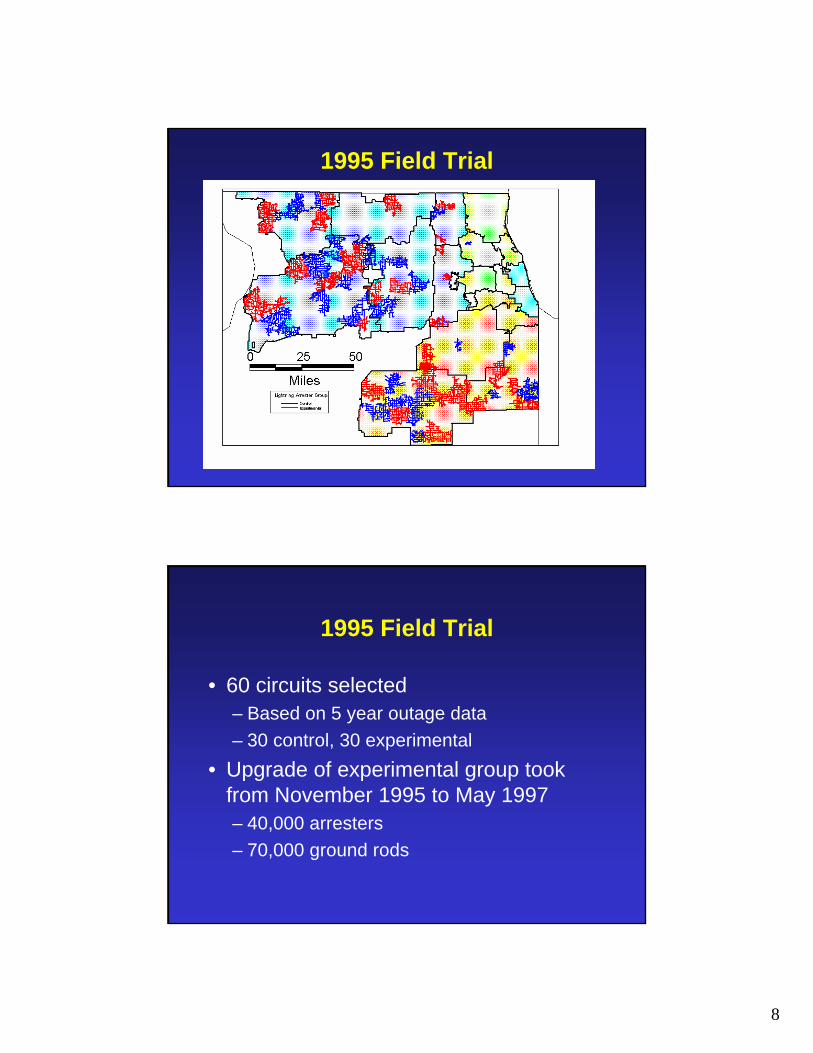
• 60 circuits selected– Based on 5 year outage data– 30 control, 30 experimental
8
1995 Field Trial
1995 Field Trial
• 60 circuits selected– Based on 5 year outage data– 30 control, 30 experimental
• Upgrade of experimental group took from November 1995 to May 1997– 40,000 arresters– 70,000 ground rods

9
1995 Field Trial• After 3 “lightning seasons” compare
performance
1995 Field Trial• After 3 “lightning seasons” compare
performance• ComEd database of outages coded as
lightning– IEEE outages (> 5 minutes)

10
1995 Field Trial• After 3 “lightning seasons” compare
performance• ComEd database of outages coded as
lightning– IEEE outages (> 5 minutes)
• Lightning data obtained using FALLS™software from Vaisala, Inc– 1 kM buffer
1995 Field Trial• After 3 “lightning seasons” compare
performance• ComEd database of outages coded as
lightning– IEEE outages (> 5 minutes)
• Lightning data obtained using FALLS™software from Vaisala, Inc– 1 kM buffer
• Compare lightning timestamp to outages– 3 hour window

11
1995 Field Trial
FEEDER B265
181.9 KM132.2 SQ KM BUFFER
10,534 STROKES
GSD 79.7
(Note: data from9 year study)
0
Kilometers
2 4
1995 Field Trial0.50 0.25
Kilometers

12
1995 Field Trial
• Results
– IEEE paper in 2001 by John McDaniel– Used # interruptions / 100kM / GSD
1995 Field Trial
• Statistical analysis: 16% improvement, 95% confidence
0.30521.8818311.93EXPERAVG
0.45721.27150.714.43CONTROLAVG
INT/100KM/GSDGSDLENGTH# INTER
13
2007 Study Update
• Validate results of earlier study
• 9 Years: 1998 through 2006
• Same methodology
2007 Study Update
• Question: Are the 60 circuits still valid?– Mostly rural– Less change over time

14
2007 Study Update
• Question: Are the 60 circuits still valid?– Mostly rural– Less change over time
• Initial assumption was: Yes
2007 Study Update
• Question: Are the 60 circuits still valid?– Mostly rural– Less change over time
• Initial assumption was: Yes
• Study update was performed

15
2007 Study Update
• Detailed circuit by circuit comparison– 2006 vs. 1997 configuration
2007 Study Update
• Detailed circuit by circuit comparison– 2006 vs. 1997 configuration
• Control circuits– 21 of 30 unchanged

16
2007 Study Update
• Detailed circuit by circuit comparison– 2006 vs. 1997 configuration
• Control circuits– 21 of 30 unchanged
• Experimental circuits– 20 of 30 unchanged
2007 Study Update
• Conclusion
– Assumption was reasonable – but
– Rerun study using the 41 circuits

17
2007 Study Update – 60 Circuits
2007 Study Update – 41 Circuits

18
2007 Study Update – 41 Circuits
• Statistical analysis: 16% improvement, 95% confidence
0.291105.5185.756.2EXPERAVG
0.390104.8148.660.8CONTROLAVG
INT/100KM/GSDGSDLENGTH# INTER
2007 Study Update – 41 Circuits
• 2007 study update results exactly the same as the original study
– 16% improvement, 95% confidence

19
2007 Study Update – 41 Circuits
• Results not as great as prediction (70%)– Calculation actually Flashover rate, not
Outage rate• Reclosers – Not all flashovers are outages
2007 Study Update – 41 Circuits
• Results not as great as prediction (70%)– Calculation actually Flashover rate, not
Outage rate• Reclosers – Not all flashovers are outages
– Model vs. Field Conditions• Arrester spacing in control group• Pole height• BIL

20
LONG TERM ANALYSISOF LINE ARRESTER
APPLICATION FIELD STUDY
Wayne N. ZessinSenior Engineer
Reliability Programs
John McDanielSenior EngineerDist. Reliability
QUESTIONS???


![[Slide] - A Markov Random Field Model for Term Dependencies](https://static.fdocuments.us/doc/165x107/5525f907550346f36e8b4a72/slide-a-markov-random-field-model-for-term-dependencies.jpg)


